digital map library of the canary islands - e … · the quality of these digital documents depends...
TRANSCRIPT

[262]
e-Perimetron, Vol.1, No. 4, Autumn 2006 [262-273] www.e-perimetron.org | ISSN 1790-3769
A. Fernandez-Wyttenbach∗, D. Ballari*, M. Manso*
Digital Map Library of the Canary Islands
Keywords: Cartography; visualization; metadata; internet; history; heritage; catalogue; Web Map
Service. Summary The quality of the Map Libraries is obvious and the expert’s access to the cartographic funds (metadata and images) is a constant aim of the scientific task. However, it is sometimes ardu-ous due to the dispersion of maps in the various museums, libraries and collections. Historians and documentary experts need to access remotely to every existing information, that can be compiled in a single place to facilitate the access and comparison. In the same way, it would be possible to avoid the direct manipulation of some delicate maps. Nowadays, there are tech-nical possibilities allowing the digitization of the information that may be filed in a high qual-ity format. Besides, it is possible its world-wide-web cataloguing according to the standard form ISO19115. The images generated will be visualized by different searching systems, with the accuracy and use limitations decided by the owner of the information. All of them, using a WMS structure (Web Map Service) according to the OGC (Open Geospatial Consortium) Specifications, with a web client and a metadata server included. The purpose of this project is the creation of a Digital Map Library, or just a website that includes an historical maps server from the Canary Islands from different funds. It is possible to interactively visualize all the printed cartography before the 20th century, as well as its metadata information in the Map Li-brary using different search methods. The Canary Islands are a geographical region suitable for carrying out this application, as its border limits are defined by natural elements. In this way, the application facilitates the local study of the geometrical distortions of the border lines by the simultaneous overlap of the historical maps within them, and with the current ones (the warping effects of the Geographic Information).
Introduction
It seems really useful and interesting, to have a tool allowing the remotely access to an existing graphical information repository from an only website. This solution would make easier the in-formation access and the comparison of some documents located in different servers. Addition-ally, that would be really helpful to those institutions in charge of safeguarding the documentary funds, optimizing the staff resources and avoiding the direct manipulation of some maps, specifi-cally those in a precarious conservation condition. However, no museums or map library known have taken advantage of the Information Society for the citizens to access to the funds through the creation of cataloguing, searching and visualization Web tools in this particular field. The INSPIRE Proposal (URL 1) may turn out to be a European guideline by the end of 2006. It is conformant to other initiatives within the framework of the Information Society, setting the trend towards favouring access to public information through the Internet. Taking advantage of this de-velopment, the technical advances in the field of scanners and the access to distributed informa-tion, we may assert that digital mapping from the digitization of document collection may be made accessible in the Internet. The quality of these digital documents depends on the capabilities of the scanner used. Tasks similar to the ones that could be carried out with the original docu-ments could be undertaken. The use of and access to this information would be restricted by pro- ∗ “Mercator Working Group”, Higher School of Surveying, Geodesy and Cartography Engineers, Universidad Politécnica de Madrid (UPM), Spain. [[email protected]; [email protected]; [email protected]]

[263]
priety rights and constraints. The cartographic funds used in this application, corresponds to more than 200 maps, sketch and printed plans of the Canary Islands (Spain), before the 20th Century. In this way, modern topographic maps as a cartographic base have been included. The following institutions are all the documentary funds where these maps came from: Historical Cartography:
• Historical Map Funds of the Canary Islands, edited by the Engineers Corps of the Spanish Army. Spanish Army Record Office (URL 2).
• Historical Map Funds of the Canary Islands from Spanish National Mapping Agency (URL 3).
Modern Cartography: • Respective sheets of the modern Spanish National Map 1:25.000 from the Canary
Islands, Spanish National Mapping Agency. • Respective sheets of the modern 1:50.000 mapping set of the Spanish Army Geo-
graphical Service (URL 4). These historical funds do not only include topographic maps but also several plans from ancient fortresses and headquarters were considered. However, all of them are represented in large scales, and only a few maps represent the whole Canary Islands. This lack of small scales is the reason of why the inclusion of the Historical Maps from the Spanish National Mapping Agency Historical Funds loaded in the Virtual Server has been considered. The three main tasks developed in this project are:
• Scanning and georeferencing of the historical maps and the cartographic base • Creation and cataloguing of the document metadata • Configuration of the Map Server and the Web interface
Lastly, some final remarks were developed.
Obtaining the cartographic information
Digitization or scanning of the cartographic base In order to carry out georeferencing of the historical maps, the cartographic base was previously prepared. So, the current sheets from the Spanish National Map at a 1:25.000 scale according to the Canary Island region were used. Those maps were scanned with a 300 dpi resolution and stored in a .tiff extension. This resolution allows observe a good details level of the documents. The marginal areas were cut for decreasing the information volume.
Digitization or scanning of the historical maps The wide format “Océ – CS4035” scanner was considered. After the calibration of the internal cameras of the scanner, and considering the results of the proofs obtained, the most advisable resolution decided was 200 dpi with 24 bytes of colour. The reasons are as follows:
• The file size increases by a 150% in 300 dpi conditions. This increase is not explic-itly necessary.
• The historical maps have less detail level than the current cartographic sets, so it is possible to simplify the working resolution.
In the last phase of the digitization process, the horizontal alignment of each image produced was rectified.

[264]
The precarious conditions of some maps do not warrant their mechanical manipulation through a scanner because of the risk of important deterioration. The main reason of this situation was the old broken or stretched parts during the folding process and other accidents. Those documents are strengthened with a stick band whose chemical components had further deteriorated. Some pieces may have been posted in the scanner glass headers during the process, with the subsequent break-ing of the map. In order to avoid this situation and to protect the thinnest maps, a plastic protec-tion surface was used. This was an acceptable solution in spite of the fact that in some cases the plastic protection would cause optical reflection, which could hide some document information. So further processing was needed. Another disadvantage that was considered during the optical exploration process is the large size of some maps (5 documents) that could not be scanned be-cause the scanner was not wide enough (1,20m). Therefore consideration was given to making photographs of the maps for their inclusion. This solution was not carried out after all due to the lack of the appropriated instrumentation. The whole historical images provided by the Spanish National Mapping Agency through its Website server, are digitized with a 50 dpi resolution in a jpeg format. This did not provide enough quality for the understanding of maps. However, they were included because the majority of the maps contain the seven Canary Islands in a very small scale (unlike the rest of the historical map from the other institution). Later, this set will be ho-mogenized with the same features of the whole of the maps.
Image processing As it has been previously remarked, the precarious conditions of some maps make necessary to use plastic covers that would avoid accidents during the scanning. It goes without saying that, there are plastic ledges in the image that do not belong to the original document and the image had to be processed and refined. Some maps were taken apart in pieces and they had to be recon-structed. It is interesting to point out that further image processing has been avoided with the aim of not unintentionally hiding or deleting some information from the original document. Finally, all images were compressed with a *.ecw format (UPL5), which bears high compression ratios and good performance in the information access; making its Internet publication easier.
Figure 1. Image Processing: cutting off the plastic ledges in some maps.

[265]
Figure 2. Image Processing: reconstruction of some maps.
Cartographic georeferencing
Cartographic base georeferencing The cartographic set used is the 1:50.000 scale from the Spanish Army Geographical Service, as well as the modern Spanish National Map 1:25.000 from the Spanish National Mapping Agency. The election of different resources and scales is aimed to use different cartographic sets in the car-tographic base visualization, according to the zoom level (scale) used in each moment. Carto-graphic base georeferencing has been done with the Global Mapper software (URL 6), starting from an affine transformation of the pixel coordinate and its corresponding counterpart in the grid. Although, this is a 3 control point’s transformation, 6 control points accordingly delivered throughout the document were considered to obtain smoother results. Previously, the Coordinate Reference System (CRS) was defined, corresponding with the official system for the Canary Islands:
• Datum Pico de las Nieves • Projection UTM; zone 28 North • Ellipsoid: International 1924 (Hayford)
The rectified image was stored directly in .ecw format. Besides, the georeference metadata were included in the file header. A mosaic has been done with the whole maps, merging all documents in a single image.
Figure 3. Mosaic of the cartographic base Historical maps georeferencing.

[266]
The georeference has been done with the Global Mapper software, working with geographical units for an easier transcription of the control point information. According to the special charac-teristics of each map, the following two methods were considered: Georeferencing by grid: From those maps including a grid defined in geographic coordinates, we can consider this infor-mation for its georeference process; first considering the old meridian origin and its difference with the modern one in Greenwich (Martín López and Vázquez Maure 1995):
• Meridian of Madrid: 3º41’15’’W • Meridian of San Fernando (Cádiz): 6º12’’20’’W
Georeferencing by contour: From previously historical and modern rectified maps, the natural contour of each island was rec-ognized point-by-point, which would have its corresponding counterpart on the modern carto-graphic base. If it was not possible, some symbolic elements with a good definition were consid-ered, such as: peaks, churches, etc. The plans of fortresses and headquarters were georeferenced using only one coordinate point. Most maps do not include a grid for the georeferencing process. So, the contour method has been resorted. However, this technique makes important distortions in the historical document, so it was decided to do away with it with the aim of keeping the geomet-ric definition of a historical document. The resulting distortions lead to a high cost, a drawback contrasting with the advantage of accurate georeferencing that could help with publication in the Internet.
Figure 4. Results of the georeferencing of the historical maps.
Finally, the new methodology considered in lieu of the methods mentioned above, involve work-ing with the approximate coordinates of the map corners (bounding box). For every image proc-essed a shapefile is generated. Polygonal limits of this file include the approximate contour of the map. For those images including plans and construction sections, the appropriate shapefile geome-try is just a point. The ESRI Arcview software is the computer tool used for the creation of the file containing the approximate contour of the documents in comparison with the cartographic base and helped with additional historical documentation. In this way, the entire shapefiles are grouped in two tiles. One tile for the point entities and the other one the polygonal. Each element of the tile includes two associated features: an index (corresponding with the map catalogued signature) and a map reference year. These two features will allow making spatial and temporary selections: What documents exist from a geographical location? What documents exist in a time interval?

[267]
Figure 5. Approximate positioning of the historical cartography
Cartographic metadata creation One of the main functions of a Digital Library is to dispose the metadata describing the maps which are stored. Therefore, the cataloguing process based on ISO191151. This standardization belongs to the ISO 19100 group developed by the ISO Technical Committee 211 (URL 7). It pro-vides a metadata template and establishes a common geographical information metadata termi-nology, definition and procedures. In the frame of the IDEE2, a metadata profile based in ISO 19115 was proposed. It is known as NEM3, and it is composed by a subset of elements agreed by an expert group, assuring interoperability and harmonization of the metadata. The CatMdEdit OpenSource (URL 10) software was used for the geographical metadata creation and edition. It has a compatible interface with the Metadata Spanish Core Profile (ISO19115-NEM). Thus, the metadata created can be easily located from the Spanish SDI Gateway. Some special features of the historical map set were considered during the metadata creation as follows:
• Most maps include only graphic scales. So, it was necessary for its cataloguing to find the analytic value measuring this graphic scale in pixel units. Besides, the measuring units were not homogenous (meter, mile, toesa, spanish feet, english feet...).
1 International Organization for Standardization, ISO 19115-FDIS. Geographic Information – Metadata, 2003 2 Spatial Data Infrastructure of Spain 3 Metadata Spanish Core Profile
[268]
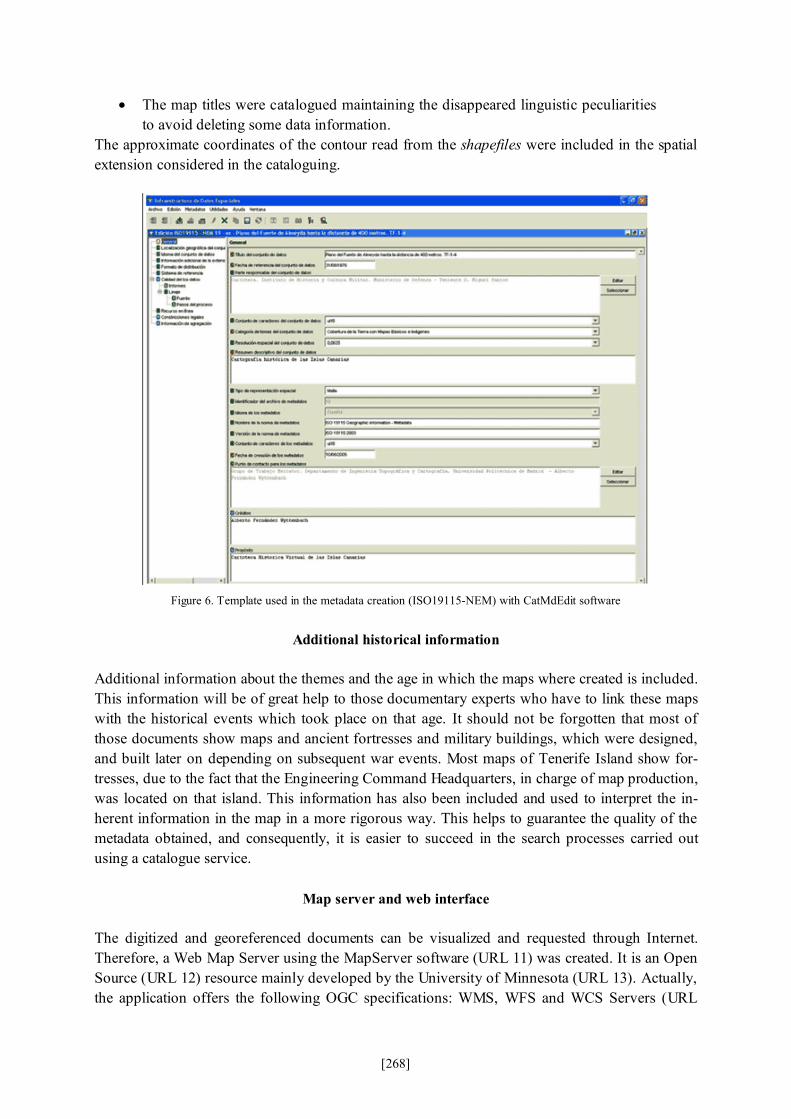
• The map titles were catalogued maintaining the disappeared linguistic peculiarities to avoid deleting some data information.
The approximate coordinates of the contour read from the shapefiles were included in the spatial extension considered in the cataloguing.
Figure 6. Template used in the metadata creation (ISO19115-NEM) with CatMdEdit software
Additional historical information
Additional information about the themes and the age in which the maps where created is included. This information will be of great help to those documentary experts who have to link these maps with the historical events which took place on that age. It should not be forgotten that most of those documents show maps and ancient fortresses and military buildings, which were designed, and built later on depending on subsequent war events. Most maps of Tenerife Island show for-tresses, due to the fact that the Engineering Command Headquarters, in charge of map production, was located on that island. This information has also been included and used to interpret the in-herent information in the map in a more rigorous way. This helps to guarantee the quality of the metadata obtained, and consequently, it is easier to succeed in the search processes carried out using a catalogue service.
Map server and web interface The digitized and georeferenced documents can be visualized and requested through Internet. Therefore, a Web Map Server using the MapServer software (URL 11) was created. It is an Open Source (URL 12) resource mainly developed by the University of Minnesota (URL 13). Actually, the application offers the following OGC specifications: WMS, WFS and WCS Servers (URL

[269]
14); WMS and WFS Interfaces; SLD (URL 15), Filter, GML (URL 16) and WMContext (URL 17). It bears several raster files (JPG, PNG, GIF, GeoTIFF and so more with GDAL), and vector files (ESRI shapefiles, PostGIS, ESRI ArcSDE, GML and so more with OGR). The Web client is based in HTML/JavaScript language and it was designed to access to the WMS. This interface allows visualizing the requested results sent to the server by the OGC (URL 18) specification protocol. And then, it is possible to navigate through the layers included in the map service. The website was designed considering the user’s profile, the semiology requirements and the esthetical sense. The specific behaviors and visualization tools were also programmed. The cartographic base and the vector layers can be visualized through the Web interface, including the island contour and the tiles generated with the documents contours. In this way, the searching tools would provide the document’s visualization in a new pop-up window. Finally, it is possible to search and download the generated metadata of each document. The Digital Map Library of the Canary Islands can be visited at the following address: http://mapas.topografia.upm.es/cartotecanarias
Figure 7. English version of the Digital Map Library in of the Canary Islands
Interactive searches
This map server application allows different types of searches in the files that contain the ap-proximate contour of each map, and over the cartographic base. The following four options of searching over the cartographic base are allowed:
• Query in a selection over the visualized map. The result would be the contour ge-ometry and its associated document.

[270]
• Query by one or more Island selection. The result would be all the documents con-taining some information about the selected island.
• Query in a geographical selection. All the documents included in the clicked selec-tion would be included. It is also possible to select only the smallest area map of the geographical selection.
Advanced searches in the geographic metadata catalog
The metadata of the maps were included in a geographic catalog. Thus, it is possible to include advanced searches in the metadata to localize any map. It has been considered the GeoNetwork OpenSource (URL 19) catalogue used by the FAO-UN. It is a multi-language tool with a metadata editor (ISO19115), which import or registry XML stored metadata. It includes a data search and visualization interface. Besides, it is possible to carry out distributed searches in others associated catalogs and to mix the results according to the ISO23950 standard Z39.50 (Manso and Bernabé 2004). The Digital Library defined in the GeoNetwork environment allows searching in different ways:
• Query by entering free text • Query by selecting a country, region or continent • Query by entering a combination of both • Query by entering key words
Results are ordered using the following rules: • Free text searches will show the best matching results first, based on an index created on
the title, the abstract and the metadata keywords. • Country/region searches will show matching results first, followed by more detailed re-
sults and then by results that cover a wider area than the selected one. • The combined search will only show records that match both criteria
The Digital Map Catalog of the Canary Islands can be visited at the following address: http://mapas.topografía.upm.es:9090/geonetwork
Figure 8. Digital Map Library in Geonetwork

[271]
Future developments The Canary Islands can be seen as a geographical region in which its territorial boundaries are determined by natural factors. According to this fact, the Canary Islands are clearly suitable in case we wanted to develop this tool conducting an analysis about the vertical harmonization of Geographical Information. This is equivalent to talking about the geometrical distortions which can be observed in different historical maps when being overlaid with modern maps, (a certain amount of transparency is required), of good quality and with the possibility of being locally ex-ported. In order to obtain the geographical harmonization with the rest of the information in-cluded, some graphical distortion algorithms, normally known as warping, are use (Guerra 2000). This designed tool has two objectives in mind:
• Obtain a georeferenced and geometrically corrected image. • Carry out an analysis of the variation observed on territorial boundaries, accord-
ing to the different cartographic representations of a single localization. In this regard, we can see how improvements on the techniques and on the specialised material used; has allowed us obtaining a more trustworthy representation of this territory.
In both cases, the user would have the possibility (rejected in the beginning of this project) of dis-torting images, in case he wishes to do so.
Figure 9: Deformations introduced by a force point in the warping effect (Guerra 2000).
After analyzing this, several applets developed in OpenSource Java projects have been detected (URL 20), which allow obtaining this effect in the images considering various previously pro-grammed algorithms. It is interesting to consider the option of including these little applications in the Digital Library for the historical maps with the aim of increasing its functionality in the docu-mentary work, for the comparison between them and with the modern maps. This is the research line to follow to continue developing the tools of the Digital Map Library of the Canary Islands.
Conclusions • It is necessary to conveniently choose the resolution used in the map scanning keeping
the two main elements, resolution and file size, optimized. • It is also necessary to keep the according accuracy in the optical exploration process. • Large size maps imply an exponential increase of file size in relationship with pixel
size (dpi)

[272]
• By and large, historical maps include less geographical information level than modern topographic maps used as cartographic base, so one has to be more generous when con-sidering resolution of the latter.
• One should be careful with the resolution of the historical map scanning to facilitate its download through the world-wide-web.
• Scanning must be especially careful to avoid further damage to precarious maps. Skilled staff is needed for their handling.
• Among the decision to be taken to keep the historical and geometric precision of these maps unaltered, chronological accuracy and metadata are considered to be more impor-tant than georeferencing, since this application is aimed at historians and documentary expert.
• Radiometric and geometric processing is to be avoided if at all possible. • Map Georeferencing may cause serious distortions, causing some qualitative features or
information to be hidden. • Geonetwork appears to be an appropriate tool for cataloguing and query in this field.
References
Guerra F. (2000). 2W: New technologies for the georeferenced visualization of Historic Cartogra-phy. In Proc. of 19th ISPRS Meting, Vol.XXXIII, Amsterdam.
Manso M. A., M. A. Bernabé (2004). Prototipo de GeoPortal de mapas antiguos. Zaragoza: JIDEE.
Martín López J., F. Vázquez Maure (1995). Lectura de mapas. Madrid: FGUPM.
WEB sites
(URL 1): INSPIRE - The Infrastructure for Spatial Information in Europe. http://www.ec-gis.org/inspire/
(URL 2): Instituto de Historia y Cultura Militar - Ministerio de Defensa. España. http://www.ejercito.mde.es/ihycm/index.html
(URL 3): IGN - Instituto Geográfico Nacional de España. http://www.ign.es/ign/es/IGN/home.jsp
(URL 4): SGE – Servicio Geográfico del Ejército Español. http://www.ejercito.mde.es/publicaciones/sge/index_sge.html
(URL 5): ECW - Enhanced Compressed Wavelet. http://www.ermapper.com/ecw/
(URL 6): Global Mapper. http://www.globalmapper.com/
(URL 7): ISO - International Organization for Standardization. http://www.iso.org
(URL 8): IDEE – Infraestructura de Datos Espaciales de España. http://www.idee.es
(URL 9): ISO19115-NEM. Núcleo Español de Metadatos. http://www.idee.es/resources/recomendacionesCSG/NEM.pdf
(URL 10): CatMDEdit - http://catmdedit.sourceforge.net/
(URL 11): MapServer. http://mapserver.gis.umn.edu/

[273]
(URL 12): Open Source. http://www.opensource.org/
(URL 13): University of Minnesota. http://www.umn.edu
(URL 14): OGC “OpenGIS Web Coverage Service (WCS) Implementation Specification” Ver-sion: 1.0. Open GIS Consortium Inc. Date: 16 October 2003- Reference number of this OpenGIS project document: OGC 03-065r6.
http://www.opengeospatial.org/specs/?page=specs (URL 15): OGC “OpenGIS Styled Layer Descriptor (SLD) Implementation Specification” Ver-sion: 1.0 Open GIS Consortium Inc. Date: 19 August 2002- Reference number of this OpenGIS project document: OGC 02-070.
http://www.opengeospatial.org/specs/?page=specs
(URL 16): OGC“OpenGIS Geography Markup Language (GML) Encoding Specification” Ver-sion: 3.1.1. Open GIS Consortium Inc. Date: 19 April 2004- Reference number of this OpenGIS project document: OGC 03-105r.
http://www.opengeospatial.org/specs/?page=specs
(URL 17): OGC “OpenGIS Web Map Context Implementation Specification” Version: 1.1. Open GIS Consortium Inc.Date: 3 May 2005- Reference number of this OpenGIS project document: OGC 05-005. http://www.opengeospatial.org/specs/?page=specs
(URL 18): OGC - Open Geospatial Consortium. http://opengeostapatial.org
(URL 19): Geonetwork: Geographic Metadata Catalog OpenSource project. http://sourceforge.net/projects/geonetwork
(URL 20): Alex Rosen’s Homepage. http://www.axlrosen.net/