digital image analysis of cells - institutionen för ... · digital image analysis of cells ......
TRANSCRIPT

ACTAUNIVERSITATISUPSALIENSISUPPSALA2009
Digital Comprehensive Summaries of Uppsala Dissertationsfrom the Faculty of Science and Technology 596
Digital Image Analysis of Cells
Applications in 2D, 3D and Time
AMALKA PINIDIYAARACHCHI
ISSN 1651-6214ISBN 978-91-554-7398-3urn:nbn:se:uu:diva-9541

Dissertation presented at Uppsala University to be publicly examined in Siegbansalen,Ångstrom Laboratory, Polackbacken, Uppsala, Friday, February 27, 2009 at 10:15 for thedegree of Doctor of Philosophy. The examination will be conducted in English.
Abstract
Pinidiyaarachchi, A. 2009. Digital Image Analysis of Cells. Applications in 2D, 3D and Time.Acta Universitatis Upsaliensis. Digital Comprehensive Summaries of Uppsala Dissertationsfrom the Faculty of Science and Technology 596. 57 pp. Uppsala. ISBN 978-91-554-7398-3.
Light microscopes are essential research tools in biology and medicine. Cell and tissuestaining methods have improved immensely over the years and microscopes are now equippedwith digital image acquisition capabilities. The image data produced require development ofspecialized analysis methods. This thesis presents digital image analysis methods for cellimage data in 2D, 3D and time sequences.Stem cells have the capability to differentiate into specific cell types. The mechanism
behind differentiation can be studied by tracking cells over time. This thesis presents acombined segmentation and tracking algorithm for time sequence images of neural stemcells.The method handles splitting and merging of cells and the results are similar to thoseachieved by manual tracking.Methods for detecting and localizing signals from fluorescence stained biomolecules are
essential when studying how they function and interact. A study of Smad proteins, that serveas transcription factors by forming complexes and enter the cell nucleus, is included in thethesis. Confocal microscopy images of cell nuclei are delineated using gradient information,and Smad complexes are localized using a novel method for 3D signal detection. Thus, thelocalization of Smad complexes in relation to the nuclear membrane can be analyzed. Adetailed comparison between the proposed and previous methods for detection of point-sourcesignals is presented, showing that the proposed method has better resolving power and is morerobust to noise.In this thesis, it is also shown how cell confluence can be measured by classification of
wavelet based texture features. Monitoring cell confluence is valuable for optimization of cellculture parameters and cell harvest. The results obtained agree with visual observations andprovide an efficient approach to monitor cell confluence and detect necrosis.Quantitative measurements on cells are important in both cytology and histology. The color
provided by Pap (Papanicolaou) staining increases the available image information. The thesisexplores different color spaces of Pap smear images from thyroid nodules, with the aim offinding the representation that maximizes detection of malignancies using color information inaddition to quantitative morphological parameters.The presented methods provide useful tools for cell image analysis, but they can of course
also be used for other image analysis applications.
Keywords: Digital image analysis, microscopy,fluorescent staining, watershed segmentation,sub-cellular localization, point-like signals, wavelets, cell confluence, cytology, color spaces.
Amalka Pinidiyaarachchi, Centre for Image Analysis, Uppsala University, Box 337,SE-75105 Uppsala, Sweden
© Amalka Pinidiyaarachchi 2009
ISSN 1651-6214ISBN 978-91-554-7398-3urn:nbn:se:uu:diva-9541 (http://urn.kb.se/resolve?urn=urn:nbn:se:uu:diva-9541)
Distributor: Uppsala University Library, Box 510, SE-751 20 Uppsalawww.uu.se, [email protected]

To my parents������������������������������������������������ �������������������������������� ���� �� �� �� ���� ��

Papers included in the thesis
This thesis is based on the following papers, which are referred to in the textby their Roman numerals.
I Amalka Pinidiyaarachchi and Carolina Wählby. Seeded watersheds forcombined segmentation and tracking of cells. In Proceedings of ICIAP2005, 13th International Conference on Image Analysis and Process-ing, Cagliari, Italy. Published in Lecture Notes in Computer Science(LNCS) 3617, pp. 336-343, 2005.
II Amalka Pinidiyaarachchi, Agata Zieba, Amin Allalou, Katerina Pardaliand Carolina Wählby. A detailed analysis of 3D subcellular signal lo-calization. Cytometry A. In press, published online, November 2008.DOI: 10.1002/cyto.a.20663.
III Amin Allalou, Amalka Pinidiyaarachchi and Carolina Wählby. Robustsignal detection in 3D fluorescence microscopy. Submitted for journalpublication, January 2009.
IV Amalka Pinidiyaarachchi, Hans Claesson and Carolina Wählby.Wavelet based estimation of cell confluence. Submitted for journalpublication, November 2008.
V Amalka Pinidiyaarachchi and Carolina Wählby. On color spaces for cy-tology. In Proceedings of SSBA 2007, Swedish Symposium on ImageAnalysis, Linköping, Sweden, 2007.
Reprints were made with permission from the publishers.
The method development and writing for Paper I was performed by the author, who
also presented the paper at ICIAP. In Paper II, the method development and writing
was performed mainly by the author with contributions from Amin Allalou. Agata
Zieba and Katerina Pardali contributed with image data and biological discussions.
The idea for Paper III occurred during the work with Paper II. The method
development was performed mainly by Amin Allalou in close cooperation with all
co authors. The method evaluation, testing and writing were split between Amin
Allalou and the author. The author contributed with the original idea, implementation
of methods and method evaluation for Paper IV. Hans Claesson contributed with
image data. For Paper V, the work regarding method development and writing was
performed by the author.
Faculty opponent is Prof. Arvid Lundervold, Department of Biomedicine and Molec-
ular Imaging Center, University of Bergen, Norway.
Related work by the author
I Amalka Pinidiyaarachchi, P.M.K Alahakoon and N.V.I. Ratnatunga.Feasibility of using digital image processing in the assessment ofcytology smears. In Proceedings of IITC 2006, 8th InternationalInformation Technology Conference, University of Colombo School ofComputing (UCSC), Colombo, Sri Lanka, December 2006.
II Amalka Pinidiyaarachchi, Jenny Göransson, Carlos Gonzalez-Rey,Mathias Howell, Jonas Melin, Jonas Jarvius, Mats Nilsson, EwertBengtsson and Carolina Wählby. Digital image processing formultiplexing of single molecule detection. In Proceedings ofMedicinteknikdagarna 2005, (A biomedical engineering meeting)Stockholm/Södertälje, Sweden, September 2005.
Contents
1 Introduction . . . . . . . . . . . . . . . . . . . . . . . . . . . . . . . . . . . . . . . . . . 92 Microscopy of cells . . . . . . . . . . . . . . . . . . . . . . . . . . . . . . . . . . . . 112.1 Bright field microscopy . . . . . . . . . . . . . . . . . . . . . . . . . . . . . . 112.2 Phase contrast microscopy . . . . . . . . . . . . . . . . . . . . . . . . . . . . 132.3 Fluorescence microscopy . . . . . . . . . . . . . . . . . . . . . . . . . . . . . 142.4 Confocal microscopy . . . . . . . . . . . . . . . . . . . . . . . . . . . . . . . . 142.5 Point Spread Function . . . . . . . . . . . . . . . . . . . . . . . . . . . . . . . 152.6 Staining techniques . . . . . . . . . . . . . . . . . . . . . . . . . . . . . . . . . 162.7 Proximity Ligation Assay . . . . . . . . . . . . . . . . . . . . . . . . . . . . 16
3 Fundamental image analysis concepts . . . . . . . . . . . . . . . . . . . . . . . 173.1 Digital image data . . . . . . . . . . . . . . . . . . . . . . . . . . . . . . . . . . 173.2 Spatial domain and frequency domain . . . . . . . . . . . . . . . . . . . 183.3 Pre-processing . . . . . . . . . . . . . . . . . . . . . . . . . . . . . . . . . . . . . 193.4 Image segmentation by gray value thresholding . . . . . . . . . . . . 203.5 Watershed segmentation . . . . . . . . . . . . . . . . . . . . . . . . . . . . . 213.6 Texture analysis . . . . . . . . . . . . . . . . . . . . . . . . . . . . . . . . . . . . 243.6.1 Feature descriptors . . . . . . . . . . . . . . . . . . . . . . . . . . . . . . 243.6.2 Wavelets for texture analysis . . . . . . . . . . . . . . . . . . . . . . 25
3.7 Color image processing . . . . . . . . . . . . . . . . . . . . . . . . . . . . . . 274 Applications methods and results . . . . . . . . . . . . . . . . . . . . . . . . . . 294.1 Seeded watersheds for cell segmentation and tracking . . . . . . . 294.2 3D point like signal detection and localization . . . . . . . . . . . . . 344.2.1 Signal detection in 3D . . . . . . . . . . . . . . . . . . . . . . . . . . . 344.2.2 Performance evaluation . . . . . . . . . . . . . . . . . . . . . . . . . . 36
4.3 Cell confluence measurements for time-lapse microscopy . . . . 394.4 Pre study of color spaces for cytology . . . . . . . . . . . . . . . . . . . 41
5 Conclusions and future work . . . . . . . . . . . . . . . . . . . . . . . . . . . . . 436 Brief summary of Papers . . . . . . . . . . . . . . . . . . . . . . . . . . . . . . . . 457 Summary in Swedish . . . . . . . . . . . . . . . . . . . . . . . . . . . . . . . . . . . 478 Acknowledgments . . . . . . . . . . . . . . . . . . . . . . . . . . . . . . . . . . . . . 51Bibliography . . . . . . . . . . . . . . . . . . . . . . . . . . . . . . . . . . . . . . . . . . . . 53

1. Introduction
The rapid growth in digital imaging techniques associated with lightmicroscopy allows researchers from the fields of biology, medicine etc.to produce large amounts of image data in a variety of experiments. Thissometimes overwhelming amount of image data needs to be handledcarefully to allow the extraction of the required information in a resourcefulmanner. Thus the role of image analysis is not limited only to the analysis ofthe acquired image. In many instances, it also extends to working togetherwith those who acquire images, to make decisions on the best approach toproduce the image data at the microscopes. It is always better for the imageanalysis to start with "good quality images" rather than trying to "make themgood" for processing later. It is also important to decide when to perform ananalysis in 2D and when it is necessary to extend it to 3D. Images in 3D notonly mean more data and more storage requirements but they also demandextended methods for analysis and more memory and processing power tohandle the large amount of data when performing the analysis.
Over the past years experts from the fields of biology and medicine, andimage analysis have worked together to produce various important researchresults in close collaborative manner that has benefitted both sides. The workthat led to this thesis can be seen as an addition to the same endeavor and ishence entitled "Digital Image Analysis of Cells - Applications in 2D, 3D andTime". The main aim is to investigate and extend existing image analysismethods for new applications and also to 3D where necessary. New methodsthat outperform existing methods have also been investigated. The imagedata used in this thesis shows cells from different experiments and the imageswere obtained using different microscopy techniques both in 2D and 3D. In atime series of images the time accounts for an additional dimension.
When tracking of live cells in time-lapse images is needed in order toinvestigate the growth of the cells, time can be thought of as the thirddimension of a 3D data set. The tracking process then involves dealing withcells that divide, merge and group into clusters over time. Paper I describesa method for performing a combined segmentation and tracking on live cellimages. With the advent of new techniques in fluorescence microscopy,biologists are able to tag specific protein complexes inside cells with highspecificity. Studying such complexes inside cells requires images acquired
9

as 3D stacks and image analysis methods to localize the signals also in3D. This type of 3D nuclei segmentation and point-like signal localizationmethod is presented in Paper II. Paper III is a continuation of the work onthe point-like signal detection method where the performance of the methodis evaluated. Live cell imaging does not limit the requirements of imageanalysis to segmentation and tracking only. Sometimes the main aim is toobtain quantitative measurements on the samples over time. Cell confluence,i.e., the percentage of live cells that covers the cell growing surface, is animportant measurement for certain experiments. Texture analysis basedconfluence measurements are discussed in Paper IV. Staining biologicalsamples with dyes with the aim of increasing contrast at the bright-fieldmicroscope is a common practice in some experiments. This additional colorinformation associated with the images can sometime be used in the imageanalysis tasks as well. Paper V is an attempt to explore this aspect of use ofcolor for cytology.
This thesis is organized as follows: Section 2 is an overview of differentmicroscopy techniques and the different methods used in staining. Section3 includes the discussion on the image analysis concepts that are in focusin this thesis. The contributions by the author are included in Section4 with the concluding remarks and future work following in Section 5.A brief summary of the papers included in the thesis can be found in Section 6.
10
2. Microscopy of cells
Cells and the internal structures of the cells can be observed using manydifferent forms of light microscopy ranging from the normal bright fieldmicroscopy to advanced systems like the Stimulated Emission Depletionmicroscopy (STED) (Davidson and Abramowitz, 2008, Klar et al., 2001).With the advances of the Green Fluorescent Proteins (GFP) (Tsein, 1998,Cantrill, 2008) a whole new color palette becomes available for fluorescencemicroscopy enabling the study of protein dynamics and functioning in livingcells. The applicability of this wide range of techniques in a particularsituation differs depending on the questions asked and also the availability ofthe techniques. The cell images used in the work presented in this thesis wereacquired using bright field and confocal fluorescence microscopy in theircommon forms of use. The actual settings of the microscopes (e.g. havingspecial contrast methods for bright field microscopy) and the type of stainingused (to increase contrast in the bright field or to specifically tag componentsin the cells in fluorescence microscopy) have been decided by the expertsinvolved. This chapter covers a brief description on the microscopy methodsinvolved and the details related to their settings in the relevant experiments.
2.1 Bright field microscopy
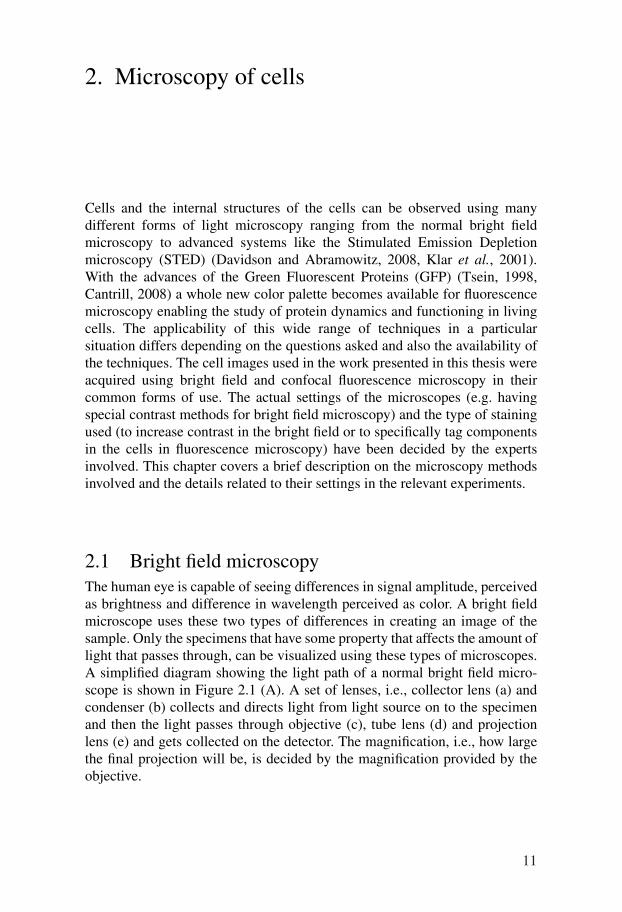
The human eye is capable of seeing differences in signal amplitude, perceivedas brightness and difference in wavelength perceived as color. A bright fieldmicroscope uses these two types of differences in creating an image of thesample. Only the specimens that have some property that affects the amount oflight that passes through, can be visualized using these types of microscopes.A simplified diagram showing the light path of a normal bright field micro-scope is shown in Figure 2.1 (A). A set of lenses, i.e., collector lens (a) andcondenser (b) collects and directs light from light source on to the specimenand then the light passes through objective (c), tube lens (d) and projectionlens (e) and gets collected on the detector. The magnification, i.e., how largethe final projection will be, is decided by the magnification provided by theobjective.
11

Figure 2.1: Simplified diagrams for different microscopes. (A) Normal bright field,(B) Phase contrast, (C) Fluorescence. L is the light source.
To increase the contrast specimens can be stained with color and thisoften requires fixation of the specimen meaning that the cell are dead. Thereare a number of stains that can be used and all the colors used for stainingdifferent structures will be registered in the same image. In the study of colorspaces for cytology in Paper V, the cytology smears have been stained usingPapanicolaou staining (nuclear stain haematoxylin (blue) and cytoplasmstaining eosin (pink/red)) to clearly visualize the cell nuclei. The mainconcern in the study is to find malignant samples, and color, in addition to theother quantitative parameters, can provide information on the malignancy.See Figure 2.2 (A) for an example of what this type of staining looks like.In live cell imaging that uses normal bright field microscopy, the increase
of the contrast level can also be acquired in other ways. This use of additionalmethods to increase the contrast is desirable especially in cases where thesamples are faint and the absorption is not evident. The contrast in suchcases is caused by refraction rather than absorption. The stem cell imagesin Paper I imaged under bright field microscopy, have been imaged witha slight defocus to achieve higher contrast at the cost of lower resolution,see Figure 2.2(B). The theory behind this approach is explained in detail inDegerman (2005).
If live cells need to be imaged as a time sequence and imaging is performedon several parts of the specimen, the best approach is to use an automatedmicroscopy system. This will minimize the errors that can be made bymanually changing between the different locations of the specimen. A systemperforming live cell imaging, needs a specially controlled environment thatmimics the cells’ natural environment for the cells to stay healthy. A practical
12

Figure 2.2: Images obtained using different contrast enhancement methods at brightfield microscopy. (A) using staining to increase contrast (Paper V) (see Figure 4.10(A)
for color image), (B) using slight defocus (Paper I), (C) using phase contrast mi-
croscopy (Paper IV).
system also has to have the ability to perform the auto-focusing in a suitablemanner. If such an auto-focus mechanism is not used, another option is toacquire a stack of images from different focal planes for each section. Thisstack can then be used later, to obtain the best slice by an auto-focus function(Brenner et al., 1976) searching for the optimal focus position based on localimage contrast. This approach has been used in obtaining the images withbest contrast from the time-lapse image sequence of stem cells used in PaperI. See Althoff (2005) and Degerman (2005) for further details.
2.2 Phase contrast microscopy
There are special techniques that have been developed in order to increasethe contrast with bright field imaging, namely phase contrast and differentialinterference contrast (DIC) (Davidson and Abramowitz, 2008). Thesetechniques use optics in order to increase the contrast and therefore can beused for live cell imaging also as time sequences.When light passes through the specimen, the beams that come into contact
with objects change the phase relative to those that pass through emptyspaces. The difference introduced by the specimen is only approximatelyone-quarter wavelength and the destructive interference caused thesediffracted and undiffracted light is not enough to make an image visible.Phase contrast microscopy uses a phase ring and a phase plate to selectivelyintroduce an additional one-quarter wavelength to the undiffracted beambefore it recombines with the diffracted beam. The destructive interferenceof these two beams can now be seen as difference in brightness on theimage. Figure 2.1(B) shows a simplified diagram of the setup of a phasecontrast microscope. This type of microscopes are widely used for live cell
13

imaging and time-lapse imaging. They have the advantage over other lightmicroscopes of being able to produce high contrast image data withoutdisturbing the cells by staining and/or fixation. The images of fibroblastsused in the confluence measurements of Paper IV are positive phase contrastimages obtained using an inverted microscope, see Figure 2.2(C).
2.3 Fluorescence microscopy
Fluorescence microscopy has become an indispensable technique forperforming precisely localized detection of interactions within the cells.The microscopy and imaging need to be associated with specially designedtechniques and the advances in both have enabled the study of dynamicprocesses in living cells (Stephens and Allen, 2003). The schematic diagramfor a fluorescence microscope is shown in Figure 2.1(C). The fluorescentmolecules in the stained sample absorb light of a certain wavelength and emitlight of a longer wavelength. The dichroic mirror reflects light below a givenwavelength while transmitting the light of longer wavelengths. Together withthe excitation and emission filters, it is possible to expose the sample to onlythe light of the absorption wavelength and to only let the emitted light of thespecific wavelength to be captured at the detector. This enables capturingparts stained with different flourochromes as images in different channels.In wide-field fluorescence microscopy the whole sample is illuminated and
the incoming light from out-of-focus parts also gets collected on the image.This is problematic especially in 3D since the quality of the images becomepoor making the image analysis tasks more complicated, see Figure 2.3(A)for a DAPI (4’,6-diamidino-2-phenylindole) stained cell nucleus formpreliminary tests of Paper II, imaged using wide-field microscopy.
2.4 Confocal microscopy
The technique of confocal microscopy is similar to normal fluorescencemicroscopy but with the addition of pinholes both at the light source and thedetector that removes out-of-focus light. This will increase the z resolution.The image data for Paper II were acquired using confocal microscopy.
During the first sample experiments the image acquisition was performedusing wide-field microscopy with DAPI as the nuclear satin, seeFigure 2.3(A). As can be seen the extraction of the exact boundary in zdirection is impossible. New model based segmentations were tried, e.g.,using an ellipsoidal model that needs the initial input of the approximatecenter slice form the user. This gives visually appealing results but the
14

Figure 2.3: (A) A DAPI stained nucleus imaged at wide-field microscope, xy slice, xzand yz projections showing the effect of out-of-focus light. (B) nuclei imaged under
confocal microscopy, visualized using anti-Lamin B1 and FITC, and one nucleus with
the yz projection showing the improved z resolution.
output depends on the user inputs and the importance of extracting theexact boundary led us to switch to confocal fluorescence microscopy toacquire the image data. Figure 2.3(B) shows a cell nucleus from imagedata of Paper II visualized using anti-Lamin B1 and FITC, imaged at aconfocal system. The figure shows an xy slice and the corresponding yzprojection. The main disadvantages of confocal microscopy are the signif-icantly lower light collection efficiency and the longer image acquisition time.
2.5 Point Spread Function
The resolution, i.e., how close two objects can be within an image and still beresolved as two distinct objects, depends on the imaging system properties,particularly on the point spread function (PSF). For a given microscopysystem the PSF is usually modeled with a Gaussian function (Zhang et al.,2007) and the full width at half maximum (FWHM) of the PSF is usedto measure resolution. The determined PSF can be used to reassign theout-of-focus light mathematically (Bolte and Cordelieres, 2006). This isknown as deconvolution and is available as an option at some microscopesystems.
When the PSFs of wide-field microscopy and confocal microscopy arecompared, confocal systems show improved resolution in both axial andlateral directions. The z resolution is still poor compared to the xy resolution.This has to be taken into account when performing image analysis. Forexample, the 3D filters used in Paper III that detect and verify point-likesignals, were altered in the z direction to compensate for this anisotropy.
15

2.6 Staining techniques
When biomolecules are analyzed quantitatively, a priori knowledge aboutthe analyte is used, and the target is recognized by using a specific affinityreagent. For proteins, these affinity reagents are usually anti-bodies andthe target can be detected using a fluorescence labeled antibody, seeFigure 2.4(A). The specificity, i.e., the degree to which a correct analyte ismeasurable, depends on the specificity of the antibody and the specificityof the detection method. To increase the signal-to-noise ratio (SNR), targetdetection can be associated with a secondary antibody, see Figure 2.4(B).Thus the process, in simple would be to capture a protein by an antibodyand to target the antibody by a secondary fluorescently labeled antibody(Alberts et al., 2002). As opposed to these artificially introduced fluorescentmolecules, the Green Fluorescent Protein (GFP) which is fluorescent itself,can be used for tagging proteins in living cells.
Figure 2.4: Staining techniques for protein detection using (A) a fluorescence labeledantibody. (B) secondary antibody to achieve high signal to noise ratio. (C) and (D)
using Proximity Ligation Assay.
2.7 Proximity Ligation Assay
The in situ Proximity Ligation Assay (PLA) is a protein detection methodbased on target recognition by two or more antibodies. PLA converts therecognition of a protein complex by two or more antibodies into a circularDNA molecule (Söderberg et al., 2006). This circular DNA molecule isthen amplified using so called rolling circle amplification, and the localizedconcatameric product is detected using fluorescent DNA probes. Proteincomplexes that are detected by in situ PLA have the combined effect ofhighly specific target recognition with a high SNR. The point-like signalsanalyzed in Paper II (Smad complexes) and Paper III (AuroraB-Survivincomplexes) originate from protein complexes are detected using PLA, seeFigure 2.4(D) and (E).
16