digital gene expression analysis during seedling...
TRANSCRIPT

Research(Centre(for(Biosystems,(Land(Use(and(Nutrition(
Institute(of(Agronomy(and(Plant(Breeding(I((
Department(of(Plant(Breeding(
Digital'gene'expression'analysis'during'seedling'development'of'
complex'traits'in'winter'oilseed'rape'(Brassica'napus'L.)'
Inaugural(Dissertation(for(a(Doctoral(Degree(in(Agricultural(Sciences(
in(the(Faculty(of(Agricultural(Sciences,(Nutritional(Sciences(and(
Environmental(Management(
Examiners((
((((((((((((((1.(Prof.(Dr.(Dr.(h.c.(Wolfgang(Friedt
2.(Prof.(Dr.(Matthias(Frisch(
Submitted(by((
Bertha(SalazarKColqui(
from((
Barquisimeto,(Venezuela(
Giessen(2015

DEDICATION'
'This work is dedicated to my loving parents, Germán Salazar and María Colqui, for
their eternal support.
''''
III
Table of Contents List of Figures V
List of Tables VI
List of Abbreviations VII
1 Introduction 1
2 Literature survey 2
2.1 Oilseed rape (Brassica napus L.) genome composition 2
2.2 Next generation sequencing (NGS) technologies 4
2.3 Digital gene expression (DGE) 7
2.4 Bulked-segregant analysis (BSA)-DGE approach 10
2.5 Weighted gene correlation network analysis (WGCNA) 12
3 Materials and Methods 15
3.1 Plant material 15
3.2 Isolation of total RNA 16
3.3 DpnII-DGE libraries construction 16
3.4 PCR enrichment of DpnII-DGE adapter-ligated cDNA 17
3.5 Validation of libraries 18
3.6 Illumina sequencing and data analysis 18
3.7 Bulked-segregant analysis-DGE 19
3.8 Weighted gene co-expression network analysis (WGCNA) 20
4 Results 21
4.1 Multiplexing of ExV8-DH population with DGE-DpnII Ilumina sequencing 21
4.2 DGE data analysis, mapping to Brassica unigenes and
Normalisation
23
4.3 Bulked-segregant analysis of DGE (BSA-DGE) data revealed differential
expression of genes for complex traits
28
4.3.1 Differentially expressed genes for hormone metabolites 28
4.3.2 Differentailly expressed genes for traits under greenhouse
conditions
35
4.3.3 Differentailly expressed genes for traits under field conditions 37
4.4 Weighted gene co-expression network analysis (WGCNA) for
identification of highly connected (hub) genes
41

IV
4.4.1 Identifying modules that are correlated with traits 41
4.4.2 Top hubs genes during seedling development at 8 and 12 DAS 46
4.4.3 Identifying biological functions of modules using gene ontology over-
representation analysis
49
5 Discussion 52
5.1 Multiplexing DGE-Ilumina sequencing for large plant populations 52
5.2 DGE data analysis enables mapping to the Brassica unigenes 54
5.3 DGE-BSA approach contributes to the understanding of complex trait
regulation in winter oilseed rape
55
5.4 WGCNA candidate genes expressed during seedling development 59
5.5 Gene expression of complex traits 63
6 Summary 66
7 Zusammenfassung 68
8 References 70
9 Appendix 80
Declaration 87
Acknowledgements 88

V
List of Figures Figure 1. The Brassica triangle of species 3
Figure 2. Recurrent genome duplications in B. napus 4
Figure 3. The Illumina sequencing-by-synthesis approach 8
Figure 4. Protocol description of digital gene expression (DGE) method 11
Figure 5. Amplification products from four multiplexed DGE-DpnII libraries 22
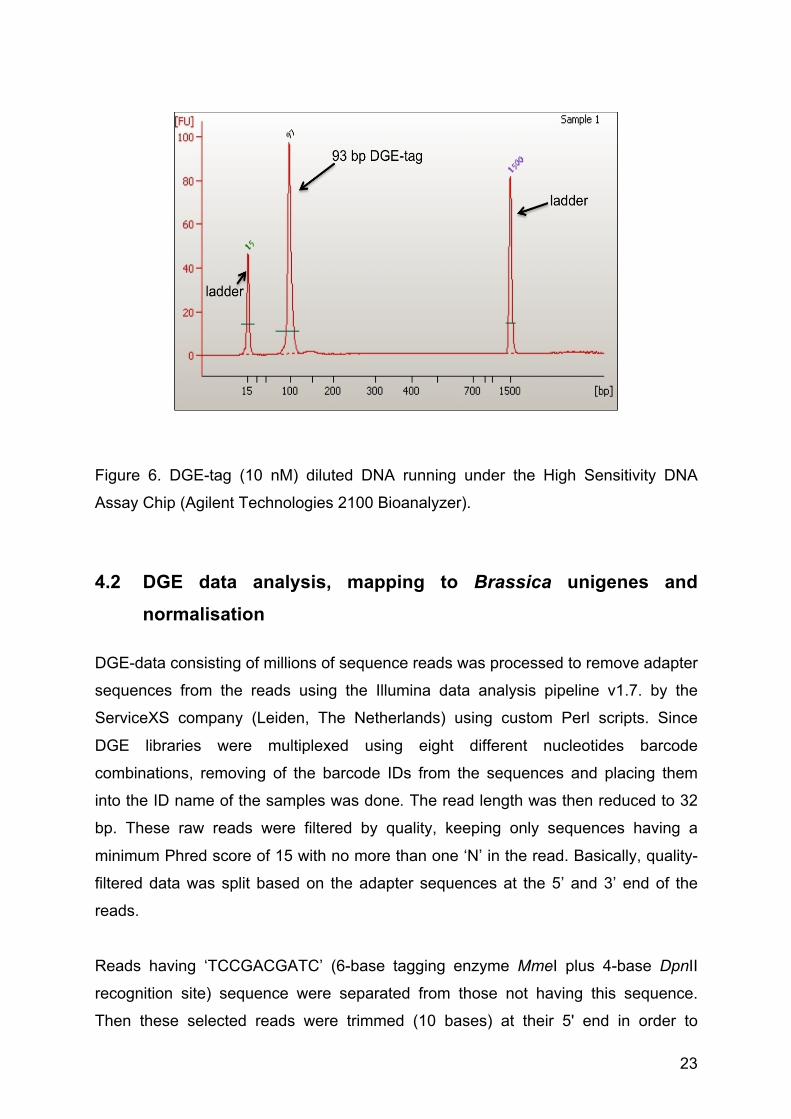
Figure 6. DGE-tag (10 nM) diluted DNA running under the High Sensitivity DNA
Assay Chip
23
Figure 7. An example of different DGE-tag mapping scenarios within the
complex polyploid B. napus genome
27
Figure 8. Co-expression network visualised in Cytoscape for 8 and 12 DAS
(days after sowing) seedling plants
51
VI
List of Tables Table 1. GEX-1 adapter sequences for DGE-DpnII- multiplexed protocol 17
Table 2. List of 27 traits evaluated for the ExV8-DH population and used for the
BSA-DGE analysis for identification of differentially expressed genes
29
Table 3. List of the differentially expresed genes corresponding to ABA (absicic
acid) hormone trait at 8 DAS after bulked-segregant analysis of DGE data
(BSA-DGE).
30
Table 4. List of the 20 most significantly (P<0.05) differentially expressed genes
for ABA3 (abscisic acid glucose ester) hormone metabolite trait at 8 DAS.
32
Table 5. List of the 20 most significantly (P<0.05) differentially expressed genes
for the AUX1 (auxin) at 8 DAS
33
Table 6. List of the 20 most significant (P<0.05) differentially expressed genes
for AUX1 (auxin) hormone trait at 12 DAS
34
Table 7. List of the 20 most significantly (P<0.05) differentially expressed genes
for shoot leaf weight (SPHW) at 8 DAS
36
Table 8. List of the 20 most significant (P<0.05) differentially expressed genes
for PH06 (plant height end of flowering for year 2006) at 8 DAS
38
Table 9. List of the 20 most significant (P<0.05) differentially expressed genes
for SY06 (seed yield for year 2006) at 8 DAS
39
Table 10. List of the significant (P<0.05) differentially expressed genes for
SY07 (seed yield for year 2007) at 8 DAS
40
Table 11. List of the significantly (P<0.05) differentially expresed genes at 12
DAS for SY07 (seed yield for year 2007) trait
40
Table 12. Top Hub Unigenes at 8 and 12 DAS (days after sowing) in B. napus.
Annotation of Top Hub unigenes to Arabidopsis genome
48
Table 13. Singular enrrichment analysis (SEA) of modules with their respective
top hub unigenes using agriGO
50
VII
List of Abbreviations
ABA Abscisic acid
AGI Arabidopsis Genome Initiative
AILP1 ALUMINUM INDUCED PROTEIN 1
AUX1 Auxin
BSA Bulked-segregant analysis
CNI1 CARBON/NITROGEN INSENSITIVE 1
CLV1 CLAVATA 1
CO CONSTANS
CYT2 Cytokinin Zeatin-O-glucoside
CYT4 Cytokinin cis-Zeatin
DAS Days after sowing
DGE Digital gene expression
DH Doubled haploid
DNA Deoxyribonucleic acid
DPHW Dry leaf weight
eQTL Expression quantitative trail loci
FT FLOWERING LOCUS T
GER1 GERMIN-LIKE PROTEIN 1
GRF1 GROWTH REGULATING FACTOR 1
GRF2 GENERAL REGULATORY FACTOR 2
HCH Hypocotyl length
LA Leaf area
LEA LATE EMBRYOGENESIS ABUNDANT
LHCB3 LIGHT-HARVESTING CHLOROPHYLL B-BINDING PROTEIN 3
NGS Next generation sequencing

VIII
NOI NITRATE INDUCED PROTEIN
MyAP Myrosinase associated protein
PCR Polymerase chain reaction
PH06 plant height at the end of flowering, year 2006
PH07 plant height at the end of flowering, year 2007
RNA Ribonucleic acid
SDW Shoot dry weight
SFW Shoot fresh weight
SPHW Shoot leaf weight
SY06 seed yield in 2006
SY07 seed yield in 2007
UBP15 UBIQUITIN-SPECIFIC PROTEASE 15
VPS2 VACUOLAR PROTEIN SORTING 2.2
WGCNA Weighted gene co-expression network analysis
WOSR Winter Oilseed Rape
1
1 Introduction Oilseed rape (Brassica napus L) is an allotetraploid (2n = 4x = 38) that arose,
probably within the last 10,000 years, by hybridization between unknown genotypes
of Brassica rapa (Brassica A genome) and Brassica oleracea (Brassica C genome).
Brassicas are important not only as crops but also as a resource for studying the
impacts of polyploidy in plants as a prevalent evolutionary mechanism within
angiosperms (O’Neill and Bancroft 2000, Rana et al. 2004, Parkin et al. 2005, Lysak
et al. 2005, Geddy and Brown 2007, Bancroft et al. 2011, Chalhoub et al. 2014).
Worldwide oilseed rape is the second most produced oilseed species after soybean,
with extensive production in China, North America (Canada), Europe and Australia
(Carré and Pouzet 2014). Seedling vigour is an important trait in winter oilseed rape
(WOSR) due to its influence on seedling and plant establishment before winter and
the consequent effects on yield and yield stability. Well-developed seedlings lead to
higher yield stability even under suboptimal growing conditions like reduced nutrient
input or drought stress (Blum, 1996). Therefore, the early developmental stages of
Brassica napus plants are of high importance for plant breeders. Up to now,
however, the genetics of seedling development of B. napus has been poorly
understood. In addition, multiple homeologous gene copies, chromosomal
rearrangements and amplification of repetitive DNA within large and highly complex
crop genomes such as the oilseed rape genome can considerably complicate
genome analysis and gene discovery. Next generation sequencing (NGS)
technologies have been recommended as an alternative to understanding the
complex trait regulation of oilseed rape at the molecular level (Edwards et al. 2013).
In the last years, digital gene expression (DGE) Illumina sequencing has been used
as an alternative to conventional microarray expression analysis, particularly for
accurate quantification of low-abundance transcripts and for potential identification of
candidate genes (Wei et al. 2013, Philippe et al. 2014). This was the method of
choice for this study. The main objectives of the present study were: (i) to produce
DGE transcriptome data after applying a multiplexing system for Ilumina sequencing
of the Express617xV8 doubled haploid mapping population, (ii) to identify
differentially expressed genes based on a bulked-segregant analysis (BSA) of DGE
data, and (iii) to discover candidate genes during seedling development through gene
co-expression network analysis.
2
2 Literature survey 2.1 Oilseed rape (Brassica napus L.) genome composition
The important oilseed crop B. napus originated from a spontaneous hybridization
between B. rapa L. (syn. campestris, genome AA, 2n = 20) and B. oleracea L.
(genome CC, 2n = 18). The former includes turnip rape (B. rapa spp. oleifera), turnip
(B. rapa spp. rapifera), Chinese cabbage (B. rapa spp. pekinensis), while the latter
involves the vegetable crops cauliflower (B. oleracea var. botrytis), cabbage (B.
oleracea var. capitata), calabrese (B. oleracea var. italica), Brussels sprouts (B.
oleracea L. gemmifera) and others (U 1935, Snowdon 2007, Kong et al. 2010) (Fig.
1). These two parental cultivated species possess a DNA content of 529 Mb and 696
Mb, respectively (Johnston et al. 2005) and diverged 7.3 million years ago (Mya).
They belong to the mustard family (Brassicaceae), which consists of approximately
340 genera and over 3,350 species (Johnston et al. 2005).
The high homology between the A and C genomes was revealed in earlier studies
(Parkin et al. 1995, Snowdon et al. 1997, Snowdon et al. 2002, Howell et al. 2008),
whereby both genomes are thought to have derived from a common ancestral
genome through chromosomal rearrangements (Parkin et al. 2005). Genome
sequencing projects for both B. rapa and B. oleracea have already been completed.
The B. rapa line Chiifu-401 (492 Mb) has been sequenced using second-generation
Illumina sequencing technologies (Wang et al. 2011). The B. napus assembled
genome size is 850 Mbp and has been recently sequenced (Chalhoub et al. 2014).
Furthermore, B. rapa and B. oleracea show extensive genome triplication since they
derived from a hexapolyploid ancestor, which indicates that chromosomal
rearrangements have occurred (Lysak et al. 2005, Schranz et al. 2006, Chalhoub et
al. 2014). Evidence of these rearrangements can be readily identified in the genome
of B. napus, where 21 syntenic blocks, with an average size of about 4.8 Mb in
Arabidopsis thaliana, have been maintained since the divergence of the Arabidopsis
and Brassica lineages, which has occurred around 20 Mya (Parkin et al. 2005).
3
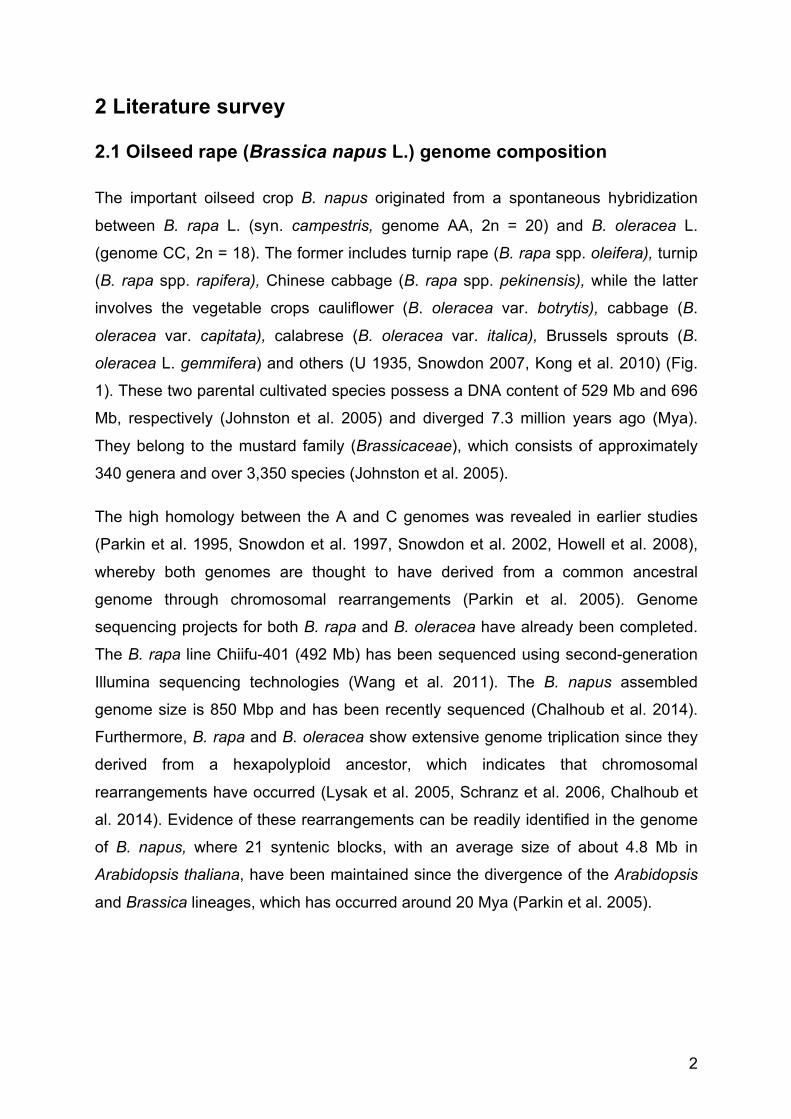
Figure 1. The Brassica triangle of species (U 1935, Snowdon 2007) representing the
A, B and C genomes and their respective amphidiploids that arose from spontaneous
chromosome doubling via meiotic nondisjunction after interspecific hybridizations in
regions of overlapping geographical distribution of the respective diploid progenitors.
It has been estimated that 30–70% of modern plant species have evolved through a
polyploid ancestor (Leitch and Leitch, 2008). Extensive gene-by-gene collinearity
between Brassica genomes and the genome of A. thaliana have been investigated
(Yang et al. 2006), and taking advantage of this, Bancroft et al. (2011), aligned their
Tapidor x Ningyou7 rapeseed double haploid (TNDH) linkage map to the genome of
Arabidopsis confirming tracts of synteny as well as chromosomal rearrangements by
mapping Brassica unigenes that provided 7,200 anchor points to the A. thaliana
genome, based on sequence similarity with the Arabidopsis Genome Initiative (AGI)
gene models. In oilseed rape, because of its amphidiploid composition of A and C
genomes, homeologous pairs of genes are co-expressed, and it is expected that
transcripts will differ in sequence by only approximately 3.5% (I. Bancroft, unpubl.).
The presence of homeologous loci is expected (Trick et al. 2009, Bancroft et al.
2011, McKay and Leach 2011). More recently, Chalhoub et al. (2014) confirmed
recurrent genome duplications in B. napus (Fig. 2).

4
Figure 2. Recurrent genome duplications in B. napus (Chalhoub et al. 2014).
Genomic alignments between the basal angiosperm Amborella trichopoda, the basal
eudicot Vitis vinifera, and the model crucifer A. thaliana, as well as B. rapa, B.
oleracea and B. napus, are shown. A typical ancestral region in Amborella is
expected to match up to 72 regions in B. napus (69 were detected for this specific
region). Gray wedges in the background highlight conserved synteny blocks with
more than 10 gene pairs.
2.2 Next generation sequencing (NGS) technologies
NGS technologies enable fast, inexpensive and comprehensive analysis of complex
nucleic acid populations (Metzker 2010). They have opened fascinating opportunities
for the analysis of plants with and without a genome sequence on a genomic scale.
In the last few years, NGS has emerged as a revolutionary genomic tool, which will
provide deep insights and change the landscape of genomics (Zhang et al. 2011).
Nowadays, NGS technology offers to comparative and evolutionary developmental
biologists a way to obtain in large orders of magnitude more developmental gene
expression data than ever before, at a fraction of its former cost. For instance,
several studies have demonstrated the feasibility of NGS for identifying SNPs in
genomes,with asymmetric gene distribution (42,320and 48,847, respectively) and 93% of the diploidgene space in orthologous blocks (fig. S12) (7).We identified 34,255 and 38,661 orthologous genepairs between the An and Cn subgenomes and
their respective progenitor genomes (fig. S13).Comparison of An-Ar andCn-Co orthologous genepairs suggested a divergence 7500 to 12,500years ago (fig. S14), indicating formation of B.napus after this date. Synteny with Arabidopsis
(table S19) confirmed the triplicated mesoploidstructure (9–11) of the An and Cn subgenomes,with the recent allopolyploidy conferring on B.napus an aggregate 72× genome multiplicationsince the origin of angiosperms (Fig. 1) (7).
SCIENCE sciencemag.org 22 AUGUST 2014 • VOL 345 ISSUE 6199 951
Fig. 1. Recurrent genome duplications in B. napus.Genomic alignments between the basal angiospermAmborella trichopoda (24), the basal eudicot Vitisvinifera (25), and the model crucifer A. thaliana, aswell as B. rapa (9), B. oleracea (10, 11), and B. napus,are shown. A typical ancestral region in Amborellais expected to match up to 72 regions in B. napus(69 were detected for this specific region). Graywedges in the background highlight conservedsynteny blocks with more than 10 gene pairs.
Fig. 2. The genome of the B. napus oilseed cul-tivar ‘Darmor-bzh’.The genomecomprises 9 chro-mosomes belonging to the Cn subgenome and 10to the An subgenome, scaled on the basis of theirassembled lengths.Tracks displayed are (A) genedensity (nonoverlapping,window size = 100 kb forall tracks). Positions showing loss of one or moreconsecutive genes are displayed (triangles) alongwith homeologous exchanges, detected asmissinggenomic segments that have been replaced by du-plicates of corresponding homeologous segments(red rectangles). (B and C) Transcription statesestimated by RNA-seq in leaves (B) and roots (C)(in nonoverlapping 100-kbwindows). (D) DNA trans-poson density. (E) Retrotransposon density. (F) CpGmethylation in leaves (green) and roots (brown);both curves are overlapping. (G) Centromeric repeats(densities exaggerated for visual clarity). Homeol-ogous relationships between An and Cn chromo-somes are displayed with connecting lines coloredaccording to the Cn chromosomes.
RESEARCH | REPORTS
5
population studies and gene sequences for use as phylogenetic markers (Ewen-
Campen et al. 2011). NGS technologies are a cost-effective high throughput
approach for sequencing of a very large number of expressed genes even at very
low expression levels (Bentley 2006). Several NGS methods allow larger-scale DNA
sequencing and to date the number of large short-read sequences from NGS is
increasing at exponential rates (Zhang et al. 2011). Currently, five NGS platforms are
commercially available, including the Roche GS-FLX 454 Genome Sequencer, the
Illumina/Solexa Genome Analyzer (this platform was chosen for the present study),
the ABI SOLiD analyzer, Ion Torrent Semiconductor sequencing and the Helicos
HeliScope. These NGS instruments generate different base read lengths, error rates,
and error profiles relative to Sanger sequencing data and to each other. NGS
technologies have increased the speed and throughput capacities of DNA
sequencing and, as a result, dramatically reduced overall sequencing costs (Mardis
2008, Shendure and Ji 2008).
NGS technologies include a number of methods that are grouped broadly as
template preparation, sequencing, imaging, data analysis, and the unique
combination of specific protocols distinguishes one technology from another. This
determines the type of data produced from each platform (Metzker 2010). My focus
in this study was to use the NGS from Solexa/Illumina platform and the protocol I
developed was mainly derived from a method named serial analysis of gene
expression (SAGE). Within the last decade, there has been a rapid improvement of
NGS technologies such as the Solexa/Illumina (Bentley 2006), which allow us
quantification at large scale of mRNA transcripts levels to measure gene expression
at several developmental stages in many plant species (Bräutigam and Gowik 2010).
For instance, since the genomes of Brassica species are relatively large for analysis
by Sanger/capillary electrophoresis sequencing, the B. rapa line Chiifu-401 (492 Mb)
has been completely sequenced using next-generation Illumina sequencing
technologies (Wang et al. 2011). In addition, a short read-base Solexa technology
has already been used for discovery of single nucleotide polymorphisms (SNPs) in B.
napus (Trick et al. 2009). Recently, Bancroft et al (2011) conducted a leaf
transcriptome Illumina sequencing study of a widely used oilseed rape mapping
population, Tapidor x Ningyou7 double haploid (TNDH), to dissect polyploidy.

6
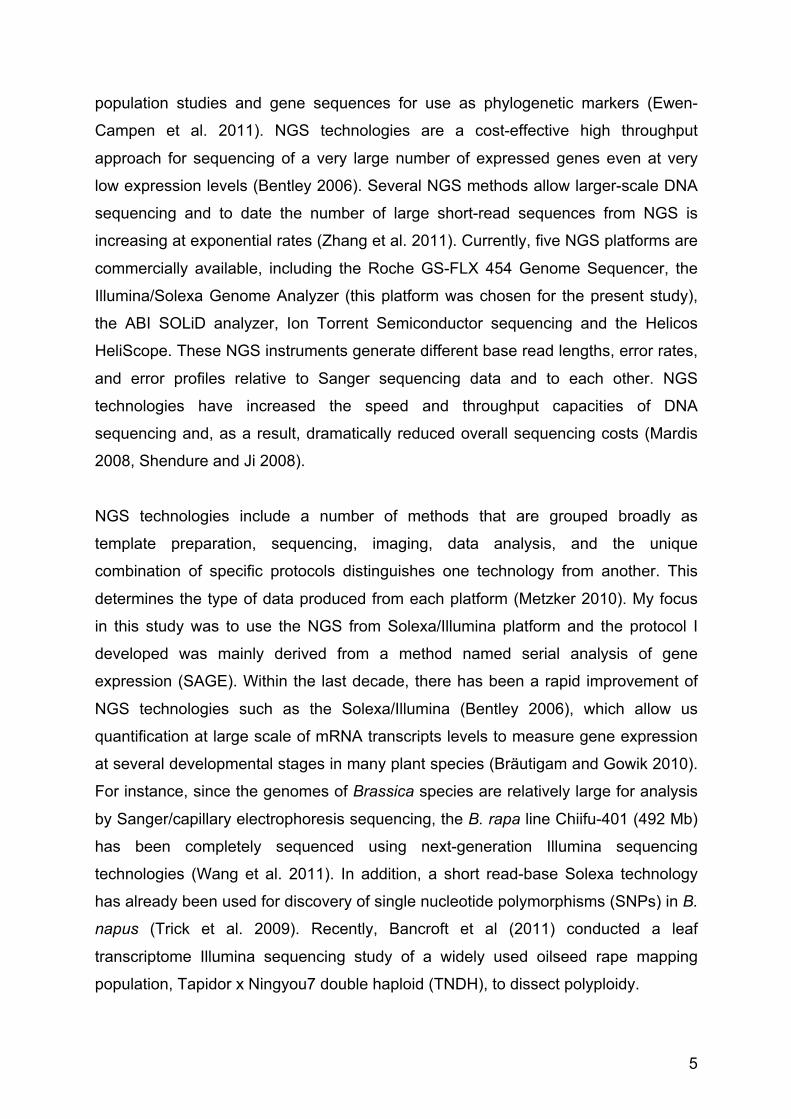
2.2.1 Illumina Genome Analyzer IIx
In 2006, Solexa released the Genome Analyzer IIx (GAIIx), and in 2007 the company
was purchased by Illumina (Liu et al. 2012). The Illumina system utilizes a
sequencing-by-synthesis approach in which all four nucleotides are added
simultaneously to the flow cell channels, along with DNA polymerase, for
incorporation into the oligo-primed cluster fragments (Fig. 3). Specifically, the
nucleotides carry a base-unique fluorescent label and the 3′-OH group is chemically
blocked so that each incorporation is a unique event. An imaging step follows each
base incorporation step, through which each flow cell lane is imaged into tile
segments by the instrument optics. After each imaging step, the 3′ blocking group is
chemically removed to prepare each strand for the next incorporation by DNA
polymerase. This series of steps continues for a specific number of cycles, as
determined by user defined instrument settings, which permits discrete read lengths
of 25–35 bases. A base-calling algorithm assigns sequences and associates quality
values to each read and a quality checking pipeline evaluates the Illumina data from
each run, removing poor DNA sequencing results (Bentley 2006, Mardis 2008).
The single molecule amplification step for the GAIIx starts with an Illumina-specific
adapter library, which takes place on the oligo-derivatized surface of a flow cell, and
is performed by an automated device called a cluster station. The flow cell is an 8-
channel sealed glass microfabricated device that allows bridge amplification of
fragments on its surface, and uses DNA polymerase to produce multiple DNA
clusters, that represent a single molecule that initiated the cluster amplification. A
separate library can be added to each of the eight channels, or the same library can
be used in all eight, or combinations thereof. Each cluster contains approximately
one million copies of the original fragment, which is sufficient for reporting
incorporated bases at the required signal intensity for detection during sequencing.
At first, GAIIx output was 1G/run. Through improvements in polymerase, buffer, flow
cell, and software, in 2009 the output of GAIIx increased to 20 G/run, 30G/run, and
50G/run, and the latest GAIIx series can attain 85 G/run. In early 2010, Illumina
launched HiSeq 2000, which adopts the same sequencing strategy as GAIIx. Its
output initially was 200 G per run, and improved to 600 G per run currently, which
could be completed in 8 days (Liu et al. 2012). MiSeq, a bench top sequencer
launched in 2011, which shared most technologies with HiSeq, is especially

7
convenient for amplicon and bacterial sample sequencing. In comparison with GAIIx,
nowadays 96 dual-index libraries, including control samples, are denatured, pooled in
equal volume, and sequenced by MiSeq (Katsouka et al 2014). Although, GAIIx is
outdated, there are still studies using this platform to perform transcriptome analysis,
as seen in the case of an biofuel crop, Camelina sativa (Mudalkar et al. 2014) or
either the identification of microRNAs (Melnikova et al. 2014). Illumina GAIIx was
used in this study for generation of multiplexed digital gene expression (DGE)
analysis in large plant populations as a cost-effective method for large-scale
quantitative transcriptome analysis (Obermeier et al. 2015). We have described how
adaptation of DGE with barcode indexing in large segregating plant populations of
over 100 genotypes can be applied for successful gene expression network analysis.
2.3 Digital gene expression (DGE)
Combination of NGS and serial analysis of gene expression (SAGE) led into a new
method called DGE. This approach was chosen for this investigation (Obermeier et
al. 2015, Zhang et al. 2011). Moreover, in the past a rapid progress in the DGE
method for sequencing has been achieved, and the data produced have started to
shed light on the understanding of gene expression (Xue et al. 2010, Wang et al.
2010, Eveland et al. 2010, Veitch et al. 2011, Nishiyama et al. 2012). DGE analysis
gave rise to a very suitable method for detecting differential expression in several
organisms and to date many transcriptome studies have been investigated using this
technique (Chen et al. 2012, Wei et al. 2013, Philippe et al. 2014). DGE analysis is a
cost-effective method for large-scale quantitative transcriptome analysis using NGS.
Initially, microarray-based expression platforms were used for quantitative
transcriptome profiling. This type of analyses was mainly performed in model
organisms, whereby the high expense of microarray gene expression experiments
generally limited studies to a few individuals. Recently, cost-effective and high-
throughput transcriptome quantification techniques based on NGS approach has
exceeded microarrays as the method of choice for global transcriptome analysis.
8
Figure 3. The Illumina sequencing-by-synthesis approach (Mardis 2008). (a) Double
stranded cDNA libraries are produced and ligation of specific adapters occurred. (b)
Cluster strands created by bridge amplification are primed and all four fluorescently
labeled, 3′-OH blocked nucleotides are added to the flow cell with DNA polymerase.
9
DGE is a high-throughput sequencing, which has many advantages compared to
conventional microarrays. It generates up to 100 million reads per run under the
GAIIx and up to 1.6 billion 100-base paired-end reads on the HiSeq2000 systems. By
contrast, the MiSeq is for single day experiments, and generates up to 5 million 150-
base paired-end reads. DGE method involves oligo-dT surface-attached beads used
for synthesis of cDNA libraries. This results in the enrichment of the 3' end of
polyadenylated mRNAs (Fig. 4). These are then used for massive-parallel
sequencing of a short tag from the 3’ end of every captured mRNA molecule. The
technique derives from the SAGE protocol, whereby 13-15 bp of concatenated and
cloned tags are sequenced by Sanger sequencing (Velculescu et al. 1995). The
technique was later refined for sequencing of 21 bp fragments in the LongSAGE
protocol (Saha et al. 2002) and 26-27 bp in the SuperSAGE protocol (Matsumura et
al. 2003). The LongSAGE and SuperSAGE procedures were also adapted to NGS
for higher throughput. Library production and Illumina short-read sequencing services
are offered by a number of commercial companies for LongSAGE and SuperSAGE.
Services are also offered by commercial companies with modified protocols to
sequence barcoded 100 bp 3’-fragment cDNA (Torres et al. 2008) or 50-500 bp
assembled 3’-fragment cDNA (Kahl et al. 2012) using Illumina short-read technology.
However, these services were expensive when multiplexing of samples was desired.
In cases where one is solely interested in quantitative data, thus in measuring
transcript levels, it is possible to combine NGS with SAGE (Bräutigam and Gowik
2010). SAGE is characterised by the fact that each transcript within an RNA
population is represented by a certain tag, a DNA fragment of typically 20–26 bp. In
former times, these tags were ligated to longer fragments and sequenced using
Sanger sequencing (Velculescu et al. 1995). Nowadays, with the availability of short
read NGS sequencers like the Illumina GAIIx and Applied Biosystems SOLiD system,
these tags are an ideal template for direct sequencing (Meyers et al. 2004).
In more detail, to generate the DGE tags, the mRNA is converted to double stranded
cDNA, which is bound to a matrix by the polyA tails. The cDNA is restricted using an
enzyme with a four-base recognition site like NlaIII or DpnII. After removal of the 5’
moiety of the cDNAs, an adaptor containing the recognition motif of a type II
restriction endonuclease like MmeI or EcoP15I is ligated. These enzymes cut 21, in
the case of MmeI, or 26 nucleotides, in the case of EcoP15I, downstream of the
recognition site (Matsumura et al. 2008). Following the restriction with such an

10
enzyme, the DNA fragments are recovered and, after addition of a second adapter,
they can be directly used for short read NGS. The abundance of a given DGE tag,
i.e. how often this tag was sequenced, within the collection of tags from a certain
mRNA population, determines the expression level of the corresponding gene
(Matsumura et al. 2003, Meyers et al. 2004). To assign the short sequence tags to
mRNAs and genes, the complete annotated genome sequence, or at least the
complete transcriptome sequence, of the species must be known (Bräutigam and
Gowik 2010). Even the short 21-nt tags generated by an MmeI digest from cDNAs
match mostly once to complex eukaryotic genomes (Simon et al. 2009), allowing the
unequivocal relation of tags and genes. However, it is important to note that this is
not true for B. napus, because of its complex paleopolyploidy structure (Parkin et al.
2005). Nevertheless, if deep coverage transcript profiling is the main focus, then
DGE is a cost-effective alternative compared to RNA-seq.
2.4 Bulked-segregant analysis (BSA)-DGE approach
Bulked-segregant analysis (BSA) is a method established to rapidly identify
molecular markers in specific regions of a genome (Milchelmore et al. 1991, Perez-
Encisco et al. 1998). The underlying principle applied here is the bulking of
individuals from a segregating population into pools each having an alternative
phenotype or genotype at particular locus, or extreme phenotypes for a quantitative
trait are selected to form contrasting bulks with the aim of finding differentially
expressed genes (Fernández-del-Carmen et al. 2007, Kloosterman et al. 2010, Chen
et al. 2011). Transcript profiling analyses has the potential to identify candidate
genes associated with complex traits and provide a direct relationship with the
involved underlying molecular mechanism (Fernández-del-Carmen et al. 2007).
However, it should be taken into account that the number of differentially expressed
genes identified between contrasting pools would depend on the pool size,
population structure and the trait targeted. Global patterns of gene expression can be
used to select for candidate genes based on the hypothesis that a key regulatory
gene will be up-regulated or down-regulated depending on the specific trait of
interest.

11
Figure 4. Protocol description of the digital gene expression (DGE) method (modified
after Veicht et al. 2010). (1) Polyadenylated RNA is isolated on beads with oligo(dT).
(2) First strand cDNA is synthesized. (3) Second strand synthesis. (4) cDNA is
digested with DpnII. (5) 3’ fragments are isolated. (6) An adapter containing a MmeI
site is ligated to the digested cDNA. As adapter attachment occurs while the cDNA is
still attached to beads only one adapter can be ligated to a single cDNA molecule. (7)
The ligated product is then digested with Mme I which recognizes within the linker
sequences and cuts 21 bp further downstream, generating a single tag per transcript,
which is released from the beads. (8) The fragments are isolated. (9) Adapters are
ligated to the fragments. (10) The ligated product is then sequenced using Illumina
sequencing technology, generating a 21bp sequence for each transcript. (11) Tags
are quantified (12) Tag sequences are aligned to the transcriptome EST database.

12
The identification of the responsible genes, their allelic variation and modes of action
underlying phenotypic complex trait variation has proved to be difficult due to a lack
of understanding of the pathways involved or the complexity of the trait itself. For
instance, an approach for gene mapping via bulked segregant RNA-seq (BSR-Seq)
has been reported for finding global patterns of gene expression and candidate
genes based on the fact that the causal gene will often be down or up-regulated in
the mutant bulk as compared to the non-mutant bulk (Liu et al. 2012). Livaja et al
(2013) reported the successful combination of BSA and NGS for SNP discovery in
sunflower. In addition, identification and characterization of Mini1, a gene regulating
rice shoot development was realized through application of BSA (Fang et al. 2014).
Recently, Ramirez-Gonzalez et al (2014) also reported RNA-Seq bulked segregant
analysis for enabling the identification of high-resolution genetic markers associated
with a major disease resistance gene for wheat yellow rust (Yr15) for breeding in
wheat.
2.5 Weighted gene co-expression network analysis (WGCNA)
Co-expression network analysis is a well-accepted statistical methodology for the
study of large-scale gene expression datasets (Horvath et al. 2006, Oldham et al.
2006). As a network strategy that has been long applied, WGCNA is an easily
approach for network modelling based on simple correlation procedure for clustering
genes by their expression patterns. WGCNA helps us to identify highly connected
genes (Zhang and Horvath 2005, Langfelder and Horvath 2008), and to finally
associate these specific regulatory genes with the phenotypic complex trait
(Keurentjes et al. 2007, DiLeo et al. 2011, Basnet et al. 2013, Körber et al. 2014).
Gene co-expression network are increasingly used to explore the system-level
functionality of genes (Zhang and Horvath 2005). Therefore, network based methods
have been found useful in gene co-expression networks (Stuart et al. 2003, Carter et
al. 2004). WGCNA extends the pairwise co-expression analysis to produce a
measure of gene connectivity followed by the clustering of densely interconnected
genes into modules. The expression of each module is characterised by its
eigengene value, thereby reducing the gene network into an eigengene network
(Langfelder 2007). This method has been shown to produce a biologically meaningful
network. The modules within the network maintain a consistent correlated expression

13
relationship independent from phenotype or environmental condition and have been
found to be associated with specific biological processes or pathways. The modules,
characterised by their eigengene value, can be correlated with trait measurements.
Module-centric analysis can be used to understand the biological processes
associated with the trait. Genes that are found to be “central” within the module
(intramodular hubs) are candidates for key regulators associated with the trait.
WCGNA has been used successfully to link molecular targets to oncogenic signals
(Hovath 2006), complex traits (Fuller 2007) and even network divergence between
human and chimpanzee neural patterns (Oldham 2006). In gene co-expression
networks, each gene corresponds to a node. Each co-expression network
corresponds to an adjacency matrix. The adjacency matrix encodes the connection
strength between each pair of nodes (Zhang and Horvath 2005). To start the
WGCNA, one needs to define a measure of similarity between the gene expression
profiles. This similarity measures the level of concordance between gene expression
profiles across the experiments.
Once the modules have been defined, one can specify additional network concepts,
e.g. the intramodular connectivity and consequently the modules and their highly
connected (hub) genes, which are often related to traits of interest. Basically, each
pair of genes i and j denotes a similarity measure from Sij. To transform the similarity
matrix into an adjancency matrix, one needs to define an adjacency function. This
choice determines whether the resulting network will be weighted (soft-treshholding)
or unweighted (hard tresholding). In many real networks, the probability that a node
is connected with k other node (the degree distribution p(k) of a network) decays as a
power law p(k) k-, which defines the property of scale-free networks (Barabasi and
Albert 1999). Scale-free networks are extremly heterogeneous, their topology being
dominated by a few highly connected nodes (hubs), which link the rest of the less
connected nodes to the system (Zhang and Horvath 2005). For instance, analysis of
the yeast protein-protein interaction network revealed that highly connected nodes
are more likely to be essential for survival (Carter et al. 2004). The mergence of
power-law distribution (scale free topology) is intimately linked to the growth of the
network in which new nodes are preferentially attached to already established nodes,
a property that is also thought to characterize the evolution of biological systems

14
(Barabasi and Albert 1999). Evidence shows that the scale-free topology of protein
interaction networks originates from gene duplication (Barabasi and Oltvai 2004).
Since the coordinated co-expression of genes encodes interacting proteins, studying
co-expression patterns can provide insight into the underlying cellular processes
(Eisen et al. 1998). It is a standard to use the (Pearson) correlation coefficient as a
co-expression measure, e.g., the absolute value of Pearson correlation is often used
in a gene expression cluster analysis (Zhang and Horvath 2005). However,
topological overlap matrix (TOM) weighted co-expressions are used to construct
networks on the dataset to define transcriptional modules (Zhang and Horvath 2005,
Langfelder and Horvath 2008). The actual connectivity of features (topology) of the
network is indicated by their position in a dendrogram and a correlation heat map
where features are clustered into co-expressed modules, enabling appreciation of the
whole dataset. Generally, module assignment is performed to minimize the number
of features contained in each module, and therefore the total number of modules
identified. Briefly, each module is obtained through a correlation heat map and is
noted by a unique colour, thus summarizing a network with a limited number of
modules which reduce the complexity of a dataset from hundreds of expressed
genes or metabolites to a small module, which then can be analyzed with more
statistical power.

15
3 Materials and Methods
3.1 Plant material A doubled haploid (DH) population of 250 lines from the cross Express617 x V8 was
used for selection of 96 DH lines, plus parents and F1. Express617 was derived by
selfing of the elite double-zero seed quality (zero eurcic acid, low glucosinolate
content) WOSR variety Express (Norddeutsche Pflanzenzucht Hans-Georg Lembke
KG, Hohenlieth, Germany). The parental semisynthetic line V8 was derived from a
resynthezised B. napus produced via embryo rescue from an interspecific cross
between the Indian turnip rape Yellow Sarson variety YSPb-24 (B. rapa ssp.
triloculoris) and the cauliflower (B. olerarcea L. convar. Botrytis) accession Super
Regama (Lühs and Friedt 1995a) backcrossed to a high erucic acid breeding line
(Lühs and Friedt 1995b). Extensive phenotype and QTL data were available for
seedling development, heterosis, seed yield and various yield related traits in the
ExV8-DH population. The ExV8-DH population, along with the parental genotypes,
has been tested for different seedling traits in greenhouse trials, then for yield traits in
large-scale field trials at four locations for 2 years. The locations used were
Rauischholzhausen and Grund-Schwalheim in Middle Hesse, along with Reinshof
and Einbeck in Lower Saxony (Basunanda et al. 2007, Basunanda et al. 2010).
In more detail, besides the parental lines and F1, 48 ExV8-DH lines with the highest
and 48 with the lowest shoot fresh weight measured at 28 days after sowing, were
selected for parallel transcriptome and hormone analysis. The total 96 ExV8-DH
lines, Express 617, V8 and their F1 were grown under controlled conditions in a
climate chamber with 16h/8h, 20°C/15°C, relative humidity (RH) 55% day/night,
respectively. Seeds were sown in Jacobsen germination vessels and seedlings were
harvested at two time points, 8 and 12 days after sowing (DAS). Two experimental
replications were performed under identical growth climate chamber conditions.
Harvesting of 100 seedlings for RNA extraction was realised within one hour to
prevent alteration of daytime circadian clock gene expression during transcriptome
analysis. All samples were immediately shock-frozen into liquid nitrogen and stored
at -80°C until RNA extraction.
In addition, harvesting of 15 seedlings (~ 50 mg) per genotype was performed very
rapidly and frozen immediately in liquid nitrogen to avoid metabolite changes caused

16
by enzymatic reactions connected to the handling and wounding of the plants. Both
harvesting procedures were done within one hour and simultaneously for both
replicates to avoid circadian clock effects and strong fluctuations in the metabolite
profile. After harvesting and shock-frozen, seedlings samples were stored at -80°C
until freeze-drying lyophilization process. A total of 198 rapeseed seedlings samples
(~50 mg each), were freeze-dry lyophilized simultaneously on the CHRIST LOC–1m
Alpha 1–4 freeze-dryer at -55°C and pressure 165 Pa in a 48–72 h period to be
utilized for hormone metabolite analysis.
3.2 Isolation of total RNA 200 mg of plant material stored at -80°C was ground to a fine powder in a pre-cooled
mortar with pistil, using liquid nitrogen. The sample was transfer into a precooled 2-
ml microcentrifuge tube, using a precooled spatula. To avoid thawing of the plant
material tubes to -20°C were used until a manageable set of samples is ground. Total
RNA was isolated using cold (4°C) TRIzol (Life Technologies, Carlsbad, California,
USA) reagent following manufacter instructions. Total RNA concentration and a
quality check were estimated by using a Nanodrop spectrophometer.
3.3 DpnII-DGE libraries construction
Dynabeads OligodT(25) beads (Life Technologies, Carlsbad, California, USA) were
resuspended following manufacturer instructions and DGE-DpnII protocol was
realized following Obermeier et al (2015). Complementarily barcoded
oligonucleotides, HPLC-purified and 5’-modified, were mixed in equal concentrations
(10 µM of ‘a’ and ‘b’ oligonucleotide for each barcode) to produce a GEX1 barcode
adapter (Eurofins MWG, Operon, Ebersberg, Germany). The original GEX1 Illumina
adapters were modified by introducing 4 bp barcodes after the DpnII restriction and a
6 bp MmeI recognition site. The following 4 bp bases were used as barcodes for
multiplexing of 8 samples for subsequent pooling: AGCT, GTAC, CATG, TCGA,
ATGC, GACT, CGTA, and TCAG. GEX1 adapter was ligated to the 5’ end of the
DpnII-digested bead-bound cDNA fragments. Barcodes in the oligos used for GEX
adapter 1 production are underlined in Table 1.
17
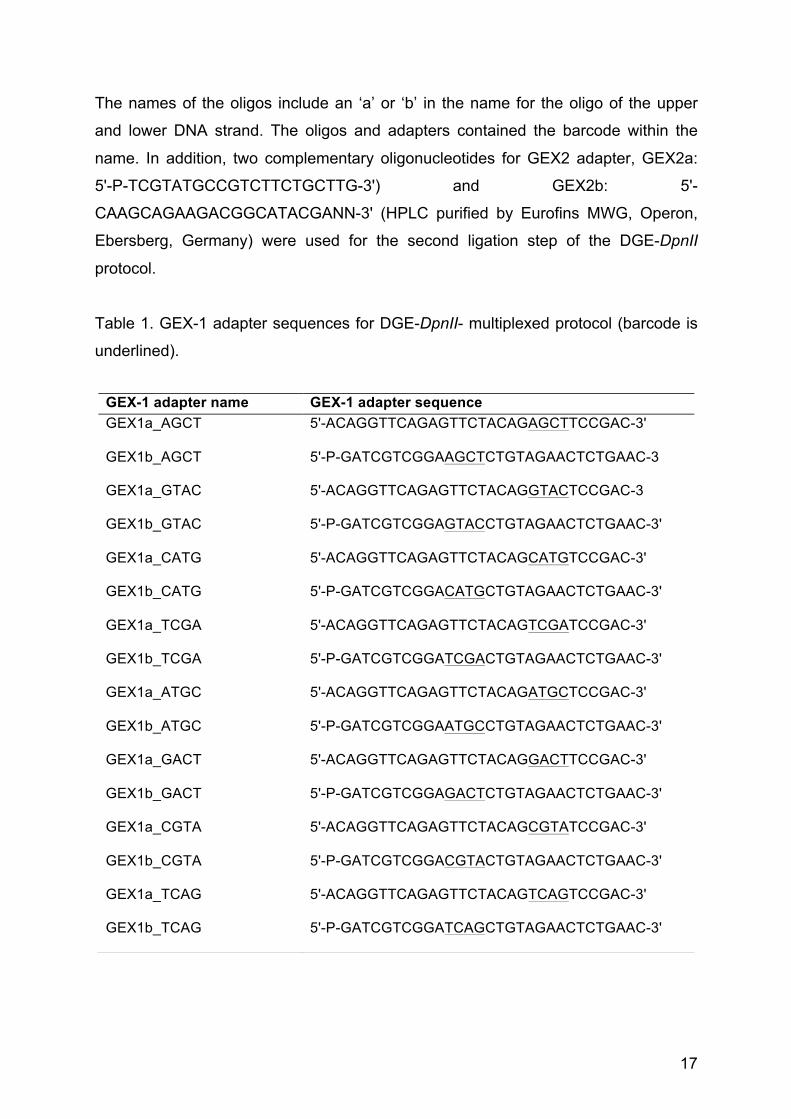
The names of the oligos include an ‘a’ or ‘b’ in the name for the oligo of the upper
and lower DNA strand. The oligos and adapters contained the barcode within the
name. In addition, two complementary oligonucleotides for GEX2 adapter, GEX2a:
5'-P-TCGTATGCCGTCTTCTGCTTG-3') and GEX2b: 5'-
CAAGCAGAAGACGGCATACGANN-3' (HPLC purified by Eurofins MWG, Operon,
Ebersberg, Germany) were used for the second ligation step of the DGE-DpnII
protocol.
Table 1. GEX-1 adapter sequences for DGE-DpnII- multiplexed protocol (barcode is
underlined).
GEX-1 adapter name GEX-1 adapter sequence GEX1a_AGCT 5'-ACAGGTTCAGAGTTCTACAGAGCTTCCGAC-3'
GEX1b_AGCT 5'-P-GATCGTCGGAAGCTCTGTAGAACTCTGAAC-3
GEX1a_GTAC 5'-ACAGGTTCAGAGTTCTACAGGTACTCCGAC-3
GEX1b_GTAC 5'-P-GATCGTCGGAGTACCTGTAGAACTCTGAAC-3'
GEX1a_CATG 5'-ACAGGTTCAGAGTTCTACAGCATGTCCGAC-3'
GEX1b_CATG 5'-P-GATCGTCGGACATGCTGTAGAACTCTGAAC-3'
GEX1a_TCGA 5'-ACAGGTTCAGAGTTCTACAGTCGATCCGAC-3'
GEX1b_TCGA 5'-P-GATCGTCGGATCGACTGTAGAACTCTGAAC-3'
GEX1a_ATGC 5'-ACAGGTTCAGAGTTCTACAGATGCTCCGAC-3'
GEX1b_ATGC 5'-P-GATCGTCGGAATGCCTGTAGAACTCTGAAC-3'
GEX1a_GACT 5'-ACAGGTTCAGAGTTCTACAGGACTTCCGAC-3'
GEX1b_GACT 5'-P-GATCGTCGGAGACTCTGTAGAACTCTGAAC-3'
GEX1a_CGTA 5'-ACAGGTTCAGAGTTCTACAGCGTATCCGAC-3'
GEX1b_CGTA 5'-P-GATCGTCGGACGTACTGTAGAACTCTGAAC-3'
GEX1a_TCAG 5'-ACAGGTTCAGAGTTCTACAGTCAGTCCGAC-3'
GEX1b_TCAG 5'-P-GATCGTCGGATCAGCTGTAGAACTCTGAAC-3'

18
3.4 PCR enrichment of DpnII-DGE adapter-ligated cDNA
A PCR Master Mix was prepared and distributed in wells of 96 well PCR plate. The
total volume per reaction was 25 µl including 16 µl water, 5 µl Phusion HF buffer
(5X), 0.25 µl GEX1_PCR_1 primer (25 µM), 0.25 µl GEX_PCR_2 primer (25 µM),
0.75 µl dNTPs (10 mM), 0.25 µl Phusion Hot Start DNA Polymerase (2 U/µl)
FINNZYMES (New England Biolabs Inc., Ipswich, MA, USA) and 2.5 µl of GEX2
Adapter 2-ligated cDNA to each well. Amplification in thermal cycler using the
following program: 30 seconds at 98°C, 13 cycles of: 10 seconds at 98°C, 30
seconds at 60°C, 15 seconds at 72°C, 10 min at 72°C, hold at 4°C was performed.
Expected sizes were 93 bp for the targeted GEX1-tag-GEX2 fragment and smaller
sizes for artifacts including 76 bp for GEX1-GEX2 adapter ligation, 30 bp for GEX1
adapater, 23 bp for GEX2 adapter fragment plus PCR primer dimers. The
GEX_PCR_1 (5'-CAAGCAGAAGACGGCATACGA-3') and GEX_PCR_2 (5'-
AATGATACGGCGACCACCGACAGGTTCAGAGTTCTACAG-3') primer sequences
were used for amplification. Identification and purification of the 93 bp fragment
compared to the other non-targeted fragments were realized by a 12%
polyacrylamide gel electrophoresis (PAGE).
3.5 Validation of libraries Library quality was checked on an Agilent Technologies 2100 Bioanalyzer using
chips from the Agilent DNA 1000 kit (Agilent Technologies, Inc., Santa Clara, CA,
USA). The procedure involved loading one µl of the resuspended DNA following the
manufacturer’s protocol. The size, purity, and concentration of the sample were
analysed. From the measured concentrations the approximate total yield in ng and
the total amount in pmol were calculated. For calculation of the average molar mass
for one base pair (650 g/mol) x 93 bp = 60,450 g/mol was used. A minimum of 2 µl of
the sample was diluted up to 10 nM using the Qiagen elution buffer (from QIAGEN
PCR Purification Kit) supplemented with 0.1% Tween 20. Additional validation of the
10 nM diluted DNA libraries were realised by running a High Sensitivity DNA Assay
Chip (Agilent Technologies, Inc., Santa Clara, CA, USA) on an Agilent Technologies
2100 Bioanalyzer, to determine the exact final concentration of the diluted sample.

19
3.6 Illumina sequencing and data analysis For sequencing of the barcoded libraries in 8-plex mixes in the Illumina Genome
Analyzer IIx (Cluster Station/cBO), the Illumina standard protocol and chemistry have
been applied by the ServiceXS Company (Leiden, The Netherlands). The protocol
can also be adapted for sequencing on the HiSeq2000 and MiSeq platform. The
required amounts and concentrations of the 8-plex samples were 20 µl of 10 nM 8-
plex sample (0.64 ng/µl) in Qiagen elution buffer (Tris-HCl, 10 mM, pH 8.5)
supplemented with 0.1 % Tween 20.
Each single library was adjusted to an equal molarity of 10 nM based on Agilent DNA
1000 kit measurements on the Agilent 2100 Bioanalyzer. Concentrations were
rechecked and readjusted by using the High Sensitivity DNA Assay (Agilent
Technologies, Inc., Santa Clara, CA, USA). Eight libraries were pooled with different
barcodes by taking 2.5 µl from each library. A total of 6.5 pmol of DNA has been
used for sequencing. In addition, a 30 µM solution of a custom sequencing primer
GEX_seq (HPLC purified GEX_seq: 5'-GACAGGTTCAGAGTTCTACAG-3') was
provided. Primary and part of secondary data analysis including image analysis, base
calling and quality check were performed with the standard software, Illumina
Genome Analyzer, the data analysis pipeline Real Time Analysis v1.8.70.0 and
CASAVA v1.7.0.
3.7 Bulked-segregant analysis-DGE
The first step of BSA-DGE analysis strategy was to remove the parental lines and the
heterozygotes lines from the data set. The second step was collapsing the A and C
unigenes IDs (189k) by calculating the mean of both measurements. The expression
values of homoelogue unigenes were collapsed, calculating the mean of the
expression values of the two measurements. Collapsing means average of all
observations to make a single record of the expression values within the DGE-data
set. To identify differentially expressed genes for each trait, two groups were
selected. Each group with 20 individuals, which have the highest and the lowest
phenotypic value measurements for the specific trait. The normalised DGE data were
log2- transformed, and for each Unigene the ratio of the mean expression values of
the two groups was calculated.
20
Additionally, a student’s t-test was calculated to assign the significance for the
differences. Differentially expressed genes were selected based on a fold-change of
2 and a p-value < 0.05. To identify genes differentially expressed upon BSA for the
each of the two bulks, differentially expressed tags were analyzed by comparison of
the 8 and 12 DAS expression data. Normalised DGE values were first transformed to
log values and scored with a p-value (p<0,05) threshold to assess the significance of
differentially expressed genes. DGE-tags previously mapped to the set of 155k
Brassica unigenes for A and C genomes (Trick et al. 2009) was used for annotation
to the Arabidopsis thaliana genome, based on sequence similarity with the
Arabidopsis Genome Initiative (AGI) gene model.
3.8 Weighted gene co-expression network analysis (WGCNA)
Weighted gene co-expression network analysis was performed using the WGCNA R
package as described by Langfelder and Horvath (2008). The R scripts and tutorials
are available on the following website
http://www.genetics.ucla.edu/labs/horvath/CoexpressionNetwork/Rpackages/WGCN
A/Tutorials/index.html. First, the absolute value of the Pearson correlation coefficient
was computed for all pairs of genes in the data set. A rising of these correlations to a
soft-thresholding power (β = 5) to approximate scale free topology within the network
was done. From these scaled correlations, calculation of the topological overlap (TO)
between all genes, which summarizes the degree of connections between pairs of
genes, was realized. Genes were then clustered using dissimilarity based on
topological overlap in both datasets using the WGCNA function blockwise
Consensus Modules. If not stated differently, all analyses were performed with the
statistical software R (R Development Core Team, 2011).

21
4 Results
4.1 Multiplexing of ExV8-DH population with DGE-DpnII Ilumina
sequencing
In this study, it was of great importance to apply this new multiplexing DGE method in
order to perform deep transcriptome analysis and explore the large complexity
transcriptome of the winter oilseed rape (Brassica napus L.) doubled haploid (DH)
population Express 617xV8 (ExV8-DH) at seedling development stage. The
multiplexed DGE protocol described here is a cost-effective and massive parallel for
production of DGE libraries with 21 bp tag length (Obermeier et al. 2015) for plant
mapping populations with 96 genotypes, applying 8-plex barcoding for sequencing in
12 flow cells on Illumina systems GAIIx. Although, the GAIIx is becoming an old
technology compared to HiSeq2000 platform, I was still able to use it for multiplexing
of lines, reducing costs and time.
The number of unique DGE-tag sequences detected represented the quantitative
expression level of the corresponding transcript for each genotype. This DGE-
multiplexing protocol involved costs for synthesis of 16 oligonucleotides (29/30 bp in
length) by a commercial service provider for production of 8 barcoded GEX1
adapters. For higher-level multiplexing, e.g. for parallel sequencing of 64 samples in
one flow cell, costs for synthesis of oligonucleotides would increase when more
variants of adapter P1 are used (costs for 128 oligonucleotides).
This would exceed sequencing costs per flow cell and is only cost-effective for usage
of these adapters in a larger number of DGE projects. Barcoded adapters GEX1
were used in different combinations to reduce oligonucleotide synthesis costs (16
instead of 128 oligonucleotides required to produce 8 barcoded GEX1 adapters for
parallel sequencing of 64 samples in one flow cell). In addition, to reduce costs
during synthesis of cDNA, E.coli DNA ligase that helps to produce longer cDNAs,
which is included in the Invitrogen LongSAGE and Morrissy (2010) protocols for 2nd
strand synthesis, was removed due to high costs when applied to multiple samples.
The E. coli DNA Polymerase amount was reduced from originally 200 to 20 units per
reaction to reduce costs in multiplexing. Also, the E. coli RNase H amount was
reduced from originally 10 to 0.8 unit per reaction to reduce costs in multiplexing
22
according to the concentrations recommended by the manufacturer. With current
sequencing outputs the technique generated more than 25 million tags per flow cell,
around of 3 million tags per individual, giving highly quantitative data even for low-
abundance transcripts. This multiplexed DGE protocol applied barcoding by using 4 x
8 oligonucleotides for adapter GEX1 production, enables parallel sequencing of 8
barcoded samples in one GAIIx flow cell. The protocol can easily be adapted to the
increasing higher sequence read output of 2nd generation Illumina new sequencing
machines (i.e. MiSeq, HiSeq), based on improvement of the hardware or the
sequencing chemistry. The number of targeted reads per individual should be based
on the transcriptome size and complexity of the studied organism. Finally, in this
work, an adaptation of DGE method with barcode indexing in large segregating plant
populations of nearly 100 genotypes was successful applied to generate enough
DGE quantitative data to be used in further weighted gene correlation network
analysis (WGCNA) and bulked segregant analysis (BSA)-DGE approach.
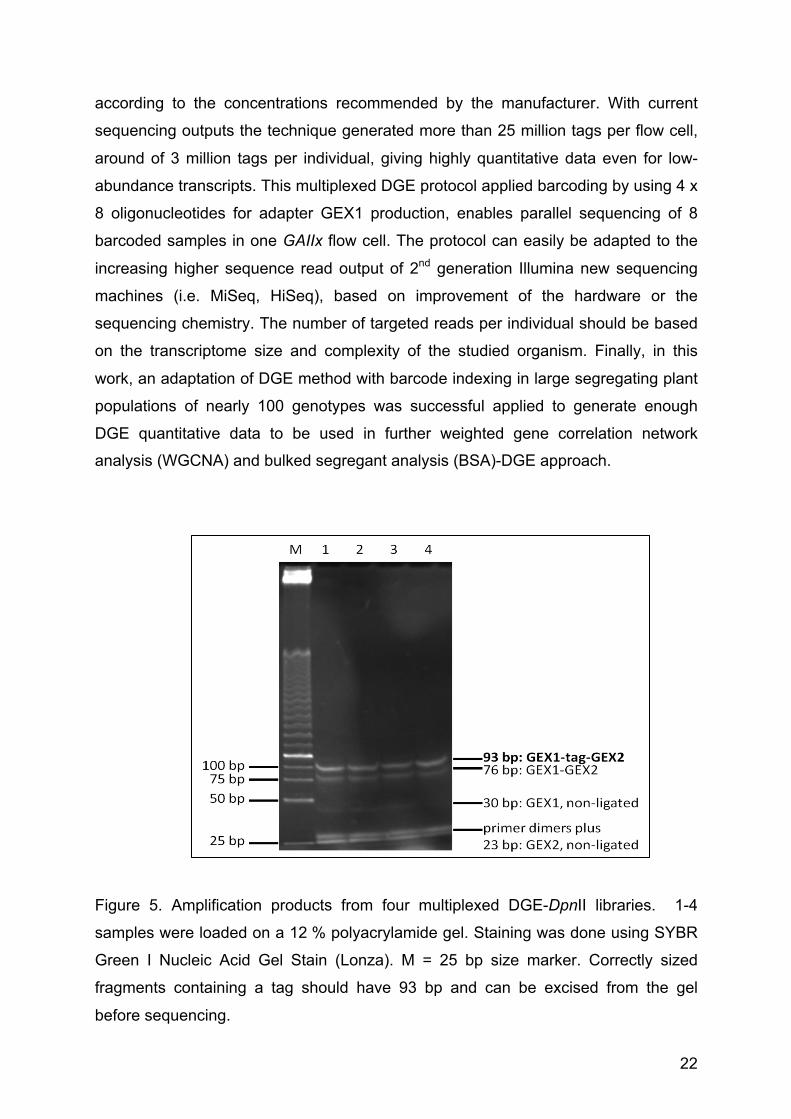
Figure 5. Amplification products from four multiplexed DGE-DpnII libraries. 1-4
samples were loaded on a 12 % polyacrylamide gel. Staining was done using SYBR
Green I Nucleic Acid Gel Stain (Lonza). M = 25 bp size marker. Correctly sized
fragments containing a tag should have 93 bp and can be excised from the gel
before sequencing.
23
Figure 6. DGE-tag (10 nM) diluted DNA running under the High Sensitivity DNA
Assay Chip (Agilent Technologies 2100 Bioanalyzer).
4.2 DGE data analysis, mapping to Brassica unigenes and
normalisation
DGE-data consisting of millions of sequence reads was processed to remove adapter
sequences from the reads using the Illumina data analysis pipeline v1.7. by the
ServiceXS company (Leiden, The Netherlands) using custom Perl scripts. Since
DGE libraries were multiplexed using eight different nucleotides barcode
combinations, removing of the barcode IDs from the sequences and placing them
into the ID name of the samples was done. The read length was then reduced to 32
bp. These raw reads were filtered by quality, keeping only sequences having a
minimum Phred score of 15 with no more than one ‘N’ in the read. Basically, quality-
filtered data was split based on the adapter sequences at the 5’ and 3’ end of the
reads.
Reads having ‘TCCGACGATC’ (6-base tagging enzyme MmeI plus 4-base DpnII
recognition site) sequence were separated from those not having this sequence.
Then these selected reads were trimmed (10 bases) at their 5' end in order to

24
remove adapter 1. After trimming, the length of the reads resulted in 22 bp. After
this, reads were separated based on the ‘TCGTAT’ sequence in their 3’ end. Then
this same reads were trimmed (6 bases) at their 3' end to remove adapter 2. After
trimming the length of the reads is finally 16 bp (without the 6 bp restriction site).
These were removed to make the reads specific as a part of a sequence.
All 16 bp quality filtered tags were mapped to the Brassica unigenes reference
‘cured’ to the diploid genomes (Higgins et al. 2012). Unigenes corresponded to all
available Brassica species ESTs (expressed sequence tags) downloaded from the
GenBank. A set of 94,558 brassica unigenes that have been assembled from
approximately 810,000 public EST from brassica species was used. Mainly, they
consisted of three principal sets of B. napus (567,240), B. rapa (180,611) and B.
oleracea (59,696) (Trick et al. 2009). The cured reference sequence was constructed
by combining two ‘cured’ reference sequences based on mRNA-seq libraries of B.
rapa and B. oleracea. Thus creating a reference sequence containing both the A and
C variants of each unigene. Libraries prepared from B. rapa and B. oleracea RNA
samples were each run on two lanes of the Illumina Genome Analyzer GAIIx for 80
cycles.
The FASTQ files from the two lanes were combined generating a total of 46,120,559
reads for B. rapa and 49,268,765 reads for B. oleracea. The 80 base reads were split
into two files, each containing a set of 40 base reads using the Perl script
illumina_split_read.pl. The 40 base reads were used separately to cure the naive
reference sequence to an A genome version and a C genome version, described as
follows. Using the Perl script cure_cycle_split.pl the 40 base reads were aligned
against the naive reference sequence to produce a map file. The map files generated
by alignment of the first and second sets of 40 base reads were merged using MAQ
map merge and a consensus sequence. The Perl script, cure_ref-seqs.pl, was used
to cure the naive reference using the consensus sequence. This process was
iterated over six cycles after which there was no significant gain in alignment
efficiency. On each iteration, bases were replaced in the reference, where these
differed from high quality consensus bases called by MAQ (i.e. contributed by a read
depth greater than 3, with quality values greater than 40). This process resulted in
the production of an A genome and C genome version of the naive reference, these
two sequences were compared at each base position using the Perl script

25
compare_sequences.pl to give a list of positions within unigenes where the base
differed in the two sequences. The cured reference sequence was constructed by
combining the two ‘cured’ reference sequences, thus creating a reference sequence
containing both the A and C variants of each unigene (Higgins et al. 2012).
Tag-to-gene matching was performed using the 16-bp long filtered reads under
FASTAQ format to fit the pipeline. Mapping against the Brassica unigenes cured
reference was performed using Bowtie aligner software, allowing only one single
mismatch in the reads to increase the number of tags matching the reference
sequence. Aligned reads were used to create a final output under TXT format for
each DGE library, in which a list of unigenes, with the corresponding tags mapping to
them and their respectively tag count frequencies, is presented. For further weighted
gene co-expression network analysis (WGCNA) and bulked-segregant analysis
(BSA), the number of tags for each gene was calculated and normalised to transcript
read tags per ten million total tag reads.
DGE-data from 2 x 99 libraries for two time-points (including 2 parents, Express and
V8, and their F1) were normalised following the three-step pipeline procedure used
for LongSAGE data (Obermeier et al. 2009). To achieve this, mapped-DGE to
Brassica unigenes output under TXT format were loaded into a MySQL database
(version 5.0.41, running under BioLinux 5.1 Ubuntu12.8) for the ExV8 DGE-Data.
The MySQL database was linked to the phpMyAdmin interface to enable viewing of
data subsets. Two DGE-Data sets, DGE_8DAS and DGE_12DAS (DAS = days after
sowing) were normalised following identical pipelines. Processing and data
normalization was handled through the use of Perl and MySQL scripts.
Singlets were removed before normalisation base on the fact that they are likely to
represent sequencing errors and with no statistical support for their presence. DGE-
data was normalised to transcript tags per ten million tags to facilitate comparisons
among libraries. The number of tags per library has been in average more than two
million per library. Therefore, I chose to normalise the tag counts to ten million.
Normalising takes place to ensure that comparisons across our DGE libraries reflect
biological differences and not merely differences in the total number of tags
sequenced. In DGE analysis, comparisons between large libraries facilitate the
detection of significant differential expression for genes expressed at low levels.
Therefore, for a gene expressed at given rate, increasing the sampling size leads to
26
higher tag counts, and allows more stringent statistical inferences to be made for the
same proportional variation (Audic and Claverie, 1997).
To normalise the tag distribution per DGE library, a normalisation factor for all
individual DGE libraries was calculated. For this, we first calculated the total sum of
each tag counts per DGE library. Then, we were able to calculate the normalisation
factor for each library by dividing 10 million by the sum of total tag counts per library.
This resulting factor is then used to multiply each tag count frequency value to be
normalised. After this, we obtained all the tag counts that were normalised to ten
million per DGE library. The second step of our pipeline was averaging of normalised
transcript counts that matched more than one unigene. These multiple matches
underline the complex paleopolyploid structure of the B. napus genome.
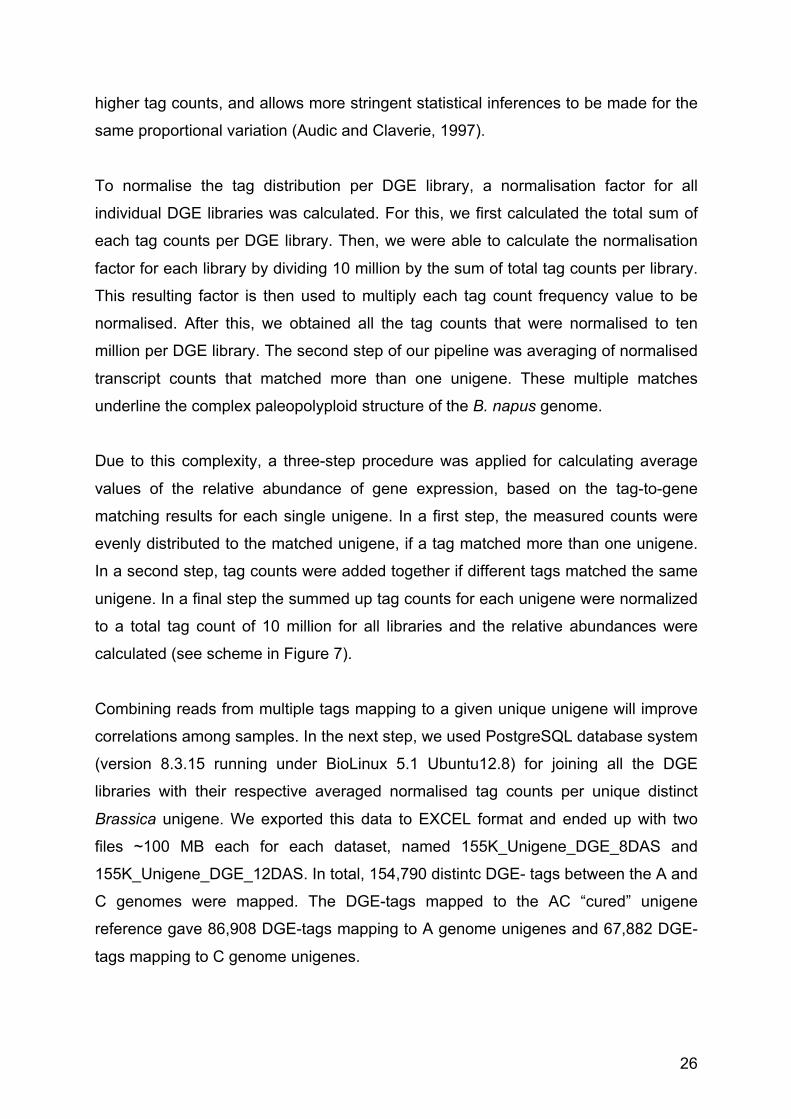
Due to this complexity, a three-step procedure was applied for calculating average
values of the relative abundance of gene expression, based on the tag-to-gene
matching results for each single unigene. In a first step, the measured counts were
evenly distributed to the matched unigene, if a tag matched more than one unigene.
In a second step, tag counts were added together if different tags matched the same
unigene. In a final step the summed up tag counts for each unigene were normalized
to a total tag count of 10 million for all libraries and the relative abundances were
calculated (see scheme in Figure 7).
Combining reads from multiple tags mapping to a given unique unigene will improve
correlations among samples. In the next step, we used PostgreSQL database system
(version 8.3.15 running under BioLinux 5.1 Ubuntu12.8) for joining all the DGE
libraries with their respective averaged normalised tag counts per unique distinct
Brassica unigene. We exported this data to EXCEL format and ended up with two
files ~100 MB each for each dataset, named 155K_Unigene_DGE_8DAS and
155K_Unigene_DGE_12DAS. In total, 154,790 distintc DGE- tags between the A and
C genomes were mapped. The DGE-tags mapped to the AC “cured” unigene
reference gave 86,908 DGE-tags mapping to A genome unigenes and 67,882 DGE-
tags mapping to C genome unigenes.
27
Figure 7. An example of different DGE-tag mapping scenarios within the complex
polyploid B. napus genome using Brassica unigenes and strategy for processing data
for estimation of quantitative gene expression analysis. Three different scenarios are
shown for alignment of three different 16/21 bp tag which occur 10 and 22.5 times in
one particular library: a) the two tags (red and green) match highly specific to a single
unigene, b) one of the tags (red) matches with the same e-values to two different
unigenes due to the presence of highly homeologous or paralogous copies in the B.
napus genome, the other one (green) matches highly specific to Unigene A, c) the
red and green tag match to two to four unigenes. If tags match more than once their
tag counts are evenly distributed to the matched unigenes, e.g. 5 counts for the red
tag to Unigene A and to Unigene B in scenario b). Matches of more than one tag to a
specific Unigene are summed up: see calculations below Unigenes A to D in
scenarios b) and c).

28
4.3 Bulked-segregant analysis of DGE (BSA-DGE) data revealed
differential expression of genes for complex traits
The second aim of this study was to identify differentially expressed genes linked to
complex traits based on best and worst performing genotypes within the ExV8-DH
mapping population. To achieve this I used a combination of DGE, phenotypic and
hormone metabolite data together with bulked-segregant analysis (BSA), to generate
a closer insight into the putative candidate genes related to complex traits. Selection
of bulks was based on field and greenhouse phenotypic data for the ExV8-DH
mapping population. Twenty individuals from each of the best and worst performing
genotypes were selected to construct the bulks. For each of the 20 investigated traits
(Table 2) the 20 best and 20 worst performing individuals, respectively, were
assigned to bulks with significant phenotypic variance using a simple t-test and P <
0.05.
In total, 40 individuals from each of the two time points, 8 and 12 DAS respectively,
were analysed. Differentially expressed genes between the bulks were considered
significant when differential expression values were greater than 2-fold change (FC >
2) and a significant P-value (p<0.05) or in some cases down-regulation could also be
identified if FC < -0.5. Several differentially expressed genes were found significantly
differentially expressed depending on the analyzed trait at 8 and 12 DAS.
4.3.1 Differentially expressed genes for hormone metabolites
Abscisic acid (ABA) in nanograms per gram (ng/g) of dry weight in seedling plants at
8 and 12 DAS, which plays a crucial role during plant development and regulation of
growth was included as a trait for the BSA-DGE analysis. ABA and several derivative
hormone metabolites of ABA biosynthesis pathway, such as dihydrophaseic acid 4
(ABA2), abscisic acid glucose ester (ABA3), phaseic acid 3’ (ABA4), 7'-Hydroxy
abscisic acid (ABA5) and neophaseic acid PA (ABA6) were analysed through UPLC
method (Table 2). Bulks of genotypes were selected based on UPLC metabolite
content value for 8 and 12 DAS. Differentially expressed genes were calculated
based on DGE-normalised data.

29
Table 2. List of 27 traits evaluated in the ExV8-DH population and used for the BSA-
DGE analysis for identification of differentially expressed genes.
Trait Description
ABA Abscisic acid
ABA2 Dihydrophaseic acid
ABA3 Abscisic acid glucose ester
ABA4 Phaseic acid
Hormone ABA5 7'-Hydroxy-abscisic acid
metabolites ABA6 neoPhaseic acid
ABA7 (trans) Abscisic acid
AUX1 Auxin (Indole-3-acetic acid)
CYT2 Cytokinin ((cis) Zeatin-O-glucoside)
CYT4 Cytokinin ((cis) Zeatin)
DPHW Dry leaf weight (28 DAS)
HCH Hypocotyl length, (14 DAS)
Greenhouse LA Leaf area (28 DAS)
SDW Shoot dry weight (28 DAS)
SFW Shoot fresh weight (28 DAS)
SPHW Shoot leaf weight (28 DAS)
PH06 plant height at the end of flowering in year 2006
Field PH07 plant height at the end of flowering in year 2007
SY06 seed yield in 2006
SY07 seed yield in 2007
Regarding 8 DAS, the abscisic acid (ABA) hormone and its metabolites named
ABA2, ABA3 and ABA5 have shown significant differentially expressed genes. Seven
genes were significantly differentially expressed after bulking of the genotypes for the
ABA trait (Table 3). In the case of the ABA trait at 12 DAS, no differentially expressed
genes could be identified. A down-regulation of the LATE EMBRYOGENESIS
ABUNDANT (LEA) gene was also identified with a logFC equal to -1.5 (P value of
0.0177). In addition, down-regulation of CCAAT-binding transcription factor (CBF-
B/NF-YA) family was also observed for the ABA trait at 12 DAS (-1.129 logFC).
30
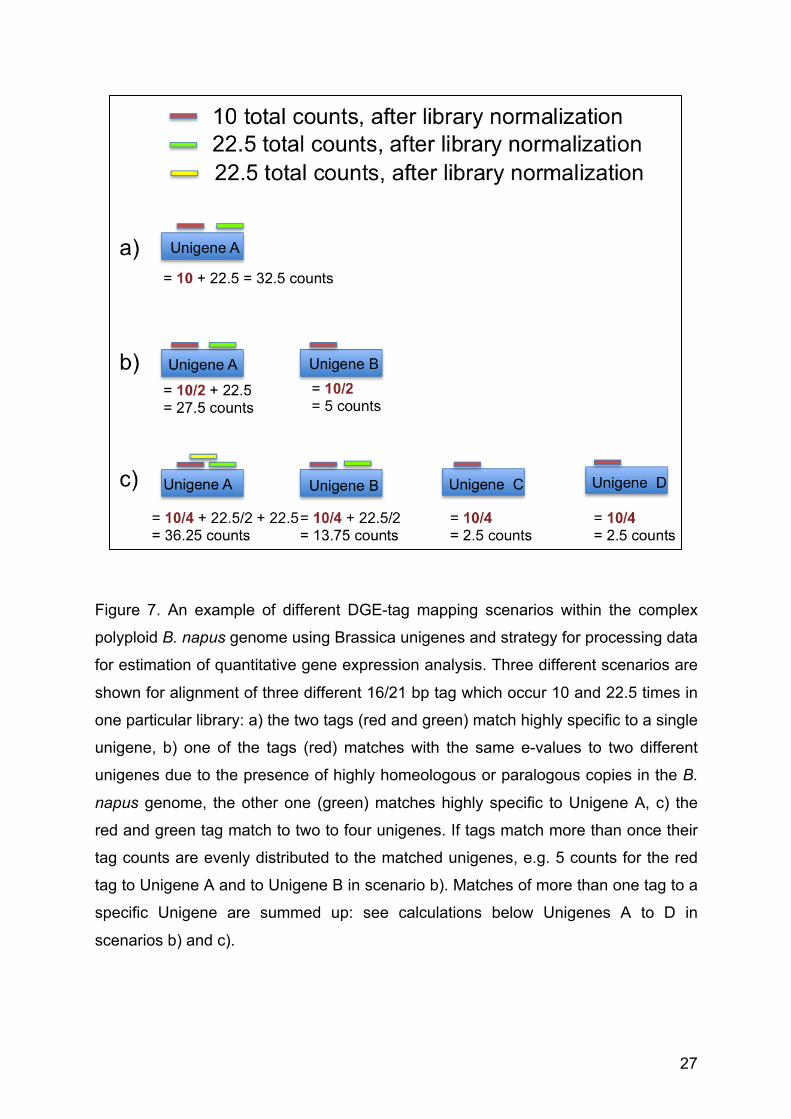
Further identification of differentially expressed genes for ABA2 at 8 DAS was
observed but none could be identified as belonging to the ABA biosynthetic pathway.
A total of 29 significantly differential expressed genes were identified for the
secondary metabolite named ABA2 (Dihydrophaseic acid) at 8 DAS (Appendix Table
1).
Table 3. List of the differentially expressed genes corresponding to ABA (abscisic
acid) content at 8 DAS after bulked-segregant analysis of DGE data (BSA-DGE)
sorted on the basis of log fold change (logFC) values. Arabidopsis genome initiative
(AGI 2000) was used for identification of A. thaliana genes.
Brassica
Unigene logFC p-value AGI Gene description
EV152606 2.37E+18 0.0018 AT1G73490 RNA-binding family protein
JCVI_40277 2.30E+19 0.0041 AT1G31335 unknown protein
JCVI_11040 2.29E+19 0.0165 AT1G76010 Alba DNA/RNA-binding protein
JCVI_20523 2.07E+19 0.0203 AT1G80400 RING/U-box superfamily protein
JCVI_2077 2.07E+19 0.0039 AT1G60810 enzyme ATP Citrate lyase
JCVI_27499 2.04861E+14 0.0065 AT1G16170 unknown protein
JCVI_19656 2.02013E+14 0.0167 AT1G36280 L-Aspartase-like family protein
No differentially expressed genes were found for ABA2 at 12 DAS. In contrast, for the
ABA3 trait at 8 DAS, 201 significantly differentially expressed genes were identified
(Table 4). Again the RING/U box superfamily protein was identified, but also another
gene, the Leucine-rich repeat protein kinase was identified as differentially expressed
for ABA3 at 8 DAS.
Moreover, significant differentially expressed genes for ABA3 at 12 DAS were also
identified after BSA-DGE analysis (Appendix Table A2). ABA3 trait at 12 DAS
presented a differentially expressed gene related to seedling development transition,
31
the CARBON/NITROGEN INSENSITIVE 1 (CNI1) (Sato et al. 2009). Differentially
expressed genes were identified for ABA4 at 12DAS but not at 8DAS (Appendix
Table A3). In the case of ABA5 hormone metabolite at 8 DAS, a number of
differentially expressed genes were observed (Appendix Table A4).
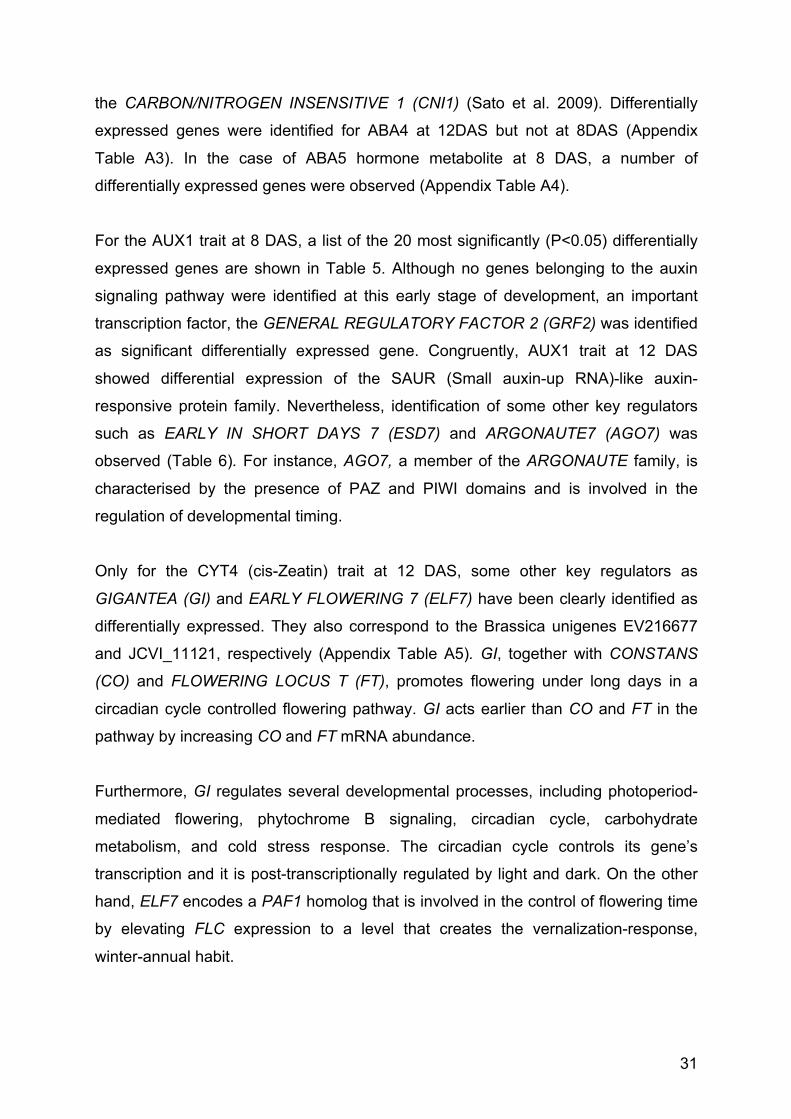
For the AUX1 trait at 8 DAS, a list of the 20 most significantly (P<0.05) differentially
expressed genes are shown in Table 5. Although no genes belonging to the auxin
signaling pathway were identified at this early stage of development, an important
transcription factor, the GENERAL REGULATORY FACTOR 2 (GRF2) was identified
as significant differentially expressed gene. Congruently, AUX1 trait at 12 DAS
showed differential expression of the SAUR (Small auxin-up RNA)-like auxin-
responsive protein family. Nevertheless, identification of some other key regulators
such as EARLY IN SHORT DAYS 7 (ESD7) and ARGONAUTE7 (AGO7) was
observed (Table 6). For instance, AGO7, a member of the ARGONAUTE family, is
characterised by the presence of PAZ and PIWI domains and is involved in the
regulation of developmental timing.
Only for the CYT4 (cis-Zeatin) trait at 12 DAS, some other key regulators as
GIGANTEA (GI) and EARLY FLOWERING 7 (ELF7) have been clearly identified as
differentially expressed. They also correspond to the Brassica unigenes EV216677
and JCVI_11121, respectively (Appendix Table A5). GI, together with CONSTANS
(CO) and FLOWERING LOCUS T (FT), promotes flowering under long days in a
circadian cycle controlled flowering pathway. GI acts earlier than CO and FT in the
pathway by increasing CO and FT mRNA abundance.
Furthermore, GI regulates several developmental processes, including photoperiod-
mediated flowering, phytochrome B signaling, circadian cycle, carbohydrate
metabolism, and cold stress response. The circadian cycle controls its gene’s
transcription and it is post-transcriptionally regulated by light and dark. On the other
hand, ELF7 encodes a PAF1 homolog that is involved in the control of flowering time
by elevating FLC expression to a level that creates the vernalization-response,
winter-annual habit.

32
Table 4. List of the 20 most significantly (P<0.05) differentially expressed genes for
ABA3 (abscisic acid glucose ester) hormone metabolite trait at 8 DAS after bulked-
segregant analysis of DGE data (BSA-DGE) sorted on the basis of log fold change
(logFC) values. Arabidopsis genome initiative (AGI 2000) was used for identification
of A. thaliana genes.
Brasssica Unigenes LogFC
p_value AGI
Gene description *
JCVI_31848 3.46E+14 4.42E+08 AT1G59820 Phospholipid translocase
JCVI_8042 3.43E+14 9.87E+09 AT1G16560 Per1-like family protein
JCVI_23597 3.31E+14 1.18E-04 AT2G03060
MIKC (MADS box, Keratin binding domain, and C terminal domain containing )
JCVI_24074 3.26E+14 2.52E-04 AT2G03140 alpha/beta-Hydrolases superfamily protein
EE450367 3.23E+14 1.46E-04 AT2G22090 encodes a nuclear protein that binds to RNA
JCVI_20523 3.17E+14 2.02E-04 AT1G80400 RING/U-box superfamily protein
JCVI_8184 3.10E+14 2.82E-04 AT2G18690 unknown protein;
JCVI_30212 3.05E+14 3.82E-04 AT1G66830
Leucine-rich repeat protein kinase family protein
EX128399 2.97E+14 1.08E-03 AT1G31070
N-acetylglucosamine-1-phosphate uridylyltransferase
JCVI_18840 2.93E+14 3.53E-03 AT2G16750 Protein kinase protein
JCVI_40149 2.93E+14 5.75E-04 AT1G67340
HCP-like superfamily protein with MYND-type zinc finger
JCVI_11040 2.92E+14 1.55E-03 AT1G76010 Alba DNA/RNA-binding protein;
JCVI_7194 2.91E+14 7.40E-03 AT1G49480 nuclear-localized DNA-binding protein
JCVI_10602 2.89E+14 6.10E-04 AT1G80720 Mitochondrial glycoprotein family protein
JCVI_16587 2.81E+14 2.77E-03 AT1G80290
Glycosyltransferase Family 64 (according to CAZy Database)
JCVI_1250 2.81E+14 9.55E-04 AT1G49950
Encodes a telomeric DNA binding protein.
JCVI_41756 2.79E+14 1.92E-03 AT1G30270
CBL-interacting protein kinase 23 (CIPK23)
JCVI_37138 2.79E+14 2.60E-04 AT1G50570
Calcium-dependent lipid-binding (CaLB domain)
JCVI_19591 2.76E+14 6.18E-04 AT1G10580 Transducin/WD40 repeat-like superfamily protein;
JCVI_35429 2.72E+14 5.01E-04 AT2G06005 FRIGIDA INTERACTING PROTEIN 1 (FIP1)
*ABA responsive genes shown in bold

33
Table 5. List of the 20 most significantly (P<0.05) differentially expressed genes for
the AUX1 (auxin) content at 8 DAS after bulked-segregant analysis of DGE data
(BSA-DGE) sorted on the basis of log fold change (logFC) values. Arabidopsis
genome initiative (AGI 2000) was used for identification of A. thaliana genes.
Brassica Unigene logFC p_value AGI Gene description
JCVI_35775 3.27868E+14 0.002610351 AT1G60690 NAD(P)-linked oxidoreductase superfamily protein
JCVI_6204 2.84563E+14 0.001101251 AT1G06290 ACYL-COA OXIDASE 3 (ACX3)
EE429436 2.63519E+14 0.003963176 AT1G06490 CALLOSE SYNTHASE 7 (CalS7)
EX098073 2.56159E+14 0.000699692 AT1G66760 MATE efflux family protein
JCVI_21653 2.48244E+14 0.006633875 AT1G10360 GLUTATHIONE S-TRANSFERASE TAU 18 (GSTU18)
JCVI_975 2.47804E+14 0.002845483 AT1G11860 Glycine cleavage T-protein family
JCVI_5248 2.41594E+14 0.005484584 AT1G54290 Translation initiation factor SUI1 family protein
JCVI_20211 2.36686E+14 0.033344841 AT2G22780 PEROXISOMAL NAD-MALATE DEHYDROGENASE 1 (PMDH1)
JCVI_19994 2.30975E+14 0.002380513 AT1G66250 O-Glycosyl hydrolases family 17 protein
DY008024 2.28166E+14 0.002854633 AT1G32050 SECRETORY CARRIER MEMBRANE PROTEIN 5 (SCAMP5)
JCVI_67 2.24824E+14 0.000386137 AT1G12840 DE-ETIOLATED 3 (DET3)
JCVI_44 2.22555E+14 0.003465166 AT1G32060 PHOSPHORIBULOKINASE (PRK)
EV173838 2.19109E+14 0.001900201 AT1G60060 Serine/threonine-protein kinase WNK (With No Lysine)-related
JCVI_37729 2.18658E+14 0.002328877 AT1G18590 SULFOTRANSFERASE 17 (SOT17)
JCVI_243 2.14973E+14 0.012930825 AT1G19540 NmrA-like negative transcriptional regulator family protein
JCVI_1246 2.13151E+14 0.01114472 AT2G26230 uricase / urate oxidase / nodulin 35, putative
EV161088 2.12114E+14 0.002370931 AT1G72730 DEA(D/H)-box RNA helicase family protein
JCVI_17626 2.11751E+14 0.008612213 AT1G27930 Function unknown. Interacts with eIF3.
JCVI_22791 2.07346E+14 0.001849011 AT1G78300 GENERAL REGULATORY FACTOR 2 (GRF2)
JCVI_34745 2.0508E+14 0.020191301 AT1G55020 LIPOXYGENASE 1 (LOX1)
JCVI_19676 2.04804E+14 0.005203842 AT1G43850 SEUSS (SEU)
JCVI_12387 2.02362E+14 0.004204301 AT1G69930 GLUTATHIONE S-TRANSFERASE TAU 11 (GSTU11)
JCVI_9049 2.01135E+14 0.002575579 AT1G12920 EUKARYOTIC RELEASE FACTOR 1-2 (ERF1-2)

34
Table 6. List of the 20 most significant (P<0.05) differentially expressed genes for
AUX1 (auxin) content at 12 DAS after bulked-segregant analysis of DGE data (BSA-
DGE) sorted on the basis of log fold change (logFC) values. Arabidopsis genome
initiative (AGI 2000) was used for identification of A. thaliana genes.
Unigene logFC p_value AGI Gene
JCVI_9933 2.12335E+14 0.0095 AT1G80450 VQ motif-containing protein
EE569746 2.13738E+14 0.0042 AT1G01725 unknown protein
JCVI_24410 2.32189E+14 0.0049 AT1G08260 EARLY IN SHORT DAYS 7 (ESD7)
JCVI_7465 2.37691E+14 0.0036 AT1G48160 signal recognition particle 19 kDa protein, putative / SRP19, putative
JCVI_28827 2.60404E+14 0.0052 AT1G16510 SAUR-like auxin-responsive protein family
JCVI_28783 2.93909E+14 0.0001 AT1G45231 S-adenosyl-L-methionine-dependent methyltransferases superfamily protein
JCVI_34325 2.17393E+14 0.0057 AT2G25690 Protein of unknown function (DUF581)
EV046536 2.76543E+14 0.0003 AT1G33390 FASCIATED STEM 4 (FAS4)
CX194114 2.63253E+14 0.0013 AT1G01030 NGATHA3 (NGA3).
JCVI_35963 2.2728E+14 0.0175 AT2G25970 KH domain-containing protein
JCVI_38691 2.13511E+14 0.0168 AT1G09710 Homeodomain-like superfamily protein
JCVI_35043 2.35393E+14 0.0047 AT1G05785 Got1/Sft2-like vescicle transport protein family
JCVI_16418 2.58931E+14 0.0022 AT1G69440 ARGONAUTE7 (AGO7)
JCVI_25190 2.41574E+14 0.0036 AT1G20330 COTYLEDON VASCULAR PATTERN 1 (CVP1)
JCVI_30600 2.27236E+14 0.0020 AT1G17920 HOMEODOMAIN GLABROUS 12 (HDG12)
EE452351 2.77641E+14 0.0004 AT1G68370 ALTERED RESPONSE TO GRAVITY 1 (ARG1)
JCVI_23144 2.23241E+14 0.0074 AT1G13080 cytochrome P450 monooxygenase
JCVI_20799 2.65951E+14 0.0131 AT1G51650 ATP synthase epsilon chain
JCVI_10506 2.70567E+14 0.0011 AT2G18330 AAA-type ATPase family protein
EV168439 2.23128E+14 0.0280 AT1G77140 VACUOLAR PROTEIN SORTING 45 (VPS45)

35
4.3.2 Differentially expressed genes for traits under greenhouse conditions Several traits at seedling development stage have been evaluated under greenhouse
condition in previous work (Basunanda et al. 2010). Six specific traits, such as dry
leaf weight (DPHW), hypocotyl height (HCH), leaf area (LA), shoot dry weight (SDW),
shoot fresh weight (SFW) and shoot leaf weight (SPHW) were analysed (see Table
2). For 8 DAS, only HCH, SFW and SPHW showed significantly (P < 0.05)
differentially expressed genes. From HCH only 20 genes were found to be
significantly differential expressed and SFW showed only 9 differentially expressed
genes (see Appendix table A6 and table A7).
Shoot leaf weight (SPHW) resulted in 22 significantly differentially expressed genes,
in which the EV118481 unigene corresponds to the AT1G75820 CLAVATA 1 (CLV1)
gene (Table 7). CLV1 is a putative receptor kinase with an extracellular leucine-rich
domain, which controls shoot and floral meristem size, and contributes to
establishing and maintaining the floral meristem identity. It is negatively regulated by
KAPP (kinase-associated protein phosphatase) and CLAVATA 3 (CLV3) peptide
which binds directly CLV1 ectodomain. Furthermore, one additional unigene,
JCVI_7865 (AT2G21660) encodes a GLYCINE-RICH RNA-BINDING PROTEIN 7
(GRP7) that is part of a negative-feedback loop through which GRP7 regulates the
circadian oscillations of its own transcript.
For 12 DAS, greenhouse traits such as DPHW (dry leaf weight), LA (leaf area), SDW
(shoot dry weight), SFW (shoot fresh weight) and SPHW (shoot leaf weight) showed
several differentially expressed genes, however, none of these were similar to those
expressed at 8 DAS. Due to the time points that were chosen here for the
experiments. For summarizing reasons, not data is showed concerning to these
traits.

36
Table 7. List of the 20 most significantly (P<0.05) differentially expressed genes for
shoot leaf weight (SPHW) at 8 DAS after bulked-segregant analysis of DGE data
(BSA-DGE) sorted on the basis of log fold change (logFC) values. Arabidopsis
genome initiative (AGI 2000) was used for identification of A. thaliana genes.
Unigenes logFC p_value AGI Gene description
EE547519 2.79256E+14 0.000690151 AT2G16600 Encodes cytosolic cyclophilin ROC3. ROTAMASE CYP 3 (ROC3)
JCVI_29531 2.5489E+14 0.020440655 AT2G25450 similar to ACC oxidase
EX131553 2.53386E+14 0.00091851 AT1G74050 Ribosomal protein L6 family protein
JCVI_5668 2.52524E+14 0.005817949 AT1G80090
Cystathionine beta-synthase (CBS) CBS DOMAIN CONTAINING PROTEIN 4 (CBSX4)
JCVI_20238 2.51136E+14 0.004725032 AT1G12064 unknown protein
EX123254 2.39706E+14 0.001945594 AT1G34040 Pyridoxal phosphate (PLP)-dependent transferases
JCVI_37074 2.37519E+14 0.002017532 AT1G74100 SULFOTRANSFERASE 16 (SOT16)
JCVI_4329 2.37008E+14 0.035717136 AT1G11910 ASPARTIC PROTEINASE A1 (APA1)
JCVI_7751 2.34605E+14 0.011866902 AT1G15330 Cystathionine beta-synthase (CBS) protein
EV118481 2.29533E+14 0.022445607 AT1G75820 CLAVATA 1 (CLV1)
JCVI_7865/ EV188487/ CX269309 2.29153E+14 0.004259702 AT2G21660
GLYCINE-RICH RNA-BINDING PROTEIN 7 (GRP7)
JCVI_32978 2.2309E+14 0.006596822 AT1G67660 Restriction endonuclease, type II-like
ES943297 2.13462E+14 0.004162194 AT2G28900 OUTER PLASTID ENVELOPE PROTEIN 16-1 (OEP16-1)
EX131209 2.09679E+14 0.006800394 AT1G32230 RADICAL-INDUCED CELL DEATH1 (RCD1)
EV029825 2.08654E+14 0.00979309 AT1G18880 NITRATE TRANSPORTER 1.9 (NRT1.9)
JCVI_5932 2.08571E+14 0.005090145 AT1G44760 Adenine nucleotide alpha hydrolases-like
JCVI_21680 2.06613E+14 0.016898616 AT1G19960 transmembrane receptors
JCVI_14373 2.06147E+14 0.004427159 AT1G63680 Mur ligase MURE
JCVI_22656 2.04333E+14 0.010429121 AT2G21870 MALE GAMETOPHYTE DEFECTIVE 1 (MGP1)
JCVI_5679 2.01545E+14 0.006578632 AT1G48460 unknown protein

37
4.3.3 Differentially expressed genes for traits under field conditions
Similar to the greenhouse experiments, expression results were related to the results
of field experiments in the years 2006 and 2007 regarding traits such as plant height
at the end of flowering (PH) and seed yield (SY) (Basunanda et al. 2010). In this
study, it was of great importance to identify the up-regulated genes observed when
using gene expression data from early development seedling stages at 8 and 12
DAS to validate the hypothesis of complex interactions of key regulators, playing an
important role for late stages of development in winter oilseed rape.
Plant height at the end of flowering in the year 2006 (PH06) for 8 and 12 DAS was
identified as presenting 12 and 21 differentially expressed genes, respectively.
Although not many genes from the flowering pathway were found, one key regulator
named CLAVATA 1 (CLV1) or also known as FLOWER DEVELOPMENT 5 (FLO5)
or FASCIATA 3 (FAS3) during flowering was up-regulated at 8 and 12 DAS to 2,49
(see Table 8) and 3.55 fold change (see Appendix Table A8), respectively. CLV1 was
found between SPHW and PH06 at 8 DAS, and its additional presence at 12 DAS for
PH06 trait, suggested its role during transition from vegetative phase to reproductive
stage.
Regarding seed yield in 2006 (SY06) at 8 and 12 DAS, only 10 significant and two
differentially expressed genes were found, respectively, after BSA-DGE analysis. For
8 DAS, the BETA GLUCOSIDASE 33 (BGLU33) gene which is involved during
carbohydrate metabolic process and TRANSPARENT TESTA 7 (TT7) which has
been correlated with seed yellow trait in Brassica napus (Auger et al. 2009) (Table 9).
For SY06 at 12 DAS, only two genes, the Haloacid dehalogenase-like hydrolase
(HAD) superfamily protein (AT5G02230) and the Transmembrane CLPTM1 family
protein (AT5G08500) were found to be significantly differentially expressed (FC > 2).
In the case of seed yield in the year 2007 (SY07) at 8 and 12 DAS, a total of seven
genes were shown to be significant differentially expressed at both time points.
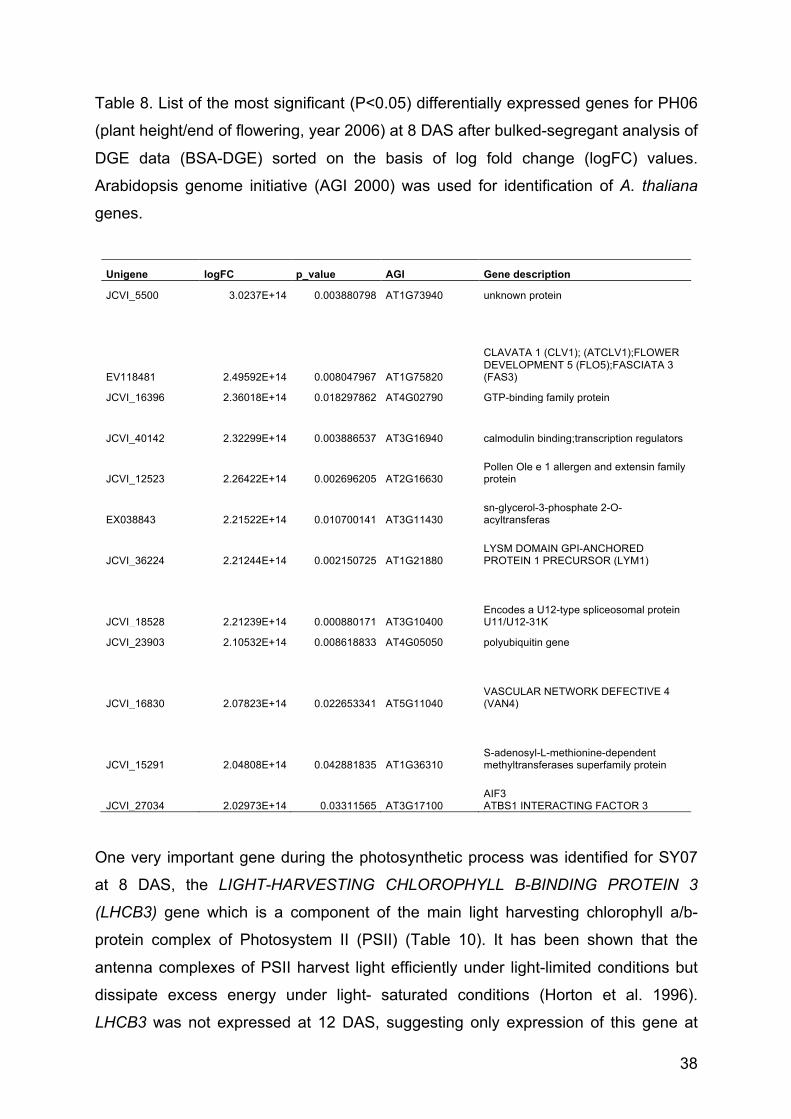
38
Table 8. List of the most significant (P<0.05) differentially expressed genes for PH06
(plant height/end of flowering, year 2006) at 8 DAS after bulked-segregant analysis of
DGE data (BSA-DGE) sorted on the basis of log fold change (logFC) values.
Arabidopsis genome initiative (AGI 2000) was used for identification of A. thaliana
genes.
Unigene logFC p_value AGI Gene description
JCVI_5500 3.0237E+14 0.003880798 AT1G73940 unknown protein
EV118481 2.49592E+14 0.008047967 AT1G75820
CLAVATA 1 (CLV1); (ATCLV1);FLOWER DEVELOPMENT 5 (FLO5);FASCIATA 3 (FAS3)
JCVI_16396 2.36018E+14 0.018297862 AT4G02790 GTP-binding family protein
JCVI_40142 2.32299E+14 0.003886537 AT3G16940 calmodulin binding;transcription regulators
JCVI_12523 2.26422E+14 0.002696205 AT2G16630 Pollen Ole e 1 allergen and extensin family protein
EX038843 2.21522E+14 0.010700141 AT3G11430 sn-glycerol-3-phosphate 2-O-acyltransferas
JCVI_36224 2.21244E+14 0.002150725 AT1G21880 LYSM DOMAIN GPI-ANCHORED PROTEIN 1 PRECURSOR (LYM1)
JCVI_18528 2.21239E+14 0.000880171 AT3G10400 Encodes a U12-type spliceosomal protein U11/U12-31K
JCVI_23903 2.10532E+14 0.008618833 AT4G05050 polyubiquitin gene
JCVI_16830 2.07823E+14 0.022653341 AT5G11040
VASCULAR NETWORK DEFECTIVE 4 (VAN4)
JCVI_15291 2.04808E+14 0.042881835 AT1G36310 S-adenosyl-L-methionine-dependent methyltransferases superfamily protein
JCVI_27034 2.02973E+14 0.03311565 AT3G17100 AIF3 ATBS1 INTERACTING FACTOR 3
One very important gene during the photosynthetic process was identified for SY07
at 8 DAS, the LIGHT-HARVESTING CHLOROPHYLL B-BINDING PROTEIN 3
(LHCB3) gene which is a component of the main light harvesting chlorophyll a/b-
protein complex of Photosystem II (PSII) (Table 10). It has been shown that the
antenna complexes of PSII harvest light efficiently under light-limited conditions but
dissipate excess energy under light- saturated conditions (Horton et al. 1996).
LHCB3 was not expressed at 12 DAS, suggesting only expression of this gene at
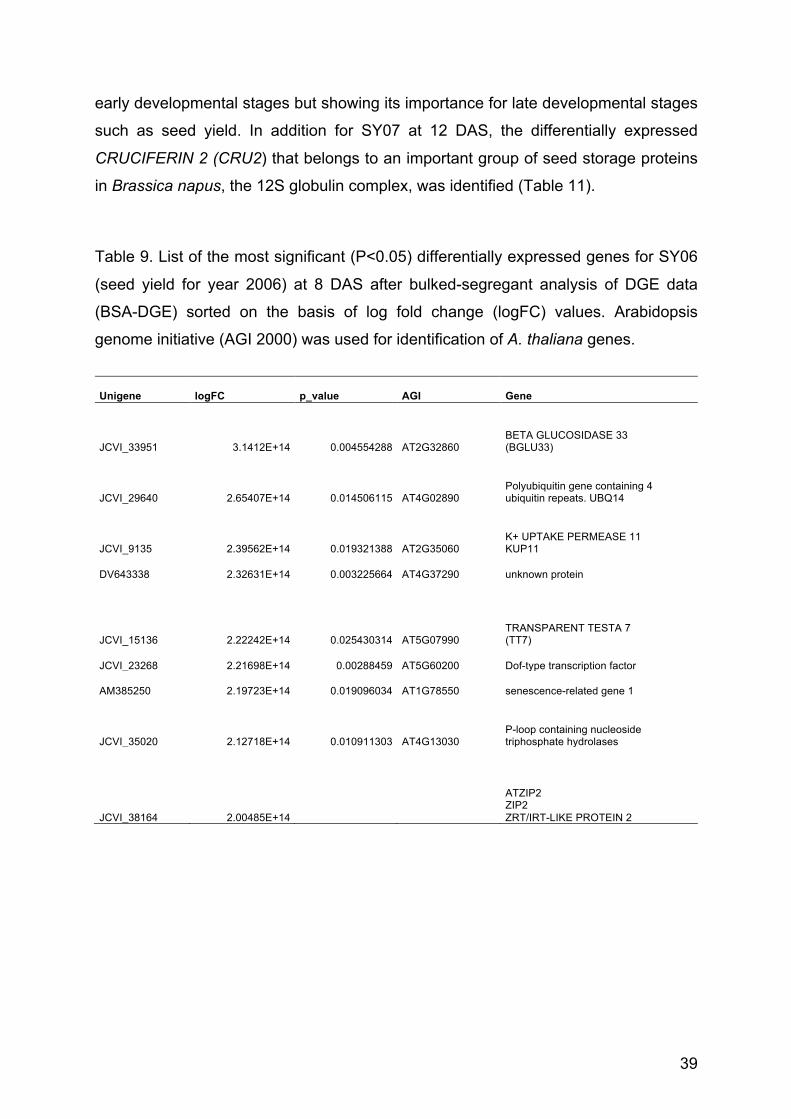
39
early developmental stages but showing its importance for late developmental stages
such as seed yield. In addition for SY07 at 12 DAS, the differentially expressed
CRUCIFERIN 2 (CRU2) that belongs to an important group of seed storage proteins
in Brassica napus, the 12S globulin complex, was identified (Table 11).
Table 9. List of the most significant (P<0.05) differentially expressed genes for SY06
(seed yield for year 2006) at 8 DAS after bulked-segregant analysis of DGE data
(BSA-DGE) sorted on the basis of log fold change (logFC) values. Arabidopsis
genome initiative (AGI 2000) was used for identification of A. thaliana genes.
Unigene logFC p_value AGI Gene
JCVI_33951 3.1412E+14 0.004554288 AT2G32860 BETA GLUCOSIDASE 33 (BGLU33)
JCVI_29640 2.65407E+14 0.014506115 AT4G02890 Polyubiquitin gene containing 4 ubiquitin repeats. UBQ14
JCVI_9135 2.39562E+14 0.019321388 AT2G35060 K+ UPTAKE PERMEASE 11 KUP11
DV643338 2.32631E+14 0.003225664 AT4G37290 unknown protein
JCVI_15136 2.22242E+14 0.025430314 AT5G07990 TRANSPARENT TESTA 7 (TT7)
JCVI_23268 2.21698E+14 0.00288459 AT5G60200 Dof-type transcription factor
AM385250 2.19723E+14 0.019096034 AT1G78550 senescence-related gene 1
JCVI_35020 2.12718E+14 0.010911303 AT4G13030 P-loop containing nucleoside triphosphate hydrolases
JCVI_38164 2.00485E+14
ATZIP2 ZIP2 ZRT/IRT-LIKE PROTEIN 2

40
Table 10. List of the significant (P<0.05) differentially expressed genes for SY07
(seed yield, year 2007) at 8 DAS after bulked-segregant analysis of DGE data (BSA-
DGE) sorted on the basis of log fold change (logFC) values. Arabidopsis genome
initiative (AGI 2000) was used for identification of A. thaliana genes.
Unigene logFC p_value AGI Gene
JCVI_32354 2.74272E+14 0.008983342 AT2G34390 NOD26-LIKE INTRINSIC PROTEIN 2;1 aquaporin NIP2.1
BQ704232 2.48243E+14 0.000952978 AT5G54270
LIGHT-HARVESTING CHLOROPHYLL B-BINDING PROTEIN 3 (LHCB3)
EE525829 2.40629E+14 0.001797269 AT1G51060 Encodes HTA10, a histone H2A protein. HISTONE H2A 10 (HTA10)
JCVI_32184 2.37935E+14 0.002002075 AT2G28430 unknown protein
JCVI_10157 2.05764E+14 0.013222199 AT5G41940 Ypt/Rab-GAP domain of gyp1p superfamily protein
EE547466 2.03479E+14 0.020005945 AT3G12800
SHORT-CHAIN DEHYDROGENASE-REDUCTASE B (SDRB)
JCVI_41782 2.00825E+14 0.000577815 AT3G22550 Protein of unknown function (DUF581)
Table 11. List of the significantly (P<0.05) differentially expressed genes at 12 DAS
for SY07 (seed yield, year 2007) trait after bulked-segregant analysis of DGE data
(BSA-DGE) sorted on the basis of log fold change (logFC) values. Arabidopsis
genome initiative (AGI 2000) was used for identification of A. thaliana genes.
Unigene logFC p_value AGI Gene
JCVI_32354 2,75E+19 0.0031 AT2G34390 NOD26-LIKE INTRINSIC PROTEIN 2;1 (NIP2;1)
DN191865 2,56E+19 0.0065 AT4G25433
peptidoglycan-binding LysM domain-containing
protein
JCVI_3694 2,41E+19 0.0014 AT5G24170 Got1/Sft2-like vescicle transport protein family
JCVI_23495 2,39E+19 0.0186 AT1G03880 CRUCIFERIN 2 (CRU2)
JCVI_20987 2,32E+19 0.0014 AT5G62100 BCL-2-ASSOCIATED ATHANOGENE 2 (BAG2)
JCVI_33951 2,04E+19 0.0304 AT2G32860 BETA GLUCOSIDASE 33 (BGLU33)
JCVI_16889 2,50E+17 0.0027 AT4G23496 SPIRAL1-LIKE5 (SP1L5)
41
4.4 Weighted gene co-expression network analysis (WGCNA) for
identification of highly connected (hub) genes
WGCNA was performed as described by Zhang and Horvath (2005) and Langfelder
and Horvath (2008). Datasets for 8 DAS and 12 DAS were obtained containing
measurements of transcript abundance for 154,790 DGE-tags. The tags were
mapped to the AC “cured” unigene reference to give 86,908 tags mapping to A
genome unigenes and 67,882 tags mapping to C genome unigenes. Tags were kept
if they had a normalised tag count of at least five in six or more samples.
Replicate tags for each unigene were averaged and only those unigenes, which were
found in both datasets, were used for the WGCNA consensus analysis. 91,048
unigenes present in both datasets were used for the WGCNA. A total of 108 modules
were obtained using the automatic network construction function
blockwiseConsensusModules with the following settings; power = 5, minModuleSize
= 50, deepSplit = 2, maxBlock- Size = 35000, reassignThreshold = 0,
mergeCutHeight = 0.25, minKMEtoJoin = 1, minKMEtoStay = 0. The top hub
unigenes were identified from fifteen modules, which were highly conserved between
the two datasets and selected as candidate genes.
4.4.1 Identifying modules that are correlated with traits A co-expression network was constructed for the 8 DAS and 12 DAS datasets.
Conserved trait-module relationship was found for the salmon module and seed yield
(SY), plant height at the end of flowering (PH) and shoot fresh weight (SFW) traits for
8DAS. Although, the correlation for the association of salmon module with the traits
was very low from 0.20 to 0.28 (p-value < 0.05), the presence of flowering regulating
genes such as CONSTANS-LIKE 10 (COL10) and TERMINAL FLOWER 2 (TFL2)
was relevant for the traits under study. In addition, conserved trait-module
relationship of the module floralwhite with SY and cytokinin (CYT) traits with
expression of CONSTANS (CO) and TERMINAL FLOWER 1 (TFL1) for 12 DAS, was
also observed. The correlation for the association of the CYT trait with the floralwhite
module was 0.79 (p-value = 9e-22).

42
The flowering regulating gene COL10, is a zinc finger protein, member of the
CONSTANS-LIKE gene family. CONSTANS (CO) gene is an important floral
regulator in the photoperiod pathway, integrating the circadian clock and light signal
into a control for flowering time. It is well known that CO promotes flowering in
Arabidopsis and other species under long-day conditions (Putterill et al. 1995, Zhang
et al. 2015). Although CONSTANS-LIKE (COL) genes in other species have also
been shown to regulate flowering time, it is not clear how widely this central role in
photoperiod sensing is regulated (Wong et al. 2014).
Generally, CO up-regulate the florigen gene FLOWERING LOCUS T (FT) and
SUPRESSOR OF OVEREXPRESSION OF CO1 (SOC1) under long-day conditions
(Samach et al. 2000, Searle and Coupland 2004). In Arabidopsis, the FT protein, a
mobile signal recognized as a major component of florigen, has a central position in
mediating the onset of flowering. FT-like genes seem to be involved in regulating the
floral transition in all angiosperms examined to date.
Flowering time is an important ecological trait that determines the transition from
vegetative to reproductive growth. In depth, one of the key developmental processes
in flowering plants is the differentiation of the shoot apical meristem into a floral
meristem. This transition is regulated through the integration of environmental and
endogenous stimuli, involving a complex, hierarchical signalling network.
Conserved structure and function of the Arabidopsis flowering time gene
CONSTANS in Brassica napus has been reported. Four genes homologous to the
Arabidopsis CO gene were isolated from a pair of homeologous loci in each of two
doubled-haploid Brassica napus lines displaying different flowering times. The four
genes, BnCOa1, BnCOa9, BnCOb1 and BnCOb9, are highly similar to each other
and to the Arabidopsis CO gene. Two regions of the proteins are particularly well
conserved, a N-terminal region with two putative zinc fingers and a C-terminal region
which may contain a nuclear localization signal. All four genes appear to be
expressed in B. napus. For instance, the BnCOa1 allele was shown to complement
the co-2 mutation in Arabidopsis in a dosage-dependent manner causing earlier
flowering than in wild type under both long- and short-day conditions (Robert et al.
1998).

43
Recently, new information has emerged on COL genes in the short-day legume
soybean. Soybean has multiple group COL genes, which comprise two pairs of
homeologs; COL1a/b and COL2a/b. Two recent studies show that one of these,
GmCOL2a, is able to complement the Arabidopsis co-2 mutant (Fan et al. 2014, Wu
et al. 2014), and there is evidence that the remaining genes COL1a/b and COL2b
may also have some activity in Arabidopsis (Wu et al. 2014).
Flowering is an essential stage of plant growth and development. The successful
transition to flowering not only ensures the completion of plant life cycles, it also
serves as the basis for the production of economically important seeds and fruits.
CONSTANS (CO) and FLOWERING LOCUS T (FT) are two genes playing critical
roles in flowering time control in plants. Transcriptional activation of FT under
inductive daylength conditions is mediated by CO, which is itself regulated by a
complex interplay of signals in the photoperiod pathway. Adrian et al (2010) analyze
the promoter region of FT to define the minimal promoter sufficient to mediate the
response to daylength and identify several key regions that play a role in FT
chromatin structure and promoter activity.
Evidence from molecular evolution studies suggests that the emergence of FT-like
genes coincided with the evolution of the flowering plants. Hence, the role of FT in
floral promotion is conserved, but appears to be restricted to the angiosperms.
Besides flowering, FT-like proteins have also been identified as major regulatory
factors in a wide range of developmental processes including fruit set, vegetative
growth, stomatal control and tuberization. These multifaceted roles of FT-like proteins
have resulted from extensive gene duplication events, which occurred independently
in nearly all modern angiosperm lineages, followed by sub- or neo-functionalization
(Pa and Nillson 2012). Furthermore, the CONSTANS gene has been a central
feature of models explaining the molecular basis for plant responses to photoperiod,
and the potential conservation of CO function across flowering plants is in fact a topic
of considerable interest.
Regarding TFL2, it has been found to be a structural component of heterochromatin
involved in gene repression, including several floral homeotic genes that regulates
flowering time. It is required for maintenance of vernalization-induced repression of

44
FLOWERING LOCUS C (FLC). Loss of function TFL2, causes daylength-
independent early flowering mainly due to upregulation of FT expression. TFL2 is
expressed in meristematic tissues and young leaves, whereas expression in
developing leaves becomes restricted to the petiole and the proximal side of the leaf
blade, areas where cells continue to proliferate. In mature leaves, TFL2 mRNA is
restricted to the vascular tissue (Kotake et al. 2003). Further experiments teased out
other facets of the FT promoter, in particular properties of chromatin structure
mediated by the chromo domain chromatin-associated protein TFL2. TFL2 is known
to negatively influence FT expression, since mutants show daylength-independent
early flowering due to upregulation of FT expression.
In plant development, two homologous genes, FT and TFL1, modulate the flowering
transition and inflorescence architecture. The florigen FT promotes the transition to
reproductive development and flowering, while TFL1 represses this transition.
Despite their importance to plant adaptation and crop improvement and their
extensive study by the plant community, the molecular mechanisms controlling the
opposing actions of FT and TFL1 have remained mysterious. Recent studies in
multiple species have unveiled diverse roles of the FT/TFL1 gene family in
developmental processes other than flowering regulation. In addition, the striking
evolution of FT homologs into flowering repressors has occurred independently in
several species during the evolution of flowering plants. These reports indicate that
the FT/TFL1 gene family is a major target of evolution in nature (Wickland and
Hanzawa 2015).
Flowering is a key step in plant development, and research on Arabidopsis has
revealed complex networks of genetic regulatory pathways (reviewed in Amasino
2010). Much information has been gained towards an understanding of the molecular
cascades whereby flowering is controlled by environmental cues, especially
photoperiod and vernalization, whereas endogenous flowering signals have been
more difficult to investigate. Plant hormones regulate multiple aspects of growth and
development, so that it is hard to discriminate the direct and indirect effects that
mutations in their signalling components might have on late phenotypic traits, such
as seed yield and plant height at flowering.

45
For instance, cytokinin-induced TFL1 expression has been reported to may be
involved in the control of grapevine fruitfulness. For instance, grapevine bud
fruitfulness is determined by the differentiation of uncommitted meristem (UCM) into
either tendril or inflorescence. Since tendril and inflorescence differentiation have
long been considered sequential steps in inflorescence development, factors that
control the progression of floral meristem development may regulate the final
outcome of UCM differentiation, and thus affect fruitfulness. A comparison of the
expression profiles of the master regulators of floral meristem identity (FMI) during
development of fruitful and non-fruitful buds along the same cane allowed associating
the expression of a homolog of TERMINAL FLOWER 1 (TFL1, a negative regulator
of FMI) to fruitful buds, and the expression of positive FMI regulators to non-fruitful
buds (D’ Aloia et al. 2011).
Cytokinins are involved in many aspects of plant growth and development, and
physiological evidence also indicates that they have a role in floral transition. For
instance, Crane et al. (2012) combined cytokinin-induced upregulation of Vitis
vinifera TFL1 expression in cultured tendrils, which accompanied cytokinin-derived
tendril transformation into branched and inflorescence-like structures. Positive
regulation of TFL1 expression by cytokinin demonstrated involvement in the control
of inflorescence development.
Many plants respond to environmental cues, such as day-length and temperature, to
regulate flowering time. Phytohormones and age, two internal cues, also induce
flowering. Molecular genetic studies using Arabidopsis have revealed that four major
floral-promoting pathways — the photoperiod, vernalization, autonomous and
gibberellin pathways — work in response to environmental and internal cues (Reeves
and Coupland 2000). These pathways form a network that integrates flowering sig-
nals into the regulation of several key genes.
Network analysis on genes that are highly representative of flowering process
(expressed in young plants) such as COL10, TFL1 and TFL2 suggest them as
sensible targets for further targeted functional characterization in B. napus, or as
candidates for association mapping that can serve as robust markers for breeding for
adult plant yield-stability.

46
The WGCNA approach used identified genes with proven functional roles in flowering
signalling pathway in Arabidopsis, B. napus, and other species, suggest that the
method is biologically robust and the results are meaningful. Network analyses have
been proposed as a solution to systems biology studies, particularly those involving
transcriptomic data-sets, as this approach both models the interactions of real
biological networks and is intuitively understood by users. The reconstruction of
biological networks allows processes to be examined from a truly system-scale
perspective and provides unique insight into the structure and behaviour of the
molecular interactions that underlie important phenomena such as development
(e.g. flowering). Furthermore, the clustering of co-expressed genes into “modules”
mirrors regulatory associations found in biological systems and provides information
on well-characterized genes with external traits.
4.4.2 Top hub genes during seedling development at 8 and 12 DAS
Top hub unigenes were found in each module using the WGCNA function
‘chooseTopHubInEachModule’. The topological overlap was recalculated, using the
WGCNA function ‘TOMsimilarityFromExpr’ (power = 5), for the 3526 unigene in
fifteen selected modules. The principle is that unigenes highly significantly associated
for a trait are often also the most important (central) elements of modules associated
with the trait. These Unigenes can be identified, by correlating the gene significance
(GS) and module eigengene-based connectivity (kME).
This correlation basically indicates whether, the hub genes in a module are also the
ones most strongly associated with the trait. Gene significance is defined as the
correlation of gene expression profiles with an external trait and where the kME is
determined for each module. Each gene within a module is correlated with the ME, to
give a measure of module membership (MM). Genes with a high value for MM, are
central to the modules and may be of importance to organization of the rest of the
module.
This could be important if we wanted to draw more speculative conclusions, for
example to hypothesize that the module represents a pathway, the hub genes are
the ones most important for the pathway, and hence we would hypothesize that the

47
hub genes are also the ones most important for the trait. In this study, the same
unigene was the top for datasets, 8 and 12 DAS, for fifteen modules. It is assumed
that if modules have the identical hub genes then these modules are robust between
datasets. The fifteen modules were selected for investigation of Top Hub Unigenes in
B. napus at seedling development. Annotation of these 15 top hub unigenes to the
Arabidopsis thaliana genome was performed. BLASTN hits in Arabidopsis (p≤1.0E-
30) were found for 15 Brassica unigenes (Table 12).
These fifteen top hub genes were identified to be involved in many processes of
growth and development for seedling development at 8 and 12 DAS. For instance,
the genes GF14 (G BOX FACTOR 14-3-3 OMEGA) or GRF2 (GENERAL
REGULATORY FACTOR 2) encode so called CF14 proteins which participate in
protein/DNA complexes and show more than 60% identity with a highly conserved,
widely distributed protein family, collectively referred to as 14-3-3 proteins (de Vetten
and Ferl 1994). Moreover, GRF1 (GROWTH REGULATING FACTOR 1), which plays
a key role in various aspects of tissue differentiation and organ development (Li et al.
2011) was also identified as a top hub gene mainly involved in leaf development.

48
Table 12. Top Hub Unigenes at 8 and 12 DAS (days after sowing) in B. napus.
Annotation of Top Hub unigenes to Arabidopsis genome (TAIR 10).
Top Hub Unigene Module 8DAS 12DAS Unigenes BLASTX to
Arabdopsis Gene
darkgreen A_EE513355 A_EE513355 677 AT1G19870 IQD32 (IQ-domain 32); calmodulin binding
darkorange A_JCVI_31511 C_JCVI_31511 622 AT5G44560 VPS2.2 (VACUOLAR PROTEIN SORTING 2.2)
indianred3 C_JCVI_24 A_JCVI_24 60 AT5G19140 AILP1 (ALUMINUM INDUCED PROTEIN 1)
indianred4 A_EV128580 A_EV128580 123 !
lavenderblush2 C_JCVI_1353 C_JCVI_1353 95 AT1G54020 MyAP ( MYROSINASE-ASSOCIATED PROTEIN)
lightcoral C_EV101618 A_JCVI_36839 130 AT4G09800 RPS18C (S18 RIBOSOMAL PROTEIN)
mediumpurple1 C_JCVI_27124 C_JCVI_27124 62 AT1G28240 unknown protein
orangered1 A_JCVI_6967 C_JCVI_6967 66 AT4G15000 RPL27C (60S ribosomal protein L27)
orangered3 A_JCVI_10152 A_JCVI_10152 149 AT5G55850 NOI (NITRATE INDUCED PROTEIN)
plum C_JCVI_25605 A_JCVI_25605 152 AT1G04560 AWPM-19-like membrane family protein
plum2 C_JCVI_5013 C_JCVI_5013 263 AT1G17110 UBP15 (UBIQUITIN-SPECIFIC PROTEASE 15)
salmon4 C_JCVI_22791 A_EH421644 237 AT1G78300 GRF2 (GENERAL REGULATORY FACTOR 2), GF14
AT2G14080 TIR-NBS-LRR class (disease resistance protein)
skyblue C_JCVI_1160 A_JCVI_1160 563 AT5G43830 unknown protein
thistle2 C_JCVI_41561 A_JCVI_41561 248 AT2G22840 GRF1 (GROWTH-REGULATING FACTOR 1)
yellow3 A_JCVI_391 A_JCVI_391 77 AT1G72610 GER1 (GERMIN-LIKE PROTEIN 1)

49
4.4.3. Identifying biological functions of modules using gene ontology over-
representation analysis
The top Arabidopsis hit corresponding to each Brassica unigene was used for
functional analysis. Functional classification was carried out using the agriGO web-
based GO analysis toolkit (Table 12). Arabidopsis genes (corresponding to each
unigene) were input into the Singular Enrichment Analysis (SEA) using a customised
reference background (63,797 unigenes corresponding to 17,933 Arabidopsis
genes). The Hypergeometric Test with Yekutieli (FDR under dependency) adjusted
the p-values, which was employed in the SEA analysis using the agriGO ontology.
For instance, regulation of cell size, shoot system development and fruit development
were found as the function of each module.
A consensus co-expression network was constructed for both datasets containing 15
modules, each were represented by a specific colour. Using a cut off of ≥ 0.1 for
unigene connections, the module network was exported to Cytoscape (Cline 2007) to
enable the visualisation of the network (Figure 9). The Cytoscape Plugin Network
Analyzer (Assenov 2008) was used to calculate topology parameters. Candidate
network drivers were identified by ranking nodes based on their degree index and
also by comparing the index values determined for closeness, radiality and
eccentricity. The top hub unigenes were identified from 15 modules, which were
highly conserved between the two datasets and selected as candidate genes in this
study.
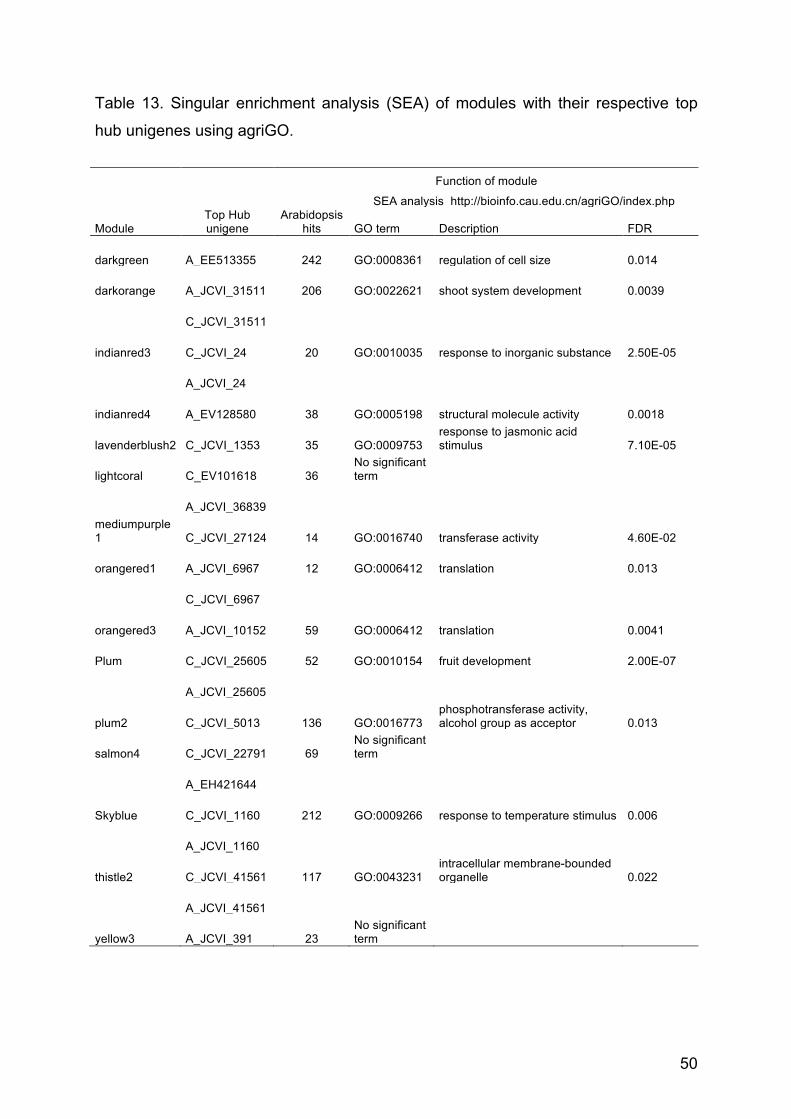
50
Table 13. Singular enrichment analysis (SEA) of modules with their respective top
hub unigenes using agriGO.
Function of module
SEA analysis http://bioinfo.cau.edu.cn/agriGO/index.php
Module Top Hub unigene
Arabidopsis hits GO term Description FDR
darkgreen A_EE513355 242 GO:0008361 regulation of cell size 0.014
darkorange A_JCVI_31511 206 GO:0022621 shoot system development 0.0039
C_JCVI_31511
indianred3 C_JCVI_24 20 GO:0010035 response to inorganic substance 2.50E-05
A_JCVI_24
indianred4 A_EV128580 38 GO:0005198 structural molecule activity 0.0018
lavenderblush2 C_JCVI_1353 35 GO:0009753 response to jasmonic acid stimulus 7.10E-05
lightcoral C_EV101618 36 No significant term
A_JCVI_36839 mediumpurple1 C_JCVI_27124 14 GO:0016740 transferase activity 4.60E-02
orangered1 A_JCVI_6967 12 GO:0006412 translation 0.013
C_JCVI_6967
orangered3 A_JCVI_10152 59 GO:0006412 translation 0.0041
Plum C_JCVI_25605 52 GO:0010154 fruit development 2.00E-07
A_JCVI_25605
plum2 C_JCVI_5013 136 GO:0016773 phosphotransferase activity, alcohol group as acceptor 0.013
salmon4 C_JCVI_22791 69 No significant term
A_EH421644
Skyblue C_JCVI_1160 212 GO:0009266 response to temperature stimulus 0.006
A_JCVI_1160
thistle2 C_JCVI_41561 117 GO:0043231 intracellular membrane-bounded organelle 0.022
A_JCVI_41561
yellow3 A_JCVI_391 23 No significant term
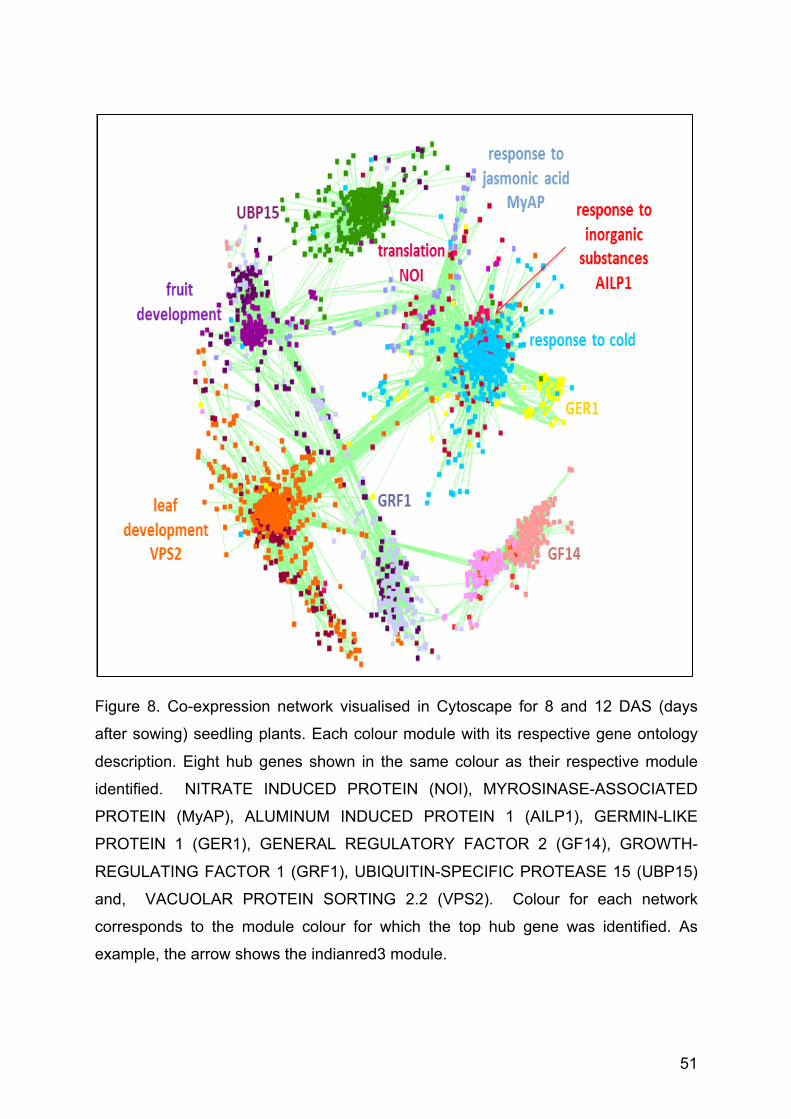
51
Figure 8. Co-expression network visualised in Cytoscape for 8 and 12 DAS (days
after sowing) seedling plants. Each colour module with its respective gene ontology
description. Eight hub genes shown in the same colour as their respective module
identified. NITRATE INDUCED PROTEIN (NOI), MYROSINASE-ASSOCIATED
PROTEIN (MyAP), ALUMINUM INDUCED PROTEIN 1 (AILP1), GERMIN-LIKE
PROTEIN 1 (GER1), GENERAL REGULATORY FACTOR 2 (GF14), GROWTH-
REGULATING FACTOR 1 (GRF1), UBIQUITIN-SPECIFIC PROTEASE 15 (UBP15)
and, VACUOLAR PROTEIN SORTING 2.2 (VPS2). Colour for each network
corresponds to the module colour for which the top hub gene was identified. As
example, the arrow shows the indianred3 module.
Figure 3. Co-expression correlation network for the 8DAS dataset and the names of the eight regulatory candidate
genes. The position of the eight candidate genes is shown in the network together with the function of the module.

52
5 Discussion
High throughput DGE data was generated to achieve parallel quantitative expression
profiling for hundreds of transcripts from each individual of the ExV8-DH mapping
population. The aim was to investigate global gene expression during seedling
development of WOSR, based on multiplexed DGE-tag profiling. The results
demonstrate that this method can be used to multiplex genotypes from a rapeseed
population and give enough DGE data to identify candidate genes for specific
complex trait regulation.
5.1 Multiplexing DGE-Ilumina sequencing for large plant
populations
Illumina multiplexed DGE-tag sequencing of seedling cDNA libraries from the ExV8-
DH population, segregating for a large population at a seedling developmental stage
have been performed. DGE multiplexed libraries were generated from the cross
parents 'Express 617' and 'V8', their F1 and 96 ExV8-DH lines that show maximal
phenotypic diversity during seedling development. Multiplexing of samples is a
suitable approach to reducing costs during the sequencing process. I have combined
DGE-Illumina sequencing with LongSAGE method to generate multiplexed DGE
(Obermeier et al. 2015) profiling data as a suggested method to uncover higher level
of complexity of transcriptomes (Hanriot et al. 2008, Asmann et al. 2009, Morrisy et
al. 2010).
For instance, a study of multiplexing sequencing of plant chloropast genomes using
Solexa sequencing by synthesis technology has been reported (Cronn et al. 2008). In
this study, Illumina DGE sequencing of short 3'-EST tag sequences have been found
to be a powerful alternative to conventional microarray expression analysis,
particularly for accurate quantification of low-abundance transcripts and potential
identification of unknown genes.
Similar to conventional serial analysis of gene expression (SAGE), digital gene
expression (DGE) tag sequencing library construction involves the production of
53
short tags from the 3’ end of mRNA molecules and compared to conventional
microarrays, which provides a hybridization-based measure of gene expression,
DGE has an advantage of significantly greater dynamic range limited only by
sampling depth and achieved high sensitivity. This leads to improved accuracy in the
quantification of abundant and rare transcripts and also excels de novo transcript
discovery, which is only possible for the subset of microarrays that have probes,
representing the entire genome (Morrisy et al. 2010). The general understanding of
DGE methods can be simplified as sequence tags created by restriction enzyme
digestion of cDNA, where the number of tags sequenced gives an absolute count (up
to 30 million) of all RNA in the sample with accuracy compared to qPCR. Because
DGE does not require any priori sequence information, it can be used for species
with inadequate reference genomes, and as tag databases (EST) that are revised,
existing data can be readily re-analyzed (Lakdawalla and VanSteenhouse 2008).
Such techniques based on sequencing of complete messenger RNA libraries
(mRNA-Seq) or of short cDNA-tags (digital gene expression; DGE), allow more
powerful studies in mapping populations with hundreds of individuals. Fully
quantitative mRNA-Seq is generally too expensive for frequent application in large
segregating populations. On the other hand, high-depth sequencing of short defined
tags offers a powerful alternative at a fraction of the price, which enables the
generation of highly quantitative global expression data in large populations of plant
individuals. Because it can be applied to large mapping populations of 100 or more
individuals at relatively low cost, the DGE approach like the one presented here are
suitable and cost-effective and accurate for further identification of transcript-based
markers for breeding. Many of the methods for library preparation to be used with
next-generation sequencing are amenable to sample multiplexing.
The ability to multiplex samples increases the efficiency of the system by enabling
the analysis of a large number of samples simultaneously. Indexing individual
samples requires the inclusion of an indexing tag (barcode) to the adapter
oligonucleotides that is unique to the sample. Samples would be prepared
separately, ligated to sample specific Illumina GEX1 adapter (index sequence +
adapter), and then combined for cluster information and sequencing. A four-base
index code would allow 256 individual codes (44 unique combinations would
therefore enable 256-plex sequencing).

54
5.2 DGE data analysis enables mapping to the Brassica unigenes
The DGE method was applied in order to perform deep transcriptome analysis and to
explore a large genome of winter oilseed rape (Brassica napus L.), using the doubled
haploid (DH) population Express617xV8 at the seedling stage. The multiplexed DGE
protocol described here for production of DGE libraries, with 21 bp tag length for
mapping populations with 96 genotypes allowed application of 8-plex barcoding for
sequencing in 12 flow cells on Illumina systems GAIIx (Obermeier et al. 2015). The
number of unique DGE-tag sequences detected, represented the quantitative
expression level of the corresponding transcript for each genotype. DGE-tags were
mapped to the Brassica unigenes AC ‘cured’, as reference sequence using 810,254
EST sequences, mainly from the three species B. napus, B. rapa and B. oleracea.
Mapping was conducted with the aim of specific identification of unigenes in B. napus
from each of the A and C genomes.
To do this, the mapping strategy was a three-step procedure based on estimates of
DGE specific tags. This is due to multiple Tag-to-gene matching ocurring in B. napus
because of its complex paleopolyploid structure. First, DGE-tag counts are evenly
distributed to the matching unigenes. Second, the average values of the relative
abundance of a gene expression, based on the specific tag-to-gene matching to
Brassica unigenes has to be done if the tag matched more than one unigene. And
thirdly, DGE-tags are added together if different tags matched the same unigene.
After this, the sum of DGE-tag counts for each unigene were normalised to a total tag
counts of 10, 000,000 for all DGE libraries.
This DGE normalised data was next used for detection of differentially expressed
genes as well as for the network analysis. In contrast to functional assays,
quantitative analysis of gene expression level lends itself to large scale
implementation, for this, two main approaches have been proposed. First, the
bulked-segregant analysis of DGE and second, the weighted gene co-expression
network analysis (WGCNA) for identification of candidate genes.

55
5.3 DGE-BSA approach contributes to the understanding of
complex trait regulation in winter oilseed rape
In the present study, DGE data based on 27 phenotypic traits have been used for
pooling of genotypes. Using BSA in combination with DGE data (BSA-DGE), many
genes differentially expressed in the developing seedlings of the B. napus ExV8-DH
mapping population were identified. For each time point, 8 and 12 DAS, differentially
expressed genes were identified using a relaxed P-value (p<0.05). Although, not
several genes belonging to the ABA biosynthetic pathway were identified here, the
presence of the RING/U-box superfamily protein has been recently reported to play a
role in transcriptional regulation in response to ABA in Arabidopsis thaliana (Jiang et
al. 2014). On the other hand, the enzyme ATP citrate lyase, also identified here as
differentially expressed, has been reported to be found in crude extracts from
endosperm tissue of germinating castor bean and showed its maximum activity in 4-
to 5-day-old seedlings (Fritsch and Beevers 1979).
The phytohormone abscisic acid (ABA) is well known for its regulatory roles in
integrating environmental constraints with the developmental programs of plants.
ABA affects a broad range of physiological processes during different developmental
stages. Therefore, ABA-regulated processes are generally divided into two broad and
overlapping categories: ABA signalling in seeds for maintenance of seed dormancy
and control of early seedling development. In the case of ABA trait for 12DAS, a
down-regulation of the LATE EMBRYOGENESIS ABUNDANT (LEA) gene was
identified. LEA gene expression has been reported during seed maturation and is
largely controlled by a combinatorial action of transcription factors.
Extensive analyses of promoter sequences for protein storage and LEA genes have
demonstrated the presence of elements required for hormone responsiveness,
stage- and tissue-specificity (Finkelstein 2014). The Leucine-rich repeat protein
kinase was also identified as differentially expressed for ABA3 at 8DAS. The
Leucine-rich repeat receptor-like kinase has been reported to be a key membrane-
bound regulator of abscisic acid at early signalling in Arabidopsis (Osakabe et al.
2005). Identification of MIKC (MADS intervening keratin-like and C-terminal), a key
transcription regulator involved in many process during plant development and FP1

56
(FRIGIDA INTERACTING PROTEIN 1), a plant-specific coiled-coil domain-containing
protein required for the up-regulation of FLC (FLOWERING LOCUS C), was also
observed, under ABA3 trait.
ABA regulate the expression of many agronomically important aspects of plant
development, including the synthesis of seed storage proteins and lipids, promotion
of seed desication and dormancy, inhibition of the phases of transition from
embryonic to germinative growth and from vegetative to reproductive growth (Leung
and Giraudat 1998, Johanson et al. 2000, Caicedo et al. 2004, Wang and Zhang
2008) Overall, ABA-regulated genes range from relatively high abundance
transcripts, which are required for adaptation or stress response, to low abundance
transcripts, which encode signalling components (Finkelstein et al. 1985, Finkelstein
and Sommerville 1989, Finkelstein et al. 2002). ABA pathways from the earliest
activities of FLC in the juvenile-to-adult transition and in response to abiotic stress
and hormonal action of various kinds, do relate the vegetative to reproductive
transition (Wang et al 2013, Zhang et al 2014).
In addition, CLV1 was found to be differentially expressed for complex traits such as
plant height at flowering as well as for shoot leaf weight. CLV1 is a putative receptor
kinase with an extracellular leucine-rich domain that controls shoot and floral
meristem size, and contributes to establish and maintain floral meristem identity
(Stone et al. 1998, Betsuyaku et al. 2011), thus suggesting its role during
development of winter oilseed rape. Differential expression of CLAVATA1 (CLV1)
gene delighted understanding for shoot meristem development when identified for
shoot fresh weight (SPHW) trait. In Arabidopsis, CLV1 gene is involved in
maintaining the balance between the stem cells in the central zone of the stem apical
meristem and the determined cells at its periphery (Clark et al. 1997, Martinov et al.
2004). Overlapping of CLV1 gene within traits, such as SPHW at 8 DAS, and plant
height at flowering for year 2006 (PH06) at 8 and 12 DAS suggested the importance
of identification of this gene as a regulator during transition phases from vegetative to
reproductive stage in winter oilseed rape. For instance, Elhiti and Stasola (2012)
efforts to identify the role of CLV1, during in vitro shoot formation in Brassica napus,
observed over-expression of BnCLV1 and acceleration of transition to differentiation
in transformed plants. Recently, CLV1 has been reported to join the plant root system
57
pathway playing a key role as a root stem cell regulator (Williams and Smet 2013,
Araya et al. 2014).
The TT7 (TRANSPARENT TESTA 7) was differentially expressed for seed yield trait
for year 2006. TT7 encode a flavonoid-3’-hydroxylase (F3’H) and is named
TRANSPARENT TESTA (TT) because it confers a pale-brown to yellow seed
phenotype when mutated (Xu et al. 2007, Auger et al. 2009, Routaboul et al. 2012)
Flavonoid metabolism has been largely elucidated in the model crucifer Arabidopsis
thaliana in which at least 23 loci are required for normal seed pigmentation (Lepiniec
et al. 2006) thus, they stand for good candidate genes to be investigated the
procyanidin-related molecular mechanisms in B. napus. For instance, TT7 ortholog
has been identified in oilseed rape (Xu et al. 2007).
Regarding the LHCB3 (LIGHT HARVESTING CHLOROPHYLL B BINDING
PROTEIN 3) gene was found to play a crucial role during seed yield in the year 2007.
LHCB3 is involved in reducing the rate of state transitions and containing trimers in
the M position associated more tightly to Photosystem II (PSII), conferring in some
way an evolutionary advantage to plants, in fact most of the photons that are
converted to biochemical energy and biomass through photosynthesis are harvested
by the major light-harvesting chlorophyll a/b binding antenna complex light-
harvesting complex II (LHCII), known as the most abundant proteins on earth. The
LHCB3 protein is synthesized in the cytosol, posttranslationally imported into the
chloroplasts, and inserted into the thylakoid membranes (Janson et al. 1992,
Damkjær et al 2009, Pietrzykowska et al. 2014).
Moreover, CRU2 (CRUCIFERIN 2) was one of the genes shown to be a differentially
expressed SY07 trait. CRU2 is synthesized during seed development, assembled
into very compact protein complexes, and finally stored in protein storage vacuoles
(Nietzel et al. 2013). Cruciferins are the major type of seed protein in Arabidopsis
(Pang et al. 1988) and B. napus and are 12S globulins, synthesized as
preproproteins, and are ultimately cleaved into a (30–35 kD) and b (21–25 kD)
polypeptides and assembled into hexamers. Plant seeds naturally accumulate
storage reserves, e.g, cruciferins that are mobilized during germination to provide
energy and raw materials to support early seedling growth (Lin et al. 2013). Previuos
studies, using the same parental line Express617 used in this study, reported

58
differentially expression of CRU2 at 35 days after pollination (DAP) (Obermeier et al.
2009).
The identification of differentially expressed genes in seedling plantlets was relevant
not only for its intrinsic biological significance, but also for discovering potential
targets and prognostic gene expression markers at an early developmental stage.
After identifying differentially expressed genes, the next step is to investigate,
whether these genes reveal functionally relevant information. As was mentioned
above, the CLV1 gene controls shoot and floral meristem and could be therefore a
very suitable candidate as key regulator in B. napus. The CLAVATA signalling
pathway consists of the small secreted CLV3 peptide, the receptor-like kinases CLV1
and CORYNE (CRN), and the receptor-like protein CLV2 (Clark et al. 1997). The
model for CLAVATA signalling suggests that CLV1, CLV2 and CRN perceive CLV3
peptide, and receptor activation functions to restrict the expression WUSCHEL
(WUS). The WUS expression acts as an organizing center required for maintenance
of the stem cell in shoot apical meristem.
The shoot apical meristem is responsible for aboveground organ initiation in higher
plants, accomplishing continuous organogenesis by maintaining a pool of
undifferentiated cells and directing descendent cells toward organ formation. The
CLAVATA signalling pathway regulates cell proliferation in fruit organ formation.
Thus, differential expression of CLV1 during seedling development could be useful
as a target for breeding adult plants oriented to improve yield stability. It is interesting
to note also the functional relevance of the LHCB3 gene expressed for the seed yield
trait. LHCB3 is part of the light-harvesting complex of higher plants very important
during photosynthesis process. The most likely role of LHCB3 is as an intermediary
between light energy transfer from the main LHCB1/LHCB2 antenna to the
photosystem II core. Usefulness of LHCB3 as a candidate gene expressed in young
plants for early stage of breeding selection of genotypes would lead to improving of
plant seed yield. In addition, to efficiently harvest solar energy, overexpression of
LCHB3 could be an option for increasing photosynthetic rate in B. napus. For this,
the use of the leaf-specific promoter region of LCHB3 would be recommended.
59
5.4 WGCNA candidate genes expressed during seedling
development
A well-known network strategy, WGCNA, has been applied as an easy approach for
network modelling based on simple correlation procedure for clustering genes by
their expression patterns. WGCNA helps us to identify modules with highly correlated
genes (Barabasi and Oltvai 2004, Keurentjes et al. 2007, DiLeo et al. 2011, Basnet et
al. 2013). Correlation analysis provides an overview of potential candidates genes
associated with a trait or development stage, thus the next would be finding of the
putative function of the highly correlated genes. Furthermore, in this work by using
DGE sequencing data to perform WGCNA gave an insight of how expression
variation contributes to phenotypic variation at early stages of seedling devlopment.
For complex traits, it was aimed to identify a major regulator, which largely explains
the phenotypic variation observed in winter oilseed rape during seedling
development. A combination of WGCNA and GO enrichment tests was realised to
better determine potential regulators involved during seedling development of the
ExV8-DH population.
A total of 15 top hub Brassica unigenes were identified for the 8 and 12 DAS DGE
datasets (Table 5). The IQD32, VPS2.2, MyAP, RPS18C, RPL27, NOI, AWPM-19,
UBP15, GF14, GRF1, and GER1 genes were clearly annotated to the genome of
Arabidopsis thaliana (Table 6) and their key role during plant development has been
reported before (Li et al. 2011). For instance, the IQD32 gene has been identified in
Arabidopsis and rice. IQD gene family members share as many as three calmodulin
binding motifs IQ, 1-5-10, and 1-8-14. While the IQD32 gene function has not been
well characterized, IQD1 has been shown to function in defense response to
herbivore. In contrast, the role of VPS2 may lie beyond shoot system development,
the membrane deformation and fission function is supported by the large fraction of
proteins annotated in and isolated from nuclei and the localization of AtVPS2.2-GFP
in the nucleus. Most of the membrane binding function is mediated by the large
multimeric ESCRT-III complex and associated proteins.
The endosomal sorting complexes required for transport (ESCRT) guides
transmembrane proteins to domains that bud away from the cytoplasm (Ibl et al.
2011). In the case of MyAP gene, it has been reported that myrosinases can be
60
found in seeds, seedlings, and mature tissues, although the amount of activity and
the type of isoenzymes expressed, differ with respect to both the type of organ and
the developmental stage (Bones 1990). Cloning and analysis revealed the existence
of a gene family encoding MyAP or MyAP-related protein and that transcripts
corresponding to MyAP in non-wounded plants are found predominantly in seeds and
to response to jasmonic acid (Taipalensuu et al. 1997).
Furthermore, MyAP displayed considerable similarity to an early nodulin (ENOD8)
from Medicago sativa and to a proline-rich protein (APC), described as anther
specific, from Arabidopsis tbaliana and B. napus (Taipalensuu et al. 1996). This
could be an important key regulator during seed development at the end of flowering
stage for winter oilseed rape. Thus to be correlated with yield and yield components.
For instance, comprehensive phenotype characterization UBP15 gene using ubp15
mutants revealed that UBP15 plays a critical role in Arabidopsis leaf development by
controlling cell proliferation and reproductive development. Both ubp15 mutants
produced narrow rosette leaves that are serrated and flat, and exhibit a decrease in
the cell number in a transverse section across the lamina, whereas the UBP15
overexpression line shows an opposite phenotype. This indicates that UBP15 can
affect the leaf shape by controlling cell proliferation, possibly by regulating cell-cycle
proteins (Liu et al. 2008).
Another key regulator identified and playing an important role during plant
development was GRF1. Generally, growth regulating factors (GRFs) are a
conserved class of transcription factor in seed plants specifically involved in leaf
development (Figure 10). The implication of GRFs in biotic stress response reports a
role of these transcription factors in coordinating the interaction between
developmental processes and defense dynamics. However, the molecular
mechanisms by which GRFs mediate the overlaps between defense signaling and
developmental pathways are elusive (Liu et al. 2014). GRF1 seems to fine-tune the
crosstalk between microRNA (miRNA) signaling networks by regulating the
expression of several miRNA target genes. Li et al. (2011) reported that
microRNA396 (miR396)-targeted Arabidopsis growth-regulating factors (AtGRFs) are
required for leaf adaxial–abaxial polarity formation during leaf morphogenesis. It is
further shown that miR396 negatively regulates cell proliferation in leaves by
controlling the entry into the mitotic cell cycle, coincident with its expression in leaf

61
cells arrested for cell division. Because, the cells are unable to enter into the mitotic
cell cycle often undergo enlargement and expansion to start differentiation
(Nieuwland et al. 2009). These data together with previous results strongly suggest
that active cell division in the primordium is important for leaf adaxial– abaxial polarity
formation, and highlights that miR396- targeted at AtGRFs may mediate coordination
processes of cell division, coupled with cell differentiation during leaf morphogenesis.
On the other hand, GER1 was first identified in germinating wheat embryos and was
shown to play an important role in the plant defense response as well as to possess
oxalate oxidase activity (Sharkawy et al. 2010). Proteins with sequence similarity to
germins have been identified in various plant species, termed ‘germin-like proteins’
(GLPs). They were assumed to be structural proteins as a consequence of their
localization in the extracellular matrix. Regarding RPS18C and RPL27 genes, it has
been suggested, that expression of ribosomal protein genes in plants and other
organisms is coordinately regulated (Gannt and Key 1985) and a number of plant
ribosomal protein genes have been isolated, including cDNA clone from Solanum
tuberosum TUBL27 (Taylor and Davies 1994). Furthermore, RPS18C leader
mediated cap independent translation (CIT) as demonstrated by dicistronic
constructs consisting of luciferase and chloramphenicol acetyl transferase reporter
genes in an in vitro wheat germ extract system. CIT was rapidly inhibited upon
addition of an oligonucleotide that competed for the 18S rRNA site complementary to
the RPS18C leader and interfered with polysome assembly at the transcript
(Vanderhaeghen et al. 2006).
In addition to this, no link between NOI proteins and nitrogen metabolism has been
established. The family of proteins containing NOI domains contains members,
exclusively from the plant lineage as far back as moss. In addition to the conserved
NOI domain, family members containing conserved C-terminal cysteine residues
which are sites for acylation and membrane tethering, might be involved in defense
associated vesicle trafficking. The NOI domain comprises of approximately 30 amino
acids and contains 2 conserved motifs (PXFGXW and Y/FTXXF) (Afzal et al. 2013).
Another gene identified, was belonging to the AWPM-19 like membrane family
protein, whose members are 19 kDa membrane proteins. It is known that levels of
the plant protein AWPM-19 increases dramatically when there is an increased level
of abcisic acid (ABA). The increasing presence of this protein has been related to a

62
greater tolerance of freezing. The increased freezing tolerance of ABA-treated cells
was closely associated with the remarkable accumulation of 19-kDa polypeptides in
the plasma membrane of suspension-cultured cells derived from immature embryos
of winter wheat (Triticum aestivum L. cv. Chihoku). The response to ABA treatments
indicated that this protein is relevant for further research, to study its role in the
freezing tolerance process (Koike et al. 1997).
GF14 called GRF2, has been reported to be a member of the 14-3-3 protein family
that activates Tyr and Trp hydroxylases, modulate protein kinase C activity, and
activate ADP-ribosyltransferase. The mRNAs of the GF14 gene is encoded by six
exons interrupted by five introns. The transcriptional units of the GF14 gene was
found to be very similar, with complete conservation of the intron positions (de Vetten
and Ferl 1994). The 14-3-3 proteins were the first signaling molecules to be identified
as discrete phosphoserine/threonine binding modules. This family of proteins, which
includes seven isotypes in human cells and up to 15 in plants, plays critical role in
cell signaling events that control the progress through the cell cycle, transcriptional
alterations in response to environmental cues, and programmed cell death. Protein
14-3-3 are a family of evolutionary conserved dimeric proteins that accomplish a wide
range of regulatory roles in eukaryotes, including cell cycle control, mitogenesis, and
apoptosis. In plants, these proteins regulate primary metabolism, ion transport,
cellular trafficking, gene transcription and hormone signalling (Palluca et al. 2014).
The key emerging role for GF14 including its role in the response to the plant
extracellular environment, particularly environmental stress, pathogens and light
conditions and address potential key roles in primary metabolism, hormone signaling,
growth and cell division (Aducci et al 2002, Denison et al 2011
It should be apparent that network analysis of gene interaction patterns bears a
striking resemblance to what is now called ‘systems biology’. One of the central
questions in this field is whether there are emergent properties of complex systems
that are not predicted from looking at individual systems components, yet are
essential for understanding the function of the system as a whole. The gene
interactions of IQD32, VPS2.2, MyAP, RPS18C, RPL27, NOI, AWPM-19, UBP15,
GF14, GRF1, and GER1 genes within their respective consensus module need to be
further studied to really understand complex patterns of gene regulation. These 15
63
genes have been further selected for evaluation of relative expression using qPCR
during seedling development (Körber et al. 2015).
5.5 Gene expression of complex traits
Nowadays gene expression represents a major genetic basis for complex traits.
Many complex traits of biological and agronomic significance in plants are controlled
in a complex manner by multiple genes. Candidate genes that display differential
expression and networks, defined by shoot and leaf development-related genes
could be identified. Thus, Holland (2007) suggested that gene expression analyses
would be an important tool for unraveling genetic architecture and the connections
between genotypic and phenotypic variation, but the results of such studies require
careful interpretation, since gene expression levels are phenotypes that can be
affected by numerous loci beyond the specific gene, whose mRNA level is being
considered. Many traits that are important for fitness and agricultural value of plants
are complex quantitative traits, affected by many genes, the environment, and
interactions between genes and environments.
Genetic dissection of transcript abundance or either DGE data has shed on the
architecture of quantitative traits, providing a new approach for connecting mRNA
sequence variation with phenotypic variation, and has improved our understanding of
transcriptional regulation and regulatory variation in plants (Rockman and Kruglyak
2006, Shen et al. 2011, Nishiyama et al. 2012, Zhang et al. 2014). In the last decade,
DGE global transcriptome profiling methods have evolved rapidly due to the
increasing availability and diversity of cost-effective next generation sequencing
technologies (Hunt et al. 2011, Wei et al. 2013, Philippe et al. 2014). A focal point in
the field of eukaryotic gene regulation is understanding the mechanisms of
transcription control. The prevailing view is that this regulation is mediated, in part, by
interplay between distinct DNA sequence elements found in the promoter region of a
gene and sequence-specific DNA-binding proteins. In plant systems, there has been
a major effort to identify DNA-binding proteins specifically interacting with their
cognate promoter sites and to elucidate how the binding of such proteins results in
increased or decreased transcription of the associated gene. Furthermore,
determining the genetic basis for the variation during seedling development had great

64
potential for both, modification of metabolic composition through classical breeding
and for unravelling metabolic, regulatory, and developmental pathways.
In addition to this, epistatic effects could also be suggested, to highlight complex
interactions that would explain a complex phenotype. Epistasis, or interactions
between different genes, has long been recognized to be fundamentally important to
understanding both the structure and function of genetics pathways as well as the
evolutionary dynamics of complex genetic systems e.g FLC, FRI interactions
(Caicedo et al. 2004, Philips 2008, Chiu et al. 2012, Wan et al. 2013, Le Rouzic
2014). Genetic interactions among loci is called epistasis, and among traits is
referred to as pleiotropy. Recent multi-trait analyses at different phenotypic levels are
uncovering the pleiotropy and the genetic regulation underlying high-level complex
traits (Blanco and Méndez-Vigo 2014). The existence of pleiotropic loci is well
documented in model organisms.
Since the Brassica A and C genomes most likely have arisen from a hexaploid
ancestor common to Arabidopsis, with a series of chromosomal rearrangements and
duplications (Lysak et al. 2005, Chaloub et al. 2014), I extended my analysis by using
the ‘Express617xV8’ double haploid (ExV8-DH) mapping population composed of
homozygous lines to increase the likelihood of detecting significant differentially
expressed genes and genetic effects associated with the complex traits (e.g.
flowering, seed yield) and thus, information on their complex biosynthetic pathway.
Unraveling the genetic architecture of complex traits in plants will require many more
studies along the parallel tracks of detailed analysis of small genome regions and
large-scale investigations of the genome function across diverse populations.
Nevertheless, deciphering the genetic and molecular bases of quantitative variation
is a long-standing challenge in plant biology because, it is essential for understanding
evolution and for accelerating plant breeding (Blanco and Méndez-Vigo 2014). To
date, Chalhoub et al (2014) released a whole genome sequence of B. napus and
aligments with progenitors A and C genomes have been performed. Further
annotation of our DGE data with the genome of B. napus would be useful to fully
ease an understanding of the candidate regulatory genes identified in this study. The
DGE data presented in this work are the basis for ongoing breeding programmes in

65
oilseed rape, because detailed knowledge on the genetic diversity between
genotypes in the frame of a breeding programme is of prime interest and facilitates a
more efficient selection of parental genotypes for both, line and hybrid breeding.
BSA-DGE allowed the identification of genes associated with several traits during
seedling development of winter oilseed rape. Overall, differentially expressed genes
revealed candidate genes associated with shoot system development, plant height at
flowering, and seed yield traits in the years 2006 and 2007. The last question here
would be whether one approach was better than the other for meeting the stated
objectives. Transcriptome analysis or WGCNA alone are not sufficient to identify
candidate genes, instead it is necessary to integrate this data with other genetic
approaches such as eQTL since, we need to specifically dissolve localized genomic
regions.

66
6 Summary
A more efficient digital gene expression (DGE) method to produce sequencing data
by multiplexing from a large plant population of winter oilseed rape (Brassica napus
L.) was created. Subsequently, DGE analysis to identify candidate regulatory genes
associated with complex traits during seedling development was performed. Seedling
vigour is an important trait due to its influence on seedling establishment before
winter and the consequent effects on yield and yield stability. The multiplexed-DGE
analysis was proved to be a cost-effective method for large-scale quantitative
transcriptome analysis, using next-generation Illumina (Solexa) sequencing. The
normalised DGE data with barcode multiplexed indexing could then be successfully
applied to weighted gene co-expression network analysis (WGCNA) together with an
integration of phenotypic and metabolic hormone data.
A bulked-segregant analysis (BSA)-DGE approach was used in this study. For each
of the investigated traits, 20 best and 20 worst performing individuals, respectively,
were assigned to bulks with significant phenotypic variance. The bulked DH lines
segregate strongly for numerous complex quantitative traits, e.g. development,
vigour, flowering, and yield components. A number of significantly differentially
expressed genes could be identified.
The regulatory gene CLV1 (CLAVATA 1) was found to be differentially expressed for
traits such as shoot fresh weight and plant height at flowering for year 2006. This
suggests its role as regulatory component of the molecular network controlling shoot
meristem activity in winter oilseed rape. In addition, the genes NIP (NOD26-LIKE
INTRINSIC PROTEIN), LHCB3 (LIGHT HARVESTING CHLOROPHYLL B BINDING
PROTEIN 3), TT7 (TRANSPARENT TESTA 7) and CRU2 (CRUCIFERIN 2) were
significantly differentially expressed for the seed yield trait for years 2006 and 2007.
Interestingly, NIP, which belongs to the aquaporin superfamily and is plant-specific,
was found to be differentially expressed at both 8 and 12 DAS. The expression of
NIP in WOSR indicates a wide range of function that may include a greater range in
selectivity. The LHCB3 gene is a component of the main light harvesting chlorophyll
a/b-protein complex of Photosystem II (PSII) and is therefore very important during
the photosynthetic process. CRU2 belongs to an important group of seed storage

67
proteins in Brassica napus, the 12S globulin complex, and is synthesized during seed
development.
In addition, a total of fifteen Top Hub Brassica Unigenes for A (B. rapa) and C (B.
oleracea) genomes were identified as candidate regulatory genes for complex trait
interaction during seedling development. Annotation of these Top Hub Unigenes with
Arabidopsis thaliana genome (by BLASTX, TAIR 10 and agriGO) was performed to
determine gene functions and they could be related to leaf and shoot system
development, cytokinin pathway and circadian clock. The transcription activators
GRF1 (GROWTH REGULATING FACTOR 1), UBP15 (UBIQUITIN-SPECIFIC
PROTEASE 15), and VPS2 (VACUOLAR PROTEIN SORTING 2) were found to play
a key role in leaf and shoot system development. Furthermore, GF14 (G BOX
FACTOR 14-3-3 OMEGA) also known as GRF2 was identified within the co-
expression network interacting almost all aspects of plant growth and development,
including hormonal metabolism and gene transcription. These results gave an insight
into the genetic regulation of complex traits, providing some candidate genes and
allowing to some extent an interpretation of their regulatory role. The DGE data
presented in this study comprise a novel basis for further genetical genomics
approaches, e.g. eQTL, gene isolation, functional validation, and development of
gene expression markers (GEMs).
68
7 Zuzammenfassung Im Rahmen der vorliegenden Arbeit wurde eine verbesserte Multiplex-Methodik der
Digitalen Genexpressionsanalyse (DGE) anhand einer großen Winterraps-Population
(Brassica napus L.) etabliert. Die DGE-Analyse wurde eingesetzt, um Kandidaten für
regulatorische Gene von komplexen Merkmalen der Keimlingsentwicklung zu
identifizieren. Die Keimlingsentwicklung ist ein wichtiges Entwicklungsstadium wegen
seiner Rolle für die Etablierung der Pflanzen vor Winter und damit die Ertragsbildung
und Ertragstabilität. Wie nachgewiesen werden konnte, stellt die Multiplex-DGE
Analyse eine nützliche Methode für die quantitative Hochdurchsatz-Transkriptom-
Analyse (’Next-Generation Illumina’ Sequenzierung) dar. Anhand der DGE-Daten
konnte mithilfe von Multiplex-Barcodes und durch Integration von phänotypischen
und metabolischen Hormondaten eine Genkoexpressions-Netzwerkanalyse
erfolgreich durchgeführt werden.
Ferner wurde eine ’bulked segregant analysis’ (BSA) durchgeführt und mit den
Ergebnissen der DGE-Analyse verglichen. Für jedes der untersuchten Merkmale
wurden die 20 Genotypen (DH-Linien) mit der höchsten sowie 20 Genotypen mit der
niedrigsten Merkmalsausprägung (größte phänotypische Abweichung gemäß simple
t-test, p < 0.05) zwei extremen Gruppen zugeordnet. Die DH-Linien Bulks
differenzierten stark für zahlreiche komplexe quantitative Merkmale, z.B.
Sprossfrischgewicht, Blühzeit und Samenertrag.
Mehrere differentiell exprimierte Gene konnten identifiziert werden. Das Gen
CLAVATA 1 (CLV1) erwies sich als involviert in Merkmale wie Sprossfrischgewicht,
Pflanzenhöhe und Blühzeitpunkt. CLV1 besteht zum einen aus einer extrazellulären
Domäne, die sich aus wiederholenden Leucin-reichen Motiven zusammensetzt und
für eine Interaktion von Rezeptor und Ligand sorgen könnte. Eine Rolle von CLV1 als
regulatorische Komponente im apikalen Sprossmeristem von Winterraps konnte
festgestellt werden. Die Gene NIP (NOD26-LIKE INTRINSIC PROTEIN), LIGHT
HARVESTING CHLOROPHYLL B BINDING PROTEIN 3 (LHCB3), TRANSPARENT
TESTA 7 (TT7) und CRUCIFERIN 2 (CRU2) wurden differentiell exprimiert für das
komplexe Merkmale Samenertrag. Das Gen LHCB3 ist ein Bestandteil des
Chlorophyll a/b-Protein-Komplexes im Photosystem II (PSII) und ist deshalb relevant
im Photosynthese-Prozess. Ferner gehört das Gen CRU2 zum 12S-Globulin-

69
Komplex, einer wichtigen Gruppe von Samenvorratssproteinen in B. napus, die
während der Samenentwicklung synthetisiert werden.
Insgesamt fünfzehn „Schlüsselgene“ (Unigene) wurden im Brassica napus AACC-
Genom als regulatorische Kandidatengene für Komplexmerkmale der
Keimlingsentwicklung identifiziert. Es wurde eine Annotation dieser ‘Top Hub’
Unigene anhand des Genoms von Arabidopsis thaliana durchgeführt, um
Genfunktionen zu identifizieren. Manche Gene erscheinen gleichermaßen involviert
in die Sprosssystementwicklung, den Cytokinin-Stoffwechsel und den circadianen
Rhythmus. Wie die Ergebnisse andeuten, haben die Transkiptsionsaktivatoren
GROWTH REGULATING FACTOR 1 (GRF1), UBIQUITIN-SPECIFIC PROTEASE
15 (UBP15), und VACUOLAR PROTEIN SORTING 2 (VPS2) eine Schlüsselrolle für
die Blatt- und Sprosssystem-Entwicklung. Außerdem wurde der Transkriptionsfaktor
G BOX FACTOR 14-3-3 OMEGA, auch bekannt als GRF2 (GF14), als Komponente
des Gen-Koexpressionsnetzwerks identifiziert, der in viele Vorgänge des
Pflanzenwachstums und der Entwicklung, einschließlich der hormonellen Regulation
und Gen-Transkiption involviert ist. Die vorliegenden Ergebnisse geben wichtige
Hinweise auf die genetische Regulierung von komplexen Leistungsmerkmalen. Es
wurden Kandidatengene identifiziert, deren regulatorische Rolle nun weiterer
Interpretation bedarf. Die in dieser Studie präsentierten Daten aus der DGE bilden
eine Basis für weitere zielführende Ansätze des ‘Genetical Genomics’, wie z.B.
eQTL, Genisolierung, funktionelle Genanalyse und Entwicklung von Gen-expression
Markern.

70
8 References
AGI Arabidopsis Genome Initiative. 2000. Analysis of the genome of the flowering plant Arabidopsis thaliana. Nature 408: 796-815. Asmann YW, Klee EW, Thompson EA, Perez EA, Middha S, Oberg AL, Therneau TM, Smith DI, Poland GA, Wieben ED and Kocher JPA. 2009. 3’ tag digital gene expression profiling of human brain and universal reference RNA using Illumina Genome Analyzer. BMC Genomics 10: 531
Aoki K, Ogata Y, Shibata D. 2007. Approaches for extracting practical information from gene co-expression networks in plant biology. Plant Cell Physiol 48: 381-390.
Aducci P, Camoni L, Marra M, Visconti S. 2002. From Cytosol to Organelles: 14-3-3 Proteins as Multifunctional Regulators of Plant Cell. IUBMB Life 53: 49-55
Audic S and Claverie JM. 1997. The significance of digital gene expression profiles. Genome Res 7: 986-995. Bancroft I, Morgan C, Fraser F, Higgins J, Wells R, Clissold L, Baker D, Long Y, Meng J, Wang X, Liu S, Trick M. 2011. Dissecting the genome of the polyploid crop oilseed rape by transcriptome sequencing. Nat Biotechnol 29: 762-766
Barabasi AL, Dezso Z, Ravasz E, Yook S-H, Oltvai Z. 2003. Scale-Free and Hierarchical Structures in Complex Networks. In: Garrido PL, Marro J, editors Granada (Spain). AIP 1–16.
Barabasi AL, Oltvai ZN. 2004. Network biology: understanding the cell’s functional organization. Nature Reviews Genetics 5:101-113 Barker G, Larson TR, Graham IA, Lynn JR, Graham JK. 2007. Novel insights into seed fatty acid synthesis and modification pathways from genetic diversity and quantitative trait loci analysis of the C genome. Plant Physiology 144:1827-1842 Basunanda P, Radoev M, Ecke W, Friedt W, Becker HC, and. Snowdon RJ. 2010. Comparative mapping of quantitative trait loci involved in heterosis for seedling and yield traits in oilseed rape (Brassica napus L.). Theor Appl Genet 120:271-281 Bentley DR. 2006. Whole-genome re-sequencing. Curr Opin Genet Dev 16: 545-552 Blum A. 1996. Crop responses to drought and the interpretation of adaptation. Plant Growth Regulation 20:135-148 Bräutigam A and Gowik U. 2010. What can next generation sequencing do for you? Next generation sequencing as a valuable tool in plant research. Plant Biology 12: 831-841
Brem RB, Yvert G, Clinton R, Kruglyak L. 2002. Genetic dissection of transcriptional regulation in budding yeast. Science 296: 752–755

71
Bonaventure G, Ohlrogge JB. 2002. Differential regulation of mRNA levels of acyl carrier protein isoforms in Arabidopsis. Plant Physiol 128: 223-235 Bones AM.1990. Distribution of ß-thioglucosidase activity in intact plants, cell and tissue cultures and regenerant plants of Brassica napus L. J Exp Bot 41: 737-744
Caicedo AL, Stinchcombe JR, Olsen KM, Schmitt J, and Purugganan MD. 2004. Epistatic interaction between Arabidopsis FRI and FLC flowering time genes generates a latitudinal cline in a life history trait. Proc Natl Acad Sci USA 101: 15670-15675.
Carmell MA, Xuan Z, Zhang MQ, Hannon GJ. 2002. The Argounate family: tentacles that reach into RNAi, developmental control, stem cell maintenance and tumorigenesis. Genes and Development 16:2733-2744
Carter SL, Brechbler CM, Griffin M and Bond AT. 2004. Gene co-expression networks topology provides a framework for molecular characterization of cellular state. Bioinformatics 20: 2242-2250
Carré P and Pouzet A. 2014. Rapeseed-tremendous potential for added value generation? Oilseeds & fat Crops and Lipids 21(1) D102 DOI: 10.1051/ocl/2013054 Chalhoub B, Denoeud F, Liu S, Parkin IAP, Tang H, Wang X, Chiquet J, Belcram H, Tong C, Samans B, Corréa M, Da Silva C, Just J, Falentin C, Koh CS, Le Clainche I, Bernard M, Bento P, Noel B, Labadie K, Alberti A, Charles M, Arnaud D, Guo H, Daviaud C, Alamery S, Jabbari K, Zhao M, Edger PP, Chelaifa H, Tack D, Lassalle G, Mestiri I, Schnel N, Le Paslier MC, G Fan, Renault V, Bayer PE, Golicz AA, Manoli S, Lee TH, Thi VHD, Chalabi S, Hu Q, Fan C, Tollenaere R, Lu Y, Battail C, Shen J, Sidebottom CHD, Wang X, Canaguier A, Chauveau A, Bérard A, Deniot G, Guan M, Liu Z, Sun F, Lim PY, Lyons E, Town CD, Bancroft I, Wang X, Meng J, Ma J, Pires JC, King GJ, Brunel D, Delourme R, Renard M, Aury JM, Adams KL, Batley J, Snowdon RJ, Tost J, Edwards D, Zhou Y, Hua W, Sharpe AG, Paterson AH, Guan C, Wincker P. 2014. Early allopolyploid evolution in the post-Neolithic Brassica napus oilseed genome. Science 345: 950-953 DOI: 10.1126/science.1253435
Chen X, Hedley P.E, Morris J, Liu H, Niks R.E and Waugh R. 2011. Combining genetical genomics and bulked segregant analysis-based differential expression: an approach to gene localization. Theor Appl Genet 122:1375-1383
Chen S, Jiang J, Li H, and Liu G. 2012. The salt-responsive transcriptome of Populus simonii x Populus nigra via DGE. Gene 10:203-12 DOI: 10.1016/j.gene.2012.05.023 Chiang GC, Barua D, Kramer EM, Amasino RM, Donohue K. 2009. Major flowering time gene, FLOWERING LOCUS C, regulates seed germination in Arabidopsis thaliana. Proc Natl Acad Sci USA 106: 11661-11666 Clark SE, Williams RW, Meyerowitz EM. 1997. The CLAVATA1 gene encodes a putative receptor kinase that controls shoot and floral meristem size in Arabidopsis. Cell 89: 575-585 Darvasi A. 2003. Gene expression meets genetics. Nature 422:269-270

72
DeCook R, Lall S, Nettleton D, Howell SH. 2006. Genetic regulation of gene expression during shoot development in Arabidopsis. Genetics 172: 1155-1164. Deng W, Ying H, Helliwell CA, Taylor JM, Peacock WJ, Dennis ES. 2011. FLOWERING LOCUS C (FLC) regulates development pathways throughout the life cycle of Arabidopsis. Proc Natl Acad Sci USA, 108(16): 6680–6685. Denison FC, Paul AL, Zupanska AK, Ferl RJ. 2011. 14-3-3 proteins in plant physiology. Semin Cell Dev Biol 22:720-727 doi: 10.1016/j.semcdb.2011.08.006 DiLeo M, Strahan GD, den Bakker M, Hoekenga OA. 2011. Weighted correlation network analysis (WGCNA) applied to Tomato Fruit Metabolome. PLoS ONE 6: e26683 Edwards J, Martin AP, Andriunas F, Offler CE, Patrick JW, McCurdy DW. 2010. GIGANTEA is a component of a regulatory pathway determining wall ingrowth deposition in phloem parenchyma transfer cells of Arabidopsis thaliana. Plant J 63: 651-661. Edwards D, Batley J and Snowdon RJ. 2013. Accessing complex crop genomes with next-generation sequencing. Theoretical and Applied Genetics 126:1-11 Eisen MB, Spellman PT, Brown PO and Botstein D. 1998. Cluster analysis and display of genome-wide expression patterns. Proc Natl Acd Sci 95:14863-14868 Eveland AL, Satoh-Nagasawa N, Goldshmidt A, Meyer S, Beatty M, Sakai H, Ware D, Jackson D. 2010. Digital Gene Expression Signatures for Maize Development. Plant Physiology 154:1024-1039 Fernández-del-Carmen A, Celis-Gamboa C, Visser RGF, Bachem CWB. 2007. Targeted transcript mapping for agronomics traits in potato. Journal of Experimental Botany 58:2761-2774 Finkelstein RR, Tenbarge K, Shumway J, Crouch M. 1985. Role of absicic acid in maturation of rapeseed embryos. Plant Physiol 78:630-636 Finkelstein RR and Sommerville C. 1989. Absicic acid or high osmoticum promotes accumulation of long chain fatty acids in developing embryos of Brassica napus. Plant Science 61: 213-217 Finkelstein RR, Gampala SSL, Rock CD. 2002. Absiscic acid signaling in seed and seedlings. The Plant Cell S15-S45 Gibson G and Weir B. 2005. The quantitative genetics of transcription. TRENDS in Genetics 21: 616-623 Hanriot L, Keime C, Gay N, Faure C, C. Dossat P, Wincker C, Scoté-Blachon C, Peyron C, Gandrillon O. 2008. A combination of LongSAGE with Solexa sequencing is well suited to explore the depth and the complexity of transcriptome. BMC Genomics 9: 418

73
Higgins J, Magusin A, Trick M, Fraser F, Bancroft I. 2012. Use of mRNA-seq to discriminate contributions to the transcriptome from the constituent genomes of the polyploid crop species Brassica napus. BMC Genomics 13:247 Holland JB. 2007. Genetic architecture of complex traits in plants. Current opinion in Plant Biology 10:156-161 Horton P, Johnson MP, Perez-Bueno ML, Kiss AZ, and Ruban AV. 2008. Photosynthetic acclimation: Does the dynamic structure and macro-organisation of photosystem II in higher plant grana membranes regulate light harvesting states? FEBS J 275:1069-1079.
Horton P, Ruban AV, and Walters RG. 1996. Regulation of light harvesting in green plants. Plant Mol Biol 47: 655-684.
Howell EC, Kearsey MJ, Jones GH, King GJ, and Armstrong SJ. 2008. A and C genome distinction and chromosome identification in Brassica napus sequential fluorescence in situ hybridization and genomic in situ hybridization. Genetics 180: 1849-1857 Illumina. 2008. Preparing Samples for Digital Gene Expression-Tag Profiling with DpnII. http://grcf.jhmi.edu/hts/protocols/1004241_GEX_DpnII_Sample_Prep.pdf. Accessed 26 June 2012. Invitrogen. 2010. I-SAGE™ Long Kit. For constructing Long SAGE™ libraries. http://tools.invitrogen.com/content/sfs/manuals/isagelong_man.pdf. Accessed 26 June 2012. Ingvarsson PK and Street NR. 2011. Association genetics of complex traits. New Phytologist 189: 909-22 Jadhav AS, Taylor DC, Giblin M, Ferrie AMR, Ambrose SJ, Ross ARS, Nelson KM, Zaharia I, Sharma N, Anderson M, Fobert PR, Abrams SR. 2008. Hormonal regulation of oil accumulation in Brassica seeds: Metabolism and Biological activity of ABA, 7’-, 8’- and 9’-hydroxy ABA in microspore derived embryos of Brassica napus. Phytochemistry 69: 2678-2688
Jansson S, Virgin I, Gustafsson P, Andersson B, and Oquist G. 1992. A nomenclature for the genes encoding the chlorophyll a/b- binding proteins of higher plants. Plant Mol Biol Rep 10: 242-253.
Jiang G, Jiang X, Lu P, Liu J, Gao J, Zhang C. 2014. The Rose (Rosa hybrida) NAC Transcription Factor 3 Gene, RhNAC3, Involved in ABA Signaling Pathway Both in Rose and Arabidopsis. PLoS ONE 9: e109415. doi:10.1371/journal.pone.0109415
Johanson U, West J, Lister C, Michaels S, Amasino R, and Dean C. 2000. Molecular analysis of FRIGIDA, a major determinant of natural variation in Arabidopsis flowering time. Science 290:344-347. Johnston JS, Pepper AE, Hall AE, Chen ZJ, Hodnett G, Drabek J, Lopez R, Price HJ. 2005. Evolution of genome size in Brassicaceae. Ann Bot 95: 229-235.

74
Kahl G, Molina C, Rotter B, Jüngling R, Frank A, Krezdorn N, Hoffmeier K, Winter P. 2012. Reduced representation sequencing of plant stress Transcriptomes. J Plant Biochem Biotechnol 21:119-127 DOI 10.1007/s13562-012-0129-y!
Katsuoka F, Yokozowa J, Tsuda K, Ito S, Pan X, Nagasaki M, Yasuda J, and Yamamoto M. 2014. An efficient quantitation method of next-generation sequencing libraries by using MiSeq sequencer. Anal Biochem 466:27-9. doi: 10.1016/j.ab.2014.08.015 Ketting RF, Fischer SEJ, Bernstein E, Sijen T, Hannon GJ, Plasterk RHA. 2001. Dicer functions in RNA interference and in synthesis of small RNA involved in developmental timing in C. elegans. Genes and Development 15:2654-2659 Keurentjes JJB, Fu J, Terpstra IR, Garcia JM, van den Ackerveken G, Snoek LB, Peeters AJ, Vreugdenhil D, Koornneef M, Jansen RC. 2007. Regulatory network construction in Arabidopsis by using genome-wide gene expression quantitative trait loci. Proc Natl Acad Sci USA 104:1708-1713 Kliebenstein DJ. 2009b. A quantitative genetic approach and ecological model system: Understanding the aliphatic glucosinolate biosynthetic network via QTLs. Phytochem. Rev. 8:243-254 Kloosterman B, Oortwijn M, Willigen J, America T, de Vos R, Visser RGF, Bachem CWB. 2010. From QTL to candidate gene: genetical genomics of simple and complex traits in potato using a pooling strategy. BMC Genomics 11:158 Kong F, Ge C, Fang X, Snowdon RJ and Wang Y. 2010. Characterization of seedling proteomes and development of markers to distinguish the Brassica A and C genomes. J Genet Genomics 37:333-340
Lakdawalla A, VanSteenhouse H. 2008. Illumina Genome Analyzer II System. In: Next-Generation Genome Sequencing, WILEY-VCH Verlag GmbH & Co. KGaA, Weinheim. Langfelder P and Horvath S. 2008. WGCNA: an R package for weighted correlations network analysis. BMC Bioinformatic 9: 559 Leitch AR and Leitch IJ. 2008. Genomic Plasticity and the Diversity of Polyploid Plants. Science 320:481-483. Leung MP and Giraudat J. 1998. Absicic acid signalling transduction. Annu Rev Plant Physio. Plant Mol Biol 49:199-222 Le Rouzic A. 2014. Estimating directional Epistasis. Frontiers in Genetics 5:198 Li J, Chen L, Wang R, Duan Y. 2007. A strategy for breeding of the yellow-seeded hybrid in Brassica napus L. In: Proceedings of 12th International Rapeseed Congress, Science Press USA Inc., Genetics and Breeding, pp 11–13
Li H and Zhang P. 2012. Systems genetics: challenges and developing strategies. Biologia 67:435-446.
75
Liu L, Li Y, Li S, Hu N, He Y, Pong R, Lin D, Lu L, and Law M. 2012. Comparison of Next-Generation Sequencing Systems. Journal of Biomedicine and Biotechnology 1:11 doi:10.1155/2012/251364
Liu S, Yeh C-T, Tang HM, Nettleton D, Schnable PS. 2012. Gene mapping via bulked segregant RNA-seq (BSR-Seq). PLoS ONE 7:e36406 Livaja M, Wang Y, Wieckhorst S, Haseneyer G, Seidel M, Hahn V, Knapp SJ, Taudien S, Schön CC and Bauer E. 2013. BSTA: a targeted approach combines bulked segregant analysis with next-generation sequencing and de novo transcriptome assembly for SNP discovery in sunflower. BMC Genomics 14:628 Lysak MA, Koch MA, Pecinka A, Schubert I. 2005. Chromosome triplication found across the tribe Brassicacea. Genome Res 15:516-525 Lühs W and Friedt W. 1995a. Natural fatty acid variation in the genus Brassica and its explotation through resynthesis. Cruciferae Newsl 17:14-15 Lühs W and Friedt W. 1995b. Breeding high-erucic acid rapeseed by means of Brassica napus resynthesis. In “Proc. 9th Intern. Rapeseed Cong.”, 4-7 July 1995, Cambridge, United Kingdom, 2:449-451. Mandal S, Yadav S, Singh R, Begum G, Suneja P, Singh M. 2002. Correlation studies on oil content and fatty acid profile of some Cruciferous species. Genet Resour Crop Evol 49: 551-556 Mardis ER. 2008. Next-generation DNA sequencing methods. Annu Rev Genomics Hum Genet 9:387-402.
Melnikova NV, Dmitrev AA, Belenikin MS, Speranskava AS, Krinitsina AA, Rachinskaia OA, Lakunina VA, Krasnov GS, Snezhkina AV, Sadritdinova AF, Uroshlev LA, Koroban NV, Samatadze TE, Amosova AV, Zelenin AV, Muravenko OV, Bolsheva NL, Kudryavtseva AV. 2014. Excess fertilizer responsive miRNAs revealed in Linum usitatissimum L. Biochimie 14:00363 doi: 10.1016/j.biochi.2014.11.017. Metzker ML. 2010. Sequencing technologies – the next generation. Nature Reviews Genetics 11:31-46 Meyers BC, Tej SS, Vu TH, Haudenschild CD, Agrawal V, Edberg SB, Ghazal H, Decola S. 2004. The use of MPSS for whole-genome transcriptional analysis in Arabidopsis. Genome Research 14:1641-1653.
Monks SA, Leonardson A, Zhu H, Cundiff P, Pietrusiak P, Edwards S, Phillips JW, Sachs A, Schadt EE. 2004. Genetic inheritance of gene expression in human cell lines. J Hum Genet 75:1094-1105. Michelmore RW, Paran I, Kesseli RV. 1991. Identification of markers linked to disease resistance gene by bulked segregant analysis: a rapid method to detect markers in specific genomic regions using segregating populations. Proc Natl Acad Sci USA 88:9828-9832

76
Minoru Kanehisa, Susumu Goto, Masahiro Hattori, Kiyoko F Aoki-Kinoshita, Masumi Itoh, Shuichi Kawashima, Toshiaki Katayama, Michihiro Araki, and Mika Hirakawa. 2006. From genomics to chemical genomics: new developments in KEEG. Nucleic Acids Res 34:354-357 Mizuno T and Yamashino T. 2008. Comparative transcriptome of diurnally oscillating genes and hormone-responsive genes in Arabidopsis thaliana: insight into the control of flowering time. Biosci. Biotechnol. Biochem. 69:410-414
Morrissy S, Zhao Y, Delaney A, Asano J, Dhalla N, Li I, McDonald H, Pandoh P, Prabhu A, Tam A, Hirst M, Marra M. 2010. Digital Gene Expression by Tag Sequencing on the Illumina Genome Analyzer. Current Protocols in Human Genetics 11.11.1-11.11.36 Morrissy AS, Morin RD, Delaney A, Zeng T, McDonald H, Jones S, Zhao Y, Hirst M, Marra MA. 2009. Next-generation tag sequencing for cancer gene expression profiling. Genome Res 19:1825-1835.
Mudalkar S, Golla R, Ghatty S, and Reddy AR. 2014. De novo transcriptome analysis of an imminent biofuel crop, Camelina sativa L. using Illumina GAIIX sequencing platform and identification of SSR markers. Plant Mol Biol 84:159-71 doi: 10.1007/s11103-013-0125-1
Nadeau JH and Dudley AM. 2011. Genetics. Systems genetics. Science 331:1015-1016.
Nietzel T, Dudkina N, Haase C, Denolf P, Semchonok D, Boekema E, Braun HP and Sunderhaus S. 2013. The native structure and composition of the Cruciferin complex in Brassica napus. J Biol Chem 288:2238-2245
Nieuwland J, Scofield S, Murray JAH. 2009. Control of division and differentiation of plant stem cells and their derivatives. Seminars in Cell and Developmental Biology 20:1134-1142.
Obermeier C, Hosseini B, Friedt W, Snowdon R. 2009. Gene expression profiling via LongSAGE in a non-model plant species: a case study in seeds of Brassica napus. BMC Genomics 10:295.
Obermeier C, Salazar-Colqui BM, Spamer V, Snowdon RJ. 2015. Multiplexed digital gene expression analysis for genetical genomics in large plant populations. In: Batley J (ed) Methods in Molecular Biology 1245:119-40. doi: 10.1007/978-1-4939-1966-6_9
O’Neill CM and Bancroft I. 2000. Comparative physical mapping of segments of the genome of Brassica oleracea var. alboglabra that are homoeologous to sequenced regions of chromosomes 4 and 5 of Arabidopsis thaliana. Plant J 23:233-243. O’Neil CM, Gill S, Hobbs D, Morgan C, Bancroft I. 2003. Natural variation for seed oil composition in Arabidopsis thaliana. Phytochemistry 64:1077-1090 Osakabe Y, Maruyama K, Seki M, Satou M, Shinozaki K, Yamaguchi-Shinozakia K. 2005. Leucine-Rich Repeat Receptor-Like Kinase1 Is a Key Membrane-Bound
77
Regulator of Abscisic Acid Early Signaling in Arabidopsis. The Plant Cell 17:1105-1119
Pang PP, Pruitt RE, Meyerowitz EM. 1988. Molecular cloning, genomic organization expression and evolution of 12S–seed storage protein genes of Arabidopsis thaliana. Plant Mol Biol 11: 805–820.
Pallucca R, Visconti S, Camoni L, Cesareni G, Melino S, Panni S, Torreri P, Aducci P. 2014. Specificity of e and Non-e Isoforms of Arabidopsis 14-3-3 Proteins Towards the H+- ATPase and Other Targets. PLoS ONE 9:e90764. doi:10.1371/journal.pone.0090764
Parkin IAP, Sharpe AG, Keith DJ, and Lydiate DJ. 1995. Identication of the A and C genomes of amphidiploid Brassica napus (oilseed rape). Genome 38:1122-1131.
Parkin IAP, Gulden SM, Sharpe AP, Lukens L, Trick M, Osborn TC, Lydiate DJ. 2005. Segmental structure of Brassica napus genome based on comparative analysis with Arabidopsis thaliana. Genetics 171:765-781 Perez-Encisco M. 1998. Sequential bulked typing: a rapid approach for QTLs. Theor Appl Gene 96:551-557 Pires JC, Ahao J, Schranz EM, Leon EJ, Quijada PA, Lukens LN, Osborn TC. 2004. Flowering time divergence and genomic rearragments in resynthezised Brassica polyploids (Brassicaceae). Biological Journal of the Linnean Society 82:675-688 Philips P. 2008. Epistasis- the essential role of gene interactions in the structure and evolution of genetic systems. Nat Rev Genet 9:855-867 Phillippe N, Samra EB, Boureux A, Mancheron A, Ruffle F, Bai Q, De Vos J, Rivals E and Commes T. 2014. Combining DGE and RNA-sequencing data to identify new polyA+ non-coding transcripts in the human genome. Nucleic Acids Research 42: 2820-2832
R Development Core Team. 2010. R: A Language and Environment for Statistical Computing. R Foundation for Statistical Computing, Vienna Accessed from http://www.r-project.org/ Rana D, van den Boogaart T, O’Neill CM, Hynes L, Bent E, Macpherson L, Park JY, Lim YP, Bancroft I. 2004. Conservation of the microstructure of genome segments in Brassica napus and its diploid relatives. Plant J 40:725-733. Ramirez-Gonzalez RH, Segovia V, Bird N, Fenwick P, Holdgate S, Berry S, Jack P, Caccamo M, Uauy C. 2014. RNA-Seq bulked segregant analysis enables the identification of high-resolution genetic markers for breeding in hexaploid wheat. Plant Biotechnology Journal 1:12 doi: 10.1111/pbi.12281
Rockman MV, Kruglyak L. 2006. Genetics of global gene expression. Nat Rev Genet 7:862–872
78
Saha S, Sparks AB, Rago C, Akmaev V, Wang CJ, Vogelstein B, Kinzler KW, Velculescu VE. 2002. Using the transcriptome to annotate the genome. Nat Biotechnol 20:508-512. Schadt EE, Monks SA, Drake TA, Lusis AJ, Che N, Colinayo V, Ruff TG, Milligan SB, Lamb JR, Cavet G, Linsley PS, Mao M, Stoughton RB, Friend SH. 2003. Genetics of gene expression surveyed in maize, mouse and man. Nature 422:297-302 Shanon P, Markiel A, Ozier O, Baliga NS, Wang JT, Ramage D, Amin N, Schwikowski B, Ideker T. 2003. Cytoscape: A software environment for integrated models of biomolecular interaction networks. Genome Research 13:2498-2504
Sheldon CC, Rouse DT, Finnegan EJ, Peacock WJ, Dennis ES. 2000. The molecular basis of vernalization: the central role of FLOWERING LOCUS C. Proc Natl Acad Sci 97:3753-3758 Shendure J and Ji H. 2008. Next-generation DNA sequencing. Nat Biotechnol 26:1135-1145 Simon SA, Zhai J, Nandety RS, McCormick KP, Zeng J, Mejia D, Meyers BC. 2009. Short-read sequencing technologies for transcriptional analyses. Annual Review of Plant Biology 60:305-333.
Snowdon RJ, Koehler W, Friedt W, and Koehler A. 1997. Genomic in situ hybridization in Brassica amphidiploids and interspecific hybrids. Theor Appl Genet 95:1320-1324. Snowdon RJ, Firedrich T, Friedt W, and Koehler W. 2002. Identifying the chromsomes of the A- and C-genome diploid Brassica species B. rapa (syn. Campestris) and B. oleracea in their amphidiploid B. napus. Theor Appl Genet 104:533-538.
Snowdon RJ. 2007. Cytogenetics and genome analysis in Brassica crops. Chromosome Research 15:85-95 Sovero M.1993. Rapeseed, a new oilseed crop for the United States. p302-307 In: J. Janick and J.E. Simon (eds.), New crops. Wiley, New York Stone JM, Trotochaud AE, Walker JC and Clark SE. 1998. Control of meristem development by CLAVATA1 receptor kinase and kinase-associated protein phosphatase interactions. Plant Physiol 117:1217-1225
Stuart J, Segal E, Koller D, Kim S. 2003. A Gene-Coexpression Network for Global Discovery of Conserved Genetic Modules. Science 302:249-255.
’t Hoen PAC, Ariyurek Y, Thygesen HH, Vreugdenhil E, Vossen R, de Menezes RX, Boer JM, van Ommen GJB, den Dunnen JT. 2008. Deep sequencing-based expression analysis shows major advances in robustness, resolution and inter-lab portability over five microarray platforms. Nucleic Acids Res 36:e141 Torres T, Metta M, Ottenwälder B, Schlötterer C. 2008. Gene expression profiling by massively parallel sequencing. Genome Research 18:172-177

79
Trick M, Long Y, Meng JL, Bancroft I. 2009. Single nucleotide polymorphism (SNP) discovery in the polyploid Brassica napus using Solexa transcriptome sequencing. Plant Biotechnology Journal 7:334-346. U N.1935. Genome analysis in Brassica with special reference to the experimental formation of B. napus and peculiar mode of fertilization. Jpn J Bot 7:389-452 Velculescu VE, Zhang L, Vogelstein B, Kinzler KW. 1995. Serial analysis of gene expression. Science 270:484-487.!
Wang X, Wang H, Wang J, Sun R, Wu J, Liu S, Bai Y, Mun JH, Bancroft I, Cheng F et al. 2011. The genome of the mesopolyploid crop species Brassica rapa. Nat Genet 43:1035-1039. Wei M, Song M, Fan S and Yu S. 2013. Transcriptomic analysis of differentially expressed genes during anther development in genetic male sterile and wild type cotton by digital gene-expression profiling. BMC Genomics 14:97 Wu G and Poething RS. 2006. Temporal regulation of shoot development in Arabidopsis thaliana by miR156 and is target SPL3. Development 124:645-654 Würschum T, Liu W, Maurer HP, Abel S, Reif JC. 2012. Dissecting the genetic architecture of complex traits of Brassica napus. Theor Appl Genet 121:153-161 Xu BB, Li JN, Zhang XK, Wang R, Xie LL, Chai YR. 2007. Cloning and molecular characterization of a functional flavonoid 3’-hydroxylase gene from Brassica napus. J Plant Physiol 164:350-363
Zhang B and Horvath S. 2005. A general framework for weighted gene co-expression network analysis. Stat Appl Genet Mol Biol 4:17. Zhang J, Chiodini R, Ahmed B, Zhang G. 2011. The impact of next-generation sequencing on genomics. J Genet Genomics 38:95-109 Zhang X, Cal AJ, Borevitz JO. 2011. Genetic architecture of regulatory variation in Arabidopsis thaliana. Genome Res 21:725-733 Zhu J, Lum PY, Lamb J, Guhathakurta D, Edwards SW, Thieringer R, Berger JP, Wu MS, Thompson J, Sachs AB, Schadt EE. 2004. An integrative genomics approach to the reconstruction of gene networks in segregating populations. Cytogenet Genome Res 105:363-374

80
9 Appendix
Appendix Table A1. List of the 29 differentially expressed genes for the secondary
metabolite dihydrophaseic acid (ABA2) at 8 DAS after bulked-segregant analysis of
DGE data (BSA-DGE). The Brassica Unigenes are listed with their respective
logarithmic fold change (logFC > 2) value. Arabidopsis genome initiative (AGI) was
used for identification of genes.
Unigene logFC p_value AGI Gene
JCVI_19664 3.00645E+14 0.0066 AT1G62660 Glycosyl hydrolases family 32 protein
JCVI_4674 2.69569E+14 0.0133 AT1G76160 SKU5 similar 5 (sks5)
JCVI_10809 2.31159E+14 0.0021 AT1G28590 GDSL-like Lipase/Acylhydrolase superfamily protein
JCVI_17618 2.30298E+14 0.0019 AT1G31650 Encodes a member of KPP-like gene family
JCVI_31848 2.29456E+14 0.0041 AT1G59820 Encodes a phospholipid translocase
JCVI_19225 2.24891E+14 0.0022 AT1G77000 AtSKP2;2 is a homolog of human SKP2
JCVI_21574 2.22154E+14 0.0023 AT1G58520 RXW8
JCVI_23070 2.19314E+14 0.0066 AT1G70270 unknown protein
JCVI_874 2.18772E+14 0.0112 AT1G30630 Coatomer epsilon subunit
EX093668 2.15664E+14 0.0015 AT1G63740
Disease resistance protein (TIR-NBS-LRR class)
family
JCVI_37668 2.15228E+14 0.0088 AT1G12240 Encodes a vacuolar invertase betaFruct4
JCVI_7956 2.14989E+14 0.0133 AT1G64720 membrane related protein CP5
EE450367 2.13893E+14 0.0151 AT2G22090 encodes a nuclear protein that binds to RNA
JCVI_3599 2.13528E+14 0.0088 AT1G24764 Member of the MAP70 protein family.
JCVI_35775 2.11868E+14 0.0457 AT1G60690 NAD(P)-linked oxidoreductase superfamily protein
JCVI_17004 2.10858E+14 0.0153 AT1G80640 Protein kinase superfamily protein
JCVI_20832 2.10035E+14 0.0089 AT1G08310 alpha/beta-Hydrolases superfamily protein
JCVI_26832 2.08304E+14 0.0114 AT2G04340 unknown protein
JCVI_23549 2.08098E+14 0.0118 AT1G20330 Encodes a sterol-C24-methyltransferases
EV100880 2.05504E+14 0.0003 AT1G53380 Plant protein of unknown function (DUF641)
JCVI_35576 2.05269E+14 0.0072 AT1G45010 TRAM, LAG1 and CLN8 (TLC) lipid-sensing domain
JCVI_2810 2.04209E+14 0.0212 AT1G80030 Molecular chaperone Hsp40/DnaJ family protein
JCVI_33566 2.04102E+14 0.0128 AT1G05730 Eukaryotic protein of unknown function (DUF842)
EV179359 2.02392E+14 0.0109 AT1G08430 Encodes a Al-activated malate efflux transporter
JCVI_37043 2.02292E+14 0.0165 AT1G18450 Encodes a gene similar to actin-related proteins
EV183065 2.01198E+14 0.0068 AT2G19830 SNF7.2; INVOLVED IN: vesicle-mediated transport
DY000377 2.00599E+14 0.0057 AT2G29200 Arabidopsis Pumilio PUF domain (APUM)
ES918166 2.00599E+14 0.0057 AT2G29200 Arabidopsis Pumilio PUF domain (APUM)
JCVI_4422 2.00151E+14 0.0059 AT1G04010 phospholipid sterol acyl transferase 1 (PSAT1)

81
Appendix Table A2. List of the most significant (P<0.05) differentially expressed
genes for abscisic acid glucose ester (ABA3) hormone metabolite trait at 12 DAS
after bulked-segregant analysis of DGE data (BSA-DGE). The Brassica Unigenes are
listed with their respective logarithmic fold change (logFC > 2) value. Arabidopsis
genome initiative (AGI) was used for identification of genes.
Unigenes logFC p_value AGI Gene
JCVI_15419 2.91119E+14 0.0024 AT4G39740 HOMOLOGUE OF COPPER CHAPERONE (SCO1 2)
JCVI_9241 2.45014E+14 0.0231 AT3G01570 Oleosin family protein
JCVI_107 2.44186E+14 0.0299 AT5G40420 OLEOSIN 2 (OLEO2)
JCVI_7854 2.37324E+14 0.0041 AT4G39970 Haloacid dehalogenase-like hydrolase (HAD) superfamily protein
JCVI_15903 2.28107E+14 0.0148 AT2G43590 Chitinase family protein
JCVI_1212 2.23495E+14 0.0155 AT4G25140 Encodes oleosin1
EV092872 2.211E+14 0.0048 AT3G58360 TRAF-like family protein
JCVI_32916 2.17881E+14 0.0026 AT5G27420 CARBON/NITROGEN INSENSITIVE 1 (CNI1)
EE431728 / ES907651 2.17272E+14 0.0107 AT4G13390
EXTENSIN 12 (EXT12)
EE426713 2.16208E+14 0.0109 AT4G08410 Proline-rich extensin-like family protein
JCVI_21194 2.14044E+14 0.0094 AT3G16860 COBRA-like protein 8 precursor (COBL8)
JCVI_28372 2.11307E+14 0.0062 AT5G63610 CYCLIN-DEPENDENT KINASE E;1 (CDKE;1)

82
Appendix Table A3. List of the most significant (P<0.05) differentially expressed
genes for ABA4 hormone metabolite trait at 12 DAS after bulked-segregant analysis
of DGE data (BSA-DGE). The Brassica Unigenes are listed with their respective
logarithmic fold change (logFC > 2) value. Arabidopsis genome initiative (AGI) was
used for identification of genes.
Unigene logFC p_value AGI Gene
JCVI_11550 2.63396E+14 0.001080786 AT1G33990 METHYL ESTERASE 14 (MES14)
JCVI_31237 / ES902008 /EX113607 2.59494E+14 0.007252184 AT2G40080
EARLY FLOWERING 4 (ELF4)
JCVI_3319 2.36228E+14 0.02578562 AT5G23240 DNA J PROTEIN C76 (DJC76)
JCVI_2121 2.17246E+14 0.005620503 AT1G21640 NAD KINASE 2 NADK2,
JCVI_32290 2.13987E+14 0.016037008 AT4G31210 DNA topoisomerase, type IA, core
Appendix Table A4. List of the most significant (P<0.05) differentially expressed
genes for 7'-Hydroxy-abscisic acid (ABA5) hormone metabolite trait at 8 DAS after
bulked-segregant analysis of DGE data (BSA-DGE). The Brassica Unigenes are
listed with their respective logarithmic fold change (logFC > 2) value. Arabidopsis
genome initiative (AGI) was used for identification of genes.
Unigene logFC p_value AGI Gene
JCVI_22468 2.57912E+14 0.003177967 AT1G68570 Unknow protein
ES910643 2.34462E+14 0.004052359 AT1G23550 SIMILAR TO RCD ONE 2 (SRO2)
JCVI_32206 2.17743E+14 0.007028005 AT1G36370 SERINE HYDROXYMETHYLTRANSFERASE 7 (SHM7)
JCVI_9029 2.15552E+14 0.028159416 AT1G62750 SNOWY COTYLEDON 1 (SCO1)
JCVI_13819 2.1473E+14 0.004052359 AT1G48920 NUCLEOLIN LIKE 1 (NUC-L1)
JCVI_34350 2.12588E+14 0.011715058 AT1G52410 TSK-ASSOCIATING PROTEIN 1 (TSA1)
JCVI_3154 2.07533E+14 0.020849153 AT1G17650 GLYOXYLATE REDUCTASE 2 (GLYR2)
EV001793 2.0616E+14 0.00105644 AT2G02850 PLANTACYANIN (ARPN)
JCVI_36450 2.0475E+14 0.011517836 AT1G17220 FU-GAERI1 (FUG1)
JCVI_4551 2.03135E+14 0.016147242 AT1G18070 Unknow protein
JCVI_7217 2.00556E+14 0.011516771 AT1G72710 CASEIN KINASE 1-LIKE PROTEIN 2 (CKL2)
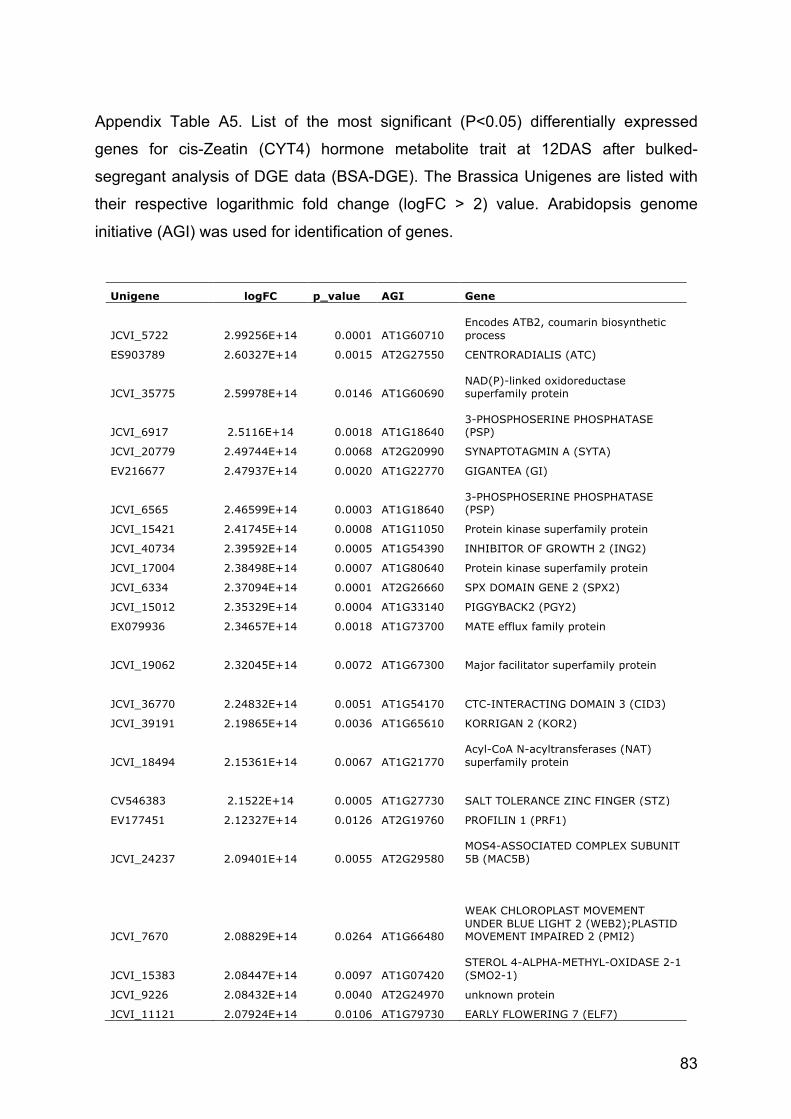
83
Appendix Table A5. List of the most significant (P<0.05) differentially expressed
genes for cis-Zeatin (CYT4) hormone metabolite trait at 12DAS after bulked-
segregant analysis of DGE data (BSA-DGE). The Brassica Unigenes are listed with
their respective logarithmic fold change (logFC > 2) value. Arabidopsis genome
initiative (AGI) was used for identification of genes.
Unigene logFC p_value AGI Gene
JCVI_5722 2.99256E+14 0.0001 AT1G60710 Encodes ATB2, coumarin biosynthetic process
ES903789 2.60327E+14 0.0015 AT2G27550 CENTRORADIALIS (ATC)
JCVI_35775 2.59978E+14 0.0146 AT1G60690 NAD(P)-linked oxidoreductase superfamily protein
JCVI_6917 2.5116E+14 0.0018 AT1G18640 3-PHOSPHOSERINE PHOSPHATASE (PSP)
JCVI_20779 2.49744E+14 0.0068 AT2G20990 SYNAPTOTAGMIN A (SYTA)
EV216677 2.47937E+14 0.0020 AT1G22770 GIGANTEA (GI)
JCVI_6565 2.46599E+14 0.0003 AT1G18640 3-PHOSPHOSERINE PHOSPHATASE (PSP)
JCVI_15421 2.41745E+14 0.0008 AT1G11050 Protein kinase superfamily protein
JCVI_40734 2.39592E+14 0.0005 AT1G54390 INHIBITOR OF GROWTH 2 (ING2)
JCVI_17004 2.38498E+14 0.0007 AT1G80640 Protein kinase superfamily protein
JCVI_6334 2.37094E+14 0.0001 AT2G26660 SPX DOMAIN GENE 2 (SPX2)
JCVI_15012 2.35329E+14 0.0004 AT1G33140 PIGGYBACK2 (PGY2)
EX079936 2.34657E+14 0.0018 AT1G73700 MATE efflux family protein
JCVI_19062 2.32045E+14 0.0072 AT1G67300 Major facilitator superfamily protein
JCVI_36770 2.24832E+14 0.0051 AT1G54170 CTC-INTERACTING DOMAIN 3 (CID3)
JCVI_39191 2.19865E+14 0.0036 AT1G65610 KORRIGAN 2 (KOR2)
JCVI_18494 2.15361E+14 0.0067 AT1G21770 Acyl-CoA N-acyltransferases (NAT) superfamily protein
CV546383 2.1522E+14 0.0005 AT1G27730 SALT TOLERANCE ZINC FINGER (STZ)
EV177451 2.12327E+14 0.0126 AT2G19760 PROFILIN 1 (PRF1)
JCVI_24237 2.09401E+14 0.0055 AT2G29580 MOS4-ASSOCIATED COMPLEX SUBUNIT 5B (MAC5B)
JCVI_7670 2.08829E+14 0.0264 AT1G66480
WEAK CHLOROPLAST MOVEMENT UNDER BLUE LIGHT 2 (WEB2);PLASTID MOVEMENT IMPAIRED 2 (PMI2)
JCVI_15383 2.08447E+14 0.0097 AT1G07420 STEROL 4-ALPHA-METHYL-OXIDASE 2-1 (SMO2-1)
JCVI_9226 2.08432E+14 0.0040 AT2G24970 unknown protein
JCVI_11121 2.07924E+14 0.0106 AT1G79730 EARLY FLOWERING 7 (ELF7)

84
Appendix Table A6. List of the 20 significant (P<0.05) differentially expressed genes
for Hypocotyl height (HCH) trait at 8 DAS after bulked-segregant analysis of DGE
data (BSA-DGE). The Brassica Unigenes are listed with their respective logarithmic
fold change (logFC > 2) value. Arabidopsis genome initiative (AGI) was used for
identification of genes.
Unigene logFC p_value AGI Gene
EL587455 2.79623E+14 0.000135832 AT1G25290 RHOMBOID-LIKE PROTEIN 10 (RBL10)
JCVI_33584 2.69586E+14 0.003051722 AT1G15110 PHOSPHATIDYLSERINE SYNTHASE 1 (PSS1)
JCVI_19864 2.67596E+14 0.001331782 AT1G24140 Matrixin family protein
EV178926 2.6599E+14 0.011172071 AT1G72370 40S RIBOSOMAL PROTEIN SA (P40)
JCVI_37808 2.44417E+14 0.000521288 AT1G33990 METHYL ESTERASE 14 (MES14)
JCVI_34702 2.42327E+14 0.000481046 AT2G22880 VQ motif-containing protein
JCVI_25456 2.37045E+14 0.006080123 AT1G59560 ZCF61
JCVI_34125 2.31261E+14 0.00031286 AT2G30020 AP2C1
JCVI_8458 2.26232E+14 0.008222515 AT1G64790 ILITYHIA (ILA)
JCVI_6286 2.22806E+14 0.003312206 AT1G36160 ACETYL-COA CARBOXYLASE 1 (ACC1)
EV087433 2.13184E+14 0.00347743 AT1G52030 MYROSINASE-BINDING PROTEIN 2 (MBP2)
EX098073 2.09709E+14 0.005670568 AT1G66760 MATE efflux family protein
JCVI_12387 2.09421E+14 0.008188878 AT1G69930 GLUTATHIONE S-TRANSFERASE TAU 11 (GSTU11)
EE552387 2.08935E+14 0.01053626 AT1G26665 Mediator complex, subunit Med10
JCVI_41393 2.07903E+14 0.008169996 AT1G65030 protein with a DWD motif
JCVI_34460 2.06924E+14 0.008714875 AT1G78280 transferases, transferring glycosyl groups
JCVI_3794 2.06067E+14 0.022500638 AT1G54020 GDSL-like Lipase/Acylhydrolase superfamily protein
JCVI_27422 2.03039E+14 0.001518809 AT1G72320 PUMILIO 23 (PUM23)
JCVI_26327 2.02706E+14 0.004455493 AT2G24280 alpha/beta-Hydrolases superfamily protein
JCVI_38005 2.02226E+14 0.022674413 AT1G28050 B-box type zinc finger protein with CCT domain

85
Appendix Table A7. List of the 9 significant (P<0.05) differentially expressed genes
for shoot fresh weight (SFW) trait at 8 DAS after bulked-segregant analysis of DGE
data (BSA-DGE). The Brassica Unigenes are listed with their respective logarithmic
fold change (logFC > 2) value. Arabidopsis genome initiative (AGI) was used for
identification of genes.
Unigene logFC p_value AGI Gene
JCVI_36531 2.09395E+14 0.005983601 AT2G20890 PHOTOSYSTEM II REACTION CENTER PSB29 PROTEIN (PSB29)
EV029825 2.02053E+14 0.01096563 AT1G18880 NITRATE TRANSPORTER 1.9 (NRT1.9)
JCVI_29531 2.61515E+14 0.016870269 AT2G25450 encodes a protein whose sequence is similar to ACC oxidase
ES943297 2.08326E+14 0.006032013 AT2G28900 OUTER PLASTID ENVELOPE PROTEIN 16-1 (OEP16-1)
EE547519 2.3586E+14 0.007380827 AT2G16600 Encodes cytosolic cyclophilin ROC3.
JCVI_37763 2.06059E+14 0.011480547 AT2G23890 HAD-superfamily hydrolase
EX123254 2.2643E+14 0.003503589 AT1G34040 Pyridoxal phosphate (PLP)
EX131553 2.32938E+14 0.001134072 AT1G74050 Ribosomal protein L6 family protein
JCVI_19101 2.39366E+14 0.036633298 AT1G05205 unknown protein
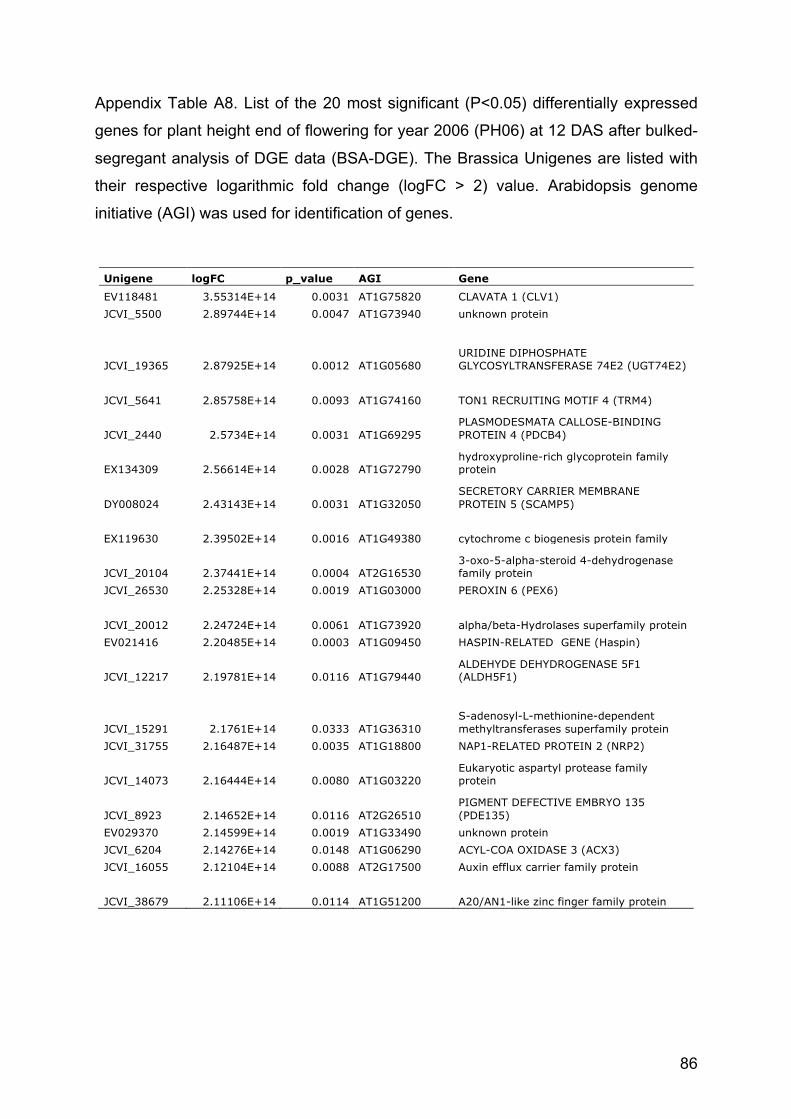
86
Appendix Table A8. List of the 20 most significant (P<0.05) differentially expressed
genes for plant height end of flowering for year 2006 (PH06) at 12 DAS after bulked-
segregant analysis of DGE data (BSA-DGE). The Brassica Unigenes are listed with
their respective logarithmic fold change (logFC > 2) value. Arabidopsis genome
initiative (AGI) was used for identification of genes.
Unigene logFC p_value AGI Gene
EV118481 3.55314E+14 0.0031 AT1G75820 CLAVATA 1 (CLV1) JCVI_5500 2.89744E+14 0.0047 AT1G73940 unknown protein
JCVI_19365 2.87925E+14 0.0012 AT1G05680 URIDINE DIPHOSPHATE GLYCOSYLTRANSFERASE 74E2 (UGT74E2)
JCVI_5641 2.85758E+14 0.0093 AT1G74160 TON1 RECRUITING MOTIF 4 (TRM4)
JCVI_2440 2.5734E+14 0.0031 AT1G69295 PLASMODESMATA CALLOSE-BINDING PROTEIN 4 (PDCB4)
EX134309 2.56614E+14 0.0028 AT1G72790 hydroxyproline-rich glycoprotein family protein
DY008024 2.43143E+14 0.0031 AT1G32050 SECRETORY CARRIER MEMBRANE PROTEIN 5 (SCAMP5)
EX119630 2.39502E+14 0.0016 AT1G49380 cytochrome c biogenesis protein family
JCVI_20104 2.37441E+14 0.0004 AT2G16530 3-oxo-5-alpha-steroid 4-dehydrogenase family protein
JCVI_26530 2.25328E+14 0.0019 AT1G03000 PEROXIN 6 (PEX6)
JCVI_20012 2.24724E+14 0.0061 AT1G73920 alpha/beta-Hydrolases superfamily protein EV021416 2.20485E+14 0.0003 AT1G09450 HASPIN-RELATED GENE (Haspin)
JCVI_12217 2.19781E+14 0.0116 AT1G79440 ALDEHYDE DEHYDROGENASE 5F1 (ALDH5F1)
JCVI_15291 2.1761E+14 0.0333 AT1G36310 S-adenosyl-L-methionine-dependent methyltransferases superfamily protein
JCVI_31755 2.16487E+14 0.0035 AT1G18800 NAP1-RELATED PROTEIN 2 (NRP2)
JCVI_14073 2.16444E+14 0.0080 AT1G03220 Eukaryotic aspartyl protease family protein
JCVI_8923 2.14652E+14 0.0116 AT2G26510 PIGMENT DEFECTIVE EMBRYO 135 (PDE135)
EV029370 2.14599E+14 0.0019 AT1G33490 unknown protein JCVI_6204 2.14276E+14 0.0148 AT1G06290 ACYL-COA OXIDASE 3 (ACX3) JCVI_16055 2.12104E+14 0.0088 AT2G17500 Auxin efflux carrier family protein
JCVI_38679 2.11106E+14 0.0114 AT1G51200 A20/AN1-like zinc finger family protein

87
Declaration
I declare that the dissertation here submitted is entirely my own work, written without
any illegitimate help by any third party and solely with materials as indicated in the
dissertation. I have indicated in the text where I have used texts from already
published sources, either word for word or in substance, and where I have made
statements based on oral information given to me. At all times during the
investigations carried out by me and described in the dissertation, I have followed the
principles of good scientific practice as defined in the “Statutes of the Justus Liebig
University Gießen for the Safeguarding of Good Scientific Practice”.

88
Acknowledgements
I would like to thank both of my supervisors Prof. Dr. Dr. h. c. Wolfgang Friedt and
Prof. Dr. Rod Snowdon for offering me the opportunity to be part of such a interesting
project, in which I not only gained experimental lab experience, but also
bioinformatics plus a statistical background. I am not only grateful for the many fruitful
discussions, the suggested ideas and support during developing of my PhD thesis
through these years, but also for the incredible patience.
I would to also thank Prof. Dr. Matthias Frisch as second supervisor and for his
friendly support for bioinformatics and statistical background as well as for co-
supervising my thesis. To Dr. Christian Obermeier, Dr. Janet Higgins and Dr. Birgit
Samans for assisting during several phases of the analysis of my data. I enjoyed the
time we spent together during analysis and I am thankful for their collaboration to
have achieved this work. I am also very grateful to all members of the Plant Breeding
Department for creating an extraordinary working atmosphere in the whole group,
and especially thanks to Liane Renno, Stavros Tzigos and Nelly Weiss for the
incredible technical assistance during execution of this project. Without them this
work would have not been possible.
A specially thanks goes to PD Dr. Gabriel Schachtel, Eugenia and Martin Dambmann
who not only took care and supported me during last phase of PhD, but also for their
friendship.
This work was part of the Associative expression and systems analysis of complex
traits in oilseed rape/canola (ASSYST) Project in which I participated to complete the
workpackage 2 (WP2) referred as next generation sequencing (NGS) transcriptome
profiling of seedling development in winter oilseed rape (B. napus).
Last but not least I would like to thank my parents, for their amazing support and
patience. Special thanks to my older brother José Salazar for his incredible support.