differing effects from diverse charter schools · do differing charter schools attract particular...
TRANSCRIPT

DIFFERING EFFECTS FROM DIVERSE CHARTER SCHOOLS Uneven Student Selection and Achievement Growth in Los Angeles
Hyo Jeong Shin, Bruce Fuller, Luke DauterUniversity of California, Berkeley
December 2015
Differing Effects from Diverse Charter Schools – Uneven Student Selection and Achievement Growth in Los Angeles
Hyo Jeong Shin, Bruce Fuller, Luke Dauter Institute of Human Development, University of California, Berkeley
December 2015
Acknowledgments. Hye Kyung Lee and William Welsh helped to frame and guide our analysis. Much appreciation is expressed to the generous staff of the CALPADS data shop at the California Department of Education. They compiled the information on charter school students. Rachel Bonkovsky, José Cole-Gutiérrez, Kathy Hayes, Michael Kirst, Cynthia Lim, Jane Patterson, Robert Perry, Elizabeth Robitaille, and Anisah Waite assisted greatly in developing this project. Luke Dauter’s work was supported by the Spencer Foundation and the research network, Policy Analysis for California Education, thanks to the Hewlett Foundation. Any errors of omission or interpretation are solely attributable to the authors.
Charter schools in Los Angeles – Unpacking differing achievement effects – 1
Differing Effects from Diverse Charter Schools – Uneven Student Selection and
Achievement Growth in Los Angeles
SUMMARY
Disparate findings on whether students attending charter schools outperform peers enrolled in traditional public schools (TPS) may stem from mixing different types of charters or insufficiently accounting for variation in pupil background. To gauge so-called heterogeneous effects we distinguish between conversion and start-up charter schools, along with a third site-run model operating in the Los Angeles Unified School District (LAUSD). After tracking 66,000 students over four years, 2007-2011, we find that TPS campuses that converted to charter status (conversions) attracted more experienced and consistently credentialed teachers, and served relatively advantaged families, compared with newly created charter schools (start-ups). Charter schools overall attracted pupils achieving at higher levels as they began a grade cycle (at baseline), relative to students attending traditional schools. After taking into account these differences in prior achievement and family background, students attending charter elementary or middle schools outperformed TPS peers over the four-year period, estimated with alternative statistical techniques. The benefits of attending a charter middle school appear to be consistent across subgroups and moderate in magnitude, especially for students in start-ups. Most other charter advantages remain small in magnitude or statistically insignificant. We detected no achievement differences between pupils attending charter versus TPS high schools.
Backdrop and Study Aims
Charter schools continue to grow in many states, prompting the question of whether
these independent and site-run organizations nurture steeper growth in children’s
learning, relative to peers attending traditional public schools (TPS). Research to date
reveals widely varying achievement effects, differing among cities or states, and
depending on the organizational features of schools (for reviews, Epple, Romano, &
Zimmer, 2015; Fuller, 2015; Raymond, 2014). The search for factors that explain charter
school effects is complicated by the difficulty of accounting for a priori effects on
student learning that emanate from family background, along with the varying capacity of
charters to attract key resources, especially high-quality teachers.
This paper advances theory by distinguishing between TPS that convert to charter
school status (conversions) and newly created charters (start-ups), given their nonrandom
Charter schools in Los Angeles – Unpacking differing achievement effects – 2
selection of families and possibly uneven capacity to attract high-quality teachers. We
also compare variably robust results from three estimation techniques: ordinary
least-squares (OLS), conventional propensity-score matching, and more recently
developed genetic matching techniques to estimate achievement effects from charter
schools located in the Los Angeles Unified School District (LAUSD).
We compare results when a conservative prior-to-treatment achievement control is
utilized, compared with estimating growth for students already enrolled within a charter
school, and by grade level and cohort. This evaluation strategy yields a more precise
picture of the achievement benefits that stem from particular kinds of charter schools
serving pupils at differing grade levels.
This analysis is based on tracking about 66,000 pupils in LAUSD, over the
2007-2011 period, the nation’s second largest system, hosting 229 charter schools and
112 campuses that enjoyed site-level autonomy by the end of our time-series in 2011.
We only include students with complete data over a four-year period that commenced in
grades 2, 5, or 8, ensuring conservative controls for prior background.
Why Do Estimates of Charter School Effects Vary So Widely?
National assessments find significant yet small achievement advantages for students
attending charter schools, relative to peers in TSP (Raymond, 2014; for review, Epple,
Romano, & Zimmer, 2015). But comparative benefits vary widely across states and
cities, and methodological worries persist that estimation of benefits fail to properly
account for the cognitive proficiencies or social skills of pupils prior to entering a charter
school, or bias introduced by unobserved cofounders related to family attributes or home
practices that explain learning differences, not caused by charter attendance per se.
Seeking clearer accounts for these varying effects, researchers have focused on how
internal organizational features or external resources and regulatory environs act to
mediate achievement effects (Furgeson et al., 2012; Hanushek, Kain, Rivkin, & Branch,
2007; Hoxby & Murarka, 2009; Zimmer, Gill, Booker, Lavertu, & Witte, 2012). We first
review this literature on how organizational features of charter schools or prior student
selection may help to explain varying estimates of charter-school effects. We then

Charter schools in Los Angeles – Unpacking differing achievement effects – 3
describe our analytic strategy, distinguishing types of charters within Los Angeles, asking
whether conversion or start-up charters attract particular kinds of students, or attract
differing types of teachers, relative to pupils and teachers hosted by TPS.
The diversity of charter schools within LAUSD must be taken into account.
Independent charters – often called start-ups – do not have to abide by traditional
attendance boundaries in admitting students. They do not hire teachers through the
District’s personnel process. Yet affiliated conversion charters still respect attendance
zones to varying degrees, at times filling seats with pupils that come from outside these
attendance boundaries. Affiliated charters also commonly work through the District’s
personnel system, although some gain flexibility to attract teachers that are preferred by
the principal or committed to the mission of a particular school.
The Widening Diversity of Site-run Schools
Policy makers and local school boards have authorized and funded an array of
charter and similar, site-run schools over the past generation. This includes a widening
diversity of organizational forms within the decentralized sector: most notably conversion
and start-up charter schools, along with site-managed schools monitored by district
offices, yet operating with charter-like autonomies. Nisar (2012), for instance, asked
whether the degree of freedom from district regulation helped to account for variation in
the effects of site-run schools on achievement. Tracking pupil performance in 45
Milwaukee charters, 2005-2009, he found significant gains among start-up charters, but
no discernible effects from pupils served by “instrumentality charter schools,” those that
enjoy limited freedom from their district bureaucracy and labor rules.
Nasir inferred that the greater autonomy afforded to start-up charters, including
flexible labor practices, acts to mediate stronger pupil growth, relative to charters still
under the district’s watchful eye (argued by Abdulkadiroğlu, Angrist, Dynarski, Kane, &
Pathak, 2011, in a similar Boston study). It also appears that charter schools which have
survived longer – better managing resource dependencies, enjoying stronger parental
demand, or subject to reauthorization – also exert modestly stronger benefits, relative to
TPS (Raymond, 2014).1
A second line of research asks whether internal organizational features of charter
schools account for variation in pupil achievement. Initial studies have found that smaller

Charter schools in Los Angeles – Unpacking differing achievement effects – 4
enrollments, longer instructional time, the mentoring of young teachers, and tighter
collaboration help to explain the magnitude of learning gains (Furgeson et al., 2012;
Zimmer & Buddin, 2006).
One study of charter schools in New York City, tracking winners and losers of
admission lotteries (quasi-experimental design), found stronger achievement growth in
schools where principals observed and evaluated teachers more consistently and when
they relied on “direct instruction” (Hoxby & Murarka, 2009). A smaller sample of 35
New York City charters studied by Dobbie and Fryer (2011) found that learning growth
was steeper in charters when teachers analyzed student data, offered tutoring, and
expressed higher expectations for student learning (similar findings, Tuttle et al., 2013).
In the Los Angeles context, Raymond (2014) estimated overall achievement for
students attending a blend of charter schools, relative to peers in traditional LAUSD
schools. After statistically matching students on observed characteristics over the period,
2009-2012, she found small test-score advantages enjoyed by charter students, relative to
TPS peers, 0.07 SD higher in English language arts (ELA) and 0.11 SD higher in math on
average. Latino pupils from low-income families experienced the strongest gains in
charter schools, although the magnitude remained small. White and middle-class students
in charters realized almost no difference their in rates of learning relative to TPS peers.
The strongest estimated achievement advantage felt by charter students occurred in
middle schools, the average difference reaching 0.22 SD for math, compared with TPS
peers. Math scores ranged higher for pupils attending a charter for three years, rather than
for just one or two years. But no dosage effect was observed for ELA performance.
Our analysis moves beyond Raymond’s work by first distinguishing between
conversion and start-up charter schools, then asking whether they draw-in varying kinds
of students and families. Given their differing organizational histories in L.A., we can’t
assume that conversions and start-ups attract the same kinds of teachers or pupils, which
in turn may affect their capacity to lift learning. We also delve deeper into Raymond’s
finding that middle schools may drive much of the overall charter advantage. The
statistical method employed by Raymond has come under scholarly criticism for not
controlling on students’ academic proficiencies before entering a charter school
(“pre-treatment”), a fix that we build into our estimation technique (Reardon, 2009).
Charter schools in Los Angeles – Unpacking differing achievement effects – 5
Do Differing Charter Schools Attract Particular Students and Teachers?
While these studies yield useful findings, they fail to conceptually situate charter
schools and other site-run schools within the district-wide competition for preferred
students and families, along with vying for stronger teachers (Fligstein & Dauter, 2006).
These diversifying forms of schooling must attract sufficient resources in relation to
other firms operating in their urban community. This involves competition for
legitimacy, families, and material resources – especially teachers – factors they may
condition each school’s capacity to raise achievement.
Differing types of charter schools, for instance, may seek to protect the enrollment
of, or attract, better performing students, or seek to serve families from certain ethnic or
social-class groups. This may help to secure their niche in an otherwise competitive
field of neighboring schools. While shaking free of central regulation, charter schools
can now more actively seek certain kinds of students and families, rather than relying on
the earlier attendance zones historically drawn by school districts.
Better-off communities in Los Angeles, for instance, may deploy charter provisions
to convert their TPS campus into a charter school, helping to seal-off enrollment demands
from families outside the neighborhood. LAUSD has granted deregulated freedom to
schools in middle-class neighborhoods (of varying ethnic composition) under the
Expanded School-based Management Model (ESBMM), which may mimic charter
strategies. The ESBMM model offers a third type of school on which we focus, in addition
to conversion and start-up charter schools.
This so-called niche seeking – while rational from a charter operator’s vantage
point – may act to harden the stratification of students, as differing families sort into
particular schools. The a priori force of parents’ social-class position is revealed in
studies that track enrollment flows over time. Focusing solely on White families
researchers found that higher achieving children were more likely to seek out a charter
option in four of seven major cities studied, compared with lower achieving White peers
(Zimmer et al. 2009). We similarly found that the earliest conversion charters in LAUSD
(but not start-ups) tended to serve students that achieved at higher levels at entry, relative
to peers entering TPS (Lauen, Fuller, & Dauter, 2015).

Charter schools in Los Angeles – Unpacking differing achievement effects – 6
Charters may also seek to attract particular kinds of teachers to pursue a specific
curricular mission, nurture professional collaboration, or raise overall quality. Some
charter schools rely heavily on “alternatively credentialed” teachers, such as Teach for
America graduates. Charter schools typically employ younger, less costly teachers
relative to TPS, both nationally (Bodine et al., 2008) and within Los Angeles (Fuller,
Waite, Chao, & Benedicto, 2014).
Tracking who taught in North Carolina charter schools over a 13-year period
(n=6,823), Carruthers (2012) found that just over one-fourth had migrated from TPS,
displaying lower qualifications (graduate degrees, state licensing scores) and classroom
effectiveness (estimated value-added scores), compared with TPS peers, especially those
moving into predominantly Black charter schools.2 Otherwise, little is known about how
teachers migrate among TPS and differing types of charter schools.
One counter to this organizational segmentation argument stems from findings
showing that charters and similar site-run schools do not necessarily attract higher
achieving students or particular kinds of teachers. Instead, some charter schools may
become rather conventional over time – that is, isomorphic with TPS incumbents in their
organizational field – in order to gain market credibility and attract more families
(Huerta 2009; Renzulli, Barr, & Paino, 2014).
Thus, one pivotal question emerges that’s highly relevant to the Los Angeles
context: Do conversion or start-up charter schools draw-in differing students, families,
or teachers relative to TPS campuses?
Does Organizational Diversity Further Stratify Students and Families?
We know that family demand expressed for charter schools can differ along lines of
race, social class, or home language. But local conditions and the practices of charter
operators likely shape the extent to which enrollment is more or less selective. What’s not
known is whether differing types of charter organization act – even inadvertently – to
exacerbate the stratification of differing students. We are not suggesting that charter
purposefully select more advantaged or higher achieving students. This may simply result
from the eager pursuit of better school options by a nonrandom set of parents.
Charter schools in Los Angeles – Unpacking differing achievement effects – 7
Earlier research shows that more advantaged or better educated parents (even
among lower-income mothers with higher school attainment) exercise school choice
more frequently than others (Buckley & Schneider, 2009; Henig, Hula, Orr, &
Pedescleaux, 2001). Tracking ethnically diverse students entering Chicago’s liberalized
choice scheme, Lauen (2009) found that those from middle-class families on average
traveled longer distances to private or competitive TPS, and enjoyed stronger learning
gains – compared with peers from poor, mostly Black families who exited neighborhood
school at lower rates, traveled shorter distances, and displayed weaker gains when they
did enter the wider market of urban schools.
Charter schools may simply manifest the prior structure of the local education field
along lines of race and class, not necessarily exacerbate the stratification of families and
schools. Renzulli (2006), for instance, found that a larger share of Black families enrolled
their children in charter schools when living in a more racially segregated school district,
compared with weaker demand for charters among Black parents in integrated districts.
The segmentation of schools along lines of race or social class may also stratify the
availability of key resources, including the quality of facilities, teachers, and instructional
materials – the basis of ample school finance litigation (Rebell, 2009). Magnet,
vocational, and the progressive “free schools” of the 1970s contribute to the ancestry of
site-run charter schools, each model pressed by certain social groups or pedagogical
advocates (Lubienski & Lubienski, 2006).
The L.A. Story – Do Charter Schools Attract Certain Students and Teachers?
Los Angeles exemplifies how urban school districts have devised or accommodated
a variety of school organizations over the past generation. This institutional diversity is
tied to the argument that site-run schools can better nurture teacher cohesion and student
engagement. These decentralized schools include conversion and start-up charter schools
in the context of LAUSD, along with the similarly autonomous ESBMM model. The latter
involves charter-like detachment from regulatory regimes and allows schools to operate
under a “thin” labor contract, awarding principals greater authority to hire and fire
teachers. Teachers with ESBMM schools remain within the district’s personnel and
benefits system (Martínez & Quartz, 2012). While the United Teachers of Los Angeles
opposes the spread of charter schools, it supports the ESBMM model as a viable
Charter schools in Los Angeles – Unpacking differing achievement effects – 8
competitor to charter schools.
One of L.A.’s earliest charter schools illustrates how family and educator interests,
at times segmented along lines of race and social class, may correspond to attracting
certain students and families. Leaders and parents tied to Pacific Palisades High School,
situated on the affluent west side of the city, initially petitioned to become a
district-affiliated (conversion) charter, affording limited autonomy from the downtown
bureaucracy and labor agreements, while winning flexibility to select students residing as
far east as the UCLA community.
The map following the Appendix details how charters generally sprouted on the
west side of Los Angeles and middle-class parts of the San Fernando Valley in the early
2000s, led by an early wave of conversion charters. Then, the LAUSD board began to
approve charter applications from start-ups, including those designed by charter
management groups, mostly low-income parts of downtown, East L.A., and South Los
Angeles (Kerchner, Menefee-Libey, Mulfinger, & Clayton, 2008; Ledwith, 2010).
These differing niches carved out by distinct types of charter schools stem from
local institutional histories. The so-called Belmont Zone of Choice – created by LAUSD
after agitation by Latino activists in East L.A. – abolished neighborhood attendance zones,
invited charter companies to create new campuses, and sparked the eventual founding of
51 pilot schools (Fuller, 2010; Martinez & Quartz, 2012). At the same time, middle-class
communities have used the ESBMM mechanism to win charter-like deregulation, helping
to sharpen their identity and hire preferred teachers.
What remains unknown is the extent to which these different types of site-run
schools, expanding across LAUSD, attract certain types of students and teachers. Then, in
turn, how might differing inflows of families and resources act to condition the
achievement effects of conversion and start-up charters relative to TPS campuses?
Research Questions – How Diverse Charter Schools May Yield Differing Effects
Our empirical analysis begins with two descriptive questions:
RQ1. Do conversion and start-up charters, along with similarly site-run (ESBMM)
schools and TPS, attract differing students in terms of ethnic background, language
proficiency, social-class attributes, and achievement levels at baseline?
Charter schools in Los Angeles – Unpacking differing achievement effects – 9
RQ2. Do conversion and start-up charters, along with similarly site-run (ESBMM)
schools and TPS, attract kinds of teachers in terms of ethnicity, credential levels, length of
experience, and tenure status?
After discovering that these differing kinds of schools tend to serve particular
students and teachers, differing from TPS peers, we then ask whether this conditions
varying effects on student learning over time. This analysis is informed by initial research
showing that start-up charters may show stronger achievement effects, since they enjoy
greater independence, compared with conversion charters that remain somewhat
entangled with district headquarters and negotiated labor rules (Nisar 2012).
We know little about whether particular kinds of pupils will benefit more from
certain types of schools. For example, Angrist, Pathak, and Walters (2011) did find larger
positive effects for Black and Latino pupils (who entered with lower test scores) after
attending charter middle schools in Massachusetts, compared with their White peers.3
And remember, we know that conversion charters that initially operated in LAUSD have
tended to serve higher achieving students, then exerted little value-added benefits on
learning, beyond levels achieved by TPS peers (Lauen, Fuller, & Dauter, 2015). So, to
test for such heterogeneity of effects stemming from the differing forms of site-run
schools, we focus on four explanatory questions:
RQ3. Do students attending a charter school for three or four years outperform
statistically matched peers in TPS that share similar attributes? Are these results sensitive
to the method of statistical estimation?
RQ4. Do charter school achievement effects differ by school level, that is, among
students attending elementary, middle, or high schools?
RQ5. Do charter school achievement effects differ for students attending start-up
versus conversion charter schools?
RQ6. Do charter school achievement effects differ by the varying number of years of
student attendance (dosage)?
Method
Data
Longitudinal data obtained from LAUSD allowed us to track students attending a
charter, ESBMM, or traditional public school over the 2007-08 to 2010-11 school years.
Charter schools in Los Angeles – Unpacking differing achievement effects – 10
These records include data on a variety of student attributes and test score results for
English language arts (ELA) and mathematics in grades 2 to 11. Data on charter school
students, including longitudinal test score information, were compiled by staff at the
California Department of Education (CDE), along with teacher characteristics.
We then built tandem samples of students who attended a charter school for two or
three consecutive years during grades 3 to 5, grades 6 to 8, or grades 9 to 11,
corresponding to the typical period of elementary, middle, and high school in LAUSD.4
Given the more recent founding of ESBMM schools, data were available for the two final
years of the time series and included in descriptive analyses, but these schools were
excluded from explanatory analyses.
The first sample includes pupils attending the same school throughout the
designated periods and for whom a prior test score was available at grade 2, 5, or 8. This
limited the size of our student sample but ensured conservative controls on each child’s
prior proficiency level and family background. Sampled students are labeled stayers.
They include 32,657 elementary (2,773 charter, 29,884 TPS), 1,018 middle (556 charter,
462 TPS), and 1,032 high school (214 charter, 818 TPS) students at baseline in 2007-08.
Comparison groups are TPS-enrolled students for each respective time period.
The second sample includes only students who moved from a TPS into a charter
school, those we call switchers. This sample offers a more thorough control on overt bias
since the key covariate (i.e., baseline test scores) is not contaminated by the child’s
treatment status (Ballou, Teasley, & Zeidner, 2008). On the other hand, this sample of
switchers only includes students and families who considered moving to a new school
prior to grades 3, 6, or 9, a particular choice set, constraining the generalizability of our
estimates. This second sample included 2,677 elementary (174 charter, 2,503 TPS),
31,993 middle (1,848 charter, 30,145 TPS), and 28,315 high school (1,764 charter, 26,551
TPS) students at baseline in 2007-08.
The resulting tandem samples of students resulted in those who attend entirely
independent start-up charter schools, affiliated or independent conversion charters. A
complete list of schools included in the study appears following the Appendix. The
geographies in which conversion charters first appeared in the District – generally but not
always situated in economically better-off areas – plays a role in the demographic

Charter schools in Los Angeles – Unpacking differing achievement effects – 11
attributes of students and families as we detail below. The later spread of start-up charters
– serving lower-income communities beginning in the mid-2000s – yields a differing
demographic profile on average.
Measures
Achievement outcomes. California Standards Tests (CSTs) were administered to
almost all students in the spring of each year in ELA and math between grades 2 and 11.
California had not vertically scaled these tests across grades (prior to adopting Common
Core State Standards), so we calculated standard z-scores for each student’s grade-level
CST score. We did not estimate math achievement for high school students: these tests
reflect multidimensional scales in math, including algebra, geometry, and calculus. Pupils
also complete these courses in different grades.
Student characteristics. Schools report various pupil attributes attached to CST test
forms each year, including the child’s ethnicity, designation as “limited English
proficient,” special education eligible, qualifying for subsidized lunch, and categories of
parent education. The latter variable was missing for about one-quarter of the student
sample at baseline, mostly for young students (2007-08). Given this covariate’s possible
importance as one predictor of selecting a charter school, we dropped students failing to
report parental education. We refer to the subsidized-lunch variable as a proxy for
economic disadvantage (PED).
Teacher characteristics. Viewing teachers as one key resource that charter and
ESBMM schools attempt to attract, we obtained administrative data from the CDE to
assess qualitative differences in teachers. Each LAUSD school reports annually on the
count of teachers, ethnic affiliations of their staff, teachers with and without a full
teaching credential (as opposed to an “emergency credential” or student interns serving as
instructors), whether tenured or not, years of teaching experience, and possessing a
graduate degree beyond the bachelor’s level.
Comparing Results from Three Estimation Methods
We utilize ordinary least-squares (OLS) regression and two quasi-experimental
techniques to estimate the impacts of attending charter schools relative to TPS
counterparts. We compare the resulting estimates for each subject (ELA and math) and
school level (elementary, middle, and high school). We also compare the results by
Charter schools in Los Angeles – Unpacking differing achievement effects – 12
dosage (i.e., how many years the student attended a charter school), ranging from two
different cohorts for switchers who could attend for up to two years, and for stayers
enrolled up to four years. Finally, we disaggregate charter students between those
attending a start-up versus a conversion charters. We begin with OLS regression as a conventional starting method. This approach
assumes that an underlying linear form is the true model. This is naïve for drawing
impact estimates using observational data because OLS regression fails to account for the
prior school-selection process or potential confounders that affect the likelihood of
selecting the treatment and shaping achievement outcomes.
To address these shortcomings we employ two types of matching techniques.
Although matching methods still remain vulnerable to selection bias due to omitted
variables, these techniques reduce this risk by matching students on observable covariates
without making strong assumptions about the functional form of the covariates; these
methods increase the robustness of the treatment-effect estimates to model specification
choices (Ho, Imai, King, & Stuart, 2007).
The core foundation for matching methods is Rubin’s (1974) causal model, which
conceptualizes causal inference in terms of the potential outcomes under treatment and
control, only one of which is observed. The causal effect of charter school attendance can
be defined as the difference between an observed outcome and its counterfactual
(Holland, 1986; Rubin, 1974). In reality a variety of categorical (e.g., parent’s education
level) and continuous factors (e.g., prior achievement) influence student selection into a
charter school. Finding exact matching pairs remains challenging.
Given the multiple factors that affect family or student selection of a charter school,
nearest-neighbor matching is often employed based on a propensity score. This technique
has become common in the sociology or economics of education, due to its appealing
theoretical properties (e.g., Berends, Goldring, Stein, & Cravens, 2010; Buckley &
Schneider, 2005; Xiang & Tarasawa, 2015; Zimmer & Buddin, 2006). Researchers assign
a conditional probability of receiving a treatment to each individual student based on the
relevant set of observed covariates. Matching on such a propensity score will eliminate
overt bias in the sample, but only if we know the correct propensity score or construct a
full model to estimate it (Rosenbaum & Rubin, 1983). In practice, since we do not know
Charter schools in Los Angeles – Unpacking differing achievement effects – 13
this propensity score, we must estimate it by including all the potentially confounding
covariates in a logistic or probit regression model.5
Genetic matching offers an alternative to propensity score matching by using the
iterative machine-learning algorithm that matches individuals based on their weighted
Mahalanobis distances in multivariate space ( Sekhon & Mebane, 1998). Unlike
propensity score matching that ties each treated unit to the nearest control unit on a
unidimensional metric, genetic matching uses a generalization of the Mahalanobis
distance metric (Diamond & Sekhon, 2013).6 While the propensity score matching
technique does not necessarily guarantee that acceptable balance of covariates between
treatment group and control group will be achieved, genetic matching typically advances
a satisfactory level of balance (Henderson & Chatfield, 2011).
We report comparative estimates of treatment effects based on propensity score and
genetic matching, expecting that genetic matching would provide less biased estimates.
For propensity score matching, we fit probit regressions for obtaining propensity scores
by specifying the baseline test score, special education status, limited English proficiency
status, the PED social-class proxy, and categories of ethnicity and parent education. We
use the same covariates for genetic matching. The Appendix details our identification
strategies and the equations necessary for estimating propensity scores.
Throughout the analysis we used R software (R Development, 2013), mainly the
matching package, which provides a flexible tool for implementing a variety of
algorithms, including propensity score and genetic matching (Sekhon, 2011). For the
sensitivity analysis, we used the rbounds package, which performs Rosenbaum’s method
of sensitivity analyses for matched data (Keele, 2010).
Findings
Descriptive Results – Differing Flows of Students and Teachers (RQ1)
The first two research questions ask whether the various types of deregulated
schools – start-up and conversion charters and ESBMM schools – differ in the kinds of
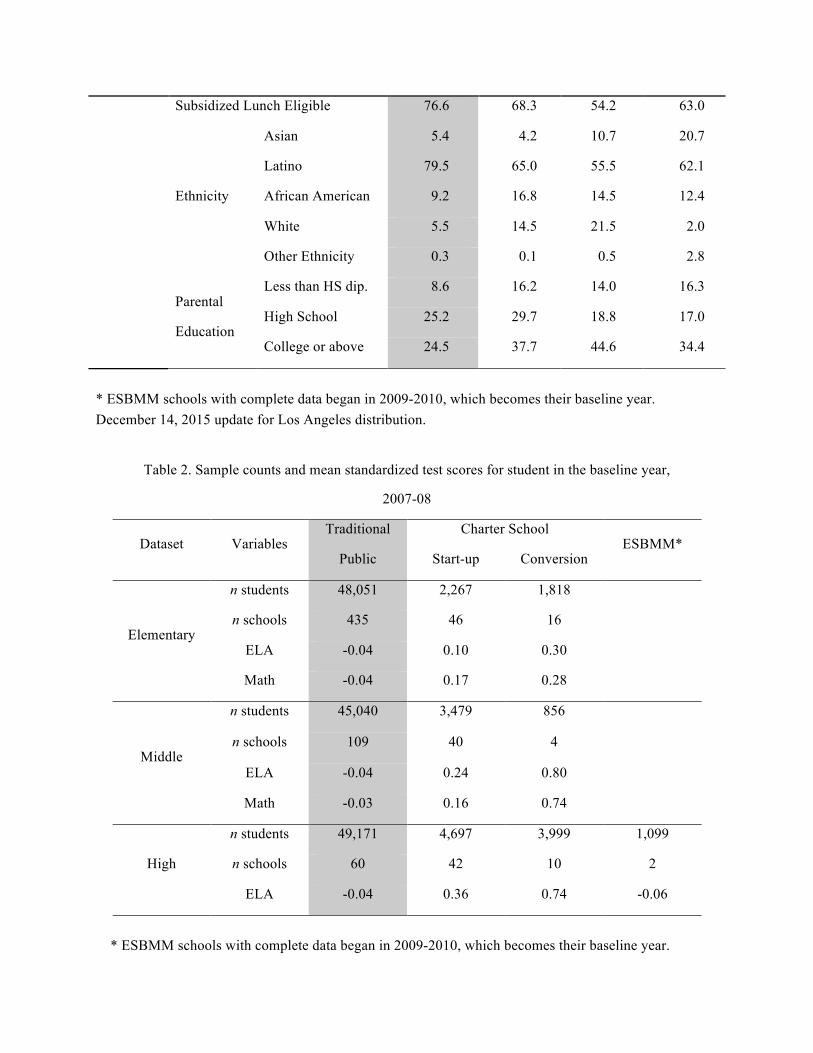
students they attract and the teachers they attract. Tables 1 and 2 (appearing at the end of
the report) detail the attributes of pupils in the baseline year (2007-08) for those attending
Charter schools in Los Angeles – Unpacking differing achievement effects – 14
elementary, middle, or high school. Given the recent origin of ESBMM schools, appearing
in 2009-10, this became the baseline year, and complete data were available for just two
of the nine ESBMM campuses.
We see that for elementary schools the conversion charters attracted pupils with
considerably higher ELA and math scores, 0.34 SD and 0.32 SD higher at baseline than the
respective means for TPS peers. Baseline math scores for pupils attending start-up
charters also ranged a bit higher, 0.14 SD and 0.21 SD greater than the respective means
for TPS students. Conversion charters served a much lower share of Latino pupils,
compared with the mean TPS (55% versus 77%), and a much lower percentage of children
eligible for subsidized lunches (50% versus 84%). In short, conversion charter schools fill
niches in economically better-off parts of LAUSD. Differences were similar when
comparing students among charter and TPS middle schools.
The organizational niches filled by start-up and conversion charters emerge even
more vividly when turning to high schools and the two ESBMM high schools with
complete data. The 28 start-up charter high schools enrolled pupils with significantly
higher test scores at baseline. The mean ELA score for these students was 0.40 SD higher
than TPS peers on average. Start-up charters served a lower share of Latino and Black
pupils than traditional schools. Mean parental education ranged higher for students in
start-ups relative to TPS peers (56% versus 35% of parents with at least some college,
respectively). The high school sample included 3 conversion charters, and they served
much larger proportions of White students with better-educated parents than TPS peers.
The 28 start-up high schools, in contrast, tended to serve low-income Latino students,
closely resembling TPS peers. The ESBMM high schools enrolled a higher share of Asian
students and a smaller share of pupils from poor families than TPS counterparts.
These sectors also varied in terms of the kinds of teachers each attracted and
retained. Many conversions essentially inherited their teaching staff after winning their
independent status, while gaining discretion to attract the preferred mix of new teachers
in the future. Table 3, beginning with elementary schools, shows that start-up charters
employed much lower shares of tenured teachers or those with full credentials, although
charter elementary schools tended to employ a higher share of teachers with masters
degrees, compared with TPS peers. Just 19% of elementary teachers at start-up charters

Charter schools in Los Angeles – Unpacking differing achievement effects – 15
had tenure at baseline, compared with 63% employed by conversion charters and 86% at
TPS campuses. These differences are reflected in the mean years of teaching experience:
4.8 years for start-up teachers, and 10.0 and 12.2 years in conversion charters and TPS,
respectively. Conversion elementary schools employed a higher share of White teachers
and few African American teachers, compared with start-ups and TPS campuses.
Sector differences were similar at the high school level. Three-fifths of all teachers
were White at conversion high schools, compared with 48% at TPS and 45% at start-up
campuses. The start-up charters relied more on young, less experienced teachers with
masters degrees, compared with TPS or conversion charters.
Descriptive Differences in “Post-treatment” Achievement (RQ2)
Table 4 reports achievement levels in the final year of the time-series (2010-11).
These findings help to detail the kinds of students that remain in each sector at the end of
the four-year tracking period. Note that pupil achievement levels are not yet adjusted for
prior family background or matched propensities to enter a treatment.
We see that students attending elementary charters outperformed their TPS peers by
significant margins after experiencing these schools. Pupils attending start-ups scored
0.26 SD and 0.20 SD higher in ELA and math, respectively, compared with the mean TPS
student. Elementary students attending a conversion charter did even better: 0.47 SD
higher in ELA and 0.33 SD in math, relative to the TPS means. Sector achievement
differed for high school pupils as well, except that those attending the two ESBMM
schools performed at lower levels than TPS peers. Students attending conversion charter
middle schools outperformed TPS peers by 0.70 SD in ELA and 0.49 SD in math.
Estimating Charter School Effects by School Level (RQs 3 and 4)
We summarize in Table 5 the effects of charter school attendance, estimated by the
three different identification strategies, and by school level and subject after taking into
account family background. The OLS analyses regress test scores on the student-level
covariates (labeled Reg 1), and the student covariates with school fixed-effects (Reg II).
The two matching estimates report the average treatment effect on the treated (ATT) using
the student-level covariates. The propensity-score matching estimate is based on the
propensity scores obtained from a probit regression that includes the covariates in Table 1
(P-match, Appendix). Genetic matching estimates report the ATT when matched via the

Charter schools in Los Angeles – Unpacking differing achievement effects – 16
genetic algorithm, using the same student-level covariates (G-match).
Given that G-match offers the least biased estimates among the three estimation
strategies, we focus on these results. In addition we highlight differences among grade
levels and results for charter school stayers and switchers. Beginning with switchers into
elementary charter schools, we estimated higher gains in ELA and math, although the
differences vis-à-vis TPS counterparts were not significant. In contrast, for the middle
school switchers, charter students showed significantly higher test scores on average, by
about 0.15 SD in ELA and 0.27 SD in math, compared with TPS peers. At the high school
level, switchers showed similar achievement differences in ELA relative to TPS
counterparts. Yet charter effects were only statistically significant for middle school
switchers; these results were consistent across the different estimation methods.
Results for charter school stayers differed in several ways. At the elementary level,
charter students displayed gains in ELA and math, 0.14 SD and 0.07 SD, respectively. In
addition, the estimates for stayers proved sensitive to the identification strategy. This is
not surprising since the key covariate, baseline score, may be contaminated by the
treatment status, although controlled for. OLS regressions were sensitive depending on
whether school fixed-effects were specified or not. Yet P-match showed results that were
quite similar to G-match results.
Middle school stayers demonstrated similar learning gains in ELA and math relative
to TPS counterparts. Unlike math, simple regression yielded significant charter school
effects in ELA, but these advantages diminished under matching techniques. This implies
that the estimated treatment effects from the parametric regression approach stems from
How Big Is a Standard Deviation Advantage? In short, quite big. A common barometer is required to compare the size of achievement effects that stem from differing types of schools or educational programs. These so-called effect sizes are reported as fractions of standard deviations (SD). We know, for example, that high-quality preschools can lift the early learning of young children by one-third (0.35) to a full (1.00) SD, compared with youngsters who remain unable to enter such programs, at least among poor children. Reducing class sizes in K-12 by about 10 students, which is costly, can raise average pupil achievement by only about one-tenth (0.10) of a SD, considered to be a very small effect by analysts. The estimated differences in achievement between charter school pupils and TPS peers reported in the present report, while statistically significant, mostly remain under one-fifth (0.20) SD. This magnitude of difference is commonly interpreted as small. The one exception is charter middle schools, where effect sizes approach 0.30 SD. This range suggests a notable level of impact on student achievement.
Sources: Cho, Glewwe, Whitler, (2012); Gormley, Phillips, & Gayer (2008): Jepsen & Rivkin (2009).

Charter schools in Los Angeles – Unpacking differing achievement effects – 17
selection bias and largely vanishes when matching methods are employed.
In summary, students who switched from a TPS elementary school into a charter
middle school outperformed peers who remained in a TPS middle school. These switchers
displayed advantages of 0.15 SD in ELA and 0.27 SD in math on average. The latter
difference can be interpreted as modest in magnitude. Elementary students who stayed in
a charter school displayed small learning advantages relative to TPS peers: 0.14 SD higher
test scores in ELA on average, and 0.07 SD higher in math. These magnitudes of
difference are similar to estimates for Boston charters (Abdulkadiroğlu et al., 2011;
Angrist et al., 2011), based on admission lotteries (ELA, 0.08 SD; math, 0.21 SD)
Do Charter Effects Vary between Conversion and Start-up Organizations? (RQ 5)
Given the differing positioning of conversion and start-up charters – with regard to
pupils and teachers selected – this may condition their varying capacity to raise student
achievement. We saw how students switching into charter middle schools enjoyed
learning advantages vis-à-vis TPS peers, while elementary school switchers and high
school switchers did not.
However, we discovered heterogeneous effects when separating switchers between
those entering start-ups versus conversion charters. Students switching into a start-up
middle school displayed steeper learning curves: 0.12 SD in ELA and 0.38 SD in math,
compared with the mean TPS peer. The latter effect size reaches a moderate level of
magnitude. The corresponding estimates for pupils switching into conversion charters
were 0.16 SD in ELA and 0.19 SD in math.
Do Charter School Effects Vary by Length of Student Attendance? (RQ6)
Next we examined whether learning gains were sensitive to years of attendance
within a charter school. The left side of Figures 3 and 4 shows stayers who attended the
same charter for four years between grades 2-5, 5-8, or 8-12. For switchers we estimate
effects for up to three years of attendance, given that they switched from a TPS after the
first year (after grade 2, 5, or 8). The right side of the figures reports the estimates for
corresponding subgroups that attended a charter for just two years for each of two
different cohorts. At the middle-school level, for instance, cohort 1 is the group of
students assessed at baseline in grade 5 in 2007-08, and the eventual achievement
outcome was measured in grade 7 in 2009-10; cohort 2 is the group assessed in grade 6 at
Charter schools in Los Angeles – Unpacking differing achievement effects – 18
baseline in 2008-09, with their eventual achievement measured at grade 8 in 2010-11. We
expected that more years of attendance would raise the magnitudes of the estimates.
In fact, gains in ELA scores were not affected by the dosage for elementary and high
school-level switchers. Yet for middle school switchers, we see that attending a charter
for two years or more yields stronger effects for ELA and math scores. Peer effects may
play a role – testable by comparing two different cohorts with the same dosage.
Elementary charters did yield an effect in math (with borderline significance) for
switchers who attended charters for two years, a benefit not observed prior to this
decomposition of dosage levels.
Finally, one reviewer points out that graduation rates tend to range higher for
charter high schools, compared with TPS high schools in LAUSD. This may result in
“surviving” TPS high school students that achieve at higher levels on average, given that
lower-achievers have exited high school. We have no direct evidence of this, but it
suggests the need for future research on the value-added effects of charter high schools.
Checking for Covariate Balance after Statistical Matching
Diverging results between P-match and G-match techniques may stem from
differing patterns of balance in the covariates. Good balance is important to ensure that
the groups being compared offer sufficient counterfactual cases for one another, at least
on attributes that we can observe (Ho et al., 2007; Rubin, 2005). Balance levels by the
P-match and G-match techniques were similar overall, although genetic matching tended
to show higher p-values when applying t-test or KS tests, indicating a more even balance
among treatment group and control group.7 Thus, the charter school effects presented
above do not appear to result from differences between treated and untreated groups on
the covariates used in this study.
One exception that shows a discrepancy between P-match and G-match arose for
middle school stayers in math. To diagnose the source of this difference, we present the
covariate balance achieved by two different matching methods in Figures 1 and 2. In
these two graphs, the solid circles represent the p-values for t-test and KS tests,
respectively, before matching on covariates; the solid triangles represent the p-values
after matching. We expect the dots to locate on the right side of the two dashed lines,
indexed for p-values of less than 0.05 or 0.10, when each covariate is balanced between
Charter schools in Los Angeles – Unpacking differing achievement effects – 19
treatment and control groups.
By comparing Figures 1 and 2, we see that the key covariate, the student’s baseline
test score, is not balanced after matching that relies solely on the propensity score. Yet
the balance for other covariates, including the baseline score, improved when genetic
matching was employed. This informs why we conclude that the genetic matching
estimates are less biased than those derived from propensity score matching.
Practically speaking, unbalanced covariates are more prevalent in organizational
fields with highly differentiated firms. Checking the balance in covariates after attempts
at matching yields further information about the distinctiveness of each organizational
form, in our case indicated by sharply varying types of students and teachers. This is
illustrated in Figures 1 and 2, where both matching techniques failed to achieve balance
for school-level covariates, starting with whether teachers were fully credentialed.
Sensitivity Analysis Overall, we have observed stronger achievement gains for elementary-level stayers
and, most consistently, middle school level switchers relative to their respective TPS
peers. These estimates may still be biased by unobserved covariates that were not
included in the matching process. To address this concern we conducted a sensitivity
analysis, estimating how large the difference in the underlying probability of receiving
treatment must be to alter the interpretation of estimates based on the two matching
techniques. Sensitivity tests assess if estimates are robust to bias due to remaining
imbalances in any observed or excluded covariates after matching (Rosenbaum, 2002).
We found that results for charter middle schools are most robust, largely immune to the
potential effects of omitted selection factors (or confounders, see Appendix).
Summary and Implications
We have detailed how differing types of charter schools and similar site-run
campuses often attract particular students and teachers. Overall, charters attract higher
achieving students at baseline, then rely on variably experienced teachers in hopes of
further boosting achievement. Start-up charter schools occupy a particular position in this
segmented organizational field and teacher workforce, relative to TPS. Mean years of
Charter schools in Los Angeles – Unpacking differing achievement effects – 20
experience for elementary teachers equaled 4.8 in start-up charters versus 12.2 years in
TPS. In addition, conversion charters are distinctly positioned in LAUSD to pull-in higher
achieving students and experienced teachers.
Conversion high schools display a distinct complexion as well, where three-fifths of
teachers were White, compared with 48% at TPS and 45% at start-up charters. Start-up
high schools also relied more on younger, less experienced teachers, compared with TPS
campuses. These distinct flows of teacher resources were so segmented among
conversion, start-up, and TPS campuses that we could not achieve sufficient balance when
experimenting with school-level covariates for statistical matching.
The racial or class-related positioning of charter schools, relative to TPS, emerges
when unpacking student attributes as well. Conversion elementary schools serve pupils
with higher ELA and math scores, 0.34 SD and 0.32 SD greater at baseline relative to TPS
students, respectively. Even baseline math scores for pupils attending start-up charters,
more often of color and from less educated families, ranged a bit higher, 0.21 SD greater
than for TPS peers. We saw how conversion charter elementaries served a much lower
share of Latino pupils, compared with the mean TPS (55% versus 77%, respectively), and
a much lower percentage of children eligible for subsidized lunches (50% versus 84%).8
Much remains to be learned on how this positioning of conversion and start-up
charter schools – in terms of geography and the social class of families served –
conditions the learning trajectories of students. Qualitative fieldwork could inform how
diverse charters at times select particular families, then work to lift achievement.
We did observe that conversion charters effectively maintain baseline advantages
for the relatively advantaged students they attract, relative to start-ups and TPS. Yet
charter middle schools then lift the learning trajectories of their students relative to peers
who remain in TPS. These gains for charter middle-schoolers are consistent across the
three methods of estimation, although they vary in magnitude after family background is
carefully taken into account. The analysis for pupils switching into a charter school offers
the best approximation of the discrete treatment impact. At the middle-school level,
switchers into charters displayed significantly higher scores: about 0.15 SD higher in ELA
and 0.27 SD higher in math, compared with TPS peers.
Charter schools in Los Angeles – Unpacking differing achievement effects – 21
Similarly, elementary-level stayers attending charter schools displayed small
achievement advantages: somewhat higher scores in ELA and math, 0.14 SD and 0.07 SD,
respectively, compared with TPS peers. Results for elementary-level stayers are based on
a larger student population, compared with switchers, but the stayers analysis remains
less demanding in terms of taking into account prior unobserved features of families,
which may explain part of this advantage.
While conversion charters effectively maintained or widened differences in student
performance vis-à-vis TPS peers, start-ups held slight, yet at times significant, benefits
after taking into account prior achievement and family background. The notable
exception is start-up middle schools, which significantly boost math achievement above
levels observed among TPS peers. And start-up charters appear to benefit many
elementary-level children from low-income families, albeit at low levels of magnitude.
Overall, the organizational position held by start-up charters may result in drawing less
effective teachers or resources – including differing populations of families – compared
with those drawn by conversion charters.
One nagging worry is that the spread of start-up and conversion charters may
further separate high from low-achieving students across LAUSD – organizational
diversity that even inadvertently may worsen segregation. Nor do we understand how this
evolving landscape of alternative schools may harm the educational trajectories of
weaker students who remain in traditional schools.
This threat of wider disparities could be minimized if LAUSD’s traditional schools
responded to the challenge presented by charter schools. The District might learn, for
example why charter middle schools appear to lift achievement higher, and then advance
the effectiveness of TPS counterparts. Still, we don’t know whether the ongoing spread of
charter schools serves to spur or erode LAUSD’s capacity to lift its own campuses. Our
findings do suggest that many charter schools will continue to draw-out higher achieving
students from traditional schools.
Finally, evaluation researchers often endeavor to associate variation in the internal
features of organizations with varying results for students or clients. Instead, we have
shown the utility of backing up to understand how segmented sets of schools are
becoming more diverse in a less regulated field. The contrasting features of these diverse

Charter schools in Los Angeles – Unpacking differing achievement effects – 22
organizations – each vying for stronger students, each advancing particular educational
aims and social-class interests – then set a telling causal chain in motion. Researchers
could better inform stakeholders and policy makers by capturing this entire process –
illuminating how schools serve differing kids and families, acquire teachers and resources
of varying quality, yielding unequal achievement effects. ý
Charter schools in Los Angeles – Unpacking differing achievement effects – 23
References Abdulkadiroğlu, A., Angrist, J. D., Dynarski, S. M., Kane, T. J., & Pathak, P. A. (2011).
Accountability and flexibility in public schools: Evidence from Boston’s charters and pilots. The Quarterly Journal of Economics, 126(2), 699–748.
Angrist, J. D., Pathak, P. A., & Walters, C. R. (2011). Explaining charter school effectiveness. National Bureau of Economic Research.
Ballou, D., Teasley, B., & Zeidner, T. (2008). Charter schools in Idaho. Charter School Outcomes. New York: Lawrence Erlbaum Associates.
Berends, M., Goldring, E., Stein, M., & Cravens, X. (2010). Instructional conditions in charter schools and students’ mathematics achievement gains. American Journal of Education, 116(3), 303–335.
Bodine, E., Fuller, B., González, M., Huerta, L., Naughton, S., Park, S., & Teh, L. W. (2008). Disparities in charter school resources—the influence of state policy and community. Journal of Education Policy, 23(1), 1–33.
Buckley, J., & Schneider, M. (2005). Are charter school students harder to educate? Evidence from Washington, DC. Educational Evaluation and Policy Analysis, 27(4), 365–380.
Carruthers, C. K. (2012). The Qualifications and Classroom Performance of Teachers Moving to Charter Schools. Education Finance and Policy, 7(3), 233–268.
Cho, H., Glewwe, P., & Whitler, M. (2012). Do reductions in class size raise students’ test scores? Evidence from population variation in Minnesota's elementary schools. Economics of Education Review, 31, 77-95.
Cowen, J. M., & Winters, M. A. (2013). Do Charters Retain Teachers Differently? Evidence from Elementary Schools in Florida. Education Finance and Policy, 8(1), 14–42.
Diamond, A., & Sekhon, J. S. (2013). Genetic matching for estimating causal effects: A general multivariate matching method for achieving balance in observational studies. Review of Economics and Statistics, 95(3), 932–945.
Dobbie, W., & Fryer Jr, R. G. (2011). Getting beneath the veil of effective schools: Evidence from New York City. National Bureau of Economic Research.
Fligstein, N., & Dauter, L. (2007). The sociology of markets. Annu. Rev. Sociol., 33, 105–128. Fuller, B. (2010). Palace revolt in Los Angeles? How charter school and Latino leaders push
unions to innovate. Education Next, 10, http://educationnext.org/palace-revolt-in-los-angeles/. Fuller, B. (2015). Organizing Locally: How the New Decentralists Improve Education, Health
Care, and Trade. University of Chicago Press. Fuller, B., Waite, A., Chao, C., Benedicto, I. (2014). Rich communities in small high schools?
Teacher collaboration and cohesion inside 25 Los Angeles campuses. Berkeley: Graduate School of Education.
Furgeson, J., Gill, B., Haimson, J., Killewald, A., McCullough, M., Nichols-Barrer, I., Demeritt, A. (2012). Charter-school management organizations: Diverse strategies and diverse student impacts. Mathematica Policy Research, Inc.
Gormley, W., Phillips, D., & Gayer, T. (2008). Preschool programs in Oklahoma help children to succeed in school. Science, 320, 1723-24.
Hanushek, E. A., Kain, J. F., Rivkin, S. G., & Branch, G. F. (2007). Charter quality and parental decision making with school choice. Journal of Public Economics, 91(5), 823–848.
Henderson, J., & Chatfield, S. (2011). Who matches? Propensity scores and bias in the causal effects of education on participation. The Journal of Politics, 73(03), 646–658.
Henig, J. R., Hula, R. C., Orr, M., & Pedescleaux, D. S. (2001). The color of school reform: Race, politics, and the challenge of urban education. Princeton University Press.

Charter schools in Los Angeles – Unpacking differing achievement effects – 24
Ho, D. E., Imai, K., King, G., & Stuart, E. A. (2007). Matching as nonparametric preprocessing for reducing model dependence in parametric causal inference. Political Analysis, 15(3), 199–236.
Holland, P. W. (1986). Statistics and causal inference. Journal of the American Statistical Association, 81(396), 945–960.
Hoxby, C. M., & Murarka, S. (2009). Charter schools in New York City: Who enrolls and how they affect their students’ achievement. National Bureau of Economic Research.
Hoxby, C. M., & Murarka, S. (2009). Charter schools in New York City: Who enrolls and how they affect their students’ achievement. National Bureau of Economic Research.
Huerta, L. A. (2009). Institutional v. technical environments: Reconciling the goals of decentralization in an evolving charter school organization. Peabody Journal of Education, 84(2), 244–261.
Jackson, C. K. (2012). School competition and teacher labor markets: Evidence from charter school entry in North Carolina. Journal of Public Economics, 96(5), 431–448.
Jepsen, C., & Rivkin, S. (2009). Class size reduction and student achievement the potential tradeoff between teacher quality and class size. Journal of Human Resources, 44, 223-250.
Keele, L. (2010). An overview of rbounds: An R package for Rosenbaum bounds sensitivity analysis with matched data. White Paper. Columbus, OH, 1–15.
Kerchner, C. T., Menefee-Libey, D. J., Mulfinger, L. S., & Clayton, S. E. (2008). Learning from LA: Institutional Change in American Public Education. ERIC.
Lauen, D. (2009). To choose or not to choose: High school choice and graduation in Chicago. Educational Evaluation and Policy Analysis, 31(3), 179–199.
Lauen, D., Fuller, B., & Dauter, L. (2015). Positioning charter schools in Los Angeles: Diversity of form and homogeneity of effects. American Journal of Education, 121, 213-239.
Ledwith, V. (2010). The influence of open enrollment on scholastic achievement among public school students in Los Angeles. American Journal of Education, 116(2), 243–262.
Lesaffre, E., & Albert, A. (1989). Multiple-group logistic regression diagnostics. Applied Statistics, 425–440.
Lubienski, S. T., & Lubienski, C. (2006). School sector and academic achievement: A multilevel analysis of NAEP mathematics data. American Educational Research Journal, 43(4), 651–698.
Martínez, R. A., & Quartz, K. H. (2012). Zoned for Change: A Historical Case Study of the Belmont Zone of Choice. Teachers College Record, 114(10).
Nisar, H. (2012). Heterogeneous Competitive Effects of Charter Schools in Milwaukee. Draft, Abt Associates Inc.
Raymond, M. (2014). Charter school performance in Los Angeles. Stanford, CA: Center for Research on Education Outcomes.
R Development Core Team. (2013). R: A language and environment for statistical computing. Vienna, Austria.
Reardon, S. (2009). Review of how New York City's charter schools affect achievement. Boulder: National Education Policy Center.
Rebell, M. A. (2009). Courts and kids: Pursuing educational equity through the state courts. University of Chicago Press.
Renzulli, L. A. (2006). District Segregation, Race Legislation, and Black Enrollment in Charter Schools. Social Science Quarterly, 87(3), 618–637.
Renzulli, L. A., Barr, A. B., & Paino, M. (2014). Innovative Education? A Test of Specialist Mimicry or Generalist Assimilation in Trends in Charter School Specialization Over Time. Sociology of Education.
Rosenbaum, P. R. (2002). Observational studies. New York: Springer.
Charter schools in Los Angeles – Unpacking differing achievement effects – 25
Rosenbaum, P. R., & Rubin, D. B. (1983). The central role of the propensity score in observational studies for causal effects. Biometrika, 70(1), 41–55.
Rubin, D. B. (1974). Estimating causal effects of treatments in randomized and nonrandomized studies. Journal of Educational Psychology, 66(5), 688.
Rubin, D. B. (2005). Causal inference using potential outcomes. Journal of the American Statistical Association, 100(469), 322–331.
Sekhon, J. (2011). Multivariate and propensity score matching software with automated balance optimization: The matching package for R. Journal of Statistical Software, 42(7), 1–52.
Sekhon, J. S., & Mebane, W. R. (1998). Genetic optimization using derivatives. Political Analysis, 7(1), 187–210.
Tuttle, C. C., Gill, B., Gleason, P., Knechtel, V., Nichols-Barrer, I., & Resch, A. (2013). KIPP Middle Schools: Impacts on Achievement and Other Outcomes. Final Report. Mathematica Policy Research, Inc.
Xiang, Y., & Tarasawa, B. (2015). Propensity score stratification using multilevel models to examine charter school achievement effects. Journal of School Choice, 9, 179-196.
Zimmer, R., & Buddin, R. (2006). Charter school performance in two large urban districts. Journal of Urban Economics, 60(2), 307–326.
Zimmer, R., & Buddin, R. (2006). Making Sense of Charter Schools: Evidence from California. Occasional Paper. Rand Corporation.
Zimmer, R., Gill, B., Booker, K., Lavertu, S., & Witte, J. (2012). Examining charter achievement effects across seven states. Economics of Education Review, 31(2), 213–224.
Appendix
Specifying the OLS Model The identifications estimated for switching students and families are for those who switched schools at baseline in 2007-08, and then attended the same school until the final year, 2010-11. Identifications for stayers are for students who stayed in the same school from 2007-08 to 2010-11. The same estimation strategies are applied to both switchers and stayers. For the OLS regressions, we consider the empirical model:
Yis =!CHis + "'Xis +#s + $ is
where Yis is the test score for individual i attending school s in the outcome year; CHis is a dummy variable which indicates if individual i in school s attends a charter school (treatment); Xis are the observable individual characteristics a student who attends school s; !s represents school fixed effects; and ! is is a random error. Baseline test score, the child’s ethnicity, designation as limited English proficient and special education eligible, the PED social-class proxy, and parent education (less than high school diploma, some college, or more), are included as student covariates in Xis . The equation above corresponds to Reg II, which is more general, and Reg I that is identical except it does not include school fixed effects term,!s . The estimator from the Reg II controls for any unobserved differences between students in the same school. Modeling Selection into ‘Treatment’ Schools using Propensity Score Matching For the propensity score matching analysis, we use probit regression that specifies baseline test score, special education status, limited English proficiency status, subsidized the PED social-class proxy, and categorized ethnicity and parent education as covariates. For parent education the

Charter schools in Los Angeles – Unpacking differing achievement effects – 26
“college or above” category is used as the reference group. We use GLM function and MATCH function in the software, R, to obtain propensity scores and the average treatment effect on the treated (ATT). Table A1 presents the results of the propensity score estimation for the example of standardized math scores for switchers attending middle school.
Appendix Table 1. Factors affecting the likelihood of attending a charter school obtained from the probit regression
Coefficient
Standard error
Baseline -0.04 ** 0.02 Disability / Special Education -0.20 *** 0.05 English learner 0.10 ** 0.03 PED social-class proxy -0.53 *** 0.03 Asian -0.23
0.21
Hispanic -0.32
0.21 Black 0.08
0.21
White 0.19
0.21 Less than high school (parent) -0.09 * 0.04 High school graduate (parent) -0.05
0.03
Number of Observations 22,304 Number of schools 465 AIC 10319
For the genetic matching analysis we use the same covariates that are used for obtaining the propensity scores. We run the GenMatch function in R using the default loss function, which implies “lexical” optimization: all of the balance statistics will be sorted from the most discrepant to the least and weights will be picked which minimize the maximum discrepancy. During solving the optimization problem, we use 1000 population size, which seems large enough to find good solutions. We also report ATT. Sensitivity Analysis For the sensitivity analysis, different levels are set for Γ, the log odds of receiving treatment. The test then assesses the lower and upper bounds of a matching estimate when one observation in a matched pair is allowed to have a higher probability of receiving treatment due to observed or unobserved confounders. For example, when setting Γ=3, one observation in a matched pair could be three times as likely to have received treatment without eliminating the observed effect of that treatment. If the bounds include zero at low levels of Γ, then the estimate should be considered highly sensitive to selection bias. In our case the p-values of the effect for middle-school charter switchers after genetic matching is significant at the conventional level (α= 0.05) until Γ=1.54 for ELA and Γ=1.63 for math. The corresponding values for stayers in elementaries are Γ=1.54 for ELA and Γ=1.23 for math. These results suggest that middle school results are more robust for math gains than for charter-elementary benefits, and similarly robust for ELA at both levels of schooling. That is,
Charter schools in Los Angeles – Unpacking differing achievement effects – 27
elementary-level findings for math are more sensitive to potential bias introduced by unobserved confounders. The same procedure helps to set bounds for interpreting differential achievement effects for start-up and conversion charter schools. We found that Γ=1.15 for math effects among pupils attending start-up elementary schools; Γ=1.50 and Γ=1.48 for students in middle-school conversions for ELA and math results, respectively; and Γ=1.47 and Γ=1.88 for pupils attending middle-school start-ups for ELA and math gains, respectively. Again, we see the most robust effects at the middle-school level for both ELA and math gains. Yet despite significant reduction in overt bias using the matching techniques, the risk of bias stemming from unobserved confounders remains, especially for benefits pertaining to elementary charter school attendees.
Endnotes 1 The rigor of authorizing agencies may be another pivotal element of the regulatory 2 Traditional schools may shed less effective teachers and raise compensation for more effective teachers when a charter school opens nearby, as Jackson (2012) found, drawing on North Carolina data. Cowen & Winters (2013) found higher turnover rates in Florida charter schools, compared with TPS, over the 2002-2008 period. Less effective teachers were more likely to exit than more effective teachers, but these rates did not differ significantly between sectors. 3 In contrast, Hoxby & Murarka (2009) found no differences among ethnic groups for pupils attending New York City charter schools. 4 Most LAUSD students enter middle school at grade 6 and high school at grade 9. 5 Care must be taken in estimating a propensity score, since inclusion of too many variables, even though correlated with the treatment, can actually induce overt bias in the matched samples by reducing the overlaps between the treatment group and control group (Lesaffre & Albert, 1989). 6 The algorithm works by finding improvements in the most imbalanced variables, gradually improving balance over successive iterations during which each variable is weighed according to its relative importance for achieving the best balance. One may use the genetic algorithm by drawing from the propensity score and the covariates after they have been made orthogonal to it. If optimal balance is achieved by simply matching on the propensity score, then the other variables are given a zero weight and genetic matching will be equivalent to propensity score matching. One advantage of the genetic matching algorithm is that it directly optimizes covariate balance. 7 Kolmogorov-Simirnov (KS) test is a nonparametric test for the equality of continuous, one-dimensional probability distributions that can be used to compare two samples, and the KS test is sensitive to imbalance across the empirical distribution. 8 Fewer differences for ESBMM schools emerged, except that the two high schools served higher shares of Asian students, perhaps another particular niche within this field of deregulated firms.

Charter schools in Los Angeles – Unpacking differing achievement effects – 28
Addenda Map – The Spread of Charter and Pilot Schools in LAUSD, 2002-2015 Tables and Figures
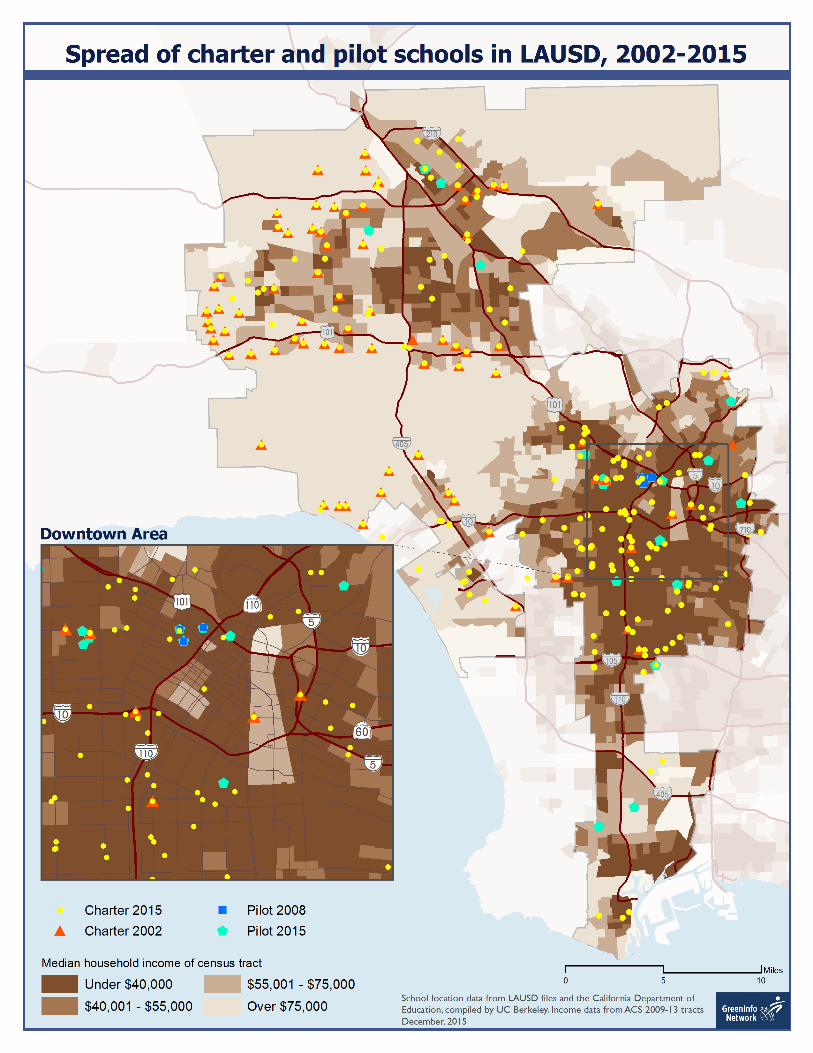
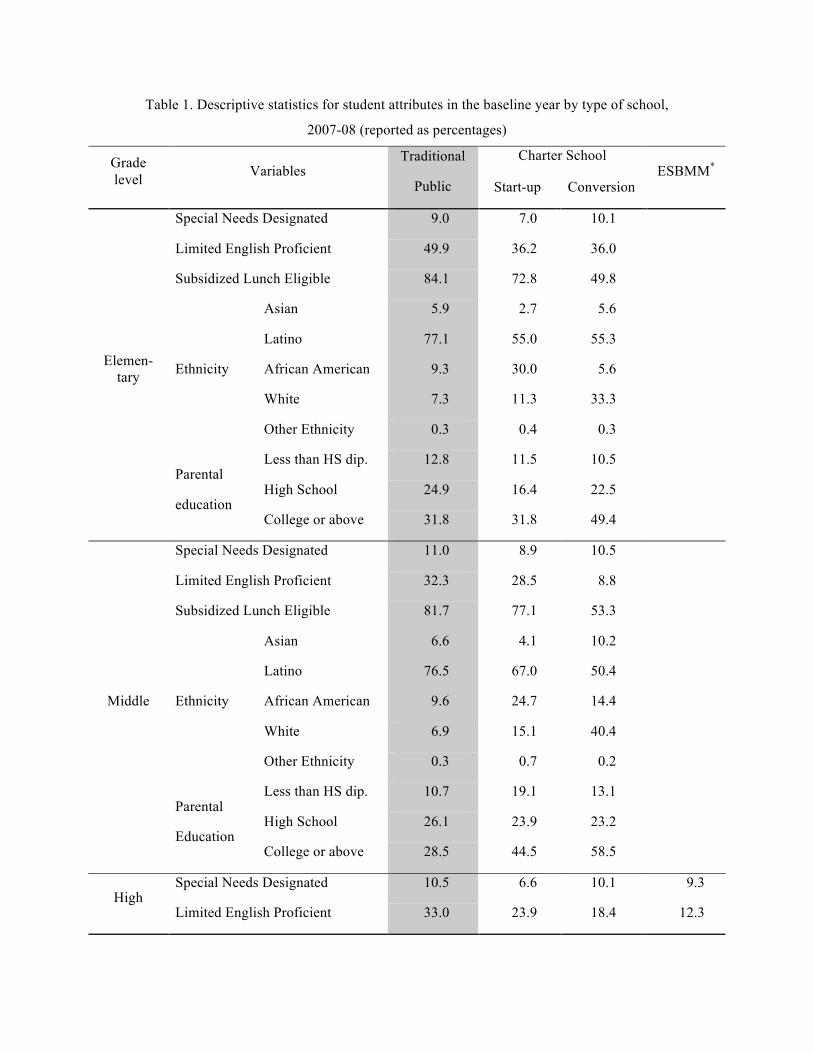
Table 1. Descriptive statistics for student attributes in the baseline year by type of school,
2007-08 (reported as percentages)
Grade level Variables
Traditional
Public
Charter School ESBMM*
Start-up Conversion
Elemen-tary
Special Needs Designated 9.0 7.0 10.1
Limited English Proficient 49.9 36.2 36.0
Subsidized Lunch Eligible 84.1 72.8 49.8
Ethnicity
Asian 5.9 2.7 5.6
Latino 77.1 55.0 55.3
African American 9.3 30.0 5.6
White 7.3 11.3 33.3
Other Ethnicity 0.3 0.4 0.3
Parental
education
Less than HS dip. 12.8 11.5 10.5
High School 24.9 16.4 22.5
College or above 31.8 31.8 49.4
Middle
Special Needs Designated 11.0 8.9 10.5
Limited English Proficient 32.3 28.5 8.8
Subsidized Lunch Eligible 81.7 77.1 53.3
Ethnicity
Asian 6.6 4.1 10.2
Latino 76.5 67.0 50.4
African American 9.6 24.7 14.4
White 6.9 15.1 40.4
Other Ethnicity 0.3 0.7 0.2
Parental
Education
Less than HS dip. 10.7 19.1 13.1
High School 26.1 23.9 23.2
College or above 28.5 44.5 58.5
High Special Needs Designated 10.5 6.6 10.1 9.3
Limited English Proficient 33.0 23.9 18.4 12.3
Subsidized Lunch Eligible 76.6 68.3 54.2 63.0
Ethnicity
Asian 5.4 4.2 10.7 20.7
Latino 79.5 65.0 55.5 62.1
African American 9.2 16.8 14.5 12.4
White 5.5 14.5 21.5 2.0
Other Ethnicity 0.3 0.1 0.5 2.8
Parental
Education
Less than HS dip. 8.6 16.2 14.0 16.3
High School 25.2 29.7 18.8 17.0
College or above 24.5 37.7 44.6 34.4
* ESBMM schools with complete data began in 2009-2010, which becomes their baseline year. December 14, 2015 update for Los Angeles distribution.
Table 2. Sample counts and mean standardized test scores for student in the baseline year,
2007-08
Dataset Variables Traditional
Public
Charter School ESBMM*
Start-up Conversion
Elementary
n students 48,051 2,267 1,818
n schools 435 46 16
ELA -0.04 0.10 0.30
Math -0.04 0.17 0.28
Middle
n students 45,040 3,479 856
n schools 109 40 4
ELA -0.04 0.24 0.80
Math -0.03 0.16 0.74
High
n students 49,171 4,697 3,999 1,099
n schools 60 42 10 2
ELA -0.04 0.36 0.74 -0.06
* ESBMM schools with complete data began in 2009-2010, which becomes their baseline year.
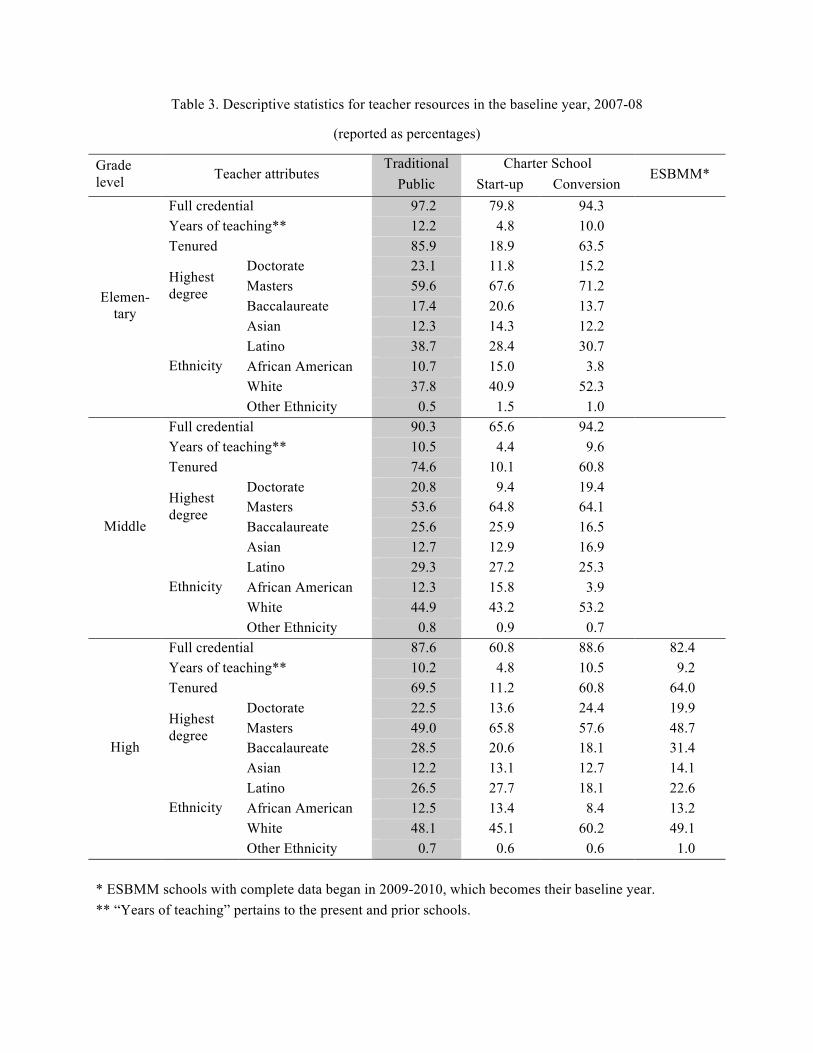
Table 3. Descriptive statistics for teacher resources in the baseline year, 2007-08
(reported as percentages)
Grade level Teacher attributes
Traditional Public
Charter School ESBMM*
Start-up Conversion
Elemen-tary
Full credential 97.2 79.8 94.3 Years of teaching** 12.2 4.8 10.0 Tenured 85.9 18.9 63.5
Highest degree
Doctorate 23.1 11.8 15.2 Masters 59.6 67.6 71.2 Baccalaureate 17.4 20.6 13.7
Ethnicity
Asian 12.3 14.3 12.2 Latino 38.7 28.4 30.7 African American 10.7 15.0 3.8 White 37.8 40.9 52.3 Other Ethnicity 0.5 1.5 1.0
Middle
Full credential 90.3 65.6 94.2 Years of teaching** 10.5 4.4 9.6 Tenured 74.6 10.1 60.8
Highest degree
Doctorate 20.8 9.4 19.4 Masters 53.6 64.8 64.1 Baccalaureate 25.6 25.9 16.5
Ethnicity
Asian 12.7 12.9 16.9 Latino 29.3 27.2 25.3 African American 12.3 15.8 3.9 White 44.9 43.2 53.2 Other Ethnicity 0.8 0.9 0.7
High
Full credential 87.6 60.8 88.6 82.4 Years of teaching** 10.2 4.8 10.5 9.2 Tenured 69.5 11.2 60.8 64.0
Highest degree
Doctorate 22.5 13.6 24.4 19.9 Masters 49.0 65.8 57.6 48.7 Baccalaureate 28.5 20.6 18.1 31.4
Ethnicity
Asian 12.2 13.1 12.7 14.1 Latino 26.5 27.7 18.1 22.6 African American 12.5 13.4 8.4 13.2 White 48.1 45.1 60.2 49.1 Other Ethnicity 0.7 0.6 0.6 1.0
* ESBMM schools with complete data began in 2009-2010, which becomes their baseline year. ** “Years of teaching” pertains to the present and prior schools.
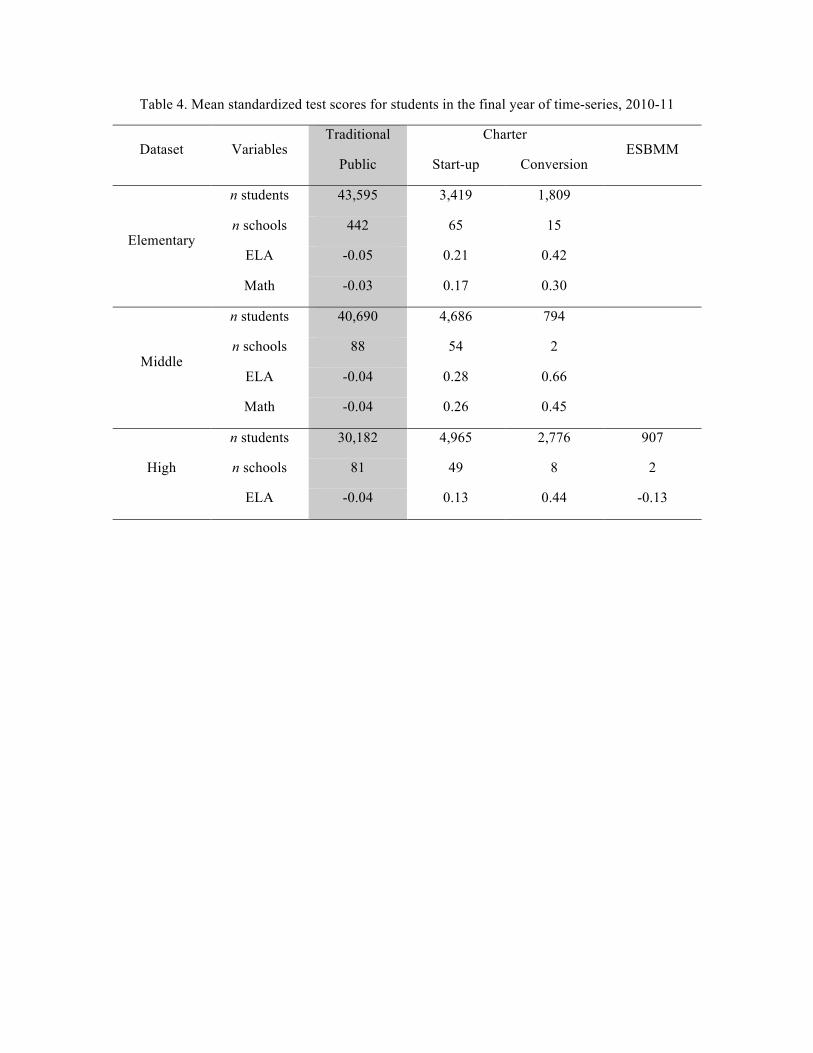
Table 4. Mean standardized test scores for students in the final year of time-series, 2010-11
Dataset Variables Traditional
Public
Charter ESBMM
Start-up Conversion
Elementary
n students 43,595 3,419 1,809
n schools 442 65 15
ELA -0.05 0.21 0.42
Math -0.03 0.17 0.30
Middle
n students 40,690 4,686 794
n schools 88 54 2
ELA -0.04 0.28 0.66
Math -0.04 0.26 0.45
High
n students 30,182 4,965 2,776 907
n schools 81 49 8 2
ELA -0.04 0.13 0.44 -0.13

Table 5. Estimated effects of charter school attendance for “switchers” and “stayers”
Grade level Estimation method
Switchers Stayers ELA Math
N (Tr) ELA Math N
(Tr) Est.
SE Est.
SE Est. SE Est. SE
Elementary
Reg I 0.06
0.06 0.15 * 0.07 158 0.15 *** 0.01 0.07 0.06 2,776 Reg II 0.08
0.08 0.05
0.08 158 -0.70 *** 0.21 -0.12 0.12 2,776
P-match 0.00
0.10 0.18
0.11 158 0.15 *** 0.02 0.06 *** 0.02 2,776 G-match 0.07
0.09 0.19
0.10 158 0.14 *** 0.02 0.07 *** 0.02 2,776
Middle
Reg I 0.15 *** 0.02 0.27 *** 0.02 1,522 0.22 *** 0.04 0.07 0.06 1,002 Reg II 0.05 * 0.02 0.09 *** 0.03 1,522 0.49 *** 0.11 -0.12 0.12 1,002
P-match 0.16 *** 0.02 0.27 *** 0.03 1,522 0.09 0.09 -0.33 *** 0.11 1,002 G-match 0.15 *** 0.02 0.27 *** 0.03 1,522 0.08 0.07 -0.06 0.09 1,002
High
Reg I 0.01
0.02
1,483 -0.07 0.04 392 Reg II -0.06 * 0.03
1,483 -0.05 0.19 392
P-match 0.01
0.02
1,483 -0.10 0.06 392 G-match 0.00
0.02
1,483 -0.03 0.05 392
*** p<0.001, ** p<0.01, * p<0.05

Table 6. Heterogeneous effects of start-up and conversion charter schools for elementary school “switchers”
Start-up charters Conversion charters
ELA Math ELA Math
Est.
SE N (tr) Est.
SE N (tr) Est.
SE N (tr) Est.
SE N (tr)
Reg I 0.12
0.07 122 0.21 * 0.08 122 -0.13
0.12 36 -0.04
0.13 36
Reg II 0.17
0.09 122 0.05
0.10 122 -0.11
0.12 36 0.03
0.14 36
P-match 0.14
0.11 122 0.37 * 0.13 122 -0.16
0.17 36 -0.17
0.19 36
G-match 0.08
0.11 122 0.28 * 0.12 122 -0.05
0.15 36 -0.05
0.15 36
*** p<0.001, ** p<0.01, * p<0.05
Table 7. Heterogeneous effects of start-up and conversion charter schools for middle school “switchers”
Start-up Conversion
ELA Math ELA Math
Est.
SE N (tr) Est.
SE N (tr) Est.
SE N (tr) Est.
SE N (tr)
Reg I 0.15 *** 0.02 947 0.19 *** 0.03 947 0.13 *** 0.03 578 0.36 *** 0.04 576
Reg II 0.04
0.02 947 0.10 *** 0.03 947 0.06 * 0.03 578 0.06
0.04 576
P-match 0.14 *** 0.03 947 0.21 *** 0.03 946 0.13 *** 0.03 578 0.37 *** 0.04 576
G-match 0.16 *** 0.02 947 0.19 *** 0.03 946 0.12 *** 0.03 578 0.38 *** 0.04 576
*** p<0.001, ** p<0.01, * p<0.05
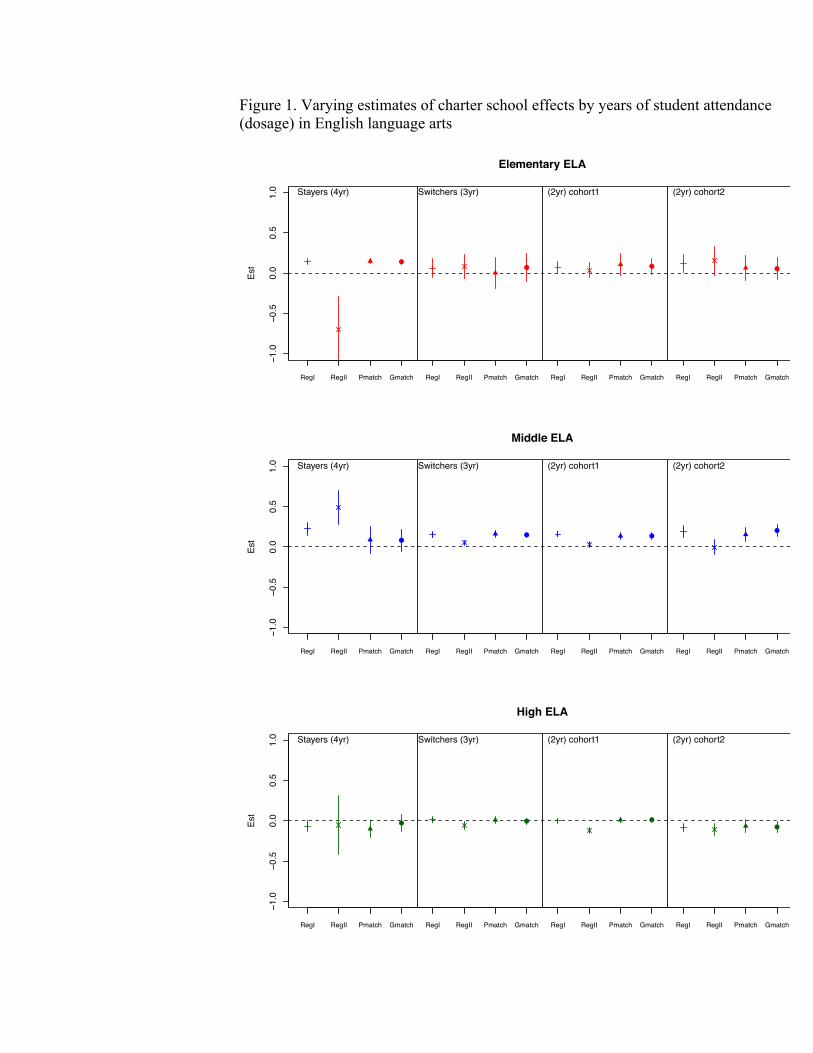
Figure 1. Varying estimates of charter school effects by years of student attendance (dosage) in English language arts
Figure 4 (a). Distribution of charter school effects by dosage for ELA
!
−1.0
−0.5
0.0
0.5
1.0
Elementary ELA
Est
RegI RegII Pmatch Gmatch RegI RegII Pmatch Gmatch RegI RegII Pmatch Gmatch RegI RegII Pmatch Gmatch
!! ! !
Stayers (4yr) Switchers (3yr) (2yr) cohort1 (2yr) cohort2
−1.0
−0.5
0.0
0.5
1.0
Middle ELA
Est
RegI RegII Pmatch Gmatch RegI RegII Pmatch Gmatch RegI RegII Pmatch Gmatch RegI RegII Pmatch Gmatch
!! !
!
Stayers (4yr) Switchers (3yr) (2yr) cohort1 (2yr) cohort2
−1.0
−0.5
0.0
0.5
1.0
High ELA
Est
RegI RegII Pmatch Gmatch RegI RegII Pmatch Gmatch RegI RegII Pmatch Gmatch RegI RegII Pmatch Gmatch
! ! !
!
Stayers (4yr) Switchers (3yr) (2yr) cohort1 (2yr) cohort2

Figure 2. Varying estimates of charter school effects by years of student attendance (dosage) in math
Figure 4 (b). Distribution of charter school effects by dosage for MATH
!
−1.0
−0.5
0.0
0.5
1.0
Elementary MATH
Est
RegI RegII Pmatch Gmatch RegI RegII Pmatch Gmatch RegI RegII Pmatch Gmatch RegI RegII Pmatch Gmatch
!
!
!
!
Stayers (4yr) Switchers (3yr) (2yr) cohort1 (2yr) cohort2
−1.0
−0.5
0.0
0.5
1.0
Middle MATH
Est
RegI RegII Pmatch Gmatch RegI RegII Pmatch Gmatch RegI RegII Pmatch Gmatch RegI RegII Pmatch Gmatch
!
!
!
!
Stayers (4yr) Switchers (3yr) (2yr) cohort1 (2yr) cohort2
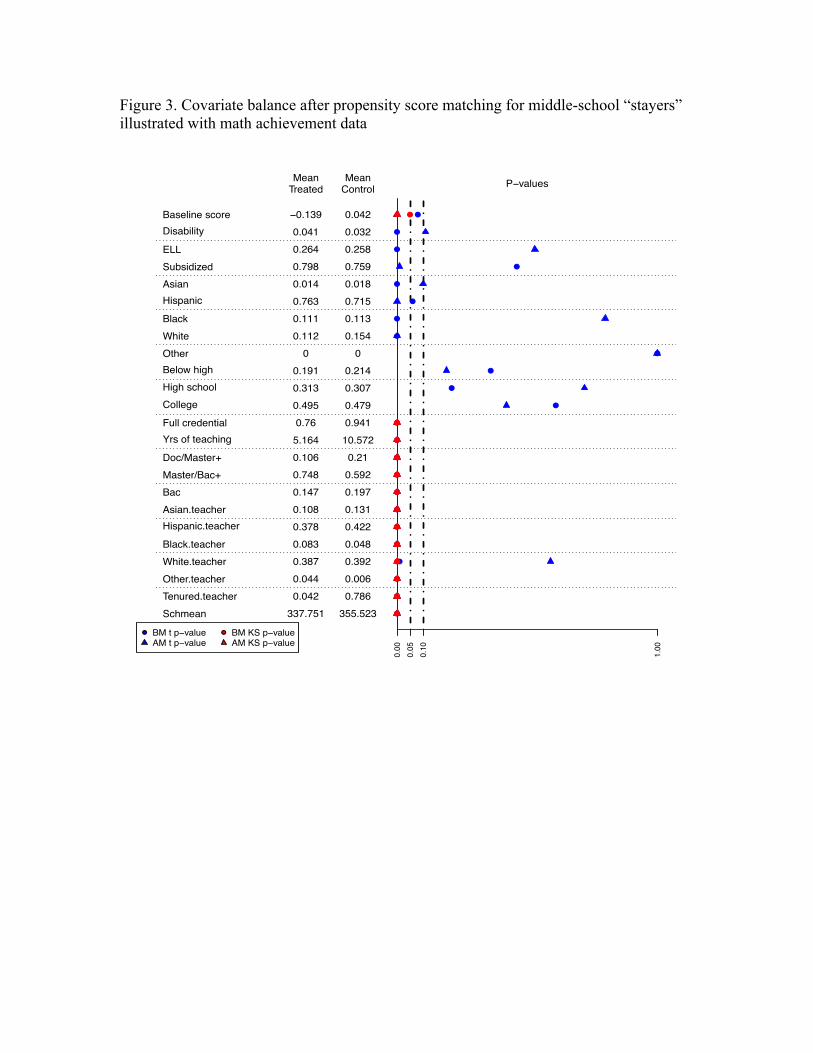
Figure 3. Covariate balance after propensity score matching for middle-school “stayers” illustrated with math achievement data
Figure 1 (a). Covariate balance after propensity score matching for Middle Stayers in MATH
0.00
0.05
0.10
1.00
MeanTreated
MeanControl P−values
!
!
!
!
!
!
!
!
!
!
!
!
!
!
!
!
!
!
!
!
!
!
!
!
!
!
!
!
!
!
!
!
!
!
!
!
!
Baseline score −0.139 0.042Disability 0.041 0.032ELL 0.264 0.258Subsidized 0.798 0.759Asian 0.014 0.018Hispanic 0.763 0.715Black 0.111 0.113White 0.112 0.154Other 0 0Below high 0.191 0.214High school 0.313 0.307College 0.495 0.479Full credential 0.76 0.941Yrs of teaching 5.164 10.572Doc/Master+ 0.106 0.21Master/Bac+ 0.748 0.592Bac 0.147 0.197Asian.teacher 0.108 0.131Hispanic.teacher 0.378 0.422Black.teacher 0.083 0.048White.teacher 0.387 0.392Other.teacher 0.044 0.006Tenured.teacher 0.042 0.786Schmean 337.751 355.523
! !BM t p−valueAM t p−value
BM KS p−valueAM KS p−value
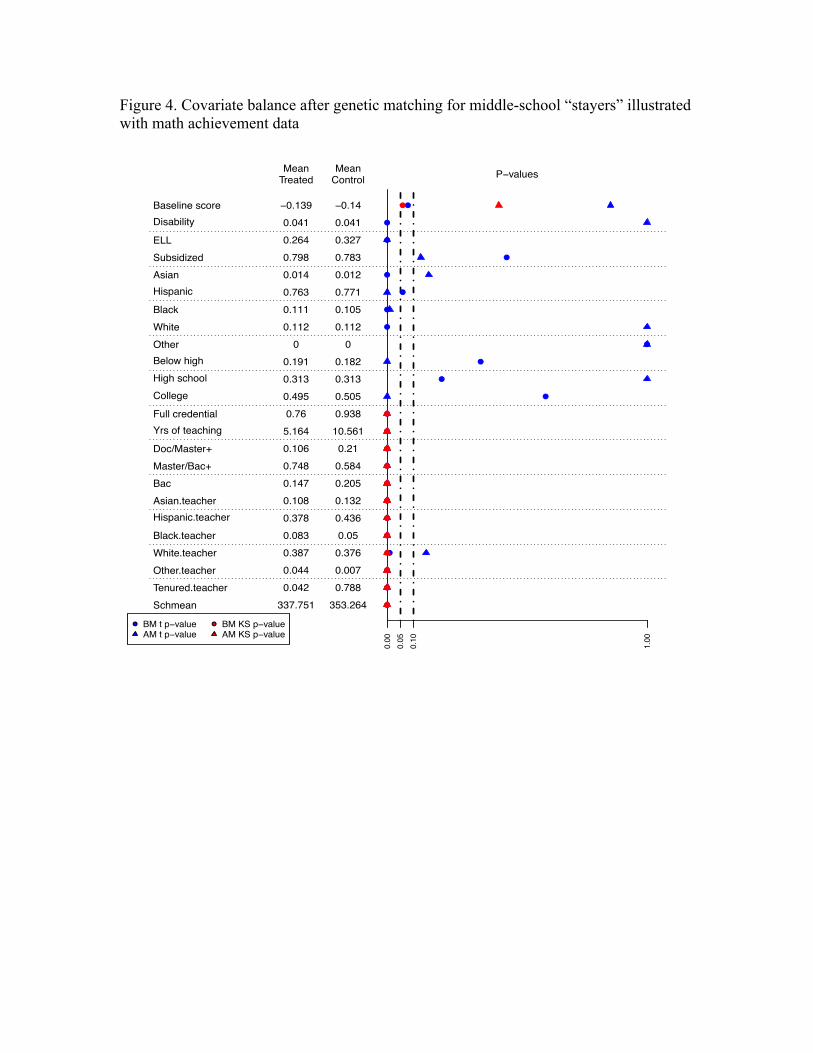
Figure 4. Covariate balance after genetic matching for middle-school “stayers” illustrated with math achievement data
Figure 1 (b). Covariate balance after genetic matching for Middle Stayers in MATH
0.00
0.05
0.10
1.00
MeanTreated
MeanControl P−values
!
!
!
!
!
!
!
!
!
!
!
!
!
!
!
!
!
!
!
!
!
!
!
!
!
!
!
!
!
!
!
!
!
!
!
!
!
Baseline score −0.139 −0.14Disability 0.041 0.041ELL 0.264 0.327Subsidized 0.798 0.783Asian 0.014 0.012Hispanic 0.763 0.771Black 0.111 0.105White 0.112 0.112Other 0 0Below high 0.191 0.182High school 0.313 0.313College 0.495 0.505Full credential 0.76 0.938Yrs of teaching 5.164 10.561Doc/Master+ 0.106 0.21Master/Bac+ 0.748 0.584Bac 0.147 0.205Asian.teacher 0.108 0.132Hispanic.teacher 0.378 0.436Black.teacher 0.083 0.05White.teacher 0.387 0.376Other.teacher 0.044 0.007Tenured.teacher 0.042 0.788Schmean 337.751 353.264
! !BM t p−valueAM t p−value
BM KS p−valueAM KS p−value