differentiation between external and internal cuing: an...
TRANSCRIPT

www.elsevier.com/locate/ynimg
NeuroImage 36 (2007) 396–410Differentiation between external and internal cuing: An fMRI studycomparing tracing with drawing
E. Gowena,⁎ and R.C. Miallb
aFaculty of Life Sciences, Moffat Building, The University of Manchester, P.O. Box 88, Sackville Street, Manchester, M60 1QD, UKbUniversity of Birmingham, United Kingdom
Received 7 December 2006; revised 5 March 2007; accepted 8 March 2007Available online 20 March 2007
Externally cued movement is thought to preferentially involvecerebellar and premotor circuits whereas internally generated move-ment recruits basal ganglia, pre-supplementary motor cortex (pre-SMA) and dorsolateral prefrontal cortex (DLPFC). Tracing anddrawing are exemplar externally and internally guided actions andParkinson's patients and cerebellar patients show deficits in trackingand drawing, respectively. In this study we aimed to examine thisexternal/internal distinction in healthy subjects using functionalimaging. Ten healthy subjects performed tracing and drawing ofsimple geometric shapes using pencil and paper while in a 3-T fMRIscanner. Results indicated that compared to tracing, drawinggenerated greater activation in the right cerebellar crus I, bilateralpre-SMA, right dorsal premotor cortex and right frontal eye field.Tracing did not recruit any additional activation compared to drawingexcept in striate and extrastriate visual areas. Therefore, drawingrecruited areas more frequently associated with cognitively challengingtasks, attention and memory, but basal ganglia and cerebellar activitydid not differentiate tracing from drawing in the hypothesised manner.As our paradigm was of a simple, repetitive and static design, theseresults suggest that the task familiarity and the temporal nature ofvisual feedback in tracking tasks, compared to tracing, may beimportant contributing factors towards the degree of cerebellarinvolvement. Future studies comparing dynamic with static externalcues and visual feedback may clarify the role of the cerebellum andbasal ganglia in the visual guidance of drawing actions.© 2007 Elsevier Inc. All rights reserved.
Introduction
Movement can be initiated in response to external stimuli andcues or through internally driven, self-initiated processes. Differentareas of the brain are thought to be preferentially involved in eachform of movement. Most notably, the basal ganglia have beenproposed to be more important for internally cued and memory-
⁎ Corresponding author.E-mail address: [email protected] (E. Gowen).Available online on ScienceDirect (www.sciencedirect.com).
1053-8119/$ - see front matter © 2007 Elsevier Inc. All rights reserved.doi:10.1016/j.neuroimage.2007.03.005
guided movements (Crawford et al., 1989; Flowers, 1976; Jueptnerand Weiller, 1998; Mushiake and Strick, 1995; Van Donkelaar etal., 1999, 2000), whereas the cerebellum is believed to play a moreprominent role in externally cued movements (Jueptner et al.,1996; Jueptner and Weiller, 1998; Van Donkelaar et al., 1999,2000). In addition, the basal ganglia and cerebellum project tospecific thalamic regions that are also selectively active ininternally driven or externally driven movements, respectively(MacMillan et al., 2004; Vaillancourt et al., 2003; Van Donkelaar etal., 1999, 2000). In turn, those regions within the thalamus that areactive for internally generated movement demonstrate strongerconnections with the dorsolateral prefrontal cortex (DLPFC) andthe pre-supplementary motor area (pre-SMA) (Matelli andLuppino, 1996) both of which are also active during self-initiatedmovement and working memory (Curtis and D’Esposito, 2003;Deiber et al., 1999; Frith et al., 1991; Jahanshahi et al., 1995;Jenkins et al., 1994; Lau et al., 2004; Oliveri et al., 2001). Incontrast, thalamic regions involved in external guidance project tothe dorsal premotor cortex (Matelli and Luppino, 1996; VanDonkelaar et al., 1999) which appears concerned with visuomotorintegration (Wise et al., 1997).
Having emphasised this dissociation, it should be mentionedthat there remains a degree of overlap in the neural circuitrycontrolling externally and internally cued movements. Thecerebellum can function during internally cued movements(Mushiake and Strick, 1993) and the basal ganglia and SMA inexternally cued movements (Jueptner et al., 1997a,b; Vaillancourtet al., 2006, 2003). These findings can be explained by thepresence of specific subcircuits within the cerebellar and basalganglia systems that are specific for each movement type andwhich are superimposed on a background of overlapping functions(Van Donkelaar et al., 1999, 2000). For instance, Jueptner andWeiller (1998) concluded that both the cerebellum and basalganglia are concerned with improvement in motor performance,whereas the basal ganglia are preferentially involved in theselection of appropriate movements and the cerebellum inmonitoring the outcome of movements by comparing with sensoryinputs. Furthermore, activation of DLPFC during self initiatedmovement may be largely due to attention to the selection of action

397E. Gowen, R.C. Miall / NeuroImage 36 (2007) 396–410
rather due to the act of self-initiation per se (Jueptner et al., 1997a;Lau et al., 2004).
This distinction between internally and externally generatedmovements can also be observed following motor dysfunction.Performance during tracking tasks improves for cerebellar patientswhen vision of the target or hand is removed, highlighting theimpaired use of external cues after cerebellar lesions (Van Donkelaarand Lee, 1994). Parkinson’s disease (PD) patients who have adopaminergic deficit affecting the basal ganglia and fronto-striatalnetworks typically display deficits in internally generated move-ments that are improved with the use of external cues (Briand et al.,1999; Crawford et al., 1989; Flowers, 1976; Martin et al., 1994;Morris et al., 1996). PD patients also display graphical impairments,in particular a reduction in pen stroke size for both writing(micrographia) (Van Gemmert et al., 2001) and drawing (Longstaffet al., 2003; Vinter and Gras, 1998) that is alleviated with the use ofexternal cues (Martin et al., 1994; Oliveira et al., 1997). The aim ofour current work was to investigate whether a simple paradigmcomparing tracing against drawing would elicit different areas ofbrain activation involved in externally or internally generatedmovements, respectively, and so provide a potentially usefulbehavioural paradigm in which to explore these issues.
Tracing depends on external cues from the existing template andfrom visual feedback to monitor the pen tip position in relation to therequired line. Drawing on a blank page employs internal cues to agreater extent, guiding the hand to self-selected positions. The use ofvisual or eye position feedback may play a significant role only atcertain key points in the drawing, for example when joining twolines to complete a square or triangle. Consequently, there may begreater eye–hand coupling during tracing that requires detailedcomparison between the template and pen line, and thereforeincreased external guidance of the pen tip. In contrast drawing mayimpose greater demands on memory and planning processes.Therefore we would predict that tracing will result in greateractivation of the cerebellum and premotor cortex, due to increasedexternal guidance whereas drawing will activate areas involved inmemory and internally guided movements such as the basal ganglia,pre-SMA and DLPFC. Furthermore, as tracing may encouragegreater eye–hand coupling due to an increased demand for accuracy(Gowen and Miall, 2006) and the cerebellum is believed to beparticularly involved in tasks that require eye–hand coordination(Miall, 1998; Miall et al., 2000, 2001) this would be a further reasonto expect greater cerebellar activation in the tracing condition.However, it should be noted that the majority of research supportinga cerebellar contribution to eye–hand coordination has employedeye–hand tracking tasks that entail tracking a moving target. Astracing involves a stationary visual template, cerebellar involvementmay differ between the two task types.
Previous behavioural work has demonstrated differencesbetween tracing and drawing eye–hand coordination with andwithout visual cues, suggesting that the two forms of movementrecruit different brain areas. Flanders et al. (2006) compared thekinematics of tracing a seen shape with subsequent drawing frommemory of that shape. They observed highly similar patternsbetween the two tasks but compared to the tracing task, subjectsspent more time in areas of tight curvature during drawing andproposed that this represented a strategy for learning andremembering the shape. Moreover, saccades are smaller and morefrequent during tracing compared to drawing, indicating closercoupling between the eye and hand during tracing (Gowen andMiall, 2006). In addition, during combined eye–hand pointing, the
timing between saccade and hand onset is closer for rememberedas opposed to visual targets (Sailer et al., 2000; Van Donkelaar andStaub, 2000) suggesting that each movement type recruits adifferent neural substrate. These behavioural studies are supportedby imaging data: Jueptner et al. (1996) also aimed to dissociatedrawing and copying, and observed greater activation in thesuperior parietal lobe and cerebellar hemispheres, nuclei andvermis during eye–hand tracking of single lines when comparedwith drawing lines in any freely chosen direction. In the reversecontrast, greater activity was observed in the dorsal and ventralprefrontal cortex. Interestingly, basal ganglia activity did not differbetween the drawing and copying tasks.
Our current work aims to extend these findings in four differentways. Firstly, participants drew well known but specified shapes soreducing the contribution of processes involved in decision making.Secondly, we used a more natural task with pencil and paper, inwhich participants could observe their hand, and thus one which iscloser to conditions under which micrographia is observed. Thirdly,our task involves tracing along a line printed on the page whereasJueptner and colleagues used a task more akin to dynamic eye–handtracking, in which participants tracked the end of a retracting line bymovement of a computer mouse. Fourthly, by contrastingconditions with eye motion, hand motion and both, we haveattempted to dissociate which brain areas are more closelyassociated with eye–hand coordination than during tasks thatinvolve the eye or hand alone. Consequently, we employed fMRI toexamine which areas of the brain are differentially activated duringtracing compared to drawing and whether these areas reflect thedistinction between externally and internally guided movements.We hypothesised that the tracing vs. drawing paradigm woulddifferentially activate cortico-cerebellar and cortico-basal gangliapathways, respectively, providing a useful tool to further investigatediseases such as PD where graphical tasks are impaired.
Materials and methods
Participants
We tested 10 healthy volunteers (5 females) whose average agewas 22.2 years (range, 18–31). All were right handed and had noprevious or current history of neurological or ocular disease orgeneral health problems. Each gave written informed consent toparticipate and the study was approved by a local ethical committee.
Task stimuli
Subjects were required to trace around or draw three differentshapes (square, circle, triangle) that were presented on a hand heldbooklet. The circumference of the square, circle and triangle were24 cm, 18.85 cm and 18 cm, respectively. Each page on the bookletcontained four shapes (hence one shape was repeated, inrandomized order) and an instruction that indicated which ofseven conditions should be performed (Fig. 1).
There were three tracing conditions (Fig. 1a):
Eye–hand tracing – tracing the outline of the printed shapesusing both eyes and hand i.e. in the usual mannerEye tracing – tracing the outline of shapes with eyes onlyHand tracing – tracing the outline of shapes with the hand onlywhile the eyes were fixed on letter in centre of shape

Fig. 1. Examples of the 7 different conditions used in the experiment. The instruction is situated in the top left. Each condition represents one block and each wasperformed a total of 10 times, except the baseline condition that was performed 20 times. They were presented in the form of a booklet.
398 E. Gowen, R.C. Miall / NeuroImage 36 (2007) 396–410
For the drawing conditions, the shapes were omitted from thepage and instead the first letter of each shape name (S, C, T)appeared on the sheet and prompted the subjects to draw the shapesaround this letter (Fig. 1b):
Eye–hand drawing – drawing the outline of shapes in the usualmanner i.e. using both eyes and handEye drawing – moving the eyes to shift gaze around the path ofthe specified shapesHand drawing – drawing the specified shapes with the handonly (while the eyes were fixed on the instructing letter)
The final conditionwas baseline – fixating a central cross (Fig. 1c).In both hand tracing and hand drawing conditions the
instructing letters also served as the fixation point. The order ofshapes in the booklet and the order of the tasks were counter-balanced across subjects. Therefore, there were six activeconditions and one passive baseline condition. The three mainfactors in our design were task (tracing vs. drawing, method (eyevs. hand) and coordination (independent vs. coordinated).
Experimental task
Each participant completed a safety screening form and wasprovided with the task instructions. A 20-min laboratory-basedtraining phase was given prior to the experiment in order tofamiliarise the subjects with the different instructions and timings ofthe blocks and to verify that eye movements were performed inaccordance with each condition. Subjects were then placed in thescanner with the booklet held in their left hand, comfortably restingon a pillow across their body, and with a pencil in their right hand.
Subjects could view the booklet and their hand and pencil through aforward-facing, non-inverting mirror. Each block lasted 18 s andconsisted of one of the seven conditions. Subjects were trained andinstructed to perform the tracing or drawing task throughout each 18-s block and, if they finished the last shape prematurely, to return andredraw the first shape, reducing speed on subsequent blocks. Inparticular, they were instructed to deliberately and slowly move theireyes in the eye-only conditions. For the tracing task, they wereinstructed to trace the lines to their best ability, while in the drawingtask they were instructed to reproduce accurate representations of theshapes that were of the same size as during the tracing task.Participants were not informed how to move their arm during theexperiment but due to space restraints and instructions against largearm movements, movement was limited to the forearm, wrist anddigits. Blocks were separated by 6-s periods where the subject turnedthe page ready for the next block. Altering the ambient light in thescanner with a data projector cued the subjects as to when theyshould turn the page: white=18-s test condition, blue=6-s pageturning. Timing was controlled by Presentation (NeurobehavioralSystems) and was synchronized to the EPI volumes.
One run consisted of one repetition of each of the 7 conditions,except the baseline condition which was presented twice. Eachsubject performed 10 runs, separated into two 15-min scanningsessions of 5 runs each, giving a total of 80 blocks. The sessionswere performed sequentially; a short 2-min break allowed a newbooklet to be given to the subject.
Functional imaging and analysis
For each subject 320 T2*-weighted fast echo-planar imageswere acquired in each 15-min session using a 3 T Philips scanner

Table 1Mean pencil pathlengths and % of trials where participants finished all fourshapes and returned to the first shape for 4 different conditions
Mean pathlength±SD,cm (target=21 cm)
% of restarttrials
Hand trace 20.35±2.73 0.00Eye–hand trace 21.025±2.67 0.02Hand draw 17.525±2.12 0.06Eye–hand draw 17.6±2.54 0.04
Pathlengths were calculated for the square and triangle only; the mean lengthof the printed templates was 21 cm.
Fig. 2. Graph depicting the % of trials where subjects completed 1–5 shapesacross the four conditions of hand trace, eye–hand trace, hand draw andeye–hand draw. Shape 5 refers to recommencing at the beginning of the padand re-drawing shape 1.
399E. Gowen, R.C. Miall / NeuroImage 36 (2007) 396–410
with an 8-channel parallel head coil and SENSE factor of 2.0(TE=35ms, flip angle=85°, TR=3.0 s). Forty-nine interleaved slicesprovided whole brain coverage (acquisition matrix 96×96, FOV=240×240×147 mm) with each voxel subtending 2.5×2.5×3 mm.Four dummy volumes preceded each of the two scanning sessions.High-resolution T1-weighted images were also acquired with1×1×1 mm voxel size, 175 slices in sagittal orientation.
fMRI processing and analysis
All fMRI signal processing and analysis was performed using theFMRIB software library (FSL version 5; FMRIB, Oxford). The initialfour dummy volumes of each functional data collection run werediscarded prior to analysis to ensure T1 saturation had been achieved.Prior to processing, slice timingwas corrected and the volumes in eachrun were motion-corrected and realigned to the middle volume of therun using MCFLIRT. Maximum within scan head motion was lessthan 1.07 mm, and averaged 0.7 mm across the group. The BOLDsignals were then high-pass filtered with a 48 s Gaussian-weightedfilter, and spatially filtered with a 5 mm FWHM kernel.
Explanatory variables associated with each of the 6 activeconditions were convolved with a gamma-derived haemodynamicresponse function (standard deviation of 3 s, mean lag of 6 s). Thebaseline fixation condition was not entered into the model so that allactivation levels were calculated relative to this unmodeled condition.Epochs associated with page turning were entered into the GLM as acovariate of no interest. An additional variable was also included tomodel any blocks in which the subject failed to perform the correcttask. Additionally, the motion correction parameters calculated byMCFLIRTwere entered into the model as six covariates of no interest,without convolution by the HRF, and orthogonalized with respect toone another. Within each individual functional run, contrasts testingthe factorial combination of the three main factors (task, method, andcoordination) and their interactions were calculated.
At the second level of the analysis, contrasts were combined foreach participant from the first-level analysis of the two functionalimaging runs with a mixed effects treatment of the variance (FLAMEstage 1 processing). The third level of the analysis combined thesecond level output across all participants (full FLAME processing).Voxels were initially thresholded at a Z-score value of 2.6 (equivalentto a p of .005, one-tailed), and then subjected to a cluster thresholdwith a significance level of p< .05.
Clusters of significant activity found from the group analysis wereidentified anatomically using comparisons between the 3dmrx(MRIcro) voxel labelled Brodmann atlas, an atlas for generalneuroanatomical reference (Duvernoy and Bourgouin, 1999) andone for localisation within the cerebellum (Schmahmann et al., 2000).From the group average signal, a localmaximawithin these areaswere
compared across the 6 different active conditions using the Featquerytool (FMRIB, Oxford). Target voxels were identified as those ofhighest statistical significance observed in the specific group contrastsbetween conditions, or of individual conditions against baseline;Featquery then inverts the transformation used to register eachindividual’s brain into the MNI standard space in order to locate thevoxel in the individual brain corresponding to the target.
Results
Behavioural analysis
The average pathlength of the pencil motion for the reproducedshapes (square and triangle only) over the different conditions areshown in Table 1, column 1, measured directly off the paper. Abetween subject ANOVA with factors of drawing method (trace/draw) and degree of eye–hand coordination (eye–hand/hand)revealed a significant main effect of drawing method: shapes weresmaller when drawn, as opposed to traced [F(1,76)=29.24,p<0.0001]. As an indication of the time taken to complete thedrawing tasks, we calculated the % of completed shapes in eachcondition. Accurate timing would result in the initiation of lessthan 5 shapes (the 5th refers to re-drawing of the first shape), andthe completion of more than 3. Subjects appeared well timed asthey completed either three or four shapes (Fig. 2) and were foundto re-trace or re-draw the first shape on less than 0.06% of all trials(Table 1, column 2). However, both hand drawing and eye–handdrawing were performed at a faster speed than the equivalenttracing conditions. These results are similar to our previousfindings where subjects produced smaller and quicker drawings asopposed to tracings (Gowen and Miall, 2006).
Functional activation
Our main comparisons of interest were between tracing anddrawing tasks, and between tasks that involved independent use of

Table 2Areas activated during eye–hand tracing – baseline (top section) and during eye–hand drawing – baseline (bottom section)
Area Cluster volume(mm3)
Cluster P Z Laterality Coordinates (mm)
x y z
Eye–hand trace – baselineCerebellar vermis VI 562.30 <0.0001 9.18 R 4 −62 −16Cerebellar vermis VIII 9.16 R 2 −74 −36Dorsal premotor cortex (BA 6) 7.49 L −26 −18 58Primary motor cortex (BA 4) 7.34 L −34 −28 62Superior temporal pole (BA 38/22) 9.7 0.03 5.03 R 52 6 −2Inferior frontal operculum (BA 48) 4.62 R 48 −2 2
Eye–hand draw – baselineCerebellar vermis VI 667.7 <0.0001 9.77 R 4 −62 −16Cerebellar vermis VIII 8.82 R 4 −72 −38Dorsal premotor cortex (BA 6) 8.9 L −28 −26 70Precuneus /Superior parietal lobe 8.73 R 12 −64 −50Supplementary motor area 8.51 L −4 −22 48Somatosensory area (BA 3) 7.85 L −36 −30 50Primary motor cortex (BA 4) 7.76 L −34 −28 62
400 E. Gowen, R.C. Miall / NeuroImage 36 (2007) 396–410
the eye and hand (eye trace/draw, hand trace/draw) versus thosetasks that employed coordinated use of the eye and hand (eye–handtrace/draw). In order to compare our data with previous work andto identify whether tracing and drawing provide a suitableparadigm in which to dissociate BG and cerebellar networks wehave also included contrasts detailing both eye–hand tracing anddrawing against baseline. Similarly, in order to verify that ourparadigm was sensitive to the differences between the two drawingconditions we have also included a comparison of eye only vs.hand only tasks.
Eye–hand tracing and drawing – baseline
The contrast between eye–hand tracing and baseline revealedsignificant activation in the cerebellar vermis VI and VIII, the rightsuperior temporal pole and the right inferior frontal operculum(Table 2). Unexpectedly, the contrast between eye–hand drawing
Table 3Areas more activated during eye conditions (eye trace/draw) than during hand con
Area Cluster volume(mm3)
Cluster
All eye conditions – all hand conditionsPrimary visual cortex (BA 17) 251.7 <0.000Extrastriate visual cortex (BA 18)Orbitofrontal cortex (BA 10) a 150.17 <0.000Ventral prefrontal cortex (BA 45) a
Ventral premotor cortex (BA 6)Dorsal lateral prefrontal cortex (BA 46) a
Inferior parietal (BA 40) a 45.56 <0.000Inferior parietal (BA 39) a
Dorsal premotor cortex (BA 6) 29.47 <0.000FEF (BA 8)Superior temporal sulcus (BA 22) a 20.53 0.001Middle temporal gyrus (BA 21) a
Putamen a
a Areas where apparent activation is due to relative deactivation in hand conditi
and baseline revealed similar activation in the cerebellar vermis VIand VIII, with the addition of the left Supplementary motor areaand right superior parietal lobe/precuneus (Table 2). Significant BGactivation was absent in both contrasts indicating that our tracing/drawing paradigm does not provide clearly differentiated BGactivity.
Eye vs. handWe next contrasted all eye-alone conditions (eye trace and eye
draw, without hand motion) against hand-alone conditions (handtrace and hand draw, with eye fixation). For the eye tasks, activitywas greater in left visual areas (BA 17, 18), left DLPFC (BA 46),left orbitofrontal cortex (BA 10), left ventral prefrontal cortex (BA45), left ventral and dorsal premotor cortex (PMv, PMd) (BA 6),left inferior parietal (BA 39, 40), right FEF, right superior temporalsulcus (BA 22), right middle temporal gyrus (BA 21) and rightputamen (Table 3). However, all areas of activation with the
ditions (hand trace/draw)
P Z Laterality Coordinates (mm)
x y z
1 10.6 L −10 −80 1010.3 L −8 −92 12
1 7.03 L −44 52 106.5 L −52 36 186.46 L −58 14 105.97 L −44 40 26
1 8.48 L −62 −50 445.96 L −44 −68 30
1 6.46 R 50 8 405.87 R 46 −12 467.11 R 60 −30 85.98 R 56 −22 −24.22 R 26 14 0
ons.
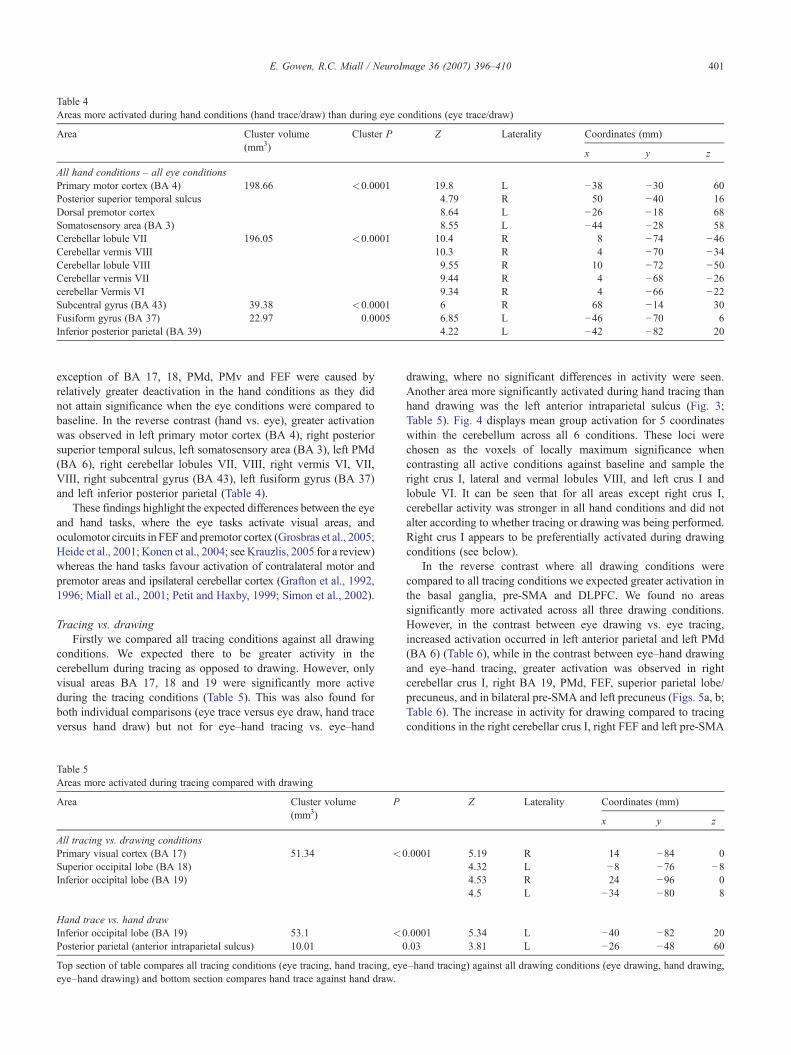
Table 4Areas more activated during hand conditions (hand trace/draw) than during eye conditions (eye trace/draw)
Area Cluster volume(mm3)
Cluster P Z Laterality Coordinates (mm)
x y z
All hand conditions – all eye conditionsPrimary motor cortex (BA 4) 198.66 <0.0001 19.8 L −38 −30 60Posterior superior temporal sulcus 4.79 R 50 −40 16Dorsal premotor cortex 8.64 L −26 −18 68Somatosensory area (BA 3) 8.55 L −44 −28 58Cerebellar lobule VII 196.05 <0.0001 10.4 R 8 −74 −46Cerebellar vermis VIII 10.3 R 4 −70 −34Cerebellar lobule VIII 9.55 R 10 −72 −50Cerebellar vermis VII 9.44 R 4 −68 −26cerebellar Vermis VI 9.34 R 4 −66 −22Subcentral gyrus (BA 43) 39.38 <0.0001 6 R 68 −14 30Fusiform gyrus (BA 37) 22.97 0.0005 6.85 L −46 −70 6Inferior posterior parietal (BA 39) 4.22 L −42 −82 20
401E. Gowen, R.C. Miall / NeuroImage 36 (2007) 396–410
exception of BA 17, 18, PMd, PMv and FEF were caused byrelatively greater deactivation in the hand conditions as they didnot attain significance when the eye conditions were compared tobaseline. In the reverse contrast (hand vs. eye), greater activationwas observed in left primary motor cortex (BA 4), right posteriorsuperior temporal sulcus, left somatosensory area (BA 3), left PMd(BA 6), right cerebellar lobules VII, VIII, right vermis VI, VII,VIII, right subcentral gyrus (BA 43), left fusiform gyrus (BA 37)and left inferior posterior parietal (Table 4).
These findings highlight the expected differences between the eyeand hand tasks, where the eye tasks activate visual areas, andoculomotor circuits in FEF and premotor cortex (Grosbras et al., 2005;Heide et al., 2001; Konen et al., 2004; see Krauzlis, 2005 for a review)whereas the hand tasks favour activation of contralateral motor andpremotor areas and ipsilateral cerebellar cortex (Grafton et al., 1992,1996; Miall et al., 2001; Petit and Haxby, 1999; Simon et al., 2002).
Tracing vs. drawingFirstly we compared all tracing conditions against all drawing
conditions. We expected there to be greater activity in thecerebellum during tracing as opposed to drawing. However, onlyvisual areas BA 17, 18 and 19 were significantly more activeduring the tracing conditions (Table 5). This was also found forboth individual comparisons (eye trace versus eye draw, hand traceversus hand draw) but not for eye–hand tracing vs. eye–hand
Table 5Areas more activated during tracing compared with drawing
Area Cluster volume(mm3)
P
All tracing vs. drawing conditionsPrimary visual cortex (BA 17) 51.34 <0Superior occipital lobe (BA 18)Inferior occipital lobe (BA 19)
Hand trace vs. hand drawInferior occipital lobe (BA 19) 53.1 <0Posterior parietal (anterior intraparietal sulcus) 10.01 0
Top section of table compares all tracing conditions (eye tracing, hand tracing, eyeeye–hand drawing) and bottom section compares hand trace against hand draw.
drawing, where no significant differences in activity were seen.Another area more significantly activated during hand tracing thanhand drawing was the left anterior intraparietal sulcus (Fig. 3;Table 5). Fig. 4 displays mean group activation for 5 coordinateswithin the cerebellum across all 6 conditions. These loci werechosen as the voxels of locally maximum significance whencontrasting all active conditions against baseline and sample theright crus I, lateral and vermal lobules VIII, and left crus I andlobule VI. It can be seen that for all areas except right crus I,cerebellar activity was stronger in all hand conditions and did notalter according to whether tracing or drawing was being performed.Right crus I appears to be preferentially activated during drawingconditions (see below).
In the reverse contrast where all drawing conditions werecompared to all tracing conditions we expected greater activation inthe basal ganglia, pre-SMA and DLPFC. We found no areassignificantly more activated across all three drawing conditions.However, in the contrast between eye drawing vs. eye tracing,increased activation occurred in left anterior parietal and left PMd(BA 6) (Table 6), while in the contrast between eye–hand drawingand eye–hand tracing, greater activation was observed in rightcerebellar crus I, right BA 19, PMd, FEF, superior parietal lobe/precuneus, and in bilateral pre-SMA and left precuneus (Figs. 5a, b;Table 6). The increase in activity for drawing compared to tracingconditions in the right cerebellar crus I, right FEF and left pre-SMA
Z Laterality Coordinates (mm)
x y z
.0001 5.19 R 14 −84 04.32 L −8 −76 −84.53 R 24 −96 04.5 L −34 −80 8
.0001 5.34 L −40 −82 20
.03 3.81 L −26 −48 60
–hand tracing) against all drawing conditions (eye drawing, hand drawing,

Fig. 3. Activation map detailing areas of greater activity during hand tracingcompared to hand drawing based on group data. Figure shows BA 19 andanterior intraparietal sulcus (IPS). Coordinates in MNI space are centredaround the voxel of peak significance (x=−26, y=−48, z=60). Colour barsindicate Z-score significance level, from the lowest score of 2.6 (red) to thehighest score of >10.0 (yellow).
402 E. Gowen, R.C. Miall / NeuroImage 36 (2007) 396–410
can be observed in Figs. 4b and 6a–b, respectively. It is interestingto note that activity in the right cerebellar crus 1 (Fig. 4b), FEF (Fig.6a) and pre-SMA (Fig. 6b) actually decreased during the eye–handtracing condition. No areas of the basal ganglia showed greateractivation for the drawing as opposed to the tracing conditions.Moreover, activation was low in all areas of the BG, asdemonstrated in Fig. 6c for the right putamen.
Eye–hand coordinationWe expected more cerebellar activity in the conditions that
involved using both the eye and hand to trace or draw (coordinatedconditions) in contrast to those conditions where only the eye orhand were tracing or drawing (independent conditions). However,in the comparison between independent tracing (eye-trace, hand-trace) and combined tracing (eye–hand tracing), greater activationwas observed in prefrontal areas (right and left BA 46 and right BA47), as well as right superior temporal lobe (BA 22), right posteriorIPS (BA 39), right BA 18 and the left cerebellum crus I (Table 7,top section). It can be observed from Figs. 4a and 7a that activationappeared greater in the left cerebellum and right DLPFC becausethese areas displayed deactivation in the combined eye–handconditions, which was also the case for all the aforementionedareas. When compared against baseline, none of these areas weresignificantly activated. In the contrast examining coordinatedtracing vs. independent tracing, differential activation was notapparent at any location. We observed greater activation in the leftpre-SMA, right and left prefrontal areas (BA 9), right anteriorcingulate sulcus and left DLPFC (BA 46) when comparingindependent drawing to combined drawing (Figs. 7a–b and 8a–b).Although these areas exhibited deactivation in the combined eye–hand condition, they showed significant activation when theindependent conditions were compared to baseline. No significantactivations occurred in the reverse contrast of combined drawing
vs. independent drawing. Cerebellar activity appeared to dependmore on whether the hand was used in the task than whether theeye and hand were used in combination (Figs. 4a, c–e).
SummaryOverall, the tracing conditions recruited visual areas (BA 17, 19)
to a greater extent than drawing conditions, but did not preferentiallyinvolve the cerebellum or PMd cortex. In contrast, drawing tasksrecruited the right cerebellar crus I, right and left pre-SMA, rightdorsal premotor cortex, right FEF, left precuneus and right superiorparietal lobes/precuneus but did not preferentially activate the basalganglia. Finally, in comparison to the independent conditions, eye–hand coordination during tracing or drawing did not preferentiallyactivate any areas, including the cerebellum. Conversely, greateractivation occurred in left pre-SMA, right and left BA 9, anteriorcingulate sulcus and left DLPFC during independent drawing thancombined drawing. Consequently, although our data do indicate thatdrawing activates a different set of neural areas to tracing, we foundno evidence to suggest that the basal ganglia are more concernedwith drawing or that the cerebellum is with tracing. Finally, theapparent deactivation in right FEF, pre-SMA and right cerebellarcrus 1 during the eye–hand tracing task when compared to baselinesuggests that combined eye–hand tracing leads to less involvementof these areas than any other task, including fixating a cross.
Discussion
We examinedwhether the everyday eye and hand task of tracing ordrawing shapes on paper would elicit different areas of brainactivation that are involved in external compared with internalguidance of movement, respectively. In particular, we expected thecerebellum and premotor cortex to show more activation duringtracing, and the basal ganglia, pre-SMAandDLPFC to bemore activeduring drawing. When compared to baseline, our tasks showedactivation similar to that reported in previous drawing type paradigms,namely in dorsal premotor, superior parietal and cerebellar regions(Lewis et al., 2003; Jueptner et al., 1996; van Mier et al., 1998).Although we found evidence that drawing and tracing do recruitdifferent brain areas, cerebellar and basal ganglia activity was notmodulated in the expected manner by either task. Indeed, the initialcontrasts of eye–hand tracing/drawing – baseline demonstrate highlysimilar cerebellar activation in both tasks and no significant BGactivity in the drawing task. Our main findings can be summarised asfollows: (1) With the exception of visual areas, tracing did not recruitany additional brain areas compared to drawing and actually resultedin deactivation in the FEF, pre-SMA and right cerebellar crus I whencompared to baseline. (2) Compared to tracing, drawing recruitedgreater activation of right cerebellar crus I, pre-SMA, PMd, rightsuperior parietal/precuneus and left precuneus. (3) Coordinated eye–hand conditions did not activate any areas nor recruit additional areasmore than in independent conditions, whereas the independent eyeand hand conditions displayed greater activation in pre-SMA andprefrontal areas (BA 9, 46). We will address each of these findings inthe following paragraphs.
Comparison between tracing and drawing
Tracing tasksThe only areas to be more active in the tracing as opposed to
drawing conditions were those striate and extrastriate areasconcerned with visual processing (BA 17, 18, 19), and the anterior

Fig. 4. Percentage BOLD response of (a) left cerebellar crus I, (b) right cerebellar crus I, (c) left cerebellar lobule VI, (d) right cerebellar lobule VIII, and (e)cerebellar vermis VIII across the 6 conditions. Asterisk denotes significant difference between conditions (P<0.001). Standard error bars are shown.Coordinates are in mm.
403E. Gowen, R.C. Miall / NeuroImage 36 (2007) 396–410
IPS which was more active during hand tracing than hand drawing.The increased visual activity coincides with the processing of thedisplayed visual templates, and the IPS is frequently activated intasks that involve manual movements (Astafiev et al., 2003;Binkofski et al., 1998; Desouza et al., 2000; Macaluso et al., 2003;Simon et al., 2002). Interestingly, anterior IPS appears moreconcerned with fine motor movements rather than general reachingtasks (Binkofski et al., 1998; Simon et al., 2002) which couldreflect the need for high spatial accuracy of the pen with respect tothe template in hand tracing compared to drawing, where there isless requirement for positional accuracy. Furthermore, the anteriorIPS is involved in attentive tracking of targets while fixating(Culham et al., 1998) and in visual selection processing (Wojciulikand Kanwisher, 1999), indicating that activity of this area in handtracing may be due to the increased requirement for covertmonitoring and visual selection of the pen tip seen in peripheralvision while maintaining central fixation, in order to compare itstrajectory with the template.
The absence of increased cerebellar activity during tracing wasunexpected as the cerebellum is thought to be involved in
combining external sensory cues with action (Jueptner et al.,1996; Jueptner and Weiller, 1998; Van Donkelaar et al., 1999,2000). A proposed function of the cerebellum is to overcomesensory feedback delays by producing a predictive estimate of thesensory outcome of movement which can then be compared to theexternal goal (Kawato et al., 2003; Miall et al., 1993; Miall andWolpert, 1996; Wolpert et al., 1998). This enables planning errorsto be rectified faster than if using visual feedback alone, so creatinga smoother, more accurate movement. In a similar task to ours,Jueptner et al. (1996) did find greater activity in the left cerebellarhemispheres, nuclei and vermis when subjects tracked a line with amouse cursor compared with drawing new lines. However, theirtask involved tracking a moving target, whereas our task consistedof tracing a stationary template. Several other paradigms have alsoexplored cerebellar activity during visually guided tracking ofmoving targets in healthy participants (Vaillancourt et al., 2003)and in cases of cerebellar damage or deactivation (Miall et al.,1987; Van Donkelaar and Lee, 1994). In such a tracking task,continual comparison between the moving target and the cursorplaces more timing and predictive demands on the ocular and

Table 6Areas more active during eye drawing than eye tracing
Area Cluster volume(mm3)
P Z Laterality Coordinates (mm)
x y z
Eye drawing vs. eye tracingAnterior parietal area (BA 3) 11.45 0.01 4.05 L −60 −10 40Dorsal premotor cortex (BA 6) 3.96 L −54 −2 42
Eye–hand drawing vs. eye–hand tracingCerebellum crus I 31.11 <0.0001 5.58 R 50 −64 −32Inferior occipital lobe (BA 19) 5.33 R 42 −72 −14Pre-supplementary motor area (BA 6) 30.38 <0.0001 5.26 L −2 14 48
4.4 R 8 12 44Dorsal premotor cortex (BA 6) 4.45 R 22 −2 54FEF (BA 8) 4.45 R 22 −2 54Precuneus 10.54 0.01 4.36 L −6 −70 58Precuneus /Superior parietal lobe 4.25 R 18 −76 50Superior occipital lobe (BA 18) 3.78 R 22 −72 32
Top section of table shows areas more active during eye drawing than eye tracing and bottom section those areas more active during eye–hand drawing than eye–hand tracing.
404 E. Gowen, R.C. Miall / NeuroImage 36 (2007) 396–410
manual control systems and therefore perhaps, greater cerebellarinvolvement. Although we did not directly compare tracking withtracing we speculate that as our task used shapes that were familiar,static and frequently repeated this could have reduced the subjects’dependence on the external template and removed the temporalconstraint of tracing at a specific rate. Activity within thecerebellum has been shown to decrease with increasing taskfamiliarity (van Mier et al., 1998). In regard to the static nature ofour tracing templates, different modes of control are apparent forstatic as opposed to dynamic tracking, as cerebellar patients showdeficits for the latter but not the former (Van Donkelaar and Lee,1994). In addition saccadic errors produced by cerebellar patientsappear less apparent during pointing then tracking tasks (Sailer etal., 2005). These authors suggested that compared to tracking,pointing tasks involve less integration of proprioceptive handinformation with visual input. Furthermore, cerebellar activity isreduced during conditions where visual feedback frequency is low,suggesting that the temporal frequency of visual feedback affectsthe manner is which external stimuli are processed (Vaillancourt etal., 2006). If more complex and unfamiliar shapes had been used,with greater emphasis placed on accuracy we may have seen anincrease in cerebellar activity. The observation that, compared tobaseline, tracing actually resulted in a decrease in activity in theFEF, pre-SMA and right cerebellar crus I indicates that demand onthese areas was minimal.
Drawing tasksIn our comparison between drawing and tracing, greater
activation was observed in the bilateral pre-SMA and PMd, rightFEF and precuneus/superior parietal cortex, left precuneus and rightcerebellar crus I. Whereas SMA-proper is more involved inmovement execution, pre-SMA appears to be consistently activatedduring more cognitively demanding tasks such as those that involvemovement preparation, self-generation and planning and memoris-ing sequences of movements (Curtis and D’Esposito, 2003; Deiberet al., 1999; Heide et al., 2001; Grosbras et al., 2001; Jueptner et al.,1996; Lau et al., 2004; Lee et al., 1999; Ogawa et al., 2006; Picardand Strick, 1996, 2001) indicating that this area does distinguishbetween the internal vs. external nature of drawing and tracing.
The FEFs appear to be involved in preparing eye movements(Connolly et al., 2002), in covert attention shifting (Grosbras andPaus, 2002; Moore and Fallah, 2001, 2004; Smith et al., 2005;Thompson et al., 2005) and in producing memory-guided saccades(Gaymard et al., 1999; Muggleton et al., 2003; Ozyurt et al.,2006). Therefore, increased FEF activity observed during drawingmay have been due to greater planning and attention demandsinvolved in producing saccades to an undefined, internally chosengoal. This is reflected in behavioural data where saccades arelarger and less frequent during drawing than tracing (Gowen andMiall, 2006).
The PMd was also more active during drawing than tracing.PMd is composed of two main sections: a caudal section (PMdc orPMd proper) and a rostral section (PMdr or pre-PMd) (Boussaoud,2001; Picard and Strick, 2001). PMdc is concerned with handmovement preparation and execution (self-paced finger movement,object manipulation), whereas PMdr plays a greater role in morecognitively demanding tasks (imagined finger movement, spatialattention shifting, memory, mental calculations) and eye move-ments (Battaglia-Mayer et al., 2001; Boussaoud, 2001; Fujii et al.,2000; Hanakawa et al., 2003; Picard and Strick, 2001). Interest-ingly, the PMd activity we observed in the eye conditions (Table 3)was more rostral compared to that for the hand conditions (Table4). In addition, the coordinates for the locus of maximumactivation in both eye drawing and eye–hand drawing (Table 6)also appear more rostral to the coordinates for all hand tasks,suggesting that drawing tasks were preferentially activating PMdr.No difference in PMd activity was observed between tracking anddrawing lines in the study by Jueptner et al. (1996). Their taskconsisted of drawing single line segments in a self-chosen mannerwithout recalling the line to be drawn, suggesting that the PMdractivity seen in our task may instead reflect recalling andvisualising the spatial configuration of the shape to be drawn.
One puzzling finding is that the right cerebellar crus I wasactually more strongly activated during drawing than tracing. Recentwork has highlighted a cognitive role for the lateral cerebellum infunctions such as planning, set shifting, working memory, abstractreasoning and linguistic skills (Schmahmann, 2004). In particular,involvement of the cerebellar crus I has been reported in non-motor

Fig. 5. Activation map detailing areas of greater activity during eye–handdrawing compared with eye–hand tracing based on group data. (a) Rightcerebellar crus I centred around the voxel of peak significance (x=50, y=−64, z=−32). (b) Right FEF and pre-SMA centred around the voxel of peaksignificance for right FEF (x=22, y=−2, z=54). Colour bars indicate Z-score significance level, from the lowest score of 2.6 (red) to the highestscore of >10.0 (yellow).
Fig. 6. Percentage BOLD response of the (a) right FEF, (b) SMA and (c) leftputamen across the 6 conditions. Asterisk denotes significant differencebetween conditions (P<0.001). Standard error bars are shown. Coordinatesare in mm.
405E. Gowen, R.C. Miall / NeuroImage 36 (2007) 396–410
attention tasks that involve attending to a stimulus (Allen et al.,1997) or task shifting (Le et al., 1998) and in visuospatial workingmemory (Nitschke et al., 2004). Of special interest are the findings ofNitschke and colleagues where cerebellar crus I as well as lobules
VIIb and VIII showed preferential activity for memorised saccadescompared to visually guided saccades.
Interestingly, activity differentiating eye–hand drawing fromeye–hand tracing appears to be mainly in the right hemisphere ofthe FEF, PMdr, cerebellar crus I and parietal lobe. The FEF, PMdrand parietal lobe are involved in spatial attention shifting, and onespeculation is that more attention (and eye movements) needs to bedirected leftward when drawing a series of shapes, from left toright across the page, in order to correctly position the new shapeand prevent overlap; the fixed location of the templates in thetracing condition avoids this requirement. How this may be relatedto the right cerebellar crus I activity is currently unclear to us; it isipsilateral to the moving hand, and so might reflect activity relatedto eye–hand interactions that are more evident in drawing thantracing. However, behavioural data suggest the opposite pattern,with greater interaction in tracing (Gowen and Miall, 2006), andmore work will be needed to resolve this issue.

Table 7Areas more active during independent eye conditions than during coordinated eye–hand conditions
Area Clustervolume(mm3)
P Z Laterality Coordinates (mm)
x y z
Independent tracing–coordinated tracingDorsal prefrontal cortex (BA 46) a 410.66 <0.0001 7.35 R 42 36 34Ventral prefrontal cortex (BA 47) a 7.13 R 30 24 −20Dorsal prefrontal cortex (BA 46) a 6.32 L −32 38 38Superior temporal lobe (BA 22) a 6.08 R 60 −50 22Inferior parietal lobe (posterior intraparietal sulcus) (BA 39) a 5.89 R 48 −76 32Extrastriate visual cortex BA 18 a 5.75 L −6 −96 28Cerebellar crus I a 21.58 0.0008 4.63 L −40 −72 −30
Independent drawing–coordinated drawingPre-supplementary motor area (BA 6) 17.46 0.004 5.69 L −2 8 56Prefrontal cortex (BA 9) 4.7 L −20 18 56
4.24 R 24 28 56Cingulate sulcus (anterior cingulate motor areas) 4.09 R 14 30 34Dorsal lateral prefrontal cortex (BA 46) 11.83 0.03 5.64 L −38 34 28
Top section compares independent tracing against coordinated tracing and bottom section compares independent drawing against coordinated drawing.a Areas where apparent activation is due to relative deactivation in coordinated conditions.
Fig. 7. Percentage BOLD response of the (a) left DLPFC and (b) right BA 9across the 6 conditions. Standard error bars are shown. Coordinates arein mm.
406 E. Gowen, R.C. Miall / NeuroImage 36 (2007) 396–410
In contrast to the results of Jueptner et al. (1996), we failed toobserve greater activity in prefrontal cortex (BA 9, 46, 45, 47)during the drawing task. The activation of prefrontal cortex intheir study may be attributed to the requirement to choose at willthe line direction to be drawn, whereas in our study subjects werecued to draw well known and simple, predefined shapes. Assubjects tend to draw these shapes in highly stereotyped fashion,they would be unlikely to be making a free choice of direction orline segment. This is supported by evidence displaying thatDLPFC activity is associated with decision processes and actionselection (such as what action to perform and when it should beperformed) as opposed to the generation of internal actions per se(Jueptner and Weiller, 1998; Lau et al., 2004; Playford et al.,1992). Finally, as we contrasted all our conditions against afixation task (baseline) that is known to generate activation inprefrontal cortex (BA 9, 46, 45, 47) (Anderson et al., 1994;Jueptner et al., 1996), any prefrontal activation during the activedrawing condition may have been less than during fixation and soremoved in the contrast.
One aspect where our study complements the findings ofJueptner and colleagues is the observation that basal gangliaactivity did not differentiate between tracing and drawing, althoughtheir task appeared to produce much stronger activation than ourown. They further observed that right putamen activation wasgreater during fixation than when simply pursuing a contractingline and as our conditions were all initially contrasted againstfixation this may explain the relatively low signal in the putamen atleast. However, this choice of baseline would not obscure anydifferential activation between drawing and tracing. Involvementof the basal ganglia in internally driven tasks has not beenconsistently found (Mushiake and Strick, 1993; Jueptner et al.,1997a,b; Vaillancourt et al., 2003) suggesting that the dissociationbetween the cerebellum and basal ganglia in regard to externallyand internally guided movements is not complete. Indeed, the basalganglia are comprised of different cortico-basal ganglia circuitsthat respond differently to various demands such as taskcomplexity and frequency (Lehericy et al., 2006) and therefore,the different findings across studies may reflect the functions of
these specific sub circuits. Activity in the caudate and anteriorputamen appears to be greater for complex movements (Lehericy etal., 2006) and in selection of appropriate movements (Jueptner andWeiller, 1998) but lower during the performance of prelearnedtasks (Jueptner et al., 1997a,b; although see Jenkins et al., 1994 fora contrasting result). Perhaps if our task had involved less familiarshapes that were repeated infrequently during the scan, differentialactivity might have been seen between tracing and drawing,

Fig. 8. Activation map detailing areas of greater activity during independentdrawing compared with coordinated eye–hand drawing based on group data.(a) Right and left BA 9 and pre-SMA activation centred around the voxel ofpeak significance for the pre-SMA (x=−2, y=8, z=56). (b) Left DLPFCactivity centred around the voxel of peak significance (x=−38, y=34,z=28). Colour bars indicate Z-score significance level, from the lowestscore of 2.6 (red) to the highest score of >10.0 (yellow).
407E. Gowen, R.C. Miall / NeuroImage 36 (2007) 396–410
because selection of appropriate movements would have beenmore critical while drawing an unfamiliar shape. Furthermore, ithas also been shown that the BG play a stronger role during tasksthat require feedforward control, such as in open loop situationswhere visual feedback of the effector is not available or when thetask is easier (Ogawa et al., 2006; Seidler et al., 2004).Feedforward control may have been used equally for tracing anddrawing due to the familiar and repetitive nature of the shapes.Indeed, eye–hand coupling during tracing decreases with morefamiliar shapes (Gowen and Miall, 2006) suggesting greateremphasis on feedforward control. It is perhaps surprising that basalganglia activity did not parallel that of the pre-SMA as both
structures are interconnected (Lehericy et al., 2004). It could bethat although similar mechanisms were being used to execute bothtracing and drawing, pre-SMA activity was specifically requiredfor the self-initiated drawing task. Alternatively, pre-SMA activityappears to increase with the speed of movement (Deiber et al.,1999) and drawing was performed at a quicker pace than tracing,so the pre-SMA activity may be related to performance times.Indeed, the fact that average drawing speed was faster than that oftracing represents a potential confounding factor of our study, sincewithout direct measures of the pencil motion, we can only estimateaverage performance. There are numerous reports documentingincreased activation of sensorimotor and cerebellar areas as rate orspeed of movement increases (Jancke et al., 1998a,b, 1999; Lewiset al., 2003; Turner et al., 2003) rendering it difficult to concludewhether the activation present during drawing compared to tracingis a function of task or speed. We note however that average tracingsize was 18% larger than in drawing, so the increased rate ofcompleted drawings of a smaller average size will have reduced theoverall difference in velocity between the two conditions. More-over, this does not affect our main finding that drawing and tracingcause indistinguishable activation of the basal ganglia.
Comparison between coordinated and independent eye–handconditions
We attempted to isolate those brain areas that may play a moresignificant role in combined eye–hand tasks than those that use theeyes or hand independently. The cerebellum is one area known tocontribute to coordinated movements between the eye and hand(Miall et al., 2000, 2001; Van Donkelaar and Lee, 1994) and astracing requires increased control and accuracy we anticipated thatcerebellar activation would be greatest in the eye–hand tracingcondition. However, although cerebellar activity was minimalduring eye tracing and drawing, confirming previous findings(Jueptner et al., 1996), no area of the cerebellum was preferentiallyinvolved in either eye–hand tracing or eye–hand drawing whencompared to the independent eye or hand tasks of tracing ordrawing. This suggests that cerebellar areas involved in eye–handcoordination tasks are also used for hand tasks performedindependently of the eyes. In support of this, Miall et al. (2001)observed significant cerebellar activity in crus I, lobules VII andVIII during both coordinated and independent eye–hand tracking.Such activity may be in response to the increased amount ofattention and control required in independent conditions in order toovercome natural tendency for hand to follow eyes (Allen et al.,1997).
A larger number of areas were active during the independentdrawing compared to the combined drawing conditions, suggestingthat the unnatural nature of the task demanded higher processing.This is highlighted by increased activity of dorsal prefrontal areasand pre-SMAwhich, as detailed earlier, are often involved in morecognitively challenging tasks. The increase in pre-SMA (Fig. 6b)and left DLPFC (Fig. 7a) activity appeared to be related morespecifically to eye drawing. This complements the role of theDLPFC in the control of memory-guided and predictive saccades(Pierrot-Deseilligny et al., 2003, 2005) and of the pre-SMA in theproduction of new saccade sequences (Grosbras et al., 2001), asone would expect that drawing a shape with the eyes only would bean unfamiliar challenge in comparison to the normal task ofcombined eye–hand drawing, and even tracing a line with the eyes.Activation of rostral areas of the cingulate cortex has been linkedto self-initiated movement, new learning, error detection and action

408 E. Gowen, R.C. Miall / NeuroImage 36 (2007) 396–410
and outcome monitoring (Deiber et al., 1999; Jueptner et al.,1997a,b; Lau et al., 2004; Picard and Strick, 1996; see Rushworthet al., 2004 for a review) any of which could have been importantduring independent hand drawing. It is interesting to note that noneof the areas more active in the contrast of independent versuscoordinated tracing (Table 6) were also more active in theindependent tracing condition relative to baseline. This highlightsthat even in the more demanding independent conditions,activation during tracing is still of equivalent magnitude to thatseen when fixating a cross.
Conclusions
Our aim was to identify whether the everyday tasks of tracingand drawing using a pencil and paper could differentiate betweenneural circuits involved in external and internal movementgeneration, respectively. It is clear that compared with tracing,drawing does recruit additional brain areas that play a stronger rolein more cognitively challenging functions such as the control ofself-initiated movements, spatial memory and spatial attention.However, activation in the areas traditionally most associated withthe external/internal distinction such as the cerebellum and basalganglia were not modulated in the expected manner, suggestingthat the distinction between internal and external guidance isminimised when moving in these simple, repetitive and staticparadigms and that subjects used similar strategies for both tracingand drawing. Thus consideration should be given to taskfamiliarity, difficulty level and whether the visual cues arestationary or moving. In previous contrasts between internal andexternal guidance, the external cues usually impose implicit orexplicit temporal constraints. Tracing a dynamic, moving,unfamiliar template may increase reliance on visual feedback andthus lead to differential cerebellar activation. Similarly, tasksrequiring drawing of more complex unfamiliar shapes may invokegreater basal ganglia involvement to select the appropriatemovements. However, our study suggests that in the everydaytask of tracing or drawing simple, highly familiar shapes, there areinsufficient differences to fully tax either internal or externalguidance systems. Further work will be needed to understand themicrographic symptoms of Parkinson’s disease.
Acknowledgments
We would like to thank Dr James Stanley for his adviceregarding the imaging analysis. This work is supported by theWellcome Trust.
References
Allen, G., Buxton, R.B., Wong, E.C., Courchesne, E., 1997. Attentionalactivation of the cerebellum independent of motor involvement. Science275, 1940–1943.
Anderson, T.J., Jenkins, I.H., Brooks, D.J., Hawken,M.B., Frackowiak, R.S.,Kennard, C., 1994. Cortical control of saccades and fixation in man. APET study. Brain 117 (Pt. 5), 1073–1084.
Astafiev, S.V., Shulman, G.L., Stanley, C.M., Snyder, A.Z., Van Essen,D.C., Corbetta, M., 2003. Functional organization of humanintraparietal and frontal cortex for attending, looking, and pointing.J. Neurosci. 23, 4689–4699.
Battaglia-Mayer, A., Ferraina, S., Genovesio, A., Marconi, B., Squatrito, S.,Molinari, M., Lacquaniti, F., Caminiti, R., 2001. Eye–hand coordination
during reaching: II. An analysis of the relationships betweenvisuomanual signals in parietal cortex and parieto-frontal associationprojections. Cereb. Cortex 11, 528–544.
Binkofski, F., Dohle, C., Posse, S., Stephan, K.M., Hefter, H., Seitz, R.J.,Freund, H.J., 1998. Human anterior intraparietal area subservesprehension: a combined lesion and functional MRI activation study.Neurology 50, 1253–1259.
Boussaoud, D., 2001. Attention versus intention in the primate premotorcortex. NeuroImage 14, S40–S45.
Briand, K.A., Strallow, D., Hening, W., Poizner, H., Sereno, A.B., 1999.Control of voluntary and reflexive saccades in Parkinson's disease. Exp.Brain Res. 129, 38–48.
Connolly, J.D., Goodale, M.A., Menon, R.S., Munoz, D.P., 2002. HumanfMRI evidence for the neural correlates of preparatory set. Nat.Neurosci. 5, 1345–1352.
Crawford, T.J., Henderson, L., Kennard, C., 1989. Abnormalities ofnonvisually-guided eye movements in Parkinson's disease. Brain 112(Pt. 6), 1573–1586.
Culham, J.C., Brandt, S.A., Cavanagh, P., Kanwisher, N.G., Dale, A.M.,Tootell, R.B., 1998. Cortical fMRI activation produced by attentivetracking of moving targets. J. Neurophysiol. 80, 2657–2670.
Curtis, C.E., D'Esposito, M., 2003. Success and failure suppressingreflexive behavior. J. Cogn. Neurosci. 15, 409–418.
Deiber, M.P., Honda, M., Ibanez, V., Sadato, N., Hallett, M., 1999. Mesialmotor areas in self-initiated versus externally triggered movementsexamined with fMRI: effect of movement type and rate. J. Neurophysiol.81, 3065–3077.
Desouza, J.F., Dukelow, S.P., Gati, J.S., Menon, R.S., Andersen, R.A., Vilis,T., 2000. Eye position signal modulates a human parietal pointing regionduring memory-guided movements. J. Neurosci. 20, 5835–5840.
Duvernoy, H.M., Bourgouin, P., 1999. The Human Brain: Surface, ThreeDimensional Sectional Anatomy With MRI, and Blood Supply.SpringerWein, New York.
Flanders, M., Mrotek, L.A., Gielen, C., 2006. Planning and drawingcomplex shapes. Exp. Brain Res. 171, 116–128.
Flowers, K.A., 1976. Visual “closed-loop” and “open-loop” characteristicsof voluntary movement in patients with Parkinsonism and intentiontremor. Brain 99, 269–310.
Frith, C.D., Friston, K., Liddle, P.F., Frackowiak, R.S., 1991. Willed actionand the prefrontal cortex in man: a study with PET. Proc. Biol. Sci. 244,241–246.
Fujii, N., Mushiake, H., Tanji, J., 2000. Rostrocaudal distinction of thedorsal premotor area based on oculomotor involvement. J. Neuro-physiol. 83, 1764–1769.
Gaymard, B., Ploner, C.J., Rivaud-Pechoux, S., Pierrot-Deseilligny, C.,1999. The frontal eye field is involved in spatial short-term memory butnot in reflexive saccade inhibition. Exp. Brain Res. 129, 288–301.
Gowen, E., Miall, R.C., 2006. Eye–hand interactions in tracing and drawingtasks. Hum. Mov. Sci. 25 (4–5), 568–585.
Grafton, S.T., Mazziotta, J.C., Woods, R.P., Phelps, M.E., 1992. Humanfunctional anatomy of visually guided finger movements. Brain 115(Pt. 2), 565–587.
Grafton, S.T., Fagg, A.H., Woods, R.P., Arbib, M.A., 1996. Functionalanatomy of pointing and grasping in humans. Cereb. Cortex 6, 226–237.
Grosbras, M.H., Paus, T., 2002. Transcranial magnetic stimulation of thehuman frontal eye field: effects on visual perception and attention.J. Cogn. Neurosci. 14, 1109–1120.
Grosbras, M.H., Leonards, U., Lobel, E., Poline, J.B., LeBihan, D., Berthoz,A., 2001. Human cortical networks for new and familiar sequences ofsaccades. Cereb. Cortex 11, 936–945.
Grosbras, M.H., Laird, A.R., Paus, T., 2005. Cortical regions involved in eyemovements, shifts of attention, and gaze perception. Hum. Brain Mapp.25, 140–154.
Hanakawa, T., Honda, M., Okada, T., Fukuyama, H., Shibasaki, H., 2003.Differential activity in the premotor cortex subdivisions in humansduring mental calculation and verbal rehearsal tasks: a functionalmagnetic resonance imaging study. Neurosci. Lett. 347, 199–201.

409E. Gowen, R.C. Miall / NeuroImage 36 (2007) 396–410
Heide, W., Binkofski, F., Seitz, R.J., Posse, S., Nitschke, M.F., Freund, H.J.,Kompf, D., 2001. Activation of frontoparietal cortices during memor-ized triple-step sequences of saccadic eye movements: an fMRI study.Eur. J. Neurosci. 13, 1177–1189.
Jahanshahi, M., Jenkins, I.H., Brown, R.G., Marsden, C.D., Passingham,R.E., Brooks, D.J., 1995. Self-initiated versus externally triggeredmovements: I. An investigation using measurement of regionalcerebral blood flow with PET and movement-related potentials innormal and Parkinson's disease subjects. Brain 118 (Pt. 4), 913–933.
Jancke, L., Peters, M., Schlaug, G., Posse, S., Steinmetz, H., Muller-Gartner,H., 1998a. Differential magnetic resonance signal change in humansensorimotor cortex to finger movements of different rate of thedominant and subdominant hand. Brain Res. Cogn. Brain Res. 6,279–284.
Jancke, L., Specht, K., Mirzazade, S., Loose, R., Himmelbach, M., Lutz, K.,Shah, N.J., 1998b. A parametric analysis of the ‘rate effect’ in thesensorimotor cortex: a functional magnetic resonance imaging analysisin human subjects. Neurosci. Lett. 252, 37–40.
Jancke, L., Specht, K., Mirzazade, S., Peters, M., 1999. The effect of finger-movement speed of the dominant and the subdominant hand oncerebellar activation: a functional magnetic resonance imaging study.NeuroImage 9, 497–507.
Jenkins, I.H., Brooks, D.J., Nixon, P.D., Frackowiak, R.S., Passingham,R.E., 1994. Motor sequence learning: a study with positron emissiontomography. J. Neurosci. 14, 3775–3790.
Jueptner, M., Weiller, C., 1998. A review of differences between basalganglia and cerebellar control of movements as revealed by functionalimaging studies. Brain 121 (Pt. 8), 1437–1449.
Jueptner, M., Jenkins, I.H., Brooks, D.J., Frackowiak, R.S., Passingham,R.E., 1996. The sensory guidance of movement: a comparison of thecerebellum and basal ganglia. Exp. Brain Res. 112, 462–474.
Jueptner, M., Stephan, K.M., Frith, C.D., Brooks, D.J., Frackowiak, R.S.,Passingham, R.E., 1997a. Anatomy of motor learning: I. Frontal cortexand attention to action. J. Neurophysiol. 77, 1313–1324.
Jueptner, M., Frith, C.D., Brooks, D.J., Frackowiak, R.S., Passingham, R.E.,1997b. Anatomy of motor learning: II. Subcortical structures andlearning by trial and error. J. Neurophysiol. 77, 1325–1337.
Kawato, M., Kuroda, T., Imamizu, H., Nakano, E., Miyauchi, S., Yoshioka,T., 2003. Internal forward models in the cerebellum: fMRI study on gripforce and load force coupling. Prog. Brain Res. 142, 171–188.
Konen, C.S., Kleiser, R., Wittsack, H.J., Bremmer, F., Seitz, R.J., 2004. Theencoding of saccadic eye movements within human posterior parietalcortex. NeuroImage 22, 304–314.
Krauzlis, R.J., 2005. The control of voluntary eye movements: newperspectives. Neuroscientist 11, 124–137.
Lau, H.C., Rogers, R.D., Ramnani, N., Passingham, R.E., 2004. Willedaction and attention to the selection of action. NeuroImage 21,1407–1415.
Le, T.H., Pardo, J.V., Hu, X., 1998. 4 T-fMRI study of nonspatial shifting ofselective attention: cerebellar and parietal contributions. J. Neuro-physiol. 79, 1535–1548.
Lee, K.M., Chang, K.H., Roh, J.K., 1999. Subregions within thesupplementary motor area activated at different stages of movementpreparation and execution. NeuroImage 9, 117–123.
Lehericy, S., Ducros, M., Krainik, A., Francois, C., Van de Moortele, P.F.,Ugurbil, K., Kim, D.S., 2004. 3-D diffusion tensor axonal trackingshows distinct SMA and pre-SMA projections to the human striatum.Cereb. Cortex 14, 1302–1309.
Lehericy, S., Bardinet, E., Tremblay, L., Van de Moortele, P., Pochon, J.,Dormont, D., Kim, D., Yelnik, J., Ugurbil, K., 2006. Motor control inbasal ganglia circuits using fMRI and brain atlas approaches. Cereb.Cortex 16, 149–161.
Lewis, S.M., Jerde, T.A., Tzagarakis, C., Georgopoulos, M.A., Tsekos, N.,Amirikian, B., Kim, S.G., Ugurbil, K., Georgopoulos, A.P., 2003.Cerebellar activation during copying geometrical shapes. J. Neuro-physiol. 90, 3874–3887.
Longstaff, M.G.,Mahant, P.R., Stacy,M.A., VanGemmert, A.W., Leis, B.C.,
Stelmach, G.E., 2003. Discrete and dynamic scaling of the size ofcontinuous graphic movements of parkinsonian patients and elderlycontrols. J. Neurol. Neurosurg. Psychiatry 74, 299–304.
Macaluso, E., Driver, J., Frith, C.D., 2003. Multimodal spatial representa-tions engaged in human parietal cortex during both saccadic and manualspatial orienting. Curr. Biol. 13, 990–999.
MacMillan, M., Dostrovsky, J., Lozano, A., Hutchison, W., 2004.Involvement of human thalamic neurons in internally and externallygenerated movements. J. Neurophysiol. 91, 1085–1090.
Martin, K.E., Phillips, J.G., Iansek, R., Bradshaw, J.L., 1994. Inaccuracy andinstability of sequential movements in Parkinson's disease. Exp. BrainRes. 102, 131–140.
Matelli, M., Luppino, G., 1996. Thalamic input to mesial and superior area6 in the macaque monkey. J. Comp. Neurol. 372, 59–87.
Miall, R.C., 1998. The cerebellum, predictive control and motor coordina-tion. Novartis Found. Symp. 218, 272–284.
Miall, R.C., Wolpert, D.M., 1996. Forward models for physiological control.Neural Netw. 9, 1265–1279.
Miall, R.C., Weir, D.J., Stein, J.F., 1987. Visuo-motor tracking duringreversible inactivation of the cerebellum. Exp. Brain Res. 65, 455–464.
Miall, R.C., Weir, D.J., Wolpert, D.M., Stein, J.F., 1993. Is the cerebellum asmith predictor? J. Mot. Behav. 25, 203–216.
Miall, R.C., Imamizu, H., Miyauchi, S., 2000. Activation of the cerebellumin co-ordinated eye and hand tracking movements: an fMRI study. Exp.Brain Res. 135, 22–33.
Miall, R.C., Reckess, G.Z., Imamizu, H., 2001. The cerebellum coordinateseye and hand tracking movements. Nat. Neurosci. 4, 638–644.
Moore, T., Fallah, M., 2001. Control of eye movements and spatial attention.Proc. Natl. Acad. Sci. U. S. A. 98, 1273–1276.
Moore, T., Fallah, M., 2004. Microstimulation of the frontal eye field and itseffects on covert spatial attention. J. Neurophysiol. 91, 152–162.
Morris, M.E., Iansek, R., Matyas, T.A., Summers, J.J., 1996. Stride lengthregulation in Parkinson's disease. Normalization strategies and under-lying mechanisms. Brain 119 (Pt. 2), 551–568.
Muggleton, N.G., Juan, C.H., Cowey, A., Walsh, V., 2003. Human frontaleye fields and visual search. J. Neurophysiol. 89, 3340–3343.
Mushiake, H., Strick, P.L., 1993. Preferential activity of dentate neuronsduring limb movements guided by vision. J. Neurophysiol. 70,2660–2664.
Mushiake, H., Strick, P.L., 1995. Pallidal neuron activity during sequentialarm movements. J. Neurophysiol. 74, 2754–2758.
Nitschke, M.F., Binkofski, F., Buccino, G., Posse, S., Erdmann, C., Kompf,D., Seitz, R.J., Heide, W., 2004. Activation of cerebellar hemispheres inspatial memorization of saccadic eye movements: an fMRI study. Hum.Brain Mapp. 22, 155–164.
Ogawa, K., Inui, T., Sugio, T., 2006. Separating brain regions involved ininternally guided and visual feedback control of moving effectors: anevent-related fMRI study. NeuroImage 32, 1760–1770.
Oliveira, R.M., Gurd, J.M., Nixon, P., Marshall, J.C., Passingham, R.E.,1997. Micrographia in Parkinson's disease: the effect of providingexternal cues. J. Neurol. Neurosurg. Psychiatry 63, 429–433.
Oliveri, M., Turriziani, P., Carlesimo, G.A., Koch, G., Tomaiuolo, F.,Panella, M., Caltagirone, C., 2001. Parieto-frontal interactions in visual–object and visual–spatial working memory: evidence from transcranialmagnetic stimulation. Cereb. Cortex 11, 606–618.
Ozyurt, J., Rutschmann, R.M., Greenlee, M.W., 2006. Cortical activationduring memory-guided saccades. NeuroReport 17, 1005–1009.
Petit, L., Haxby, J.V., 1999. Functional anatomy of pursuit eye movementsin humans as revealed by fMRI. J. Neurophysiol. 82, 463–471.
Picard, N., Strick, P.L., 1996. Motor areas of the medial wall: a review oftheir location and functional activation. Cereb. Cortex 6, 342–353.
Picard, N., Strick, P.L., 2001. Imaging the premotor areas. Curr. Opin.Neurobiol. 11, 663–672.
Pierrot-Deseilligny, C., Muri, R.M., Ploner, C.J., Gaymard, B., Demeret, S.,Rivaud-Pechoux, S., 2003. Decisional role of the dorsolateral prefrontalcortex in ocular motor behaviour. Brain 126, 1460–1473.
Pierrot-Deseilligny, C., Muri, R.M., Nyffeler, T., Milea, D., 2005. The role

410 E. Gowen, R.C. Miall / NeuroImage 36 (2007) 396–410
of the human dorsolateral prefrontal cortex in ocular motor behavior.Ann. N.Y. Acad. Sci. 1039, 239–251.
Playford, E.D., Jenkins, I.H., Passingham, R.E., Nutt, J., Frackowiak, R.S.,Brooks, D.J., 1992. Impaired mesial frontal and putamen activation inParkinson's disease: a positron emission tomography study. Ann.Neurol. 32, 151–161.
Rushworth, M.F., Walton, M.E., Kennerley, S.W., Bannerman, D.M., 2004.Action sets and decisions in the medial frontal cortex. Trends Cogn. Sci.8, 410–417.
Sailer, U., Eggert, T., Ditterich, J., Straube, A., 2000. Spatial and temporalaspects of eye–hand coordination across different tasks. Exp. Brain Res.134, 163–173.
Sailer, U., Eggert, T., Straube, A., 2005. Impaired temporal prediction andeye–hand coordination in patients with cerebellar lesions. Behav. BrainRes. 160, 72–87.
Schmahmann, J.D., 2004. Disorders of the cerebellum: ataxia, dysmetria ofthought, and the cerebellar cognitive affective syndrome. J. Neuropsy-chiatry Clin. Neurosci. 16, 367–378.
Schmahmann, J.D., Doyan, J., Toga, A.W., Petrides, M., Evans, A.C., 2000.MRI Atlas of the Human Cerebellum. Academic Press, San Diego.
Seidler, R.D., Noll, D.C., Thiers, G., 2004. Feedforward and feedbackprocesses in motor control. NeuroImage 22, 1775–1783.
Simon, O., Mangin, J.F., Cohen, L., Le Bihan, D., Dehaene, S., 2002.Topographical layout of hand, eye, calculation, and language-relatedareas in the human parietal lobe. Neuron 33, 475–487.
Smith, D.T., Jackson, S.R., Rorden, C., 2005. Transcranial magneticstimulation of the left human frontal eye fields eliminates the cost ofinvalid endogenous cues. Neuropsychologia 43, 1288–1296.
Thompson, K.G., Biscoe, K.L., Sato, T.R., 2005. Neuronal basis of covertspatial attention in the frontal eye field. J. Neurosci. 25, 9479–9487.
Turner, R.S., Desmurget, M., Grethe, J., Crutcher, M.D., Grafton, S.T., 2003.Motor subcircuits mediating the control of movement extent and speed.J. Neurophysiol. 90, 3958–3966.
Vaillancourt, D.E., Thulborn, K.R., Corcos, D.M., 2003. Neural basis for the
processes that underlie visually guided and internally guided forcecontrol in humans. J. Neurophysiol. 90, 3330–3340.
Vaillancourt, D.E., Mayka, M.A., Corcos, D.M., 2006. Intermittentvisuomotor processing in the human cerebellum, parietal cortex, andpremotor cortex. J. Neurophysiol. 95, 922–931.
Van Donkelaar, P., Lee, R.G., 1994. Interactions between the eye and handmotor systems: disruptions due to cerebellar dysfunction. J. Neuro-physiol. 72, 1674–1685.
Van Donkelaar, P., Staub, J., 2000. Eye–hand coordination to visual versusremembered targets. Exp. Brain Res. 133, 414–418.
Van Donkelaar, P., Stein, J.F., Passingham, R.E., Miall, R.C., 1999.Neuronal activity in the primate motor thalamus during visuallytriggered and internally generated limb movements. J. Neurophysiol.82, 934–945.
Van Donkelaar, P., Stein, J.F., Passingham, R.E., Miall, R.C., 2000.Temporary inactivation in the primate motor thalamus during visuallytriggered and internally generated limb movements. J. Neurophysiol. 83,2780–2790.
Van Gemmert, A.W., Teulings, H.L., Stelmach, G.E., 2001. Parkinsonianpatients reduce their stroke size with increased processing demands.Brain Cogn. 47, 504–512.
van Mier, H., Tempel, L.W., Perlmutter, J.S., Raichle, M.E., Petersen, S.E.,1998. Changes in brain activity during motor learning measured withPET: effects of hand of performance and practice. J. Neurophysiol. 80,2177–2199.
Vinter, A., Gras, P., 1998. Spatial features of angular drawing movements inParkinson's disease patients. Acta Psychol. (Amst.) 100, 177–193.
Wise, S.P., Boussaoud, D., Johnson, P.B., Caminiti, R., 1997. Premotor andparietal cortex: corticocortical connectivity and combinatorial computa-tions. Annu. Rev. Neurosci. 20, 25–42.
Wojciulik, E., Kanwisher, N., 1999. The generality of parietal involvementin visual attention. Neuron 23, 747–764.
Wolpert, D.M., Miall, R.C., Kawato, M., 1998. Internal models in thecerebellum. Trends Cogn. Sci. 2, 338–2347.