differential thermal analysis of nickel-base … thermal analysis of nickel-base superalloys d.l....
TRANSCRIPT

DIFFERENTIAL THERMAL ANALYSIS OF NICKEL-BASE SUPERALLOYS
D.L. Sponseller
ERIM Transportation & Energy Materials Laboratory 4683 Freedom Drive
Ann Arbor, Michigan 48108
Abstract
Differential thermal analysis was performed on over 200 nickel-base superalloys that included model, experimental, developmental, and commercial alloys. About one-half of these alloys were studied during melting and solidification, and about three-fourths were studied using solid specimens. Large samples were employed to permit the use of internal thermocouples and to minimize both the effects of segregation and the changes in chemical composition resulting from the loss of strong oxide-forming components. The features of thermograms for solid specimens were identified by two calibration techniques: (1) Inserting thin bar specimens of four cast alloys into a gradient furnace so that all parts of the test specimen were heated at the same rate as in a DTA test to the temperature range of interest; water quenching preserved the entire range of microstructures for metallographic evaluation. (2) Heating (and cooling, when applicable) 35 disc specimens of various alloys to points of interest on the heating thermogram and especially on the cooling thermogram, at which point each specimen was water quenched and evaluated metallographically. The effects of alloying elements on liquidus temperature, carbide-formation temperature, and the extent of carbide dispersion in the cast structure, y’ solvus temperatures (for DTA heating/cooling rates and for practical heat treatments and soaking treatments), incipient-melting temperature, and the width of the temperature “window” for solution-heat-treating of single-crystal alloys are presented. Some examples of problem solving by DTA related to cracking during casting caused by very- low-melting liquid and to microporosity related to the y + y’ eutectic constituent are presented.
Introduction
Phase reactions play a crucial role in many aspects of the processing and service of high-strength nickel-base superalloys. Before 1968, however, the determination of the most important phase-reaction temperature, that at which the y’ strengthening precipitate dissolves, required the laborious heat-treating and metallography of many specimens, and begged for a simpler technique. The ability of differential thermal analysis (DTA) to simply and accurately measure the temperatures of phase reactions in materials was first discovered by LeChateliCr in 1887, and perfected for metals by Roberts-Austen in 1899 (1,2). Considering its great utility in the study of phase reactions, DTA has generally been underutilized, however, by the metallurgical community. Because the author had successfully used DTA to help identify elevated-temperature ductile-iron compositions that could be used to 815 C (1500 F) without re-austenitization,
Superalloys 1996 - . . . - - _..
DTA was investigated at the Climax Molybdenum (AMAX) laboratory in 1968 as a means of directly measuring the y’ solvus temperature in nickel-base alloys (3,4). It was found that DTA gives a clear and accurate indication of the y’ solvus temperature during both heating and cooling. Following this discovery, DTA was used in many other superalloy studies at the Climax laboratory. Also, DTA was performed on as many as five sets of samples received from each of the following companies seeking DTA-based data and interpretation in their R&D and problem-solving.
Allied Signal (Garrett Engine) Allison Gas Turbine Cannon-Muskegon Carpenter Technology Wemp General Electric Haynes International Howmet
Pratt & Whitney Precision Castparts Rolls Royce Ross & Catherall Sorcery Metals Special Metals Westinghouse
Results obtained on more than 200 model, experimental, develop- mental, and commercial alloys to date have demonstrated the power of DTA to provide invaluable guidance in the alloy and process development, production, and characterization of superalloys (5,6).
The purpose of this paper is to document the main findings from the above studies. It is hoped that the sharing of this information with others in the superalloy community may help to further advance the state of the art in the metallurgy of gas-turbine alloys for the transportation, energy, industrial, and military sectors.
Solidification Studies
Experimental Procedure
Test specimens for studies of melting and solidification weighed 9 grams, about 100 times heavier than the 50 to 150-mg samples used in most commercial DTA units. This avoided the variation of results associated with segregation, especially for samples taken from ingots and investment castings, and minimized changes in chemical composition associated with oxidation of strong oxide formers such as aluminum, titanium, and hafnium that would show up especially on resolidification. An additional advantage is that the large specimen, shown in Figure 1, permitted the use of the pictured small immersion thermocouple (W-W/Re type) to avoid errors in sensing the specimen temperature. The test specimen, and two similarly shaped pure-molybdenum specimens (one containing the reference thermocouple and the other containing the furnace-control
tm1ra “y K. U. Kmn~er, V. J. bye. D. L. Anton, A. D. C&l. M. V. Nathal, T. M. Pollock, and V. A. Woodford
The Minerals, Metals & Materials Society, 1996
259

Base Alloy:
Ni-15Cr-lOCo-5Mo- 3AI
(lO”C/min)
Figure 1. DTA cell for melting/solidification studies, showing: (left) 9-g machined specimen with drilled axial thermocouple hole, high-purity recrystallized alumina thermocouple tube and crucible and (right) assembly ready for thermocouple insertion and test, showing pure molybdenum block with thick lid that keeps the thermocouple tube centered in the sample when molten, and threaded hanger rod.
thermocouple) all were similarly situated in high-purity recrystallized alumina crucibles contained within a pure molybdenum block, with a thick, close-fitting lid, that was suspended from the top of a resistance-heated vacuum furnace. A 4-wire thermocouple was used in the specimens for all but some of the early runs, so that this thermocouple could both oppose the reference thermocouple and drive the X axis, elimmating the need for any temperature corrections in “reading” the thermograms. In each DTA experiment, the assembly was first heated and then cooled through the melting range at 10 C/mm, followed by a similar run at 20 C/min. Plots of AT vs specimen temperature were obtained with an X-Y recorder. The system was straight-forward to use, and gave consistent and reliable results. Tested specimens were normally examined metallographically. Approximately 100 different superalloys were so tested; not all of these alloys, however, are represented in this paper.
Alloving Effects
Model Alloys. A series of eight model alloys was melted, to delineate the effects of key alloying elements on the meltinglsolidification behavior of nickel-base alloys. To a base composition of Ni-15Cr-lOCo-5Mo-3Al were added 0.16 and 0.32% C, an additional 3% Al, 3 and 6% Ti, and 6% Ta, in various combinations. Thermograms for the base alloy and three modifications, along with final microstructures, are shown in Figure 2a. The base alloy shows the expected strong endothermic effect during melting and exothermic effect during solidification at 10 C/mm, with no unusual features except for some (up to 23 C [42 FJ) undercooling and recalescence at the start of solidification. All three thermograms for the model alloys in Figure 2a show inflections associated with the melting/solidification of the carbide eutectic. Of special interest is the position of this eutectic reaction with respect to the type of carbide involved. The reaction comes very late in the solidification process for the alloy containing no titanium, but much earlier for the titanium-containing alloys. Tantalum was found to have a similar effect to that of titanium. This simply reflects the fact that these two alloying elements are much stronger carbide farmers than is chromium. Correspondingly, the chromium carbide is more clearly segregated at dendritic interstices than are the titanium or tantalum carbides. (Though not presented in this paper, a thermogram for IN-738 containing
0.16C 0.16C 0.16C
A 3Ti lj;r\ 6Ti
Temperature
2400
Ti, Wt%
Figure 2. Results of melting/solidification studies of four model alloys of indicated compositions. (a) Thermograms obtained during melting and solidification, showing undercooling and recalescence of the two alloys without titanium and showing the carbide eutectic reactions (encircled) in the carbon-containing alloys. Microstructures of the three alloys with carbon, after solidification during the second run (20 C/min), are shown. (b) Solidification ranges obtained from the thermograms of (a), showing the effect of the carbon addition and then of titanium additions on the hquidus temperature. Note the very low temperature of the carbide eutectic reaction in the absence of titanium, and the reaction’s progressive approach toward the liquidus temperature with increasing titanium content.
0.17% C and 0.10% Zr, in which the carbide eutectic inflection occurs at a much earlier point during solidification--midway up the rising part of the exotherm in the solidification thermogram--has carbides that are distributed much more widely throughout the structure than in the model alloy containing no titanium, the carbide eutectic in IN-738 occupying roughly one-half of the specimen volume. This shows that the thermogram can serve as an indicator of whether carbides are highly segregated or well dispersed in the cast structure.) The model alloy containing 0.16 % C, 3 % Al, 3 % Ti, and 6% Ta formed some carbides 75 C (135 F) above the start of metallic dendrite formation.
The effect of the stability of the carbide on the temperature of its eutectic reaction may be seen more quantitatively in Figure 2b. The solidification range for the alloy containing carbon but no strong carbide formers is approximately 155 C (275 F), but the ranges for the titanium-containing alloys are less than one-half this amount. Figure 2b also shows that the liquidus temperatures are depressed, first mildly by the carbon addition, then more strongly by the additions of 3 and 6% Ti. The relationship between chemical composition and liquidus temperature is seen more clearly in Figure 3, a plot of liquidus temperature vs hardener content. The slopes of
260
the line segments connecting the data points representing the individual alloys are labeled with the specific melting-point- depressing effect (AT per 1 wt pet) of the one element that varies between the two alloys. Titanium exhibits the strongest specific effect, with an average value of 14.2 C (25.5 F)/wt pet. That of aluminum is somewhat weaker, 12.2 C (22 F)/l wt pet, while that of tantalum is the weakest of the three hardeners, with an average value of 4.8 C (8.5 F)/l wt pet.
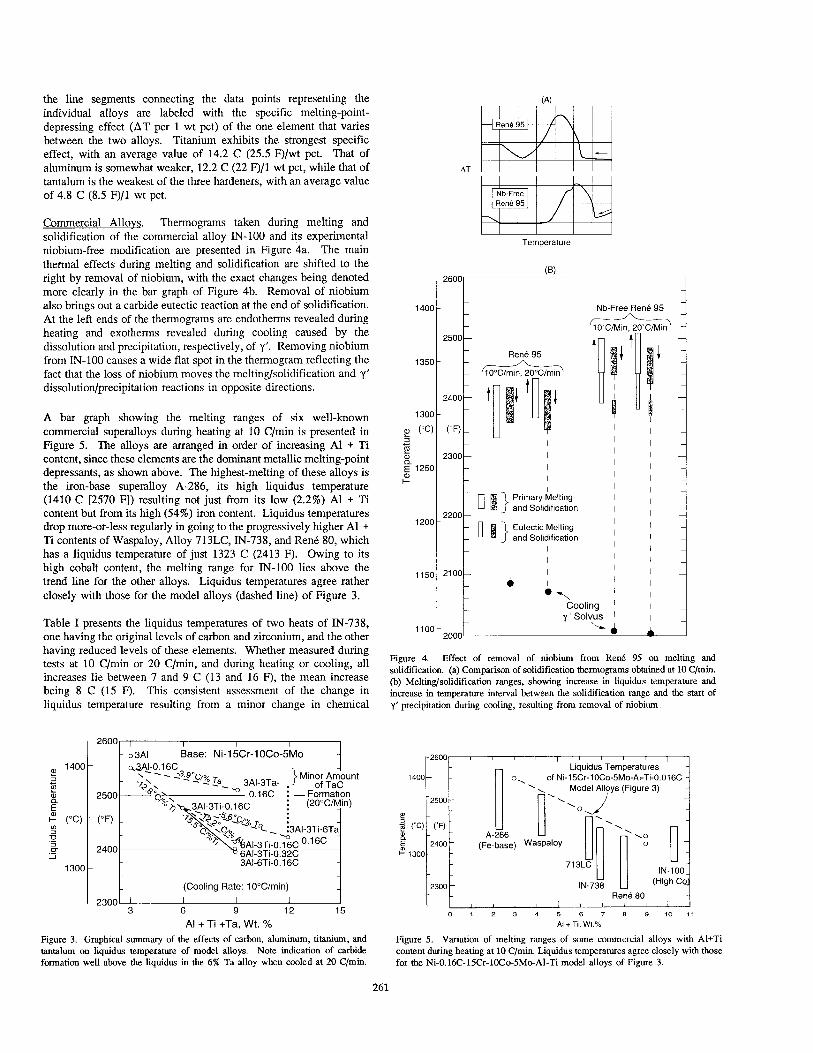
Commercial Alloys. Thermograms taken during melting and solidification of the commercial alloy IN-100 and its experimental niobium-free modification are presented in Figure 4a. The main thermal effects during melting and solidification are shifted to the right by removal of niobium, with the exact changes being denoted more clearly in the bar graph of Figure 4b. Removal of niobium also brings out a carbide eutectic reaction at the end of solidification. At the left ends of the thermograms are endotherms revealed during heating and exotherms revealed during cooling caused by the dissolution and precipitation, respectively, of y’. Removing niobium from IN-100 causes a wide flat spot in the thermogram reflecting the fact that the loss of niobium moves the melting/solidification and y’ dissolution/precipitation reactions in opposite directions.
A bar graph showing the melting ranges of six well-known commercial superalloys during heating at 10 C/min is presented in Figure 5. The alloys are arranged in order of increasing Al + Ti content, since these elements are the dominant metallic melting-point depressants, as shown above. The highest-melting of these alloys is the iron-base superalloy A-286, its high liquidus temperature (1410 C [2570 F]) resulting not just from its low (2.2%) Al + Ti content but from its high (54%) iron content. Liquidus temperatures drop more-or-less regularly in going to the progressively higher Al + Ti contents of Waspaloy, Alloy 713LC, IN-738, and RenC 80, which has a liquidus temperature of just 1323 C (2413 F). Owing to its high cobalt content, the melting range for IN-100 lies above the trend line for the other alloys. Liquidus temperatures agree rather closely with those for the model alloys (dashed line) of Figure 3.
Table I presents the liquidus temperatures of two heats of IN-738, one having the original levels of carbon and zirconium, and the other having reduced levels of these elements. Whether measured during tests at 10 C/min or 20 C/min, and during heating or cooling, all increases lie between 7 and 9 C (13 and 16 F), the mean increase being 8 C (15 F). This consistent assessment of the change in liquidus temperature resulting from a minor change in chemical
2600 , I / I
o3AI Base: Ni-15Cr-lOCo-5Mo
s
1400- sY”.‘6c
tij - - -%?“~/~ La
t 2500 ‘G>> o,,6c ;y;;::d;t
_ T) 3AI-3Ta-
e Go \
? (“‘2) - (“F) -
s/?
2 ;
.F 2400 -I u 6AC3TC0.32C
1300- 3AI-6Ti-0.16C
(Cooling Rate: 1 O”C/min)
2300 ’ I I I
3 6 9 12 15
Al + Ti +Ta, Wt. %
Figure 3. Graphical summary of the effects of carbon, aluminum, titanium, and tantalum on liquidus temperature of model alloys. Note indication of carbide formation well above the liquidus in the 6% Ta alloy when cooled at 20 C/min.
AT
Temperature
2500
135om 135om -
1300- 1
2400 2400 -
1300-
g PC) (“F) - g PC) (“F) -
a a E E Pi Pi 2300 - 2300 -
E E 125Om - 125Om -
? ?
2200 - 2200 - 1200- 1200-
and Solidification I
I
I
I
I
I
I
I
I
I
I
I
I
I
I
I
I
I
Figure 4. Effect of removal of niobium from Rem? 95 on melting and solidification. (a) Comparison of solidification thermograms obtained at 10 C/min. (b) Melting/solidification ranges, showing increase in liquidus temperamre and increase in temperature interval between the solidification range and the start of y’ precipitation during cooling, resulting from removal of niobium.
-2600 I 8 I I I I I I , ,
1400- -
s -
i+ k
(‘Cl 0) / 1
Liquidus Temperatures 0, of Ni-15Cr-lOCo-SMo-Al-Ti-O.O1GC -
‘A Model Alloys (Figure 3)
u
‘\ ‘0 ‘. /
2500
A-266 ‘l\
\o E
2
2400 WasPa’oY 0 1300-
- (Fe-base) “I[ “I
713LC IN-100
2300 - IN-736 (High Co
Rem? 80
Figure 5. Variation of melting ranges of some commercial alloys with AI+Ti content during heating at 10 C/min. Liquidus temperatures agree closely with those for the Ni-O.lfSC-15Cr-lOCo-5Mc-AI-Ti model alloys of Figure 3.
261

Table I. Effects of Small Changes in Composition on Liquidus Temperature of IN-738
I I Liquidus Temperahue, C (F)
Rate, Standard C/Min Mode IN-738
LWC,ZI Difference, IN-738 c m
(0.17C-O. lOti) (0.11c-0.04zr)
Heating 1325 (2417) 1334 (2433) +9 (+16) 10
Mean Difference, +t? c (+15 F)
Table II. Critical Temperatures for Six Commercial Heats of Renk 80 During Solidification at 10 Win
y’ Solvus 1149 1157 1153 1160 1160 1154 1156 3 (6) 1
composition, so as to provide guidance in setting pouring temperatures and possibly controlling other operations, illustrates the value of DTA in process control of superalloy production.
A more complete characterization of the solidification process is presented in Table II for six heats of Rene 80 remelt ingot. Reported are (1) the liquidus temperature, (2) the start of the MC .t y eutectic reaction, (3) the solidus temperature, (4) the start of the y + y’ eutectic reaction, and (5) the y’ solvus temperature during cooling, marking the start of y’ precipitation, all measured during cooling at 10 C/min. The mean deviations in these temperatures are 1 to 3 C (2 to 6 F). Since these differences reflect the heat-to-heat differences in chemical composition of the Rene 80, as well as any errors in the DTA measurements, it is obvious from the small mean variations in the critical temperatures of the five reported phenomena that the DTA measurements are quite precise.
Studies of Solid Specimens
Experimental Procedure
Measurements of y’ solvus temperature, incipient-melting point, and several other effects were made with a different type of specimen and test instrument than in the preceding section, Figure 6. Cylindrical specimens weighing 4 g and with an axial thermocouple hole drilled to midlength were tested to a maximum temperature just above the incipient-melting point. This afforded greater precision than with the small specimens of commercial systems described above because of (1) the ability to place the thermocouple bead within and in direct contact with the specimen and (2) the higher magnification of the differential temperature that is made possible by avoiding the need to accommodate the large thermal effects encountered during full melting and solidification. The DTA
Pt-Wound Furnace
Y Axis 0
I Drives X Axis
Figure 6. Physical arrangement for DTA tests of solid specimens.
specimen containing a 4-wire thermocouple, and a high-purity alumina reference specimen, both positioned in a cylindrical nickel block parallel to its axis and 180 degrees apart, were heated in a platinum-wound furnace at a constant rate (usually either 2 or 10 C/min) to a certain maximum temperature. The peak temperature was higher than the y’ solws temperature, of course, and generally was about 40 C (70 F) above the incipient-melting temperature for the 10 C/rein heating rate, and was somewhat lower for the 2 C/min rate. No sagging of the specimen nor bleeding of eutectic liquids occurred unless the specimen had been heated a greater amount beyond the incipient-melting temperature. The specimen was normally cooled at a natural rate (with power off) of approximately 25 C/mm through the y’ solvus temperature range, so as to achieve a very “clean” cooling curve, free of any slight thermal disturbances that can occur with the low power inputs of the cooling mode. In all, more than 150 different model, experimental, developmental, and commercial superalloys, often with multiple runs on each, have been so-tested to date.
Intermetation of Thermograms
The features of thermograms were identified in two ways: (1) by gradient-furnace experiments and (2) by quenching experiments, as illustrated in Figure 7. In the former method, a thin bar specimen, 64 mm (2.5 inches) in length and containing thermocouples embedded near each end, was manually advanced along the horizontal hearth in the slot-like chamber of a SATEC gradient furnace at a rate that achieved a heating rate of 10 C/mm. As soon as the temperature range within the specimen had encompassed all the critical temperatures of interest, the specimen was quenched vigorously in water. This procedure achieved the same micro- structure at any point along the length of the specimen as if that point were contained in a normal DTA specimen being heated at 10 C/min, and “froze” that microstructure for subsequent metal- lographic identification. Four cast alloys (IN-loo, B-1900, B-1900 + Hf [MM-0071, and Mar-M246 + Hf @IM-0061) were studied by this method. Obviously, a gradient specimen could not readily be physically arranged to approach the temperature span of critical temperatures from above the liquidus temperature, and thus the cooling portion of thermograms was “calibrated” by a series of quenching experiments. (A smaller number of points on the heating thermograms also were so-checked.) In each test, a thin disc was removed from the top of a normal specimen and, with a thin wire “handle” spot-welded to it, was placed in its original position on top
262

of the shortened and thermocoupled DTA specimen. Covered by an insulating lid atop the nickel block, the test disc was taken through the DTA run to the point of interest. The furnace was quickly opened (a possibility facilitated by the design of the Harrop furnace), and the specimen was immediately (transfer time approximately l/2 second) quenched in water. Such quenching was done from the points denoted by the heavy dots on the thermogram of alloy Mar- M246 + Hf (MM-006), as shown in Figure 7, and on some specimens of other alloys, for a total of 35 specimens. The quenched discs were subsequently studied by conventional, and in some cases SEM, metallography.
Based on the results of the above “calibration” studies on solid specimens, (annotated) thermograms for Mar-M246 + Hf, with the various critical temperatures and other features labeled, are presented in Figure 8. Most striking, of course, are the large endotherm during heating and exothenn during cooling caused by the dissolution and precipitation, respectively, of y’. In this paper, the peaks in these thermal perturbations are called the “maximum thermal effect” and
Temperature
Figure 7. Method of obtaining metallographic samples for calibration of thermograms by means of gradient bars and selected quenched samples for heating thermograms (top and middle) and quenched samples for cooling thermograms @Xtom).
(4
Temperature
Figure 8A. Heating thermogram for Mar-M246 + Hf (MM-CO6), with critical temperatures and other key features labeled. Micrographs (SEM) at bottom and right show quenched liquid at Hf/Zr-enriched zone and at partially liquated carbide particle, respectively. Heating rate: 10 C/min.
correspond to the temperature at which there is the maximum time- rate-of-change in the volume of y’ precipitate. The location of this peak reflects the combined effects of (1) the shape of the y’ solvus curve in the quasi phase diagram of temperature versus combined hardener content, (2) the degree of chemical segregation or “coring,” especially in cast structures, and (3) heating or cooling rates and diffusion effects. In cast structures, the maximum thermal effect corresponds rather closely to the y’ solvus temperature at the centers of dendrite arms, these locations being leanest in hardener content. (Actually, the centers of dendrite arms reach their “solvus” during heating somewhat before the maximum thermal effect occurs, as indicated in Figure 8a.) During heating, the “front” marking total dissolution of matrix y’ precipitate advances in a wave that eventually has consumed each entire dendrite arm by the time the specimen reaches the y’ solvus temperature. During cooling, Figure 8b, the reverse process occurs. The y’ solvus temperatures during heating and cooling, then, are represented by the comers at the right ends of these large thermal effects, where the curve joins the baseline. The y’ solvus temperature during cooling is always lower than that during heating, due to diffusion effects--the equilibrium solvus temperature value lying somewhere between the heating and cooling values.
Heating thermograms for specimens containing large amounts of the y + y’ eutectic constituent have a small inflection to the right of the main endotherm, caused by the dissolution of the coarser y’ particles that are characteristic of this constituent. The right end of this perturbation in the curve denotes the eutectic y’ solvus, Figure 8a. Micrographs of such zones in disc samples quenched from tempera- tures just below and just above this small inflection during heating are shown in Figure 9, upper. Following the specimen’s temperature excursion above the incipient-melting point, during which time the zones containing the former y + y’ eutectic had remelted, disc specimens were quenched from just above and just below the corresponding inflection on the cooling curve. The hotter specimen exhibits pockets of quenched liquid (fine structure), while the cooler specimen contains the familiar y + y’ eutectic nodules (separated by a small amount of very low-melting liquid), thus showing that the inflection represents solidification of this eutectic, having an appearance much like in the original casting.
W
End of Solidificatio at Liquated Carbidc
Temperature
Figure 8B. Same as Figure SA, but during natural cooling after DTA specimen had been heated about 40 C (70 F) above the incipient-melting point.
263

One of the most useful features of the present type of DTA test performed on solid specimens is its very sensitive detection of the incipient-melting point, or very beginning of the main melting process (ignoring the melting of the trace quantities of very low melting patches). The incipient-melting point is denoted by the comer at the right end of the heating thermogram where the curve breaks sharply downward. Because the thermocouple makes direct contact with the specimen, and because the differential temperature is highly expanded, as described previously, the incipient-melting point can be measured precisely, thus providing reliable guidance in heat-treating and other considerations. Physically, the incipient- melting point for typical superalloys containing carbon is the temperature at which carbides begin to liquate, i.e., to undergo the carbide eutectic solidification reaction in reverse. Such partial liquation of a carbide particle is seen in the SEM micrograph at the right-hand side of Figure 8a. Though “calibration” experiments have not been done on carbon-free superalloys, the incipient-melting point in such alloys presumably corresponds to the melting of any undigested y + y’ eutectic, or to the melting of the segregated zones of lowest melting point at dendrite interstices.
The final features of interest sometimes seen in thermograms of solid specimens are small inflections representing the melting and solidification at very low temperatures (~1150 C [2100 F]) of the tiny pockets of eutectic described above, containing such elements as zirconium, hafnium, boron, and phosphorus, combined with nickel. Zhu et al. have observed small pockets of such liquid even
W.Q. From 1243°C W.Q. From 1266°C
W.Q. From 1213°C W.Q. From 1232°C
Figure 9. Scanning elecaon micrographs of Mar-M246 + Hf (MM-OX) samples quenched from temperatures bracketing the thermogram features that denote the solvus temperature for eutectic y’ during heating (top) and the temperature for solidification of the y + y’ eutectic during cooling (bottom). Note that only carbides remain above the eutectic y’ solvus.
at 1100 C (2010 F) in slowly solidified nickel-base superalloys (7). These are located at interdendritic interstices and gram boundaries, between or adjacent to the y+ y’ eutectic nodules, when present, as seen in Figure 9, lower.
Knowledge of y’ solvus temperatures is often important in the control of solution-heat-treatment temperatures prior to precipitation hardening, and in the control of soaking temperatures for hot working. Thus it is important to know the relationship between y’ solvus temperature measured conveniently by DTA and the practical y’ solvus temperature for a heat treatment of some f=ed duration at a constant temperature. Research at the AMAX laboratory and that of Maurer et al. has shown that the y’ solvus temperature measured by DTA drops moderately as heating rate decreases (8). In the present study, DTA results obtained at two heating rates for cast AF2-1DA and two of its modifications were compared with results for specimens heat treated two hours at six temperatures spaced 5.5 C (10 F) apart, and examined metallographically to determine the “practical” solvus temperature. The results, presented in Figure 10, show that the y’ solvus temperatures measured at 10 C/min lie above the “practical” solvus temperatures determined metallographically, the average temperature difference being about 15 C (27 F). Results for DTA specimens heated at 2 C/min, however, agree closely with the metallographic study. This indicates that DTA tests should be made at lower heating rates than the commonly used 10 C/min rate when seeking guidance for practical heat treatments. Alternatively, subtracting a correction factor of about 15 C (27 F) for as-cast alloys (and presumably somewhat less for specimens with fine y’ particles that dissolve more readily) from the y’ solvus temperature determined by DTA at 10 C/min would most likely provide sufficient accuracy for control of heat-treating or soaking temperatures.
Y’ Solvus Temneratures
Model allovs. The ability of DTA to accurately detect the y’ solvus temperature during heating and cooling was discovered during tests on a series of 16 model alloys (four molybdenum levels at each of four hardener levels) at the Climax Molybdenum (AMAX) labora- tory in April 1968 by Loomis, Freeman, and Sponseller (4). The series of wrought alloys with controlled additions of molybdenum to a Ni-Cr base (Ni/Cr ratio = 4.6 on a weight basis) at four aluminum levels (one with titanium, not presented here) show progressive raising of the y’ solvus temperature by molybdenum as it dissolves in, and increases the quantity of, y’, Figure 11. The molybdenum
Cast AF 2.1DA
Reduced 1250 .̂ c.w Addition of Hf
5 t t E (“C) (“0
Figure 10. Comparison of y’ solws temperatures determined by DTA during heating at 2 C/min and 10 C/min with those obtained metallographically from specimens held hvo hours at temperatures spaced 5.5 C (10 F) apart, for cast AF 2-1DA and two of its modifications. The slower heating rate is seen to provide “practical” solws temperatures.
264

1100
2 $ 1000
Ei
E (“Cl l-
5 z
r% 900
-F-
IO
Figure 11. Effect of molybdenum on y’ solws temperature, as determined by DTA during. heating and co&w at 10 C/min of model Ni-Cr-Al-MO alloys having three levels of ah&mm content (Ref: 4).
1200 t
2200 I / I , I I 1 ,’ 1
Rene 95 . ‘-
(3.45% Nb) , ’ ’ : :q’ -
/’ ,’ f / Astroloy
iii /
E rc) 1900
/ 1’2
F Waspaloy ,i , ’
Band for Alloys
(W Without Niobium
2 iooo- z 1800 -
8 /‘/CJ/by’omef 860
lncoloy 901,; 7
i 1700 -
900 lncone1718° 1’ I’
(5.35% Nb) ,’ /’ Y fY’ 1600 - !/ l +- A-286
/ 1500 ; ; 4 Ii 0 2 5 7 8 9
Al + Ti, Wt. %
_J 10
Figure 12. Variation of y’ s&us temperatures of seven wrought alloys with Al + Ti content. Niobium raises the data points for Inconel 718 and Rend 95 above the band for the niobium-free alloys. Values were obtained by DTA during heating at 10 C/min.
effect decreases as solvus temperature increases, suggesting a kind of exhaustion or compression effect, as the melting range is approached. The equilibrium y’ solvus temperature is taken as the average of those measured during heating and cooling at 10 C/min; the decreasing interval between the two temperatures as hardener level increases is due to faster diffusion at higher temperatures.
Commercial Alloys. The y’ solvus temperature of seven wrought alloys, including commercial disc alloys and wrought Pyromet 860, measured during heating at 10 C/min, are presented in Figure 12. This plot of solvus temperature versus Al + Ti content shows the progressive increase in solvus temperatures over the years, starting with the early-generation disc Alloy A-286, and proceeding to the higher-hardener alloys such as Inconel7 18, Waspaloy, and Rend 95. An increase in solvus temperature of over 500 F is evident. (The
2400
2300
(‘F)
214(
“C “F --
1307 2385 4 CMSX2
1296 2365 1294 2362
1277 2331 0 NASAIR-100
1252 2285 4 RENil20
1246 2275 0 MAR-M247
1242 2268 4 B-l 900 + Hf (MM-007) 1240 2264 4 IN-100 + Hf
1228 2243 4 MAR-M246 + Hf (MM-006)
1224 2235 4 B-1900
1218 2225
1208 2206 4 MAR-M246
4 MAR-M200 + Hf (MM-009) (PWA-1422)
1198 2189 4 IN-738 + Hi
1190 2174 1189 2173
+ AF 2-j DA Cast) L RENE 95 ( ast and Forged)
1182 2160 $ IN-7313 1181 2158 RENE 95 (PM)
1176 2149 + AF-21 DA (PM)
Figure 13. Practical y’ solvus temperatures for some well-known superalloys. All but three data points represent cast alloys, the wrought alloys being represented by solid symbols. The five alloys with the highest solvus temperatures are single- crystal alloys. Note the effect of bafnium in raising the solvus temperatures of four alloys. Data were determined by DTA of solid-type specimens at a heating rate of 2 C/min.
reason Inconel 718 and RenL 95 lie above the band is that their solvus temperatures are raised by high niobium content.)
The range of practical y’ solvus temperatures among 21 commercial or developmental alloys is shown in Figure 13. As described above, “practical” solvus temperatures are those obtained at a very slow heating rate, 2 C/min, and closely represent the solvus temperature for a 2-hr heat treatment or soak prior to hot working. The alloys represented are primarily of the cast type, but the wrought alloys AFZlDA (PM), RenC 95 (PM), and Rent? 95 (cast and forged) are included. Because y’ is the primary high-temperature strengthener in nickel-base superalloys, and because the quantity of y’ tends to
265

increase with increasing solvus temperature, the height of an alloy within Figure 13 serves as a general indicator of its high-temperature strength. Of special interest are the significant boosts in y’ solvus temperature of four of the alloys--IN-738, Mar-M246, B-1900, and IN-loo--caused by the addition of 1.52% Hf. Alloys with y’ solvus temperatures above 1260 C (2300 F) are single-crystal alloys; mainly first-generation alloys are shown, but the state-of-the-art single- crystal alloy Renk N6 is included.
Numerous superalloys containing hafnium have found their place in modem gas-turbme engines. The curves of Figure 14 illustrate a “fingerprint” of hafnium that shows up in the cooling thermogram of solid specimens after they have been heated to about 40 C (70 F) above the incipient-melting point. Shown are the cooling thermo- grams for IN-738 and 0.5, 1.0, and 1.5% Hf modifications thereof. At 1.0% Hf, and especially at 1.5% Hf, distinct sidepeaks are noted on the higher-temperature side of the y’ precipitation exotherm. These are caused by solidification of the y + y’ eutectic constituent and by y’ precipitation that begins in the so-called “swirly” y’ regions before general precipitation of y’ begins in the rest of the matrix. This is attributed to enrichment of the matrix in the swirly zones by hafnium, a y’ former. Kotval et al. have shown that the boundaries of the “swirly” zones are enriched in boron (9). (The prominence of the hafnium sidepeak diminishes, owing to homogenization, as repeated DTA tests are made on the same specimen, not shown here). Because this phenomenon extends the y’ precipitation process over a wider temperature range, the peak height of the main y’ precipitation exotherm is progressively reduced by the hafnium additions.
The processing method can have a marked effect on the dissolution and precipitation of y’ in a given alloy. This is illustrated in Figure 15a, which compares heating and cooling thermograms for IN-738 in the cast and powder-metallurgy-consolidated conditions. During heating at 10 C/min, the curve for the PM specimen rises much more sharply during the final stages of y’ dissolution than does that for the cast specimen. This reflects the greater uniformity of composition in the PM material because of the vastly finer dendritic structure in atomized powder particles than in an investment casting. Following
Temperature, 100°C
8 9 10 11 12 13 I* I 8, I I I I I
y’ Precipitation
A Peaks: End of Sohdification
- O%Hf --- 0.5% Hf -- 1.0% Hf ----- 1.5% Hf
I , , I 1 * I 14 16 18 20 22 24
Temperature, lOOoF
Figure 14. Effect of bafnimn additions to IN-738 on the thermograms obtained during cooling after the solid-type specimens had been heated approximately 40 C (70 F) above the incipient-melting point. Hafnimn additions of 1% and 1.5% cause progressively larger sidepeaks at A on the high-temperature side of the main y’ precipitation exoberm, and hafnium additions progressively lower the height of the main exotherm, for reasoru discussed in the text. Cooling rate: -25 C/n&
consolidation, the PM-processed IN-738 is very homogeneous in chemical composition, while the casting is quite segregated. In a sense, the casting can be thought of as a composite of many alloys of closely spaced compositions. The thermogram for the metal of each composition would have a sharp rise to the y’ solvus point, similar to that for a PM sample. Because the curve for each of the aforementioned alloys would be displaced somewhat from the curves for the others, the combined effect of these displaced curves would be to spread out the rising portion of the thermogram near the y’ solvus. Thus, this portion is more than twice as wide for the cast specimen as for the PM specimen, 58 C (105 F) vs 28 C (50 F). (That this portion of the y’ dissolution endotherm for the PM specimen has a fiite width should not be taken as an indication that the specimen retains significant segregation. Even a perfectly homogeneous specimen would have deftite width at this stage, because of the curvature in the y’ solvus surface, as described previously.) Figure 15a reveals a similar effect in the y’ precipitation exothexm of the cooling thermogram. The difference between the two specimens is lower, however, because of some homogenization that occurs in the cast specimen during its excursion above the incipient-melting point. The effect of homogenization may be seen more clearly in Figure 15b. This shows the progressive march to the right of the peak in the y’ precipitation exotherm as one cast specimen is tested during three successive runs. The flow of hardener into the lean areas at the skeleton of each dendrite raises its
(A)
Al
Heating at lO”C/min Cooling at -25Wmir
Y’ SOlVUS
AT
Temperature
(W
Cast IN-738
Temperature
PM IN-736
1212°C
4
1
Figure 15. Effect of processing method on the thermograms of IN-738. (a) The temperature interval (crosshatched band) between the maximum thermal effect and the y’ salvos point is markedly lower, during both heating and cooling, for the PM specimen than for the cast specimen. (b) The peak of the y’ precipitation exotherm during cooling of the cast specimen shifts progressively to higher temperatures during successive DTA tests of the same specimen, because of incremental homogenization. No shift occurs for the PM specimen, because of its high homogeneity.
266

AT
/------113OC(2066F)
Figure 16. Distinct low-temperature melting reaction in Inconel-718, occurring at 1130 C (2066 F) during heating at 10 C/ok. The more-general melting reaction begins at a moderate rate at 1175 C (2147 F), and at a stronger rate at 1223 C (2233 F).
y’ solvus and, hence, shifts the exotherm for the leanest region to higher temperatures. Two successive runs for the PM specimen, however, reveal no shift in the peak, indicating that the starting structure was quite homogeneous.
Knowledge of the temperature marking the very onset of melting is crucial to the control of superalloy processing and utilization. It has long been known that small amounts of liquid play havoc with the workability of superalloys; hot shortness thus causes severe cracking. This severe sensitivity to the presence of a small amount of liquid is undoubtedly aggravated by the “stiffness” and poor thermal conductivity associated with the high alloy content of superalloys. Lack of space does not permit a full exposition here of the limits posed on the workability of superalloys by incipient-melting. The most dramatic example of this effect, however, is presented by Inconel718, for which forging temperatures must be strictly limited to a maximum of 1120 C (2050 F). This is because the 5% Nb content of this alloy causes some eutectic liquid to persist to very low temperatures, at which point Laves phase is formed. During heating at 10 C/mm, DTA reveals a distinct melting reaction in this region at 1130 C (2066 F), Figure 16. The more general melting process begins at a moderate rate at 1175 C (2147 F) and at a stronger rate at 1223 C (2233 F).
The DTA method has been especially valuable in coping with the problem of unwanted partial melting during the solution treating of alloys possessing high y’ solvus temperatures. The difference in width of the so-called heat-treating “window” for solution heat- treating among some familiar alloys is shown in Figure 17, for which the critical temperatures were determined during heating at a very slow rate, 2 C/min, to obtain a realistic assessment of the y’ solvus and incipient-melting temperatures. Alloy IN-loo, with its very low incipient-melting point and high y’ solvus temperature, both caused by high hardener--especially titanium--content, has virtually no window, the width being just 7 C (12 F). Removing 3% Ti from the IN-100 composition, while adding 10% W and replacing 1% V with 1.5% Ta, gives essentially the composition of Mar-M246. Inasmuch as tungsten raises both the y’ solvus temperature and incipient-melting point, the dominant effect is that of removing 3% Ti, which strongly lowers the solvus temperature
130(
2 ,3 i (‘c) E F
12oc
-I IN-100 Mar-M246 MM-Ot
2400
1 MO I’
Figure 17. Effects of main compositional differences behveen well-known alloys on practical y’ solvus temperature and on incipient-melting temperature during heating at 2 C/m& and thus on the width of the solution-heat-nesting “window.” The window is changed most sharply by titanium.
and strongly raises the incipient-melting point. This movement of the two critical temperatures in opposite directions thereby leads to a very wide window--76 C (136 F). Adding about 2% Hf (1.9% in the present study) narrows the window appreciably [to 57 C (103 F)] for the resulting MM-006 alloy, mainly because hafnium raises the solvus temperature significantly. The further substitution of 1.5% Hf for about an equal amount of molybdenum (and slight reduction in hafnium content) leads to the Mar-M247 composition. Because the tantalum addition raises the solvus temperature considerably more than it does the incipient-melting temperature, a significantly narrower window results--43 C (74 F).
Control of the heat-treating window is most crucial for single- crystal superalloys, a class of alloys for which the maximum amount of hardener has been “packed in” to maximize high-temperature strength. Strong melting-point depressants have been replaced, in part, by strengtheners with a milder effect, or that even tend to raise the incipient-melting point, thus permitting a raising of the solvus temperature and/or a widening of the window.
Figure 18 presents DTA results for the state-of-the-art production turbine-blade Alloy Rene N6 (Ni-12.5Co-4.2Cr-1.4Mo-6W-5.9Re- 7.2Ta-5.75Al-O.lSHf-O.OlY) (10) and three other (experimental) single-crystal alloys, all fully heat treated, supplied by GE Aircraft Engines. Though their compositions are proprietary, all experimental alloys are identical in composition, except for having different levels of cobalt, namely, 5, 12.5, and 20%. The critical temperatures obtained by DTA at a heating rate of 4 C/min are shown in Figure 18. Besides presenting the y’ solvus temperature and incipient- melting temperature, the graph shows the temperature at which the maximum thermal effect (minimum in the main endotherm during heating) occurs. This represents the temperature at which the maximum rate of y’ dissolution occurs for each alloy. Also shown, connected to the heating data points by dashed lines, are the temperatures of the corresponding y’ reactions during natural cooling at about 25 C/min, i.e., the start of y’ precipitation, and the maximum thermal effect, representing the maximum rate of y’ formation (peak of the main exotherm). The following observations are noteworthy:
(1) Rent+ N6 has rather high y’ solvus and incipient-melting temperatures, 1299 C (2370 F) and 1340 C (2444 F), respectively, the difference giving it an adequately wide heat-treating window, 41 C (74 F). Alloy X-l has exceptionally high y’ solvus and
267

incipient-melting temperatures, 1340 C (2444 F) and 1372 C (2502 F), respectively, and a 32 C (58 F) window.
(2) Among the three experimental alloys, increasing the cobalt content lowers the y’ solvus temperature sharply and the incipient- melting temperature mildly, thereby widening the window to 46 C (82 F) at 12.5 % Co and to 68 C (122 F) at 20 % Co, intervals that are greater than necessary for ease of solution heat treating. This raises the possibility of increasing the hardener content and strength of these two alloys.
(3) The width of the interval between the temperature of the maximum thermal effect and the y’ solvus temperature during heat- ing provides a useful qualitative indicator of the degree of homogenization in the casting. This is seen in the following comparison of the temperature intervals during heating:
RenC N6 &-J x-2 x-3 X-1.2.3 Avg
17 c 23 C 22 C 20 C 22 c (30 F) (42 F) (39 F) (36 F) (39 F)
The interval for Ren6 N6 is considered to be close to the minimum possible for a fully homogenized alloy, the minimum reflecting the curvature in the y’ solvus surface, as discussed previously. The interval for each of the experimental alloys is significantly wider, the average difference being 5 C (9 F). Similar differences are indicated by the cooling data points of Figure 19. This suggests more segregation in the experimental alloys than in RenC N6. Such a difference was clearly confirmed metallographically, as illustrated in Figure 19, and reflects the longer solution heat treatment that had been used for Rent N6 than for the experimental alloys. This effect is similar to that described earlier for the difference, between cast (segregated) and powder metallurgy (nearly homogeneous) IN-738, with regard to the width of this temperature interval, Figure 15. The foregoing suggests that careful measurement of this interval can be used to monitor the degree or progress of homogenization in nickel- base superalloys.
The solution-heat-treating windows of 24 single-crystal alloys evaluated by the author are presented in Figure 20. Represented are five commercial alloys, including the RenC N6 described above, and 19 proprietary, experimental, or developmental alloys from different sources, including the experimental alloys X-l, X-2, and X-3 described above. The bottom of each bar represents the alloy’s practical y’ solvus temperature, and the top represents the incipient- melting temperature. The bars of Figure 20 reveal quite a large range of y’ solvus temperatures, especially because of the low solvus temperature of MM-002. The widths of the windows vary from about zero to 71 C (127 F). Thus some alloys would be impossible to solution heat treat without incurring incipient melting, while other alloys have excessively wide windows--larger than needed for ease of heat treating--thus indicating the possibility of raising hardener content for the sake of improving high-temperature strength.
Problem-Solving
In the following are given a few examples of how DTA of solid specimens has been used to solve practical problems in the casting of superalloys. The first one has to do with a serious and longstanding hot-tearing problem in the casting of medium-sized Alloy 713C integral turbocharger wheels. A DTA specimen taken from a cracked wheel containing 0.15% Zr revealed the presence of a very-low-melting (about 1100 C [2000 F]) liquid in both the heating and cooling thermograms, as encircled in Figure 21a. Because pockets of high-zirconium constituent were detected near
1400
t I
Ren& N6 J-J X-2 X-3 (5 Co) (12.5 Co) (20 Co)
rk
13ool- t Y’ Solvus 1r-Y / 1 1 1 Maximum ‘;:/ ’
Thermal ‘$b Effect :
1240 1 2300[ “’ 1 ‘ieating Rate: 4”C/min
Figure 18. Critical temperatures of the single-crystal Alloy Renk N6 and three experimental alloys, as determined by DTA during beating at 4 C/min. The window is widened markedly by cobalt. Critical temperatures obtained during natural cooling (-25 C/min) are denoted by solid symbols and are connected lo their corresponding temperatures obtained during heating by dashed lines.
Figure 19. Microstructures of Renk N6 (left) and Expcrimcntal Alloy X-3 (right) in the heat-treated condition. The former alloy exhibits ncgligiblc scgrcgation, while the latter is distinctly cored. The existence of lllis difference was indicated by DTA. 75X.
1400 r t
,,,lM IO 1 0
:n : II: t n n 0 0 + 0
0 O q XC’ .
o t Flene N6 . ’
x-3
T hasair- 00
SRR-99
1200 LZ200 1 MM-002 4
Figure 20. Solution-heat-treating “windows,” reprcscnred by open bars, for 24 experimental and fast-generation single-crystal alloys. State-of-the-art alloy RenC N6 also is shown. Alloys are arranged in order of increasing practical y’ solves temperatures.
268

the crack, test castings made from alloys doped with various levels of zirconium were examined for hot tears. The results show a striking correlation between the incidence of hot tears and zirconium content:
0.09% zr 0% hot tears (0 of 12) 0.15% zr 50% hot tears (6 of 12) 0.19% zr 100% hot tears (12 of 12)
The powerful effect of zirconium in promoting the very-low-melting liquid is seen in the thermograms of Figure 21b, representing unusually high (0.34%) zirconium content in hafnium-modified B-1900; very prominent low-melting reactions (encircled) are evident during heating and cooling. Subsequent control of the zirconium content in the Alloy 713C remelt ingot eliminated the costly hot tearing of the wheels.
Microporosity in castings of IN-100 led to a comparison of good and bad castings by DTA, Figure 22. Perturbations (encircled in Figure 22b) in the thermograms were noted for the most porosity- prone castings. These inflections indicate the presence of y + y’ eutectic. The development of this constituent, and the porosity itself, could have been influenced by a higher-than-normal concentration of nitrogen detected in the porous castings.
A somewhat similar problem of microporosity was observed in castings of MM-002. Both the heating and cooling portions of the thermograms for porous castings, obtained during heating at 2 C/min followed by natural cooling, possessed strong indications of the inflections associated with the y + y’ eutectic constituent. Such inflections are marked B and C in Figure 23. It was noted that the reaction was so strong that it even continued above the incipient- melting point for some castings (not illustrated here). As an indication of the intensity of the reaction, the ratio of the height of the eutectic y’ inflections (B and C) to the height of the main endothenn/exotherm for the dissolution/precipitation, respectively, of matrix y’ marked A and D, respectively, are as follows:
Ratio Sound Casting B/A, Heating 0.49 C/D, Cooling C/D 0.15
Porous 3.27 0.24
Ratios are smaller during cooling, partly because of partial absorption of the eutectic y’ by the matrix during the hottest part of the DTA test. Nevertheless, it is seen that higher ratios are associated with, and apparently indicative of, the tendency toward excessive microporosity.
Summary
Differential thermal analysis (DTA) performed on specimens of more than 200 model, experimental, developmental, and commercial nickel-base superalloys, using large specimens with internally positioned thermocouples, has revealed much useful information about the critical phase changes and microstructures governing the processing and performance of this important class of alloys.
Studies of eight Ni-15Cr-IOCo-SMo-C-Al-Ti-Ta model alloys during melting and solidification show that the carbide eutectic reaction occurs at very low temperatures in the absence of a strong carbide former, and that carbide formation occurs progressively earlier in the solidification process as the quantities of strong carbide-forming reactants increase, an alloy with O.l6C-3Al-3Ti-6Ta forming carbides well before (75 C [135 F] above) the start of metallic dendrite formation. The specific effects (per 1 wt pet) of aluminum, titanium, and tantalum on liquidus temperature during solidification are
AT
(4
--9- L’
Figure 21. Thermograms illwtnting the use of DTA to identify the cause of hot tearing in Alloy 713C turbocharger wheel castings. (a) Small inflections A and B in the heating and cooling thermograms, respectively, for only the cracked castings suggested that low-melting liquid caused by zirconium was responsible. (b) The powerful effect of zirconium in promoting such low-melting liquid is seen in these thermograms of modified B-1900 containing 1.35% Hf and 0.34% Zr, which have very prominent indications of low-melting liquid (encircled).
AT
Temperature
Figure 22. Thermograms for IN-100 castings having low and high amounts of porosity. The encircled inflections related to the y + y’ eutectic constiment were found only in castings of high porosity.
Temperature
Figure 23. Thermograms for MM-002 castings having low and high amounts of porosity. Both castings bad strong DTA indications of the y + y’ eutectic reaction, but porosity was worse in those castings with higher B/A and C/D ratios, denoting more of the y + y’ constituent.
269

presented. Solidification ranges, and alloying effects thereon, of some well-known commercial alloys are given.
Measurements of y’ solvus temperature (for matrix precipitate and for eutectic y’) and of incipient-melting temperature are best performed on large solid specimens with internal thermocouple contact, giving direct and precise indications of these critical temperatures and providing other useful information as well. Features of thermograms were identified by calibration studies of thin bars of four cast alloys heated at 10 C/min in a thermal gradient furnace and quenched, and of 35 small disc specimens of various cast alloys quenched from the DTA furnace at temperatures corresponding to various points on heating and especially on cooling thermograms. Indicated y’ solvus temperatures decrease moderately as heating rate decreases; values determined at 2 C/min agree closely with those for practical 2-hour annealing and soaking treatments. Guided by the above results, the effects of alloying elements and of processing on y’ solvus and/or incipient-melting temperatures of alloys are presented. Of special interest is the unique ability of DTA to directly and precisely reveal the width of the temperature interval, or “window,” for the solution heat treating of single-crystal alloys; windows ranging from essentially zero to 71 C (127 F) in width are reported.
Examples are presented of using DTA to solve costly problems of hot tearing and excessive microporosity in castings.
In the 28 years since y’ solvus temperatures were fast measured by DTA, this technique has established itself widely in the superalloy industry, owing to its great utility in monitoring the critical phase changes that are important in the metallurgical development and process-control of superalloys. The value of DTA in the metallurgy of superalloys already is considered by the author to be at least as great as that of dilatometry in the metallurgy of transformable and hardenable steels. Hopefully, the results described herein may further advance the usefulness of DTA in the metallurgy of superalloys.
Acknowledgements
The author is deeply indebted to: W.T. Loomis, whose doctoral research created the opportunity for discovering that y’ solvus temperatures could be measured directly by DTA; G.A. Timmons, D.V. Doane, and the late M. Semchyshen, for maintaining financial support for DTA studies; W.P. Danesi, R.G. Dunn, and C.C. Clark, for providing many interesting sample sets of superalloys for DTA analysis; W.S. Walston, for supplying single-crystal alloys; W.C. Hagel, W.J. Boesch, D.R. Muzyka, C.R. Whitney, J.A. Petrusha, J.H. Wood. L.S. Taylor, P.D. Spilling, G.L. Erickson, J. Domingue, R. Egbert, and the late G.E. Marshall, for enlightening discussions; R.C. Binns, D.E. Schumacher, E.K. Ohriner, M.C. LaPine, R.R. Lannin, and R.W. McConnell, for assistance with DTA experiments; and D.J. Kruzich, KS. Smalinskas, D.J. Pipe, and M.S. Snell for assistance in manuscript preparation. The author is most indebted to, and dedicates this paper to his wife Mary, a “DTA widow” on too many nights and weekends, for her considerable patience and steadfast support throughout the very long research stage and the preparation of the manuscript, adding immeasurably to the success of this endeavor.
1.
2.
3.
4.
5.
6.
7.
8.
9.
References
H. LeChatelier, “The Action of Heat on Clays,” Compt. rend. 104 (1887), pp. 1443-46.
W.C. Roberts-Austen, “Fifth Report to the Alloys Research Committee,” Proc. Inst. Mech. Engrs. (London) 1 (1899), pp. 35-102.
D.L. Sponseller, W.G. Scholz, and D.F. Rundle, “Development of Low-Alloy Ductile Irons for Service at 1200-1500 F,” AFS Transactions 76 (1968), pp. 353-68.
W.T. Loomis, J.W. Freeman, and D.L. Sponseller, “The Influence of Molybdenum on the y’ Phase in Experimental Nickel-Base Superalloys,” Metallurgical Transactions 3 (1972), pp. 989-1000.
D.L. Sponseller, “Differential Thermal Analysis of Superalloys,” presented at the session Physical Metallurgy of Superalloys,” ASM/AIME Materials Science Symposium, Ott 21-24, 1974, Detroit, MI.
D.L. Sponseller, “Use of Differential Thermal Analysis in the Melting, Casting, and Heat Treating of Superalloys,” presented at the 1975 Vacuum Metallurgy Conference, June 23-25, 1975, Columbus, OH.
Y. Zhu, S. Zhang, T. Zhang, J. Zhang, Z. Ku, X. Xie, and C. Shi, “A New Way to Improve the Superalloys,” Superalloys 1992, pp. 145-154.
G.E. Maurer, J. Domingue, and W.J. Boesch, “Superalloy Design with Differential Thermal Analysis,” Proceedings of the 27th Annual Meeting of the Investment Casting Institute (1979), Rosemont, IL, pp. 16:01-1623.
P.S. Kotval, J.D. Venables, and R.W. Calder, “The Role of Hafnium in Modifying the Microstructure of Cast Nickel-Base Superalloys,” Metallurgical Transactions 3 (1972), pp. 453-458.
10. W.S. Walston, E.W. Ross, KS. G’Hara, T.M. Pollock, and W.H. Murphy, U.S. Patent 5,455,120, “Nickel-Base Superalloy and Article with High-Temperature Strength and Improved Stability,” Rene N6, 1995.
270