differential amplification of gene expression in ... - chibi · differential amplification of...
TRANSCRIPT

Differential Amplification of Gene Expression in LensCell Lines Conditioned to Survive Peroxide Stress
Abraham Spector,1 Dayu Li,1,2 Wanchao Ma,1,2 Fang Sun,1 and Paul Pavlidis3
PURPOSE. The response of lens systems to oxidative stress isconfusing. Antioxidative defense systems are not mobilized asexpected, and unanticipated defenses appear important.Therefore, mouse lens cell lines conditioned to survive differ-ent peroxide stresses have been analyzed to determine theirglobal changes in gene expression.
METHODS. The immortal mouse lens epithelial cell line �TN4-1was conditioned to survive 125 �M H2O2 (H cells) or a com-bination of both 100 �M tertiary butyl hydroperoxide (TBHP)and 125 �M H2O2 (HT cells), by a methodology previouslydescribed. The total RNA was isolated from the different celllines and analyzed with oligonucleotide mouse expression mi-croarrays. Four microarrays were used for each cell line. Mi-croarray results were confirmed by real-time RT-PCR.
RESULTS. A new cell line resistant to both 125 �M H2O2 and 100�M TBHP was developed, because cells resistant to H2O2 werekilled by TBHP. Analysis of classic antioxidative enzyme activ-ities showed little change between cells that survive H2O2 (H)and those that survive H2O2 and TBHP (HT). Therefore, theglobal change in gene expression in these cell lines was deter-mined with gene expression microarrays. The fluorescent sig-nal changes of the genes within the three cell lines, H, HT, andcontrol (C), were analyzed by statistical methods includingTukey analysis. It was found that from the 12,422 gene frag-ments and expressed sequence tags (ESTs) analyzed—basedon a one-way ANOVA with a stringent cutoff of one falsepositive per 1000 genes and correcting for microarray back-ground and noise—approximately 950 (7.6%) genes had asignificant change in expression in comparing the C, H, and HTgroups. A small group of antioxidative defense genes werefound in this population, including catalase, members of theglutathione (GSH)-S-transferase family, NAD(P)H menadioneoxidoreductase 1, and the ferritin light chain. The remaininggenes are involved in a broad spectrum of other biologicalsystems. In the HT versus H comparison, only a few geneswere found that had increased expression in the HT linecompared with expression in the H line, including GSH-S-transferase alpha 3 and hephaestin. Many genes that are fre-quently considered antioxidative defense genes, includingmost of the GSH peroxidases, unexpectedly showed littlechange.
CONCLUSIONS. An unusual and generally unexpected smallgroup of antioxidative defense genes appear to have increasedexpression in response to H2O2 stress. Cell lines resistant toH2O2 do not appear to survive challenge with another type ofperoxide, TBHP, a lipid peroxide prototype. However, acqui-sition of TBHP resistance by H cells was found to be accom-panied by significantly amplified expression of only a fewadditional antioxidative defense genes. Many of the amplifiedgenes do not appear to be involved with antioxidative systems,reflecting the complexity of the cells’ response to oxidativestress. (Invest Ophthalmol Vis Sci. 2002;43:3251–3264)
There is a large literature relating oxidative stress to a varietyof diseases,1,2 such as cardiovascular,3,4 intestinal,5 pulmo-
nary,6 mitochondrial,7 and neurodegenerative disease,8 includ-ing Alzheimer’s disease 9 and Parkinson’s disease.10 Thus, it isnot surprising that, when the eye is subjected to oxidativestress, cataract develops in the lens, which is in a low-oxygenenvironment and has only a single layer of actively metaboliz-ing epithelial cells.11–18
It has been shown that H2O2 is elevated in the aqueous,vitreous, and lenses in eyes of patients with maturity-onsetcataract,19–21 and this increase correlates with extensive oxi-dation of lens components.11,22–24 Furthermore, H2O2 cancause opacification of the lens in organ culture at concentra-tions found in patients with cataract.17,25
To investigate the response to peroxide stress is complex.The lens contains only a single layer of epithelial cells, wheremost of the metabolic activity resides and a few layers of newlyformed fiber cells that still have the biological machinery tomake new protein directed by DNA. It is this thin layer of cellsthat is primarily responsible for the organ’s defense againstoxidative stress. Even this situation is complex, however, inthat the cells in the vicinity of the visual axis do not divide; butmoving toward the equator, there is a zone in which celldivision occurs, and finally, in the bow region, terminal differ-entiation is initiated, generating the formation of the fiber cellsand the gradual disintegration of the protein synthesizing ap-paratus. Each cell type would be expected to respond in aunique manner to oxidative stress. Furthermore, the cellularresponse is not simple, involving shutting down some meta-bolic systems, increasing energy production, stimulating DNArepair systems, activating programmed apoptosis in some cellsand stimulating the mobilization of antioxidative defenses. Tosort out from this complex and time-dependent variation ofgene expression and other mechanisms for modifying cellbiology, those genes that specifically are capable of protectingthe cell so that it can survive the stress is difficult at best.
Another approach is to investigate a homogeneous immor-tal cell type, such as the immortal murine lens epithelial cellline �TN4-1. Unlike primary lens cell cultures, there are rela-tively few changes from one generation to another. Geneexpression is relatively constant. Therefore, this cell line hasbeen conditioned to survive peroxide stress.
However, the relationship to the lens of the simian virus(SV)40–transformed cells and their conditioned progenyshould be considered. Even though the conditioned cells retainmorphologic and cell growth features similar to those of un-
From the 1Department of Ophthalmology and the 3ColumbiaGenome Center, Columbia University, New York, New York.
2Contributed equally to this work.Supported by grants from the National Eye Institute, Research to
Prevent Blindness, Research to Cure Cataract Foundation, and theDepartment of Ophthalmology, Columbia University.
Submitted for publication August 27, 2001; revised April 30, 2002;accepted June 5, 2002.
Commercial relationships policy: N.The publication costs of this article were defrayed in part by page
charge payment. This article must therefore be marked “advertise-ment” in accordance with 18 U.S.C. §1734 solely to indicate this fact.
Corresponding author: Abraham Spector, Department of Ophthal-mology, Columbia University, 630 West 168th Street, New York, NY10032; [email protected].
Investigative Ophthalmology & Visual Science, October 2002, Vol. 43, No. 10Copyright © Association for Research in Vision and Ophthalmology 3251

conditioned cells and their appearance is not significantly dif-ferent from lens cell cultures, their cell biology is clearlydifferent.26 This is also true of primary lens cell cultures, whichlose many of their lens characteristics with passage. In thisinvestigation, genes were found that were not expressed inunconditioned cell lines but were activated in the conditionedcell preparations. It would be expected that conditioned cellswould have modified gene expression precisely to survive theirnew environment. The immortal cells also have been modifiedto take on characteristics required for eternal life. Thus, caninformation obtained from such modified cells be applied tothe lens systems? The definitive answer cannot be forthcominguntil the antioxidative defenses of the conditioned cell lineshave been defined and the lens, enriched with such defenses,challenged with oxidative stress. If the lens remains transpar-ent, then the exercise has been successful. However, it shouldbe noted that work with other immortal cell systems such asMDCK,27,28 COS,29,30 CHO,31,32 HeLa,33,34 and 3T335,36 arewidely used based on the assumption that biological systemsare basically similar and that observations made in widelydivergent cell types are applicable to each other. Furthermore,in these systems, this assumption has been confirmed repeat-edly.
Analysis of the H2O2-conditioned cells indicated that notonly were H2O2 detoxification systems amplified but repairsystems appeared more effective.26 The unexpected findingthat some GSH-S-transferases were markedly increased in activ-ity and that catalase and not GSH peroxidase appeared to bethe major H2O2-degrading enzyme indicated that our under-standing of how the cell defends itself against H2O2 stress isincomplete. Therefore, to find the key genes involved withantioxidative defense, a global approach is required. The biol-ogy of the cell is controlled by gene expression. Thus, areasonable rationale to assess modification in cell biology re-sulting from H2O2 conditioning is to determine changes ingene expression. Modification of gene expression in responseto H2O2 stress has previously been shown for selectivegenes,37–39 but the entire genome has not been analyzed.
In the present work, murine expression high-density mi-croarrays (Affymetrix, Santa Clara, CA), containing probe setsfor approximately 12,400 gene fragments and expressed se-quence tags (ESTs), were used to determine differential modi-fication of gene expression in H2O2-conditioned cells (H line)and cells conditioned with both H2O2 and a lipid peroxideprototype, tertiary butyl hydroperoxide (TBHP), the HT line.We first determined that the array analysis is reliable. Then,using a rigorous statistical level of stringency (one false-positiveselection in 1000 genes), we compared mRNA from four inde-pendent preparations of control cells (C cells) with four inde-pendent preparations from both the H and HT lines. An un-usual group of antioxidative genes were found to havesignificant changes in expression. A few other interesting an-tioxidative defense genes with higher probabilities of errorwere also examined.
MATERIALS AND METHODS
Cell Conditioning
�TN4-1, an immortal murine lens epithelial cell line, generously pro-vided by Paul Russell, National Eye Institute (Bethesda, MD), was usedin all work. The H2O2-conditioned cells (H) were prepared as previ-ously described.26 The cells conditioned to withstand both an H2O2
and a TBHP stress (HT cells) were prepared in a similar manner. Briefly,approximately 200,000 cells were subcultured in a 35-mm dish in 2 mLminimum essential medium (MEM, cat. no. 41500-034; Gibco BRL,Grand Island, NY), supplemented with NaHCO3, 2.2 g/L medium (pH7.2); 100 U penicillin and 100 �g streptomycin/mL medium (cat. no.
1540-122; Gibco BRL); Fungizone, 2.5 mg/L medium (cat. no. 15295-017); and fetal bovine serum (cat. no. SH30070.02; Hyclone, Logan,UT) to give a final concentration of 10%. This is the standard medium.After overnight incubation at 37°C in 5% CO2, the medium was re-placed with 4 mL standard medium containing 125 �M H2O2 andvarious concentrations of TBHP. Every 24 hours, additional aliquots ofH2O2 and TBHP were added to give the desired concentration. Culturemedium was changed every 3 days. Cells were subcultured when theywere approximately 80% confluent and after approximately 16 hourswere again exposed to the peroxides. During a period of a few months,the TBHP concentration was gradually increased from a starting con-centration of 25 �M to a final concentration of 100 �M, whereas theH2O2 concentration was maintained at 125 �M. H cells and C cellswere maintained in an identical manner with 125 �M H2O2 or instandard medium, respectively. Cell viability was determined by cellcounting and trypan blue staining, as previously described.26
Enzyme Assays
All enzyme assays were conducted by methodologies previously de-scribed.26
Isolation of Total RNA
Total RNA was isolated from 1 � 107 cells removed from 80% conflu-ent cultures using an RNA isolation kit (cat. no. 74104; RNeasy MiniKit, Qiagen, Valencia, CA).
Preparation of cRNA
Approximately 30 �g total RNA was used to prepare double-strandedcDNA using a commercial system (SuperScript Choice; Gibco BRL) anda T7-(dT)24 primer: 5�-GGCCAGTGAATTGTAATACGACTCACTATA-GGGAGGCGG-(dT)24-3� for first-strand cDNA synthesis. After synthesisof the second-strand cDNA, the double-stranded cDNA was then puri-fied with Phase Lock Gels (Brinkmann Instruments, Inc., Boulder, CO),phenol-chloroform extraction and ethanol precipitation. An RNA tran-script labeling kit (product code 42655; Enzo Diagnostic, Inc., Farming-dale, NY) was then used to prepare a biotin-labeled cRNA. The cRNA waspurified using a spin column (RNeasy; Qiagen) followed by ethanolprecipitation. The cRNA was quantified and examined by gel electro-phoresis. The cRNA was then fragmented at 94°C for 35 minutes.
Gene Microarray Analysis
The use of oligonucleotide expression microarrays (Affymetrix) is nowa frequently used methodology for determining gene expression. Themethodology has been described in numerous publications.40–42
Briefly, the fragmented biotin-labeled cRNA was hybridized to a mouseexpression microarray (MG-U74A Ver. 2; Affymetrix), at the GenomeCenter of the College of Physicians and Surgeons, Columbia University,and stained with streptavidin phycoerythrin. The hybridized compo-nents were detected by fluorescence laser scanning and confocallocalization and then analyzed on computer (Microarray Suite, ver. 5.0,Affymetrix; and Excel; Microsoft, Redmond, WA). Each microarraycontained two groups of approximately 16 twenty-five–residue oligo-nucleotides for each of the 12,422 probe sets and ESTs as well asinternal standards. Each member of one group was a perfect compli-mentary match for a particular segment of a given gene fragment orEST. The second group contained a single base mismatch in the middleof each of the oligos. Thus, one probe set contains approximately 32oligonucleotides for each gene fragment or EST, giving a total of over400,000 oligonucleotides plus standards on the microarray. The oligo-nucleotides for each gene fragment are distributed on the microarrayand collated by computer for further analysis.
It should be noted that in some cases, there is more than one probeset for the same gene. The probe sets recognize different sections ofthe gene, including up and down stream and splicing regions. In suchcases, there may be considerable differences in hybridization and, thus,the recognized expression of the gene. In most cases, only probe sets
3252 Spector et al. IOVS, October 2002, Vol. 43, No. 10

showing the strongest fluorescent signal intensities were used. Theactual fluorescent signal levels and present, absent, and marginal callsdetermined by the software program for each of the 12,422 probe setsin each of four control (C), four H2O2-conditioned (H) and fourH2O2�TBHP–conditioned (HT) microarrays are shown in electronicfolder 1, available at http://www.iovs.org/cgi/content/full/43/10/3251/DC1. ANOVA values reflecting the probability of a significantchange in expression in the peroxide-conditioned cell lines in compar-ison to the control group are given in electronic folder 2, available athttp://www.iovs.org/cgi/content/full/43/10/3251/DC1. The genes areranked on the basis of probability. Average signal ratios and Tukeyevaluations for the first thousand genes are also presented. The probesets are identified by Affymetrix numbers as well as by GenBank andUnigene accession numbers (GenBank and Unigene are provided in thepublic domain by the National Center for Biotechnology Information,Bethesda, MD, and are available at http://www.ncbi.nlm.nih.gov).
Analyses were performed on total RNA isolated from the C, H, orHT lines. For each line, four independently isolated RNA samples wereused, each containing approximately 30 �g. Data from each microarraywere scaled to give an overall equivalent fluorescence intensity andminimize variation. Average intensity was set at 250. For same–samecomparisons, the array with the higher scaling factor was always usedas the baseline. The gene array software generates a difference call
based on the fluorescence intensities of the perfect match oligos versustheir mismatch partners and also minimizes high and low fluorescenceintensities, using the Tukey biweight analysis, thus, correcting for fluores-cence intensities above the linear range or where the signal is initiallybelow detection. If no artifacts were introduced in the preparation of themicroarray, in the hybridization, or in the scaling, then there should be nodifference in expression in same–same probe set comparisons.
Figure 1 shows typical scatter graphs in which the signal intensitiesof all genes on two arrays are plotted against each other. In Figure 1A,a comparison between two control arrays is shown. In theory, thereshould be no difference in signal intensity of a given probe set in thetwo arrays, and all points should fall on a line delineated by a ratio of1. Indeed, the red dots delineating the probe sets present in both arrayswere clustered around the no-difference line (a ratio of 1), the cluster-ing becoming tighter as the signal intensity increases. The yellow spotsdenote probe sets with which the expression was marginal or have anabsent call in both arrays. These probe sets were generally in thelower-signal-intensity range. Finally, the blue spots represent probesets for which the detection call indicated the presence of the probe inone of the two arrays. The other lines indicate the ratio of the probe setintensities. The outermost lines, both above and below the ratio � 1line, represent a ratio of four, the next lines 3 and the innermost lines2. Most of the red dots fall within the twofold zone.
FIGURE 1. Typical scatterplots of the microarray signal intensity of 12,422 genes and ESTs. (A) Comparison of two arrays prepared from the C line.(B) Comparison of two arrays, one prepared from the H line and the other from the C line. If there is no change in expression, a ratio of 1 wouldbe found. This is indicated on the graph by the line labeled 1. The outer lines indicate a � fourfold change in signal intensity. Lines showing a �three- and a � twofold change are also presented. Red points: gene expression present in both arrays; blue points: marginal or absent calls basedon software analysis in one array; yellow points: signals that are marginal or have an absent call in both arrays.
IOVS, October 2002, Vol. 43, No. 10 Differential Amplification of Gene Expression 3253
In contrast, a typical H versus C comparison (Fig. 1B) indicated abroad scattering of the signal ratios, both above and below the ratio �1 line. Again, most of the probe sets had changes in the ratio of signalintensity of less than 2. The results indicate that stress caused a largenumber of changes in gene expression. However, how many of themwere real is questionable.
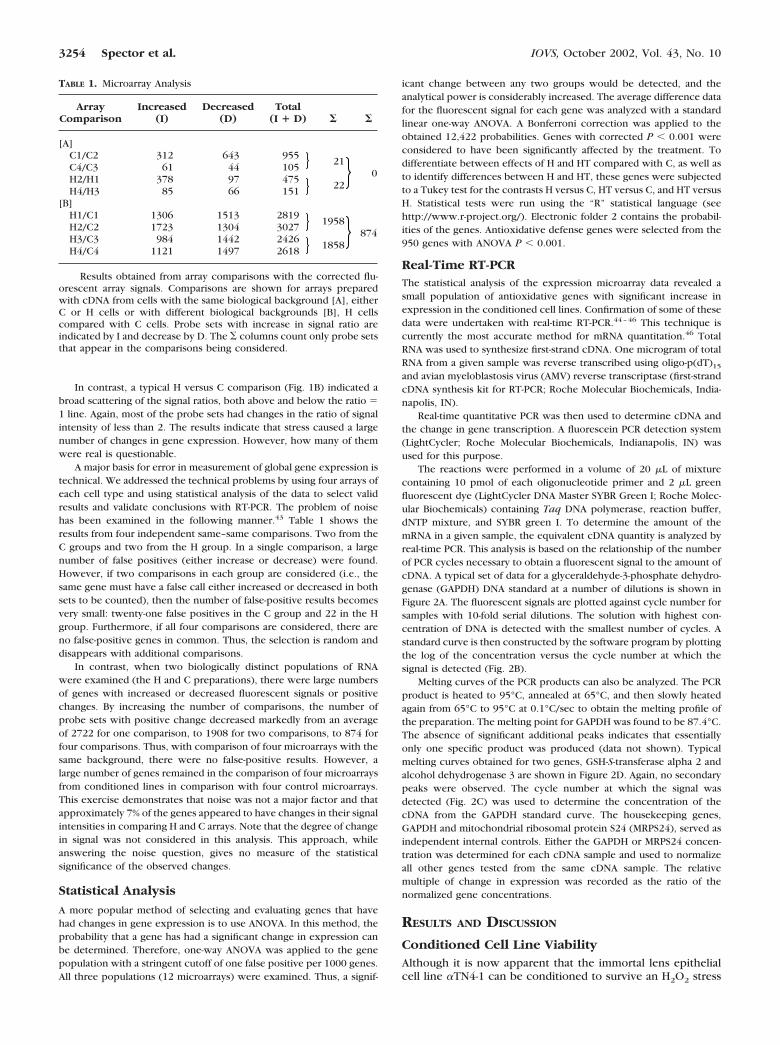
A major basis for error in measurement of global gene expression istechnical. We addressed the technical problems by using four arrays ofeach cell type and using statistical analysis of the data to select validresults and validate conclusions with RT-PCR. The problem of noisehas been examined in the following manner.43 Table 1 shows theresults from four independent same–same comparisons. Two from theC groups and two from the H group. In a single comparison, a largenumber of false positives (either increase or decrease) were found.However, if two comparisons in each group are considered (i.e., thesame gene must have a false call either increased or decreased in bothsets to be counted), then the number of false-positive results becomesvery small: twenty-one false positives in the C group and 22 in the Hgroup. Furthermore, if all four comparisons are considered, there areno false-positive genes in common. Thus, the selection is random anddisappears with additional comparisons.
In contrast, when two biologically distinct populations of RNAwere examined (the H and C preparations), there were large numbersof genes with increased or decreased fluorescent signals or positivechanges. By increasing the number of comparisons, the number ofprobe sets with positive change decreased markedly from an averageof 2722 for one comparison, to 1908 for two comparisons, to 874 forfour comparisons. Thus, with comparison of four microarrays with thesame background, there were no false-positive results. However, alarge number of genes remained in the comparison of four microarraysfrom conditioned lines in comparison with four control microarrays.This exercise demonstrates that noise was not a major factor and thatapproximately 7% of the genes appeared to have changes in their signalintensities in comparing H and C arrays. Note that the degree of changein signal was not considered in this analysis. This approach, whileanswering the noise question, gives no measure of the statisticalsignificance of the observed changes.
Statistical Analysis
A more popular method of selecting and evaluating genes that havehad changes in gene expression is to use ANOVA. In this method, theprobability that a gene has had a significant change in expression canbe determined. Therefore, one-way ANOVA was applied to the genepopulation with a stringent cutoff of one false positive per 1000 genes.All three populations (12 microarrays) were examined. Thus, a signif-
icant change between any two groups would be detected, and theanalytical power is considerably increased. The average difference datafor the fluorescent signal for each gene was analyzed with a standardlinear one-way ANOVA. A Bonferroni correction was applied to theobtained 12,422 probabilities. Genes with corrected P � 0.001 wereconsidered to have been significantly affected by the treatment. Todifferentiate between effects of H and HT compared with C, as well asto identify differences between H and HT, these genes were subjectedto a Tukey test for the contrasts H versus C, HT versus C, and HT versusH. Statistical tests were run using the “R” statistical language (seehttp://www.r-project.org/). Electronic folder 2 contains the probabil-ities of the genes. Antioxidative defense genes were selected from the950 genes with ANOVA P � 0.001.
Real-Time RT-PCRThe statistical analysis of the expression microarray data revealed asmall population of antioxidative genes with significant increase inexpression in the conditioned cell lines. Confirmation of some of thesedata were undertaken with real-time RT-PCR.44–46 This technique iscurrently the most accurate method for mRNA quantitation.46 TotalRNA was used to synthesize first-strand cDNA. One microgram of totalRNA from a given sample was reverse transcribed using oligo-p(dT)15
and avian myeloblastosis virus (AMV) reverse transcriptase (first-strandcDNA synthesis kit for RT-PCR; Roche Molecular Biochemicals, India-napolis, IN).
Real-time quantitative PCR was then used to determine cDNA andthe change in gene transcription. A fluorescein PCR detection system(LightCycler; Roche Molecular Biochemicals, Indianapolis, IN) wasused for this purpose.
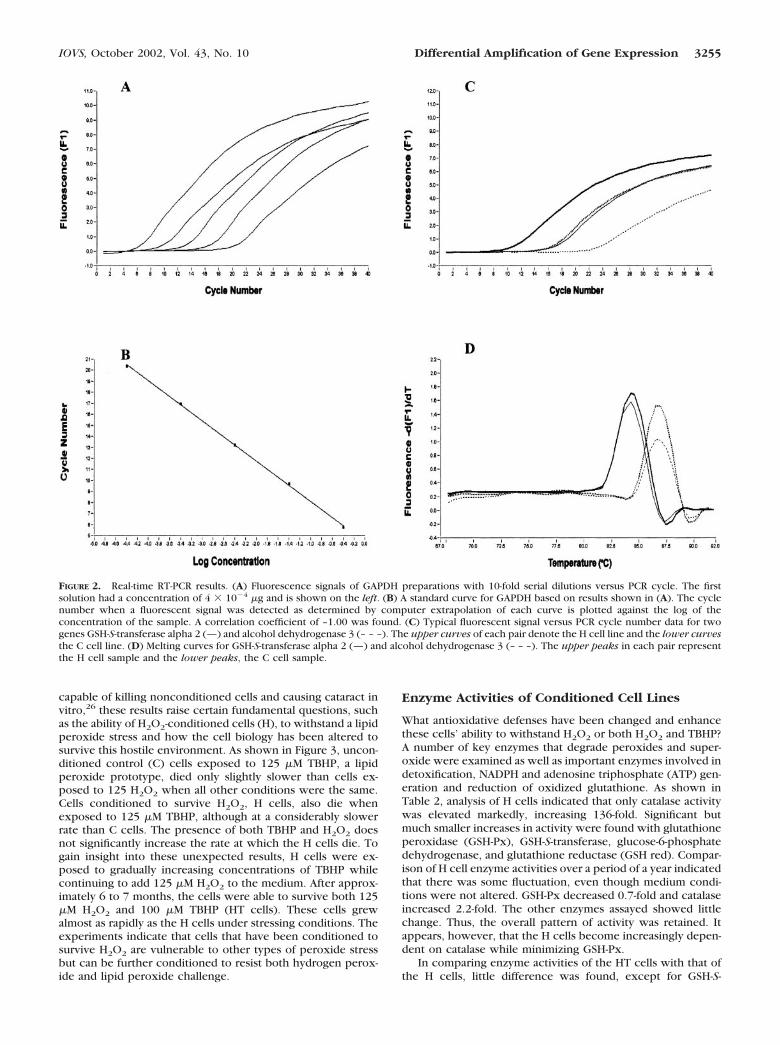
The reactions were performed in a volume of 20 �L of mixturecontaining 10 pmol of each oligonucleotide primer and 2 �L greenfluorescent dye (LightCycler DNA Master SYBR Green I; Roche Molec-ular Biochemicals) containing Taq DNA polymerase, reaction buffer,dNTP mixture, and SYBR green I. To determine the amount of themRNA in a given sample, the equivalent cDNA quantity is analyzed byreal-time PCR. This analysis is based on the relationship of the numberof PCR cycles necessary to obtain a fluorescent signal to the amount ofcDNA. A typical set of data for a glyceraldehyde-3-phosphate dehydro-genase (GAPDH) DNA standard at a number of dilutions is shown inFigure 2A. The fluorescent signals are plotted against cycle number forsamples with 10-fold serial dilutions. The solution with highest con-centration of DNA is detected with the smallest number of cycles. Astandard curve is then constructed by the software program by plottingthe log of the concentration versus the cycle number at which thesignal is detected (Fig. 2B).
Melting curves of the PCR products can also be analyzed. The PCRproduct is heated to 95°C, annealed at 65°C, and then slowly heatedagain from 65°C to 95°C at 0.1°C/sec to obtain the melting profile ofthe preparation. The melting point for GAPDH was found to be 87.4°C.The absence of significant additional peaks indicates that essentiallyonly one specific product was produced (data not shown). Typicalmelting curves obtained for two genes, GSH-S-transferase alpha 2 andalcohol dehydrogenase 3 are shown in Figure 2D. Again, no secondarypeaks were observed. The cycle number at which the signal wasdetected (Fig. 2C) was used to determine the concentration of thecDNA from the GAPDH standard curve. The housekeeping genes,GAPDH and mitochondrial ribosomal protein S24 (MRPS24), served asindependent internal controls. Either the GAPDH or MRPS24 concen-tration was determined for each cDNA sample and used to normalizeall other genes tested from the same cDNA sample. The relativemultiple of change in expression was recorded as the ratio of thenormalized gene concentrations.
RESULTS AND DISCUSSION
Conditioned Cell Line ViabilityAlthough it is now apparent that the immortal lens epithelialcell line �TN4-1 can be conditioned to survive an H2O2 stress
TABLE 1. Microarray Analysis
ArrayComparison
Increased(I)
Decreased(D)
Total(I � D) � �
[A]C1/C2 312 643 955
210
C4/C3 61 44 105H2/H1 378 97 475
22H4/H3 85 66 151
[B]H1/C1 1306 1513 2819
1958874
H2/C2 1723 1304 3027H3/C3 984 1442 2426
1858H4/C4 1121 1497 2618
Results obtained from array comparisons with the corrected flu-orescent array signals. Comparisons are shown for arrays preparedwith cDNA from cells with the same biological background [A], eitherC or H cells or with different biological backgrounds [B], H cellscompared with C cells. Probe sets with increase in signal ratio areindicated by I and decrease by D. The � columns count only probe setsthat appear in the comparisons being considered.
3254 Spector et al. IOVS, October 2002, Vol. 43, No. 10
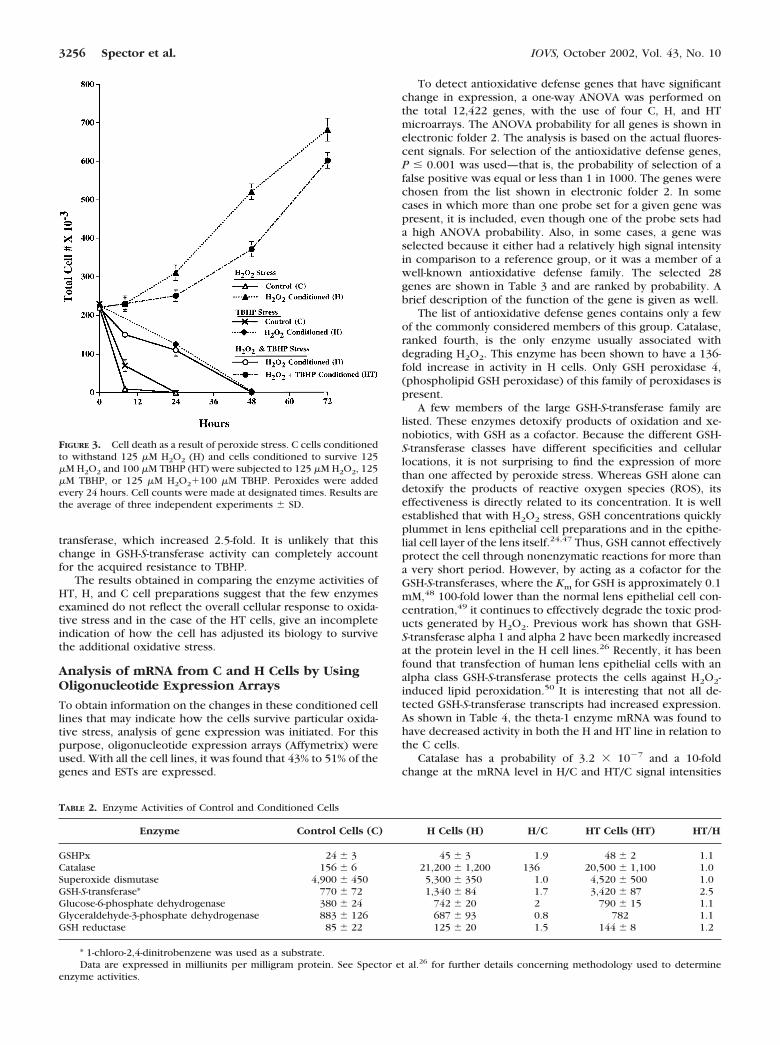
capable of killing nonconditioned cells and causing cataract invitro,26 these results raise certain fundamental questions, suchas the ability of H2O2-conditioned cells (H), to withstand a lipidperoxide stress and how the cell biology has been altered tosurvive this hostile environment. As shown in Figure 3, uncon-ditioned control (C) cells exposed to 125 �M TBHP, a lipidperoxide prototype, died only slightly slower than cells ex-posed to 125 H2O2 when all other conditions were the same.Cells conditioned to survive H2O2, H cells, also die whenexposed to 125 �M TBHP, although at a considerably slowerrate than C cells. The presence of both TBHP and H2O2 doesnot significantly increase the rate at which the H cells die. Togain insight into these unexpected results, H cells were ex-posed to gradually increasing concentrations of TBHP whilecontinuing to add 125 �M H2O2 to the medium. After approx-imately 6 to 7 months, the cells were able to survive both 125�M H2O2 and 100 �M TBHP (HT cells). These cells grewalmost as rapidly as the H cells under stressing conditions. Theexperiments indicate that cells that have been conditioned tosurvive H2O2 are vulnerable to other types of peroxide stressbut can be further conditioned to resist both hydrogen perox-ide and lipid peroxide challenge.
Enzyme Activities of Conditioned Cell Lines
What antioxidative defenses have been changed and enhancethese cells’ ability to withstand H2O2 or both H2O2 and TBHP?A number of key enzymes that degrade peroxides and super-oxide were examined as well as important enzymes involved indetoxification, NADPH and adenosine triphosphate (ATP) gen-eration and reduction of oxidized glutathione. As shown inTable 2, analysis of H cells indicated that only catalase activitywas elevated markedly, increasing 136-fold. Significant butmuch smaller increases in activity were found with glutathioneperoxidase (GSH-Px), GSH-S-transferase, glucose-6-phosphatedehydrogenase, and glutathione reductase (GSH red). Compar-ison of H cell enzyme activities over a period of a year indicatedthat there was some fluctuation, even though medium condi-tions were not altered. GSH-Px decreased 0.7-fold and catalaseincreased 2.2-fold. The other enzymes assayed showed littlechange. Thus, the overall pattern of activity was retained. Itappears, however, that the H cells become increasingly depen-dent on catalase while minimizing GSH-Px.
In comparing enzyme activities of the HT cells with that ofthe H cells, little difference was found, except for GSH-S-
FIGURE 2. Real-time RT-PCR results. (A) Fluorescence signals of GAPDH preparations with 10-fold serial dilutions versus PCR cycle. The firstsolution had a concentration of 4 � 10�4 �g and is shown on the left. (B) A standard curve for GAPDH based on results shown in (A). The cyclenumber when a fluorescent signal was detected as determined by computer extrapolation of each curve is plotted against the log of theconcentration of the sample. A correlation coefficient of –1.00 was found. (C) Typical fluorescent signal versus PCR cycle number data for twogenes GSH-S-transferase alpha 2 (—) and alcohol dehydrogenase 3 (– – –). The upper curves of each pair denote the H cell line and the lower curvesthe C cell line. (D) Melting curves for GSH-S-transferase alpha 2 (—) and alcohol dehydrogenase 3 (– – –). The upper peaks in each pair representthe H cell sample and the lower peaks, the C cell sample.
IOVS, October 2002, Vol. 43, No. 10 Differential Amplification of Gene Expression 3255
transferase, which increased 2.5-fold. It is unlikely that thischange in GSH-S-transferase activity can completely accountfor the acquired resistance to TBHP.
The results obtained in comparing the enzyme activities ofHT, H, and C cell preparations suggest that the few enzymesexamined do not reflect the overall cellular response to oxida-tive stress and in the case of the HT cells, give an incompleteindication of how the cell has adjusted its biology to survivethe additional oxidative stress.
Analysis of mRNA from C and H Cells by UsingOligonucleotide Expression Arrays
To obtain information on the changes in these conditioned celllines that may indicate how the cells survive particular oxida-tive stress, analysis of gene expression was initiated. For thispurpose, oligonucleotide expression arrays (Affymetrix) wereused. With all the cell lines, it was found that 43% to 51% of thegenes and ESTs are expressed.
To detect antioxidative defense genes that have significantchange in expression, a one-way ANOVA was performed onthe total 12,422 genes, with the use of four C, H, and HTmicroarrays. The ANOVA probability for all genes is shown inelectronic folder 2. The analysis is based on the actual fluores-cent signals. For selection of the antioxidative defense genes,P � 0.001 was used—that is, the probability of selection of afalse positive was equal or less than 1 in 1000. The genes werechosen from the list shown in electronic folder 2. In somecases in which more than one probe set for a given gene waspresent, it is included, even though one of the probe sets hada high ANOVA probability. Also, in some cases, a gene wasselected because it either had a relatively high signal intensityin comparison to a reference group, or it was a member of awell-known antioxidative defense family. The selected 28genes are shown in Table 3 and are ranked by probability. Abrief description of the function of the gene is given as well.
The list of antioxidative defense genes contains only a fewof the commonly considered members of this group. Catalase,ranked fourth, is the only enzyme usually associated withdegrading H2O2. This enzyme has been shown to have a 136-fold increase in activity in H cells. Only GSH peroxidase 4,(phospholipid GSH peroxidase) of this family of peroxidases ispresent.
A few members of the large GSH-S-transferase family arelisted. These enzymes detoxify products of oxidation and xe-nobiotics, with GSH as a cofactor. Because the different GSH-S-transferase classes have different specificities and cellularlocations, it is not surprising to find the expression of morethan one affected by peroxide stress. Whereas GSH alone candetoxify the products of reactive oxygen species (ROS), itseffectiveness is directly related to its concentration. It is wellestablished that with H2O2 stress, GSH concentrations quicklyplummet in lens epithelial cell preparations and in the epithe-lial cell layer of the lens itself.24,47 Thus, GSH cannot effectivelyprotect the cell through nonenzymatic reactions for more thana very short period. However, by acting as a cofactor for theGSH-S-transferases, where the Km for GSH is approximately 0.1mM,48 100-fold lower than the normal lens epithelial cell con-centration,49 it continues to effectively degrade the toxic prod-ucts generated by H2O2. Previous work has shown that GSH-S-transferase alpha 1 and alpha 2 have been markedly increasedat the protein level in the H cell lines.26 Recently, it has beenfound that transfection of human lens epithelial cells with analpha class GSH-S-transferase protects the cells against H2O2-induced lipid peroxidation.50 It is interesting that not all de-tected GSH-S-transferase transcripts had increased expression.As shown in Table 4, the theta-1 enzyme mRNA was found tohave decreased activity in both the H and HT line in relation tothe C cells.
Catalase has a probability of 3.2 � 10�7 and a 10-foldchange at the mRNA level in H/C and HT/C signal intensities
FIGURE 3. Cell death as a result of peroxide stress. C cells conditionedto withstand 125 �M H2O2 (H) and cells conditioned to survive 125�M H2O2 and 100 �M TBHP (HT) were subjected to 125 �M H2O2, 125�M TBHP, or 125 �M H2O2�100 �M TBHP. Peroxides were addedevery 24 hours. Cell counts were made at designated times. Results arethe average of three independent experiments � SD.
TABLE 2. Enzyme Activities of Control and Conditioned Cells
Enzyme Control Cells (C) H Cells (H) H/C HT Cells (HT) HT/H
GSHPx 24 � 3 45 � 3 1.9 48 � 2 1.1Catalase 156 � 6 21,200 � 1,200 136 20,500 � 1,100 1.0Superoxide dismutase 4,900 � 450 5,300 � 350 1.0 4,520 � 500 1.0GSH-S-transferase* 770 � 72 1,340 � 84 1.7 3,420 � 87 2.5Glucose-6-phosphate dehydrogenase 380 � 24 742 � 20 2 790 � 15 1.1Glyceraldehyde-3-phosphate dehydrogenase 883 � 126 687 � 93 0.8 782 1.1GSH reductase 85 � 22 125 � 20 1.5 144 � 8 1.2
* 1-chloro-2,4-dinitrobenzene was used as a substrate.Data are expressed in milliunits per milligram protein. See Spector et al.26 for further details concerning methodology used to determine
enzyme activities.
3256 Spector et al. IOVS, October 2002, Vol. 43, No. 10

and a 130-fold or more change at the activity level. It could beassumed that the combination of catalase to degrade H2O2 andthe transferases to detoxify dangerous oxidized cellular com-ponents may be the only upregulated genes necessary to pro-tect the cell, but this does not appear to be true. A variety ofdifferent classes of antioxidative defenses are present. Thereare some genes that regulate metal ion levels. They includehephaestin,51 ceruloplasmin,52–54 and ferritin55–57 and possi-bly heme oxygenase.58 Reticulocalbin59 is also related to thesegenes, in that it modulates calcium concentrations. It bindscalcium maintaining low cytoplasmic calcium levels that de-press calcium-dependent protease activity. Hephaestin and cer-uloplasmin are homologous and act in a similar manner. Cer-uloplasmin oxidizes Fe�2 to Fe�3, facilitating iron uptake bytransferrin.51,60 It has been suggested that hephaestin also actsas a copper ferroxidase–controlling iron transport and linking
copper and iron metabolism.51 Ceruloplasmin expression issuppressed in both H and HT lines (Table 4). Ferritin, bymaintaining low levels of iron and copper, minimizes Fenton-type reactions. Ferritin is the cell’s major iron storage proteinand regulates intracellular iron levels.55–57 It contains bothheavy and light chains with various ratios in different tissues.Mutations in the light chain gene in the iron-responsive regioncause a hyperferritinemia cataract.61–63
Heme oxygenase (HO)-1 is induced by oxidative stress, withinduction increasing with diminishing concentrations ofGSH.64,65 It degrades heme and produces antioxidant bile pig-ments. In the degradation of heme, iron is released. It has beensuggested that HO participates in a coupled reaction withferritin, sequestering and oxidizing the released iron and thusprotecting the cell from iron catalyzed oxidation.58 The tran-scriptional regulation of the gene by oxidants has led to the
TABLE 3. Antioxidative Defense Genes with Significant Change in Expression Based Primarily on ANOVA
Rank Gene ANOVA P Probe Set Description
1 Hephaestin 3.2 � 10�8 104194_at A multicopper transmembrane oxidase involved iniron transport
2 PAF acetylhydrolase 1.2 � 10�7 101923_at PAF acetylhydrolase, same as phospholipase A2,abolishes inflammatory properties of PAF andhydrolyzes phospholipids
3 Ferredoxin 1 2.6 � 10�7 92587_at A powerful low-molecular-weight protein reductant4 Catalase 3.2 � 10�7 160479_at Catalyzed H2O2 degradation5 Similar to NADPH-dependent
leukotriene B4 12-hydroxydehydrogenase
5.5 � 10�7 98440_at Lipid oxidoreductase deactivates leukotreine B3, apotent proinflammatory factor and �, �unsaturated aldehydes and ketones
6 Heme oxygenase 1 6.1 � 10�7 160101_at Induced by oxidative stress, involved in ironmetabolism and generation of antioxidants
7 Aldehyde dehydrogenase II 1.4 � 10�6 100068_at Detoxifies toxic aldehydes generated by oxidation8 Aldo-keto reductase 1C13 4.6 � 10�6 95015_at Binds NADPH and reduces a broad group of
compounds9 Reticulocalbin 5.5 � 10�6 160896_at A calcium-binding protein located in the endoplasmic
reticulum, controls calcium concentration10 NAD(P)H menadione oxidoreductase 1 7.5 � 10�5 94350_f_at Catalyzes 2 electron reduction of quinones,14 4.8 � 10�5 94351_r_at important antioxidative defense, H2O2 inducible
11 Epoxide hydrolase-2 1.6 � 10�5 93051_at Catalyze conversion of xenobiotic epoxides to diolsGSH-S-transferase
12 Microsomal 2.1 � 10�5 104742_at GSH dependent detoxification of xenobiotics and19 Alpha 1 1.5 � 10�4 96085_at products of oxidative stress24 Alpha 3 1.4 � 10�3 93015_at28 Theta 1 1.0 � 10�2 95019_at29 Alpha 2 2.1 � 10�2 101872_at
13 Peroxiredoxin 5 3.5 � 10�5 100332_s_at Can reduce H2O2 and alkyl hydroperoxides15 Alcohol dehydrogenase 3 5.7 � 10�5 93695_at Same as GSH-dependent formaldehyde dehydrogenase16 Copper chaperone for superoxide
dismutase 19.7 � 10�5 103909_at Delivers copper to SOD1
17 Ferritin light chain 1.1 � 10�5 162479_f_at An iron storage protein, regulates the free iron in thecell
18 Glutaredoxin 1 (thiol transferase) 1.1 � 10�4 95722_at Reductant utilizes GSH as a cofactor, homologous tothioredoxin
20 Sulfide quinone reductase 1.5 � 10�4 94515_at May detoxify sulfides21 GSH peroxidase 4 1.9 � 10�4 94897_at A GSH-dependent enzyme that degrade phospholipid
hydroperoxides22 Ceruloplasmin 7.5 � 10�4 92851_at Plasma protein involved in copper transport,
scavenger of H2O2 and O2, oxidizes LDL and Fe�2,reduces O2
23 Secretory leukocyte protease inhibitor 1.9 � 10�3 92858_at Inhibitor of serine proteases, inhibits inflammatoryreactions
25 Lysosomal thiol reductase 2.8 � 10�3 97444_at IFN-� inducible reductase reduces protein disulfides(related to thioredoxin)
26 Aldehyde oxidase (retinal oxidase) 5.3 � 10�3 104011_at Converts aldehydes to acids utilizing O2 as electronacceptor
27 Macrosialin (CD 68) 6.5 � 10�3 103016_s_at Transmembrane glycoprotein, scavenges LDL
Genes are ranked on the basis of probabilities from most to least likely to be statistically significant. Genes were primarily selected from 950genes with P � 0.001 in a total population of 12,422 genes shown in electronic Folder 2. A few genes with greater probabilities (ranked 23–29)were also examined because of their potential antioxidative role.
IOVS, October 2002, Vol. 43, No. 10 Differential Amplification of Gene Expression 3257

viewpoint that HO provides a cellular defense mechanism tooxidative stress. HO has been shown to be induced in theretina with oxidative stress and is localized exclusively in theMuller cells.66 However, HO was suppressed in the H and HTlines.
Platelet-activating factor (PAF)-acetylhydrolases are mem-bers of a structurally distinct family of enzymes related to thephospholipases and specifically hydrolyze phospholipids, in-cluding oxidatively damaged components with a short chain atthe sn-2 position. The hydrolases may detoxify oxidized phos-pholipid in conjunction with superoxide dismutase and GSH-Px-1.67,68 The ferredoxins are low-molecular-weight proteinswith Fe-S clusters that are ubiquitous in both animals andplants. They are powerful reductants and are involved in abroad range of reactions, including carrying electrons fromferredoxin-reductase to membrane-bound cytochrome P450,which is important in the detoxification of xenobiotics.69,70
NADPH-dependent leukotriene B4 12-hydroxydehydroge-nase is involved in the detoxification of �,� unsaturated alde-hydes and ketones. This is accomplished by the reduction ofthe �,� carbon-carbon double bond, using NADPH as a cofac-tor. The enzyme is also known as alkenal/one oxidoreductase.It is effective in reducing cytotoxic lipid peroxidation prod-ucts.71 It is striking that potent cancer chemopreventive agentsupregulate a number of the genes noted on this list, includingGSH-S-transferases, epoxide hydrolase, NADPH quinone reduc-tase, and NADPH-dependent leukotriene B4 12-hydroxydehy-drogenase.71
Aldehyde dehydrogenase II is a member of the large familyof enzymes, including retinaldehyde dehydrogenase,72,73 thatdegrade xenobiotic aldehydes.74,75 These enzymes are in-volved in the metabolism of lipid peroxidation products, suchas malondialdehyde and hydroxyalkenals as well as N-hetero-cyclic compounds, N-oxides, and nitrosamines.73,76 Althoughits overall physiological function remains obscure, it is clearthat it can act as an antioxidative defense component. Thealdehyde dehydrogenase II gene has been recruited as a crys-tallin (omega-crystallin) in cephalopods.77
Aldo-keto reductase 1 C13 is a member of the superfamily ofmonomeric proteins of approximately 320 residues that me-tabolize a broad range of aldehydes, including xenobioticsusing NAD(P)H as a cofactor. Aldose reductase, an enzymeinvolved in the development of sugar-induced cataract is amember of this group.78,79 NAD(P)H menadione oxidoreduc-tase, detoxifies quinones and quinone-imines and is capable ofproducing antioxidant forms of ubiquinone and vitamin E afteroxidative stress.80 It utilizes both NADH and NADPH as cofac-tors and uses a two-electron-reaction mechanism.81 It has beensuggested that the enzyme regulates the intracellular redoxstate by controlling the NAD(P)H-to-NAD(P) ratio and is in-duced by H2O2.82
Epoxide hydrolase 2 is the soluble form of the enzyme thatis the major defense of the cell against xenobiotic-derivedepoxides,83–85 as well as endogenous components such asepoxides of leukotrienes.86 The enzyme forms vicinal 1 to 2diols that are generally less reactive than the epoxides.
TABLE 4. Additional Information on Genes Shown in Table 3
Fold change and P values based on comparative analysis of eight arrays, determined with Affymetrix software program. Tukey analysis witha probability cutoff of 0.01 is also given.
**** Indicates a significant difference. Color bars showing the intensity of the fluorescent signals for each probe set on each array are presented,with the lowest signal indicated by the darkest color.
3258 Spector et al. IOVS, October 2002, Vol. 43, No. 10

Peroxiredoxins are an emerging family of antioxidant en-zymes that regulate the concentrations of reactive oxygenspecies and protect tissues against oxidative attack.87 Peroxi-redoxin 5 is a thioredoxin peroxidase found in mitochondria,peroxisomes, and the cytosol. This peroxiredoxin is unique informing an intramolecular disulfide intermediate that is re-duced by thioredoxin.88
Alcohol dehydrogenase (ADH) 3 appears to be identicalwith formaldehyde dehydrogenase.89 It acts on the productformed by formaldehyde and GSH, hydroxymethylglutathione.In the presence of nicotinamide adenine dinucleotide (NAD), itforms S-formylglutathione. It can also oxidize long-chain ali-phatic alcohols and aldehydes but is not involved in retinalde-hyde metabolism.90 It, thus, contributes to the removal of toxicaldehydes possibly formed by oxidative stress.
The copper chaperone for superoxide dismutase (SOD)interacts with the Cu/Zn enzyme (SOD1) delivering copper tothe enzyme. Its presence is required for SOD1 activity.91
Glutaredoxin, also known as thiol transferase, is a member ofthe thiol-disulfide oxidoreductases and has been reported as adehydroascorbate reductase.92,93 It appears to be important inmaintaining ascorbate in its reduced form and in removing GSHand other thiols from thiolated proteins. It has been shown toprotect human lens epithelial cells from H2O2 stress.94
Sulfide quinone reductase is an interesting protein that hasbeen proposed to function in the detoxification and utilizationof endogenous sulfides and appears to be present in eu-karyotes. It is related to a mitochondrial enzyme HMT-2.95
GSH peroxidase (GPX) 4, the selenophospholipid hydroper-oxide peroxidase (PHGPX), is an essential enzyme in protect-ing the cell against lethal peroxidative damage.96,97 It differsfrom GPX-1 in being a monomeric protein with very differentsubstrate specificity. GPX-4 catalyzes the direct reduction ofphospholipid hydroperoxides, whereas GPX-1 is unreactivewith such hydroperoxides requiring sn-1 acyl bond hydrolysisbefore reducing the liberated fatty acid hydroperoxide.98,99
Secretory leukoprotease inhibitor (SLPI) is a low-molecular-weight serine protease inhibitor100 that also has been reportedto elevate GSH levels in the lung101 and thus may contributedirectly to both antioxidative defense as well as control ofdeleterious protease reactions. It inhibits activation of nuclearfactor (NF)-�B.102,103
Lysosomal thiol reductase is induced by gamma interferon,IFN-�, and is frequently denoted as GILT. It is synthesized as a224-amino-acid precursor that is transported to endocytic com-partments. It has the ability to cleave disulfide bonds by amechanism similar to that used by members of the thioredoxinfamily. It contains a CXXC motif reminiscent of the thioredoxinfamily of proteins. The enzyme requires a reducing agent foractivation. Although L-cysteine acts in this capacity, there is noactivity with glutathione.104–106
Aldehyde oxidase is a molybdenum dimeric enzyme thatcontains flavin adenine dinucleotide (FAD) and 2 Fe-S clustersand uses O2 as an electron acceptor.107,108 The enzyme has amajor role in the oxidation of aldehydes, as well as the detox-ification of a wide range of compounds. Recent work suggeststhat aldehyde oxidase is identical with retinal oxidase, convert-ing retinaldehyde to retinoic acid.109
Macrosialin, a murine counterpart of human CD68, is aglycosylated transmembrane protein that scavenges low-den-sity oxidized lipoprotein. Its overall role as an antioxidativeagent is not clear at the present time.110,111
Additional information on these antioxidative defense genesis given in Table 4. On the left side of the table, the relativefluorescence intensity rescaled from �2 to �2 for each probeset is shown. The weaker the fluorescent signal, the darker thecolor. Thus, the strongest signal is denoted by white. A stan-dard color bar is presented above the gene data. With the color
depiction of the signal intensities, it is possible to assessquickly the variation in the fluorescent signal intensity of agiven probe set across all 12 microarrays. The average foldchange for the H/C, HT/C and HT/H comparison is given. Itsreliability has been evaluated by Tukey analysis in which theprobability of a real difference has been set at 0.01 or less andis indicated by asterisks. Finally, the actual corrected signalintensities are given.
Some probe sets such as hephaestin, PAF-acetylhydrolase,and epoxide hydrolase 2 have a very high probability that theirgene expression has been amplified, based on both ANOVAand Tukey analysis. Yet, the signal intensities are very low,raising questions concerning their significance.
Four of these genes, aldehyde dehydrogenase II, GSH-S-transferase-theta, heme oxygenase 1, and ceruloplasmin havedecreased expression in the conditioned cell preparations.With the latter two genes, expression is down in both the Hand HT lines. Only three genes (hephaestin, GSH-S-transferasealpha 3, and alcohol dehydrogenase 3) clearly had amplifiedexpression in the HT but not in the H line. With all of thesegenes, except alcohol dehydrogenase 3, the signal intensitiesare low and with the GSH-S-transferase, the ANOVA probabilityis relatively high. There are also two probe sets, macrosialinand secretory leukocyte protease inhibitor with which theexpression is increased significantly, based on Tukey, only withH2O2 conditioning and one, GSH-S-transferase theta 1, where it isdecreased. A few genes have amplified expression in the H lineand a further increase in the HT line. They include PAF-acetylhy-drolase, menadione oxidoreductase I, alcohol dehydrogenase 3,and possibly aldehyde oxidase. Only the first two meet the Tukeytest for significance. There are some genes that are essentially notexpressed in the control cell preparation but are expressed withstress. Such genes include secretory leukocyte protease inhibitor,hephaestin, and microsomal GSH-S-transferase.
Real-Time RT-PCR
To obtain independent verification of the microarray data,real-time RT-PCR has been initiated with two independentinternal standards: glyceraldehyde-3-phosphate dehydrogenase(GAPDH) and mitochondrial ribosomal protein S24 (MRPS24).These housekeeping genes are frequently used as internal stan-dards because of their stability. Similar results were obtainedwith both internal standards. Electronic folder 3 (available athttp://www.iovs.org/cgi/content/full/43/10/3251/DC1) con-tains the forward and reverse primers used for the real-timeRT-PCR analyses. The size of the PCR products are also given.They varied from approximately 250 to 383 base pairs, withone exception of 221 base pairs. Table 5 presents Tukey,microarray, and RT-PCR data for most of the selected antioxi-dative defense genes. The real-time RT-PCR results, in mostcases, confirm the microarray data and the Tukey evaluation.However, the actual values can be significantly different. Forexample, with PAF-acetylhydrolase, the microarray gave anH/C value of 11, but the RT-PCR result was 5.6 (Table 5). Bothvalues indicate a considerable amplification in gene expres-sion. Indeed, the point of the exercise is to select genes thathave their expression significantly modified. The RT-PCR re-sults verify that this has occurred with PAF-acetylhydrolase andthis conclusion is confirmed by the Tukey analysis.
The correlation of microarray fold change with the RT-PCRresults is shown in Figure 4 in which the log of the changemultiples are plotted. In all cases, the trends are consistent,although with five genes, it is not possible to predict thecorrelation, because the change is too small to evaluate withone of the methods. If one method indicates positive or neg-ative amplification, so does the other. However, as indicatedearlier, the magnitude of the amplification is in doubt. If bothmethods indicated the same change multiple, the data would
IOVS, October 2002, Vol. 43, No. 10 Differential Amplification of Gene Expression 3259

fall on the line, indicating a correlation of 1. The points arescattered around this line. In H/C comparisons for GSH-S-transferase alpha 3 and aldehyde oxidase, one method indi-cates little change in amplification, whereas the other showsdefinitive change. In these cases, the interpretation of whetheramplification of expression occurred is in doubt. Those genesthat appear to have their microarray results verified are indi-cated by a checkmark in the verification column.
Another type of problem is illustrated by hephaestin. Withthis gene, no signal was obtain in C samples analyzed withRT-PCR and very weak signals with microarray analysis (seeTable 4). Even increasing the sample amount fourfold did notproduce a PCR product. However, with both H and HT cells,reasonable RT-PCR signals were obtained. Thus, gene expres-sion was turned on, but the extent of the increased expressioncannot be determined. This situation is denoted by an X in theRT-PCR column of Table 5. If no signal was obtained in any cellline (epoxide hydrolase 2) or in the H line (aldehyde dehydro-genase II), it is denoted by (Z). In the latter case, the H2O2
stress caused a marked decrease in gene expression but, again,could not be evaluated. The microarray results differ consider-ably from the RT-PCR values with epoxide hydrolase 2 butagree with the aldehyde dehydrogenase II and hephaestin datain a qualitative manner. Based on the these comments, verifi-cation of amplified expression was found in 35 of the 40samples examined. Finally, in a few cases, both RT-PCR resultsand Tukey analysis question the microarray change multiples.
Carper et al.,38 used differential display to examine the Hand C cell lines. Increased expression was observed in a num-ber of genes reported in their study. Of the genes they inves-tigated, catalase had the greatest increase in expression, up14-fold, reticulocalbin up 6-fold, and GSH-peroxidase and fer-ritin (both chains) up 2-fold. Metallothionein 2 was essentiallyunchanged. These results are in reasonable agreement with thepresent work, with the exception of the ferritin heavy chain,which appeared unchanged and GSH peroxidases, which mayhave a slight increase in gene expression.
Expression of Classic AntioxidativeDefense Genes
The surprising absence of many of the common antioxidativedefenses among the genes with amplified expression led us tosurvey some of the members of this group (Table 6). It was
TABLE 5. Validation of Microarray Results with Real-Time RT-PCR
Gene
H/C Fold Change HT/C Fold Change
Tukey Microarray RT-PCR Validation Tukey Microarray RT-PCR Validation
Hephaestin — 1.9 X � **** 30 X �PAF acetylhydrolase **** 11 5.6 � **** 26 12 �Ferredoxin 1 **** 3.1 2.6 � **** 3.0 2.4 �Catalase **** 10 17 � **** 9.5 13 �Leukotriene B4 12-hydroxydehydrogenase **** 16 42 � **** 16 19 �Aldehyde dehydrogenase II **** �20 Z — — �1.2 �1.3 �NAD(P)H menadione oxidoreductase 1 **** 2.9 1.7 � **** 4.2 5.1 �Epoxide hydrolase 2 **** 6.3 Z — **** 6.4 Z —GSH-S-transferase
Microsomal **** 8.5 29 � **** 9.5 20 �Alpha 1 **** 7.0 11 � **** 4.5 4.5 �Alpha 3 — 3.0 1.0 — **** 11 20 �Alpha 2 — 2.5 25 � — 2.8 21 �Theta 1 **** �2.7 �8.0 � — �1.2 �3.0 �
Peroxiredoxin 5 **** 2.5 3.0 � **** 2.3 2.9 �Alcohol dehydrogenase 3 — 7.8 42 � **** 20 24 �Copper chaperone for superoxide dismutase 1 **** 2.6 2.8 � **** 2.2 1.8 �Ferritin light chain **** 1.5 1.3 � **** 1.3 1.6 �Lysosomal thiol reductase **** 4.4 3.8 � **** 3.5 1.7 �Aldehyde oxidase (retinal oxidase) — 4.7 1.0 — **** 7.2 1.4 �Macrosialin (CD 68) **** 9.3 5.2 � — 6.6 2.2 �
The antioxidative defense genes shown in Table 3 were analyzed by Tukey statistical analysis to determine significant differences between Hand C, HT and C and HT and H microarray probe set fluorescent signals. A probability cutoff of 0.01 was used. ****Indicates a significant difference.Microarray data are the average obtained from four arrays for each cell type, and RT-PCR values are the average of, in most cases, threedeterminations. Validation (�) indicates that the RT-PCR results validated that there was a significant change in the genes mRNA level, althoughthe magnitude remains somewhat in doubt. In most cases, this conclusion was confirmed by the Tukey analysis of the microarray data. X indicatesthat RT-PCR values could be obtained for the H or HT lines but not the controls; thus, there was an increase in gene expression. Z indicates thatno product could be detected by RT-PCR in either the conditioned or control preparations.
FIGURE 4. Correlation of RT-PCR and microarray results. The log ofthe fold change determined by the two procedures is given. The linearregression line is derived by y � 1.0481x, with a correlation coefficientof 0.77.
3260 Spector et al. IOVS, October 2002, Vol. 43, No. 10

TA
BLE
6.
Rec
ogn
ized
An
tio
xid
ativ
eD
efen
seG
enes
Gen
eP
rob
ese
tsA
NO
VA
P
Fo
ldC
han
geSi
gnal
Det
ecti
on
Cal
l
H/C
HT
/CH
T/H
C1
C2
C3
C4
H1
H2
H3
H4
HT
1H
T2
HT
3H
T4
C1
C2
C3
C4
H1
H2
H3
H4
HT
1H
T2
HT
3H
T4
GSH
-Px
194
132_
at0.
112
1.4
1.4
�1.
026
224
617
420
328
825
637
230
035
521
829
024
4P
PP
PP
PP
PP
PP
PG
SH-P
x2
9981
0_at
0.21
11.
31.
3�
1.1
8773
3955
8474
112
7990
6663
86P
PP
PP
PP
PP
PM
PG
SH-P
x3
1042
56_a
t0.
098
1.9
1.2
�2.
314
810
913
2825
3131
145
19A
AA
AA
AA
AA
AA
AG
SH-P
x5
9469
2_at
0.73
41.
21.
31.
142
2723
1319
4473
1257
2229
27A
AA
AA
AA
AA
AA
AG
luta
thio
ne
syn
thet
ase
1014
25_a
t0.
055
1.9
1.9
1.1
386
305
549
605
736
754
932
901
611
654
1074
1471
PA
PP
PP
PP
MP
PP
Th
iore
do
xin
9280
7_at
0.80
21.
0�
1.0
�1.
044
3468
5942
5940
1049
3652
6749
2155
4648
2043
0852
0848
46P
PP
PP
PP
PP
PP
PT
hio
red
ox
in98
130_
at0.
088
1.1
�1.
2�
1.3
1110
947
1017
1111
1037
915
1373
1314
839
750
1022
947
PP
PP
PP
PP
PP
PP
Th
iore
do
xin
red
uct
ase1
9998
5_at
0.54
71.
11.
0�
1.1
3397
3298
3939
4046
3195
3950
4790
4677
2963
3324
4368
4395
PP
PP
PP
PP
PP
PP
Th
iore
do
xin
red
uct
ase1
1612
84_r
_at
0.73
91.
11.
31.
057
429
340
958
536
942
262
940
055
233
856
563
1P
PP
PM
PM
PP
PM
PT
hio
red
ox
inre
du
ctas
e216
0437
_at
0.03
92.
71.
7�
1.6
6149
101
7131
420
811
912
410
713
414
594
PP
PP
PP
PP
PP
PP
Th
iore
do
xin
-rel
ated
pro
tein
1601
15_a
t0.
156
�1.
0�
1.4
�1.
335
343
016
322
733
830
736
033
225
122
719
123
4P
PP
PP
PP
PA
PP
PT
hio
red
ox
ind
epen
den
tp
ero
xid
ere
du
ctas
e99
608_
at0.
033
�1.
5�
2.6
�1.
690
7373
7030
5045
7313
4864
23A
PP
PA
AA
AA
AP
AP
ero
xir
edo
xin
s-P
rxI
9775
8_at
0.45
21.
11.
21.
141
7244
0741
8932
1356
8640
7638
8233
7960
0932
5061
1843
33P
PP
PP
PP
PP
PP
PP
ero
xir
edo
xin
s-P
rxII
-210
0331
_g_a
t0.
169
�1.
2�
1.3
�1.
138
8940
7725
8224
1529
7232
8029
2633
3029
7327
5318
7921
25P
PP
PP
PP
PP
PP
PP
ero
xir
edo
xin
s-P
rxII
-310
1804
_at
0.69
7�
1.2
�1.
3�
1.0
115
186
97
105
97
99
AA
AA
AA
AA
AA
AA
Ferr
itin
H94
794_
at0.
622
�1.
01.
01.
161
2777
2755
9251
0355
7055
9460
7554
9658
3149
8171
1474
00P
PP
PP
PP
PP
PP
PFe
rrit
inH
1619
13_r
_at
0.76
71.
21.
2�
1.1
3114
3529
1467
1665
3465
2667
2582
2588
3467
2241
2104
2436
PP
MP
PP
PP
PP
PP
Met
allo
thio
nei
n1
9357
3_at
0.33
7�
1.1
1.1
1.2
3329
3276
3363
3089
4493
4482
2733
3018
5222
3515
3771
3689
PP
PP
PP
PP
PP
PP
Met
allo
thio
nei
n2
1015
61_a
t0.
807
1.2
1.3
1.1
3793
4322
3749
3410
5243
4102
3736
3514
5782
2927
3896
4082
PP
PP
PP
PP
PP
PP
Met
allo
thio
nei
n3
9534
0_at
0.42
1�
1.0
1.2
1.2
323
170
468
358
259
279
307
289
482
275
330
392
AA
AA
AA
AA
AA
AA
Met
allo
thio
nei
n4
1029
89_a
t0.
571
�1.
4�
1.7
�1.
314
416
613
1113
1114
613
5A
AA
AA
AA
AA
AA
AIR
P-1
(aco
nit
ase
1)10
0147
_at
0.17
2�
2.6
�2.
21.
462
3732
377
3219
3729
4111
26A
AA
AA
AA
AA
AA
AT
ran
sfer
rin
rece
pto
r10
3957
_at
0.09
0�
1.8
�1.
21.
524
820
920
513
393
8510
716
024
320
512
610
8P
PP
PP
PP
PP
PP
PT
ran
sfer
rin
rece
pto
r10
3958
_g_a
t0.
113
�1.
3�
1.0
1.3
1753
1292
1477
1214
1112
889
1397
1276
1844
1278
1446
1643
PP
PP
PP
PP
PP
PP
Ph
osp
ho
lipas
eA
2-V
1013
28_a
t0.
170
�1.
41.
21.
485
5216
714
651
6160
7887
6914
014
1P
AP
PA
PA
PP
PP
PP
ho
sph
olip
ase
A2-
V94
665_
at0.
682
�1.
2�
1.2
1.1
7953
168
137
7264
116
9083
5117
314
3A
AP
PA
AA
MA
AP
PP
ho
sph
olip
ase
A2-
IIA
9273
5_at
0.47
61.
51.
3�
1.2
1115
129
1213
2516
1322
1110
AA
AA
AA
AA
AA
AA
Ph
osp
ho
lipas
eA
2-C
a-in
dep
end
ent
9796
5_at
0.14
9�
2.3
�2.
7�
1.8
113
6915
516
030
8313
214
872
5588
23A
AP
PA
AA
MA
AA
AP
ho
sph
olip
ase
A2-
IIC
9932
6_at
0.06
42.
01.
6�
1.3
105
6553
5111
113
610
812
015
069
8690
AA
AA
AP
AA
AA
AA
NA
DP
H-c
yto
chro
me
P45
0re
du
ctas
e99
019_
at0.
461
1.1
�1.
1�
1.2
544
420
706
678
481
491
674
547
503
520
520
464
PP
PP
PP
PP
PP
PP
Agr
ou
po
fge
nes
freq
uen
tly
asso
ciat
edw
ith
anti
ox
idat
ive
def
ense
sis
sho
wn
.P
rob
ese
tn
um
ber
sar
egi
ven
asw
ell
asp
rob
abili
ties
and
fold
chan
ge.
Th
efl
uo
resc
ent
sign
alva
lues
for
each
of
the
C,
H,
and
HT
arra
ysan
dth
ed
etec
tio
nca
llb
ased
on
the
mic
roar
ray
soft
war
ean
alys
isar
eal
sop
rese
nte
d.
IOVS, October 2002, Vol. 43, No. 10 Differential Amplification of Gene Expression 3261
found that none of the GSH peroxidases except phospholipidGSH peroxidase was significantly amplified (ANOVA, P � 0.1–0.7) lending further support to the viewpoint that GSH-Pxshave limited roles as antioxidant defense enzymes and that theabsence of GSH-Px-1 does not compromise animal viability.112
The thioredoxins and peroxiredoxins (except for peroxire-doxin 5) also showed little change. Nor was there a significantamplified expression of the phospholipase A2 family, which isbelieved to be involved in degradation of membrane lipidperoxides. Although the ferritin light chain appeared to havean increased expression, two different probe sets for the heavychain showed no significant change in expression. On the basisof the present data, it appears that many of the well-definedantioxidative genes do not have amplified expression in theconditioned lens epithelial cell lines.
Many of the genes and ESTs which have amplified expres-sion in the conditioned cells do not appear to be involved inantioxidative defense systems. There are a number of possibleexplanations for this situation. Some of these genes may beclustered on exposed segments of chromosomes in the vicinityof key antioxidative genes that have amplified expression andthus also have increased transcription. These genes may havepromoters, enhancers, or other control elements, includingoxidation-responsive elements in common, leading to theirincreased expression. It is also possible that the amplifiedexpression of the antioxidative defense genes causes the cell toreadjust its overall biology, leading to the observed expressionpattern. It also appears that the cell reorganizes its overallstructure, shifting gene expression to respond more effectivelyto its altered environment.113 Further analysis of these genes isin progress to gain insight into their relationship with antioxi-dative defenses.
Based on this work, a relatively small number of antioxida-tive genes have their expression significantly amplified in re-sponse to peroxide stress and an even smaller number arefound when already conditioned H cells are subjected to adifferent peroxide, TBHP. (It is possible that the presence ofboth H2O2 and TBHP obscures the cell’s response to just onestressing agent. Therefore, a cell line conditioned to resist onlyTBHP has been developed and is now being analyzed.) Thissuggests that there are a few key antioxidative componentsthat determine whether a cell will survive a particular stressand that the same genes may not be involved or may not besufficient to respond to other closely allied stresses. Some ofthe identified genes have not been previously considered inexamination of the lens’ antioxidative defenses. Although, inmost cases, the results obtained by microarray expressionanalysis have been verified by real-time RT-PCR, further work isneeded at the protein level to confirm the conclusions drawnfrom this study.
The analysis presented in this article considers approxi-mately 12,400 genes and ESTs. Although there is no certaintyabout the total number of genes in the mouse genome, it isprobable, based on the human genome work, that there areonly approximately 30,000 genes in the genome.114–116 Onthis basis, our work has examined approximately one third ofthe mouse genome. It will be interesting to find whether otherimportant antioxidative systems will be revealed when theremainder of the genome is examined and annotation of geneswith unknown function is completed.
Acknowledgments
The authors thank Vladan Miljkovic, Manager of the Gene MicroArrayFacility of Columbia University, for his assistance with the expressionmicroarray hybridization and initial analysis.
References
1. Bray TM. Antioxidants and oxidative stress in health and disease:introduction. Proc Soc Exp Biol Med. 1999;222:195.
2. Forsberg L, deFaire U, Morgenstern R. Oxidative stress, humangenetic variation and disease. Arch Biochem Biophys. 2001;389:84–93.
3. Hoeschen RJ. Oxidative stress and cardiovascular disease. CanJ Cardiol. 1997;13:1021–1025.
4. Singal PK, Khaper N, Palace V, Kumar D. The role of oxidativestress in the genesis of heart disease. Cardiovasc Res. 1998;40:426–432.
5. Thomson A, Hemphilly D, Jeejeebhog KN. Oxidative stress andantioxidants in intestinal disease. Dig Disease. 1998;16:152–158.
6. Koyama H, Geddes DM. Genes, oxidative stress and the risk ofchronic obstructive pulmonary disease. Thorax. 1998;53(suppl2):S10–S14.
7. Esposito LA, Melov S, Panov A, Cottrell BA, Wallace DC. Mito-chondrial disease in the mouse results in increased oxidativestress. Proc Natl Acad Sci USA. 1995;96:4820–4825.
8. Sayre LM, Smith MA, Perry G. Chemistry and biochemistry ofoxidative stress in neurodegenerative disease. Curr Med Chem.2001;8:721–738.
9. Smith MA, Rottkamp CH, Nunomura A, Raina AK, Perry G. Oxi-dative stress in Alzheimer’s disease. Biochim Biophys Acta. 2000;1502:139–144.
10. Cohen G. Oxidative stress, mitochondrial respiration and Parkin-son’s disease. Ann NY Acad Sci. 2000;899:112–120.
11. Spector A. The search for a solution to senile cataracts: ProctorLecture. Invest Ophthalmol Vis Sci. 1984;25:130–146.
12. Varma SD, Chand D, Sharma YR, Kuck JF Jr, Richards RD. Oxi-dative stress on lens and cataract formation: role of light andoxygen. Curr Eye Res. 1984;3:35–38.
13. Babizhaev MA, Deev AI. Free radical oxidation of lipids and thiolgroups in formation of a cataract. Biofizika. 1986;31:109–114.
14. Spector A. The lens and oxidative stress. In: Sies H, ed. OxidativeStress, Oxidants and Antioxidants. London: Academic Press;1991:529–558.
15. Zigman S, Paxhia T, McDaniel T, Lou MF, Yu NT. Effect of chronicnear-ultraviolet radiation on the gray squirrel lens in vivo. InvestOphthalmol Vis Sci. 1991;32:1723–1732.
16. Giblin FJ, Padgaonkar VA, Leverenz VR, et al. Nuclear light scat-tering, disulfide formation and membrane damage in lenses ofolder guinea pigs treated with hyperbaric oxygen. Exp Eye Res.1995;60:219–235.
17. Spector A, Wang G-M, Wang R-R, Li W-C, Kuszak JR. A briefphotochemically induced oxidative insult causes irreversible lensdamage and cataract. I: transparency and epithelial cell layer. ExpEye Res. 1995;60:471–481.
18. Balasubramanian D. Ultraviolet radiation and cataract. J OculPharmacol Ther. 2000;16:285–297.
19. Spector A, Garner WH. Hydrogen peroxide and human cataract.Exp Eye Res. 1981;33:673–681.
20. Ramachandran S, Morris SM, Devamonoharan PS, Henein M,Varma SD. Radio-isotopic determination of hydrogen peroxide inaqueous humor and urine. Exp Eye Res. 1991;53:503–506.
21. Bhuyan DK, Camras CB, Lakhani HK, Bhuyan KC. Peroxide con-centration in normal and cataractous human lenses [ARVO Ab-stract]. Invest Ophthalmol Vis Sci 1992;33(4):S798. Abstract nr531.
22. Dische Z, Zil H. Studies on the oxidation of cysteine to cystine inlens proteins during cataract formation. Am J Ophthalmol. 1951;34:104–113.
23. Augusteyn RC. Protein modification in cataract: possible oxida-tive mechanisms. In: Duncan G, ed. Mechanisms of CataractFormation in the Human Lens. New York: Academic Press;1981:72–115.
24. Spector A. Oxidative stress-induced cataract: mechanism of ac-tion. FASEB J. 1995;9:1173–1182.
25. Spector A, Wang G-M, Wang R-R., Li W-C, Kleiman NJ. A briefphotochemically induced oxidative insult causes irreversible lensdamage and cataract. II: mechanism of action. Exp Eye Res.1995;60:483–493.
3262 Spector et al. IOVS, October 2002, Vol. 43, No. 10

26. Spector A, Wang R-R, Ma W, Kleiman NJ. Development andcharacterization of a H2O2 resistant immortal lens epithelial cellline. Invest Ophthalmol Vis Sci. 2000;41:832–843.
27. Guillen E, Abeijon C, Hirschberg CB. Mammalian Golgi apparatusUDP-N-acetylglucosamine transporter: molecular cloning by phe-notypic correction of a yeast mutant. Proc Natl Acad Sci USA.1998;95:7888–7892.
28. Matern HT, Yeaman C, Nelson WJ, Scheller RH. The Sec6/8complex in mammalian cells: characterization of mammalianSec3, subunit interactions, and expression of subunits in polar-ized cells. Proc Natl Acad Sci USA. 2001;98:9648–9653,
29. Marks B, Stowell MH, Vallis Y, et al. GTPase activity of dynaminand resulting conformation change are essential for endocytosis.Nature. 2001;410:231–235.
30. Lanzetti L, Rybin V, Malabarba MG, et al. The Eps8 proteincoordinates EGF receptor signalling through Rac and traffickingthrough Rab5. Nature. 2000;408:374–377.
31. Runnels LW, Yue L, Clapham DE. TRP-PLIK, a bifunctional pro-tein with kinase and ion channel activities. Science. 2001;291:1043–1047.
32. Molinari M, Helenius A. Chaperone selection during glycoproteintranslocation into the endoplasmic reticulum. Science. 2000;288:331–333.
33. Kato H, Tjernberg A, Zhang W, et al. SYT associates with humanSNF/SWI complexes and the C-terminal region of its fusion part-ner SSX1 targets histones. J Biol Chem. 2002;277:5498–5505.
34. Mach CM, Hargrove BW, Kunkel GR. The small RNA gene acti-vator protein, SphI postoctamer homology-binding factor/seleno-cysteine tRNA gene transcription activating factor, stimulatestranscription of the human interferon regulatory factor-3 gene.J Biol Chem. 2002;277:4853–4858.
35. Raucher D, Stauffer T, Chen W, et al. Phosphatidylinositol 4,5-bisphosphate functions as a second messenger that regulatescytoskeleton-plasma membrane adhesion. Cell. 2000;100:221–228.
36. Fisk HA, Winey M. The mouse Mps1p-like kinase regulates cen-trosome duplication. Cell. 2001;106:95–104.
37. Li DW-C, Spector A. Hydrogen peroxide-induced expression ofthe proto-oncogenes, c-jun, c-fos and c-myc in rabbit lens epithe-lial cells. Mol Cell Biochem. 1997;173:59–69.
38. Carper D, John M, Chen Z, et al. Gene expression analysis of anH2O2-resistant lens epithelial cell line. Free Rad Biol Med. 2001;31:90–97.
39. Carper DA, Sun JK, Iwata T, et al. Oxidative stress inducesdifferential gene expression in a human lens epithelial cell line.Invest Ophthalmol Vis Sci. 1999;40:400–406.
40. Novak JP, Sladek R, Hudson TJ. Characterization of variability inlarge-scale gene expression data: implication for study design.Genomics. 2002;79:104–113.
41. Lockhart DJ, Dang H, Byrne MC, et al. Expression monitoring byhybridization to high-density oligonucleotide arrays. Nat Biotech-nol. 1996;14:1675–1680.
42. Jacobuzio-Donahue CA, Maitra A, Shen-Ong GL, et al. Discoveryof novel tumor markers of pancreatic cancer using global geneexpression technology. Am J Path. 2002;160:1239–1249.
43. Mills JC, Gordon JI. A new approach for filtering noise fromhigh-density oligonucleotide micro-array data sets. Nucleic AcidRes. 2001;29:1–13.
44. Kaiser K, Rabodonirina M, Picot S. Real time quantitative PCR andRT-PCR for analysis of pneumocystis carnihominis. J MicrobiolMethods. 2001;45:113–118.
45. Rajeevan MS, Vernon SD, Taysavang N, Unger ER. Validation ofarray-based gene expression profiles by real time (kinetic) RT-PCR. J Mol Diagn. 2001;3:26–31.
46. Higuchi R, Fockler C, Dolinger G, Watson R. Kinetic PCR analysis-real time monitoring of DNA amplification. Biotechnol. 1993;11:1026–1030.
47. Spector A, Huang R-RC, Wang G-M, Schmidt C, Yan G-Z, ChiffletS. Does elevated glutathione protect the cell from H2O2 insult?Exp Eye Res. 1987;45:453–465.
48. Ketterer B. Protective role of glutathione and glutathione transferases inmutagenesis and carcinogenesis. Mutat Res. 1988;202:343–361.
49. Reddy VN. Glutathione and its function in the lens: an overview.Exp Eye Res. 1990;50:771–778.
50. Yang Y, Sharma R, Cheng J. -Z, et al. Protection of HLE B-3 cellsagainst hydrogen peroxide and naphthalene-induced lipid peroxi-dation and apoptosis by transfection with hGSTA1 and hGSTA2.Invest Ophthalmol Vis Sci. 2002;43:434–445.
51. Vulpe CD, Kuo Y-M, Murphy TL, et al. Hephaestin, a ceruloplas-min homologue implicated in intestinal iron transport, is defec-tive in the sla mouse. Nat Genet. 1999;21:195–199.
52. Mzhel’skaya TI. Biological functions of ceruloplasmin and theirdeficiency caused by mutation in genes regulating copper andiron metabolism. Bull Exp Biol Med. 2000;130:719–727.
53. Ryden L. Ceruloplasmin. In: Lontie R, ed. Copper Proteins andCopper Enzymes. Vol 3. Boca Raton, FL: CRC Press; 1984:37–100.
54. Saenko EL, Yaropolov AI, Harris ED. Biological functions of cer-uloplasmin expressed through copper-binding sites and a cellularreceptor. J Trace Elem Exp Med. 1994;7:69–88.
55. Crichton RR, Charloteauz-Wauters M. Iron transport and storage.Eur J Biochem. 1987;164:485–506.
56. Aisen P. Iron transport and storage proteins. Annu Rev Biochem.1980;49:357–393.
57. Harrison PM, Arosio P. Ferritins: Molecular properties, iron stor-age function and cellular regulation. Biochim Biophys Acta.1996;1275:161–203.
58. Vile GF, Basa-Modak S, Waltner C, Tyrrell RM. Heme oxygenase 1mediates an adaptive response to oxidative stress in human skinfibroblasts. Proc Natl Acad Sci USA. 1994;91:2607–2610.
59. Ozawa M, Muramatsu T. Reticulocalbin, a novel endoplasmicreticulum resident Ca2�-binding protein with multiple EF handmotifs and a carboxyl-terminal HDEL sequence. J Biol Chem.1993;268:699–705.
60. Syed BA, Beaumont NJ, Patel A, et al. Analysis of the humanhephaestin gene and protein: comparative modelling of the N-terminus ecto-domain based upon ceruloplasmin. Prot Eng.2002;15:205–214.
61. Cheng Q, Gonzalez P, Zigler JS Jr. High level of ferritin light chainmRNA in lens. Biochem Biophys Res Commun. 2000;270:349–355.
62. Beaumont C, Leneuve P, Devaux I, et al. Mutation in the ironresponsive element of the L-ferritin mRNA in a family with dominanthyperferritinaemia and cataract. Nat Genet. 1995;11:444–445.
63. Girelli D, Corrocher R, Bisceglia L, et al. Hereditary hyperferritine-mia-cataract syndrome caused by a 29-base pair deletion in theiron responsive element of ferritin L-subunit gene. Blood. 1997;90:2084–2088.
64. Ryter SW, Tyrrell RM. The heme synthesis and degradationpathways: role in oxidant sensitivity. Free Rad Biol Med. 2000;28:289–304.
65. Shelton KR, Egle PM, Todd JM. Evidence that glutathione partic-ipates in the induction of a stress protein. Biochem. Biophys ResCommun. 1986;134:492–498.
66. Ulyanova T, Agoston S, Kutty RK, et al. Oxidative stress inducesheme oxygenase-1 immunoreactivity in Muller cells of mouse retinain organ culture. Invest Ophthalmol Vis Sci. 2001;42:1370–1374.
67. Soubeyr S, Manjunath P. Platelet-activating factor acetylhydrolase inseminal plasma: a brief review. Mol Rep Dev. 1998;50:510–519.
68. Parks JE, Hough SR. Platelet activating factor acetylhydrolaseactivity in bovine seminal plasma. J Androl. 1993;14:335–339.
69. Grinberg AV, Hannemann F, Schiffler B, Muller J, Heinemann U,Bernhardt R. Adrenodoxin: structure, stability and electron trans-fer properties. Proteins. 2000;40:590–612.
70. Xia B, Jenk D, LeMaster DM, Westler WM, Markley JL. Electron-nuclear interactions in two prototypical (2Fe-2S) proteins: Selec-tive (chiral/deuteration) and analysis of 1H and 2H NMR signalsfrom the alpha and beta hydrogens of cysteinyl residues thatligate the iron in the active sites of human ferredoxin andanabaena 7120 vegetative ferredoxin. Arch Biochem Biophys.2000;373:328–334.
71. Dick RA, Kwak MI-K, Sutter TR, Kensler TW. Antioxidative func-tion and substrate specificity of NAD(P)H dependent alkenal/oneoxidoreductase. J Biol Chem. 2001;276:40803–40810.
72. Tomita S, Tsujita M, Ichikawa Y. Retinal oxidase identical toaldehyde oxidase. FEBS Lett. 1993;336:272–274.
73. Huang D-Y, Aizo F, Ichikawa Y. Molecular cloning of retinaloxidase/aldehyde oxidase cDNAs from rabbit and mouse liversand functional expression of recombinant mouse retinal oxidase
IOVS, October 2002, Vol. 43, No. 10 Differential Amplification of Gene Expression 3263

cDNA in Escherichia coli. Arch Biochem Biophys. 1999;364:264–272.
74. Cheung C, Smith CK, Hoog J-O, Hotchkiss SAM. Expression andlocalization of human alcohol and aldehyde dehydrogenase en-zymes in skin. Biochem Biophys Res Commun. 1999;261:100–107.
75. Grunn F, Hirase Y, Kawauchi S, Ogura T, Umesono K. Aldehydedehydrogenase 6, a cytosolic retinaldehyde dehydrogenase prom-inently expressed in sensory neuroepithelia during development.J Biol Chem. 2000;275:41210–41218.
76. Yoshihara S, Tatsumi K. Purification and characterization of he-patic aldehyde oxidase in male and female mice. Arch BiochemBiophys. 1997;338:29–34.
77. Piatigorsky J, Kozmik Z, Horwitz J, et al. Omega-crystallin of thescallop lens: a dimeric aldehyde dehydrogenase class 1/2 enzyme-crystallin. J Biol Chem. 2000;275:41064–41073.
78. Jez JM, Bennett MJ, Schlegel BP, Lewis M, Penning TM. Compar-ative anatomy of the aldo-keto reductase superfamily. Biochem J.1997;326:625–636.
79. Ikeda S, Okuda-Ashitaka E, Masu Y, et al. Cloning and character-ization of two novel aldo-keto reductases (AKR1C12 andACK1C13) from mouse stomach. FEBS Lett. 1999;459:433–437.
80. Siegel D, Ross D. Immunodetection of NAD(P)H: quinone oxi-doreductase I (NQOI) in human tissues. Free Radic Biol Med.2000;29:246–253.
81. Chen S, Knox R, Wu K, et al. Molecular basis of the catalyticdifferences among DT-diaphorase of human, rat and mouse. J BiolChem. 1997;272:1437–1439.
82. Bello RI, Diaz CG, Navarro F, Acain J, Villalba JM. Expression ofNAD(P)H: quinone oxidoreductase 1 in HeLa cells. J Biol Chem.2001;276:44379–44384.
83. Argiriadi MA, Morisseau C, Hammock BD, Christianson DW. De-toxification of environmental mutagens and carcinogens: struc-ture, mechanism, and evolution of liver epoxide hydrolase. ProcNatl Acad Sci USA. 1999;96:10637–10642.
84. Greene JF, Newman, JW, Williamson KC, Hammock BD. Toxicityof epoxy fatty acids and related compounds to cells expressinghuman soluble epoxide hydrolase. Chem Res Toxicol. 2000;13:217–226.
85. Omiecinski CJ, Hassett C, Hosagrahara V. Epoxide hydrolase:polymorphism and role in toxicology. Toxicol Lett. 2000;112–113:365–370.
86. Haeggstrom JZ, Wetterholm A, Medina JF, Samuelsson B. Novelstructural and functional properties of leukotriene A4 hydrolase:implications for the development of enzyme inhibitors. Adv Pros-taglandin Thomboxane Leukot Res. 1994;22:3–12.
87. Declercq J-P, Evrard C, Clippe A, Stricht DV, Bernard A, KnoopsB. Crystal structure of human peroxiredoxin 5, a novel type ofmammalian peroxiredoxin at 1.5 Å resolution. J Mol Biol. 2001;311:751–759.
88. Seo MS, Kang SW, Kim K, Baines IC, Lee TH, Rhee SG. Identifi-cation of a new type of mammalian peroxiredoxin that forms anintramolecular disulfide as a reaction intermediate. J Biol Chem.2000;275:20346–20354.
89. Koivusalo M, Baumann M, Uotila L. Evidence for the identity ofglutathione-dependent formaldehyde dehydrogenase and class IIIalcohol dehydrogenase. FEBS Lett. 1989;257:105–109.
90. Duester, G. Alcohol dehydrogenase as a critical mediator of reti-noic acid synthesis from vitamin A in the mouse embryo. J Nutr.1998;128(suppl):4595–4625.
91. Kato S, Sumi-Akamaru H, Fujimura H, et al. Copper chaperone forsuperoxide dismutase co-aggregates with superoxide dismutase 1(SOD1) in neuronal Lewy body-like hyaline inclusions: an immu-nohistochemical study on familial amyotrophic lateral sclerosiswith SOD1 gene mutation. Acta Neuropathol. 2001;102:233–238.
92. Meyer EB, Wells WW. Thiol transferase overexpression increasesresistance of MCF-7 cells to Adriamycin. Free Radic Biol Med.1999;26:770–776.
93. Wells WW, Xu CP, Yang Y, Rocque PA. Mammalian thiol trans-ferase (glutaredoxin) and protein disulfide isomerase have dehy-droascorbate reductase activity. J Biol Chem. 1990;265:15361–15364.
94. Xing KY, Lou MF. Effect of H2O2 on human lens epithelial cellsand the possible mechanism for oxidative damage repair by thioltransferase. Exp Eye Res. 2002;74:113–122.
95. Bronstein M, Schutz M, Hanska G, Padan E, Shahak Y. Cyanobac-terial sulfide-quinone reductase: cloning and heterologous ex-pression. J Bacteriol. 2000;182:3336–3344.
96. Hurst R, Korytowski W, Kriska T, Esworthy RS, Chu FF, GirottiAW. Hyper resistance to cholesterol hydroperoxide-induced per-oxidative injury and apoptotic death in a tumor cell line thatoverexpresses glutathione peroxidase isotype-4. Free Radic BiolMed. 2001;31:1051–1065.
97. Ursini F, Maiorini M, Sevanian A. Membrane hydroperoxides. In:Sies H, ed. Oxidative Stress: Oxidants and Antioxidants. NewYork: Academic Press; 1991:319–336.
98. Grossman A, Wendel A. Non-reactivity of the selenoenzyme glu-tathione peroxidase with enzymatically hydroperoxidized phos-pholipids. Eur J Biochem. 1983;135:549–552.
99. Van Kuijk FJGM, Sevanian A, Handelman GJ, Dratz EA. A new rolefor phospholipase A2: protection of membranes from lipid per-oxidation damage. Trends Biochem Sci. 1987;12:31–34.
100. Kikuchi T, Abe T, Yaekashiwa M, et al. Secretory leukoproteaseinhibitor augments hepatocyte growth factor production in hu-man lung fibroblasts. Am J Respir Cell Mol Biol. 2000;3:364–370.
101. Gillissen A, Birrer P, McElvaney NG, et al. Recombinant secretaryleukoprotease inhibitor augments glutathione levels in lung epi-thelial lining fluid. J Appl Physiol. 1993;75:825–832.
102. Mulligan MS, Lentsch AB, Luber-Lang M, et al. Anti-inflammatoryeffects of mutant forms of secretory leukocyte protease inhibitor.Am J Pathol. 2000;156:1033–1039.
103. Lentsch AB, Jord JA, Czemak BJ, et al. Inhibition of NF-�B activa-tion and augmentation of I�B� by secretory leukocyte proteaseinhibitor during lung inflammation. Am J Pathol. 1999;154:239–247.
104. Arunachalam B, Phan UT, Geuze HJ, Cresswell P. Enzymaticreduction of disulfide bonds in lysosomes: characterization of agamma-interferon-inducible lysosomal thiol reductase (GILT).Proc Natl Acad Sci USA. 2000;97:745–750.
105. Phan UT, Arunachalam B, Cresswell P. Gamma-interferon-induc-ible lysosomal thiol reductase (GILT). J Biol Chem. 2000;275:25907–25914.
106. Phan UT, Maric M, Dick TB, Cresswell P. Multiple species expressthiol oxidoreductases related to GILT. Immunogenetics. 2001;53:342–346.
107. Rajagopalan K. Xanthine oxidase and aldehyde oxidase. In: Ja-koby WB, ed. Enzymatic Basis of Detoxification. New York:Academic Press; 1980:294–307.
108. Al-Salmy HS. Individual variation in hepatic aldehyde oxidaseactivity. Life. 2001;51:249–253.
109. Tsuijita M, Tomita S, Miura S, Ichikawa Y. Characteristic proper-ties of retinal oxidase (retinoic acid synthase from rabbit hepato-cytes. Biochim Biophys Acta. 1994;1204:108–116.
110. Gough PJ, Gordon S, Greaves DR. The use of human CD68transcriptional regulatory sequences to direct high-level expres-sion of class A scavenger receptor in macrophages in vitro and invivo. Immunology. 2001;103:351–361.
111. Rabinowitz SS, Gordon S. Macrosialin, a macrophase-restrictedmembrane sialoprotein differentially glycosylated in response toinflammatory stimuli. J Exp Med. 1991;174:827–836.
112. Spector A, Kuszak JR, Ma W, Wang R-R The effect of aging onglutathione peroxidase-1 knockout mice: resistance of the lens tooxidative stress. Exp Eye Res. 2001;72:533–545.
113. Oleynikov YS, Sun F, Spector A. Cell morphology and cytoskeletaldisruption in lens epithelial cell lines subjected to peroxidestress. ARVO Abstract 2373, 2002.
114. Venter C, Adams MD, Myers EW, et al. The sequence of thehuman genome. Science. 2001;291:1304–1351.
115. Claverie JM. What if there are only 30,000 human genes? Science.2001;291:1255–1257.
116. The International Mouse Mutagenesis Consortium. Functionalannotation of mouse genome sequences. Science. 2001;291:1251–1255.
3264 Spector et al. IOVS, October 2002, Vol. 43, No. 10