different modes of operation
TRANSCRIPT

NoiseincamerasandphotodiodesLaboratoryInstructions
Version:2018-02-19PreparationsforthelabReadthefollowing(canbefoundonthelecturenoteswebpage):
• Chapter5 from fromImageAcquisitionandPreprocessing forMachineVisionSystemsbyP.K.Sinha(Sections5.7,5.9.5and5.9.6arenotincluded;sections5.1-5.3andtheappendixmaybeomittedsincetheyoverlapwithotherpartsofthecourse)
• PhotonTransferNoise(Section3.3nottobeincluded)• Browsepp777-791ofchapter18.6inthecoursebook(Saleh&Teich)• Thislabinstruction
Dothefollowingexercises:1)ACCDcamerahasareadnoiseof5electrons,a fixedpatternnoisequality factorof3%andadarkcurrentof2electrons/s/pixel.Whenthepixelsareexposedtolight,chargesaccumulateatarateof100counts/s.Answerthefollowingquestionsforanexposuretimeof1sandforanexposuretimeof10s.
a) GivetheRMSvaluesforthedifferentnoisesources.b) GivetheRMSvalueforthetotalnoise.c) Givethesignaltonoiseratio.d) Ifyoucouldmakeaperfectcamerawhichdidn’tsufferfromanytechnicalnoise.Whatwouldthe
signaltonoiseratiobe?2)Consider the circuitdiagram inFigure1 (left) showinga reversebiasedphotodiode in serieswithaloadresistorRL.
a) Giventhatthelightimpingingontothephotodiodegeneratesaphotocurrenti=2µA,howbigistheshot-noisecurrentassuminga1Hzbandwidth?
b) GiventhattheresistanceRL=100kΩ,howlargeisthethermalnoisecurrentina1Hzbandwith?c) Atwhatphotocurrent i istheshot-noiseequaltothethermalnoise?Whatvoltagedropacross
theresistanceRLwillthisphotocurrentgiveriseto?
Figure1.Left:CircuitdiagramofreversebiasedphotodiodeinserieswitharesistorRL.Right:Current-voltagecurvesfordifferentlightintensities.Thedashedlineistheloadlinedescribinghowthevoltageacrossthediodedecreaseswithincreasinglightintensity.
Reversebiased(photoconductive)
StrongE-field⇒ Fasterdriftandfasterresponsetime⇒ Increasesdepletionregionand
activearea
Differentmodesofoperation
Opencircuit(photovoltaic)Separatedcarriersbuildsupavoltage
Shortcircuit
i=0
V=0
RL-VB
PurposeIn this labwewill studythenoiseperformancesofaCCDcameraandofaphotodiode,bothwithandwithoutelectronmultiplication.Weallknowthatimagestakeninlowlightconditionsarenoisy.Wewillhere look at how we can quantify the noise and the performance of the camera so that differentcameras can be compared. We will also investigate the fundamental noise limit: photon shot noise.Furthermore,wewillinvestigatehowthenoiseperformanceofaCCDcameracanbeimprovedthroughbinningandelectronmultiplicationgain.
BackgroundTheCCDcameraTheCCDwasinventedin1969byWillardBoyleandGeorgeSmith,atAT&TLabs.In2009theyreceivedtheNobelPrize inPhysics for theirdiscovery. InaCCDcamera theentireareaof thepixel isused forcollectinglight.TheaccumulatedpixelchargeisthensequentiallyshiftedoutoftheCCDarraytoasensenodewherechargeisconvertedtovoltagewhichisthenamplified.Thereadoutsignalrepresentshowmanyelectronswereaccumulatedoneachpixel.TheobviousadvantagewiththeCCDisthattheentirepixelareaisusedforlightcollection.Thearchitectureisalsoveryversatileinlowlightconditionswherethe charge to voltage conversion is verynoisy. If the light collectedby eachpixel is too low to give areasonablesignaltonoiseratio(SNR)severalpixelscanbemergedintoasuper-pixelduringthereadout.This process is calledbinning and is away of sacrificing spatial resolution for improved SNR. Anotherpossibility to improve low light performance is to includea gain registerbefore the charge to voltageconversion.ThegainregistermultipliesthenumberofelectronsineachpixelviaimpactionizationandthedeviceisthereforecalledelectronmultiplyingCCD(EMCCD).NoiseinimagingNoise ispresent inany image.Pixelswhichonaverage receive the samenumberofphotons readoutdifferentvaluesaccording toaGaussiandistribution.Howwellacameraperforms isnotmeasuredbyhowlargesignalitoutputsbutratherbythesignaltonoiseratio(SNR).
!"# = !"#$%&!"#$% = !
!Where ! is the mean pixel value and ! is the standard deviation of the pixel values. The standarddeviationishereexpressedasarootmeansquare(RMS)value.Themainnoisesource isphotonshotnoisewhichcomesfromthefactthatthephotonsarerandomlydistributed in a stream of light. It can be shown that the standard deviation for an average photon
number!!!!"!#$ is !!!!"!#$ (seePhotonstreamsCh.12.2pp458-465).ThismeansthattheSNRis
ultimatelylimitedbythephotonshotnoiselimit:
!"#!!!" =!!!!"!#$!!!!"!#$
= !!!!"!#$!!!!"!#$
= !!!!"!#$
Inasimilarmannerthestandarddeviationforthesignalis
!!!!" = !Sothatintermsofthesignaltheshotnoiselimitcanbeexpressedas

!"#!!!" =!!= !
Thesecondnoisesourceisthereadnoiseofthecamera.Itisgeneratedbytheelectronicsasthechargeon a pixel is read out. Before each readout, the pixel should be reset to a well-defined number ofelectrons. This process isn’t perfect and there is some variance to the reset value. This noisewill beindependentofthesignal.
!!"#$ = !"#$%&#!Thethirdnoisesourceisfixedpatternnoise(FPN).Itiscalled“fixed”becauseitisnotrandom,itisthesamefromoneimagetoanother.FPNcancomefrome.g.dustspecsonthesensorbutthisisgenerallyeasytoclean.InaCMOScameraFPNoriginatesfromfabricationinconsistenciessinceeachpixelhasitsownamplifier,i.e.notallpixelshavethesamegain.Fixedpatternnoisethereforescaleswiththesignal.
!!"# = !! ∗ !WherePNistheFPNqualityfactor.ForaCCDFPN is generallynotaproblemsinceallpixel valuesare readout through the sameoutputnode.IntheearlydaysifdigitalcamerasFPNwasabigproblemforCMOScamerasandthereforeCCDsdominatedthemarket.Asfabricationmethodshaveimproved,FPNcannowadaysgenerallybeignored(atleastforconsumerelectronics).The fourth noise source is dark current noise. It originates from thermally generated electrons thataccumulate on the pixels during long integration times. If all pixels are equally susceptible to darkelectronsthemeannumberofdarkelectronsis! = ! ∗ !(whereDisaconstantandtistime)then
!!"#$ = ! = ! ∗ !Nowadays the dark current is so small that dark current noise isn’t really relevant until you reachexposuretimesofseveralseconds.NoiseinaphotodiodecircuitThesignal-to-noiseratioinelectriccircuitsisusuallydefinedintermsofpower.Inthephotodiodecircuitin fig. 1, the electric power in the load resistor isPelectric =RL· i2. The signal-to-noise ratio is,with thisdefinition,thereforegivenby
!"# = !!!!!
where i is themean valueof the current and!! its standarddeviation. Since the current is a flowofdiscreteparticles,electrons,thereisshot-noiseinasimilarwayasforphotons.Thenumberofelectronspassingacross-sectionduringatimetis!" !leadingtoastandarddeviationinthenumberofelectronsof !" !.Thestandarddeviationofthecurrentduringthetimetisthereforegivenby
!!!!" =!! !" ! = 2!"#
where! = 2 !isthebandwidth.Thedependenceonbandwidthcanbeunderstoodbyconsideringthatlargebandwidthrequiresashortmeasurementtimeleadingtofewelectronsandthushighuncertainty.Aresistorliketheoneinthecircuitinfig.1willintroduceadditionalnoise.Duetothethermallydrivenrandommotion of electrons in the resistor therewill be charge fluctuations that give rise towhat iscalledthermalnoiseorJohnson-Nyquistnoise.Expressedascurrent,thisnoiseisgivenby
!!! =4!"#!
wherekistheBoltzmannconstantandTistheabsolutetemperature.ThegainGinanavalanchephotodiode(APD)willenhanceboththesignalandtheshotnoisebutnotthethermalnoiseandaddinggainmaythereforeimprovetheSNRatlowlightlevels.However,variationsinthegainwillintroduceadditionalnoisedescribedbytheexcessnoisefactorF.Theshot-noisecaninthiscasebewrittenas
!!!!" = 2!"#$%Combiningshot-noiseandthermalnoiseleadstothesignal-to-noiseratio
!"# = !!!!!!"! + !!!!
= !"#$ !
2!!!!!"#$ + !!!!
For the last equality we used that the photocurrent i is given by the photon flux !, the quantumefficiency!andthegainGsuchthat! = !"#!.WithoutgainwecansetG=F=1andtheSNRbecomesshot-noiselimitedforsufficientlylargephotonflux.
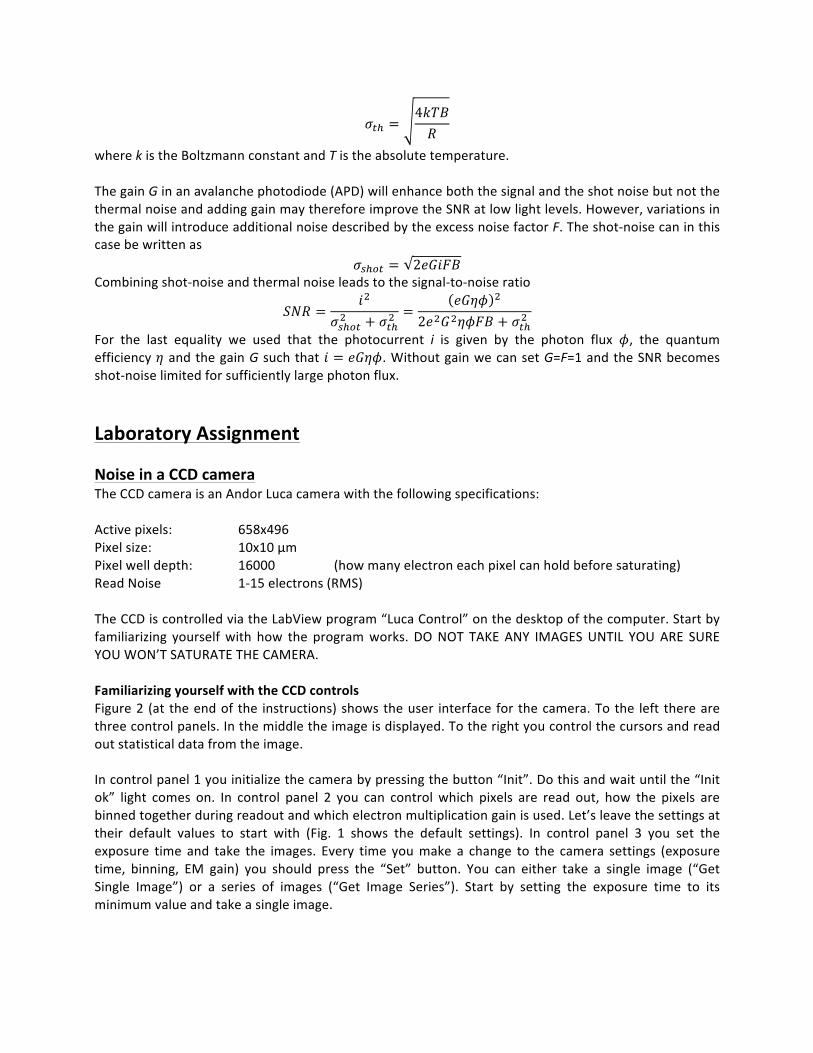
LaboratoryAssignmentNoiseinaCCDcameraTheCCDcameraisanAndorLucacamerawiththefollowingspecifications:Activepixels: 658x496Pixelsize: 10x10µmPixelwelldepth: 16000 (howmanyelectroneachpixelcanholdbeforesaturating)ReadNoise 1-15electrons(RMS)TheCCDiscontrolledviatheLabViewprogram“LucaControl”onthedesktopofthecomputer.Startbyfamiliarizing yourselfwith how the programworks.DONOT TAKEANY IMAGESUNTIL YOUARE SUREYOUWON’TSATURATETHECAMERA.FamiliarizingyourselfwiththeCCDcontrolsFigure2 (at theendof the instructions)showstheuser interfacefor thecamera.Tothe left therearethreecontrolpanels.Inthemiddletheimageisdisplayed.Totherightyoucontrolthecursorsandreadoutstatisticaldatafromtheimage.Incontrolpanel1youinitializethecamerabypressingthebutton“Init”.Dothisandwaituntilthe“Initok” light comes on. In control panel 2 you can control which pixels are read out, how the pixels arebinnedtogetherduringreadoutandwhichelectronmultiplicationgainisused.Let’sleavethesettingsattheir default values to start with (Fig. 1 shows the default settings). In control panel 3 you set theexposure time and take the images. Every time youmake a change to the camera settings (exposuretime, binning, EM gain) you should press the “Set” button. You can either take a single image (“GetSingle Image”) or a series of images (“Get Image Series”). Start by setting the exposure time to itsminimumvalueandtakeasingleimage.

An image is nowdisplayed at the center of the screen and statistical data of the SelectedArea (areawithintheyellowcursors)isseenontheright.Totherightoftheimageisalsoacolorbargivingyoutheintensityscalefortheimage.Abovetheintensityscalethereisanindicatorthatreads“Maxpixelvalue”,duringtheexercisesyoushouldkeepaneyeonthissothatitdoesn’texceed16000.FamiliarizingyourselfwiththeMatlabinterfaceWhenanimageistakenaMatlabscriptiscalledfromLabviewandaMatlabplotshowingahistogramofthepixelvaluesintheSelectedAreapopsup.LabviewopenstheMatlabcommandwindowbutnothingelse.DuringthemeasurementsalldatawillbepassedfromLabviewtoMatlab.ToaccessthedatayouneedtoseetheMatlabworkspace,toopenitrunthecommand“workspace”inthecommandwindow.Youwillalsoneedtoplotthedatainvariouswayswhichisdonebywritingascriptinthematlabeditor,toopen theeditor run thecommand“edit” in thecommandwindow.You shouldnowhave3Matlabwindowsopen(command,workspaceandeditor).Whenyoutakean imageseriesMatlabwillplot thehistogramfor thepixelvalueswithintheSelectedAreaforeachimage.Thestatisticswillbestoredinthefollowingvectors:StatsMean (Avectorwiththepixelmeanvalue,thesignal)StatsStd (Avectorwiththepixelstandarddeviation,thenoise)StatsTime (Avectorwiththeexposuretimes)Once you take anew image series these vectorswill be replaced. To save them for later just renamethem in theMatlabworkspace. Itmakes sense to save theworkspace from time to timewith Ctrl+S.Make sure you save all the vectors listed above for later analysis. You can also save specificMatlabfigurestouseinyourreport.ReadnoiseThe first task in evaluating the camera performance is tomeasure the read noise. Turn off the lightcompletelyand takeadark image.Takean imagewith “GetSingle Image”and lookat thehistogram.What is the signal and what is the standard deviation? Clearly the camera reads out a signal whichdoesn’toriginatefromlightexposure.Thismustbesubtractedfromfurtherimages.OnLabviewcontrolpanel3 you can recordadark imagebypressing “GetDark Image”. Themeanpixel valueof thedarkimagewillnowbesubtractedfromallthefollowingimages.Takeanewimage(stillinthedark)with“GetSingleImage”.Havealookatthehistogram,whathappenstothemeanpixelvalueandwhathappenstothestandarddeviation?Questions:
1. Whatisthemeasuredreadnoiseandhowdoesitcomparetothespecificationforthecamera?InvestigatetheSNRasafunctionofexposuretimeOntheLabviewcontrolpanelcreateanewvector“Exposuretimes,series”withexposuretimesbetweenyourminimumandmaximumexposuretime.Chooseexposuretimeswhichareappropriatetodisplayonalogarithmicscale.TakeanimageseriesandthenprocessthedatainMatlab.Questions:
1. Howmany photons (on average) hit each pixel per second?What is the photon flux densityimpingingthesensor?
2. Plot theSNRasa functionof thesignal.Usea log-logplot sincebothSNRand thesignal spanseveralordersofmagnitude.
3. Markthephotonshotnoiselimitintheplot.Atwhatpointdoesthephotonshotnoiseequalthereadnoise?
4. Dothemeasureddatapointsmatchwhatyouexpectbasedonthereadnoise?5. Plot the SNR as a functionof exposure time.Mark the photon shot noise limit in the plot. At
whatexposuretimedoesthephotonshotnoiseequalthereadnoise?6. CantheSNReverexceedthephotonshotnoiselimit?
BinningChangethebinningsettingsinLabviewcontrolpanel2.Youneedtopress“Set”forthechangetotakeeffect.YoualsoneedtotakeanewDarkImageaswellasrescaletheSelectedArea,askyoursupervisoraboutthis.Beforeyoutakeanentireimageseriesyoushouldtakeafewsingleimages.Startatalowexposuretimeandincreaseitslowlytofindwhentheimagestartstosaturate.Itwillhappenatashorterexposuretimethanbefore.Changethe“Exposuretime,series”vectorontheLabviewcontrolpanel3toreflectthenewmaximum exposure time. If needed ask your supervisor how to delete elements in a Labview vector(don’tjustsetthemtozero).Onceyouhavemadesureyou’vechangedthenamesoftheimagestatisticsvectorsinMatlabyoucantakeanewimageserieswiththenewbinningsettings.Questions:
1. Istheincreaseinsignalproportionaltothebinningfactor?2. Comparethe!"#!"#! !"##"#$with!"#!"#!!"# !"##"#$inaplot.Dothisforat leastonebinning
setting,moreifyouhavetime.3. Include thephoton shot noise limit in your plots.Whendo thebinned images reach the shot
noiselimitcomparedtotheunbinnedimages?4. Comparetheresolutionofafewimageswithdifferentbinningsettings.Inthereportyoushould
visualizethechangeinresolutioninasuitableway.5. Whendoesitmakesensetousebinning?
ElectronmultiplicationgainINORDERNOTTODAMAGETHECAMERA;MAKESUREYOUDON’TSATURATETHEPIXELS!WewillnowinvestigatehowEMgaincanbeusedtoimprovetheSNRundersomecircumstances.TheEMgainvalueinLabviewcontrolpanel1hastothispointbeensetto0.Thisdoesn’tmeanzerogainjustthat the EM gain function is disabled. We will now take a few image series with different EM gainsettingsandevaluatetheSNRasafunctionofexposuretime.Forthesemeasurementsyoucanreturntothe1x1binningusedoriginally.Justlikebeforeyouneedtomakesurethatthecameradoesn’tsaturate.Themoregainyouintroduce,theearlieritwillsaturate.ChangetheEMgainvalueandthentakeafewsingleimagesstartingfromtheminimumexposuretime.IncreaseuntilthemaximumpixelvalueatthetoprightcorneroftheimageontheLabviewscreenapproaches16000.ForeverynewEMgainvalueyouneedtotakeanewDarkImagebeforeyoutaketheexposuretimeseries.Updatethe“Exposuretime,series” vector (REMEMBER TO PRESS SET IN ORDER FOR THE CHANGES TO TAKE EFFECT) and thenacquiretheimageseries.DothiswithafewdifferentEMgainvaluesettings(findthemaximumallowedexposuretimebeforeeachimageseriesacquisition).UseEMgainvaluesupto100butnotmore.Questions:
1. Whatisthesignalgaininyourmeasurements?2. DoestheEMgainvaluerepresentthesignalgain,i.e.isthegain100ifyousettheEMgainvalue
to100?3. Compare the SNR as a function of exposure time for different EM gain settings with the
measurementswithoutEMgain.AlsocomparewiththephotonshotnoiselimitcalculatedinthecaseofnoEMgain.

4. CompareafewimageswithdifferentEMgain(andnoEMgain)attheminimumexposuretime.5. Also do the comparison for an exposure timewhen the image is at the shot noise limit even
withoutEMgain.6. WhendoesitmakesensetouseEMgain?7. TheEMmultiplicationregistermakes536transfers.Basedonthesignalgainyouobservewhatis
theionizationprobabilityateachtransfer?Canfixedpatternnoiseandthedarkcurrentnoisebeignored?Sanitycheck.Whenever you make an assumption you should try to check if it is valid. Take an image with longexposure time and look for fixed pattern noise. You should also take an image in the dark with thelongestexposuretimeyouhaveusedandcheckifthenoiselevelishigherthanjustthereadnoise.Useapieceofclothtocoverthecameraobjectivetomakesurenolighteffectsthemeasurement.Doaverylongexposureandmeasurethedarkcurrent(expressedindarkelectronsaccumulatedpersecond).Questions:
1. Isthereanyfixedpatternnoisethatmighthaveinfluencedthemeasurements?2. Whatisthedarkcurrent?Istheassumptionthatdarkcurrentnoisecanbeignoredvalid?
Noiseinaphotodiode
Duringthispartofthelaboratoryexercise,youwillmeasurethesignal-to-noiseratioofareversebiasedphotodiodeatdifferentlightintensitiesandcomparethiswithwhatyouwouldexpectfromtheory.
WithandwithoutreversebiasStart by applying zero bias to the photodiode and measure the voltage drop over the 100 kΩ loadresistorusingavoltmeterwhilevaryingtheLEDcurrent.PlotthevoltageasafunctionoftheLEDcurrentinalog-logplot.Note:becauseofthelog-logscale,itissuitabletohaveanon-lineardistributionofyourdata points. Start for instance at 50 µA LED current and double the current for each successive datapoint.Nowconnectthebatterytoreversebiasthephotodiodeandrepeatthemeasurement.Plotthedatainthesamegraphasfortheunbiasedphotodiode.Discusstheresults.ThegraphtotherightinFig.1canbeusefulinunderstandingwhatisgoingonwhenapplyingareversebias:ThedashedlineiscalledtheloadlineandshowshowthevoltageoverthediodedecreasesastheincreasingphotocurrentresultsinanincreasedvoltagedropacrossRLthusleavingasmallerfractionofVBtoreversebiasthephotodiode.HowwouldyoudrawtheloadlineforthecaseofVB=0?
ThermalnoiseinresistorsDisconnectboththevoltmeterandthephotodiodefromthe100kΩ resistorandmeasurethevoltagenoise that appear across the resistor by using the lock-in amplifier. In these experiments, the lock-inamplifierisusedasaverysensitiveACvoltmeterwhichmeasurestheRMSdeviations(inV Hz)fromthemeanvoltage.Inthisfirstmeasurement,themeanvoltageisofcoursezerosinceyoumeasurethevoltage across a resistor which is not connected to any voltage or current source. Repeat themeasurementwitha1kΩresistor.Dothevaluesforthevoltagenoisethatyougetforthetworesistorsagreewithwhatyouexpect?

NoiseinthephotodiodesignalNowre-connectthephotodiodetothe100kΩresistorandmeasurethenoisewiththelock-inamplifierasyouvarythelightintensityoftheLED.Tobeabletocalculatethesignal-to-noiseratio(SNR)youalsoneed to measure the “signal”, i.e. the (normal) mean voltage using the voltmeter. However, thevoltmeter is very noisy and should not be connected during the noisemeasurements. You can eitherconnectanddisconnectthevoltmeterbetweeneachdatapointoryousettheLEDcurrenttothesamevaluesasyouusedearlierwhenyouevaluatedtheeffectofareversebiasandusethevoltagesthatyouobtainedthen.Plotthenoiseasafunctionofthevoltage ina log-logplot. Inthesamegraph,plottheshot noise that you would expect from the photocurrent. Discuss and compare with theory. FinallycalculateandplottheSNRinalog-logplot.Inthesamegraph,includetheshot-noiselimitedSNR.Isyourdatashot-noiselimitedforanylightintensities?Discussthedeviations.
Figure2