different methods of calculating body sway area
DESCRIPTION
Different Methods of Calculating Body Sway Area. Thomas Wollseifen Brighton (UK), 9th-12th October 2011. Posturography. Postural instability Parkinson ‘ s disease Sleeping problems Elderly subjects. Centre of pressure. Body sway Length of path Velocity Distribution - PowerPoint PPT PresentationTRANSCRIPT

1
Different Methods of Calculating Body Sway Area
Thomas Wollseifen Brighton (UK), 9th-12th October 2011

2Copyright © 2011 i3 | CONFIDENTIAL
PosturographyY
[cm
]
-7
-6
-5
-4
-3
-2
-1
0
1
2
3
4
5
6
7
X [cm]
-7 -6 -5 -4 -3 -2 -1 0 1 2 3 4 5 6 7
Subject=7
Body sway path - trajectory
Centre of pressure
Body sway Length of path Velocity Distribution Body sway area
Postural instability Parkinson‘s disease Sleeping problems Elderly subjects

3Copyright © 2011 i3 | CONFIDENTIAL
How to calculate the body sway area?
1) Area of convex hull
2) Area of ellipse – Principal component analysis (PCA)
3) Mean of circle areas

4Copyright © 2011 i3 | CONFIDENTIAL
1) Convex hull
convex not convex
Y [
cm]
-7
-6
-5
-4
-3
-2
-1
0
1
2
3
4
5
6
7
X [cm]
-7 -6 -5 -4 -3 -2 -1 0 1 2 3 4 5 6 7
Subject=7
Y [
cm]
-7
-6
-5
-4
-3
-2
-1
0
1
2
3
4
5
6
7
X [cm]
-7 -6 -5 -4 -3 -2 -1 0 1 2 3 4 5 6 7
Convex hullSubject=7
Different algorithms:
Gift wrapping algorithm Triangulation etc.

5Copyright © 2011 i3 | CONFIDENTIAL
Convex hull - Algorithm
Y [
cm]
-7
-6
-5
-4
-3
-2
-1
0
1
2
3
4
5
6
7
X [cm]
-7 -6 -5 -4 -3 -2 -1 0 1 2 3 4 5 6 7
Convex hullSubject=7
1) Triangulation of a point set (PROC G3GRID)
proc g3grid data=_ch00 outtri=_ch01 triangulation of data set out=_temp;grid &y.*&x.=&z.;
run;
2) Calculation of the determinant (of the convex hull = Area)
1433221143322121
1
2
1
1
2
1
21
hullConvex Area xnyxyxyxyynxyxyxyx
yny
y
y
xnx
x
x

6Copyright © 2011 i3 | CONFIDENTIAL
Find the area of this (convex) polygon determinant
152152025)4(621
52
15
34
52
21Area
Y [c
m]
-7
-6
-5
-4
-3
-2
-1
0
1
2
3
4
5
6
7
X [cm]
-7 -6 -5 -4 -3 -2 -1 0 1 2 3 4 5 6 7
(-4,3)
(2,5)
(5,1)
data _det01; set &indata.; x2=lag(&x.); y2=lag(&y.); if not missing(x2) then d1=x2*&y.; else d1=0; if not missing(y2) then d2=y2*&x.; else d2=0;run;
proc sql;create table _det02 as select * ,sum(d1) as sumd1 ,sum(d2) as sumd2 ,(calc. sumd2 – calc. sumd1)*0.5, as det from _det01;quit;

7Copyright © 2011 i3 | CONFIDENTIAL
Find a „better“ bounding box!
PCA
2) Principal component analysis (PCA)Y
[cm
]
-7
-6
-5
-4
-3
-2
-1
0
1
2
3
4
5
6
7
X [cm]
-7 -6 -5 -4 -3 -2 -1 0 1 2 3 4 5 6 7
|e||e|A 21PCA
Y [c
m]
-7
-6
-5
-4
-3
-2
-1
0
1
2
3
4
5
6
7
X [cm]
-7 -6 -5 -4 -3 -2 -1 0 1 2 3 4 5 6 7
e‘2
e‘1
Idea:Reduce dimensionality of a point set by identifying the most significant directions (Principal components = Eigenvectors)

8Copyright © 2011 i3 | CONFIDENTIAL
Principal component analysis with PROC PRINCOMP
proc princomp data=_pca01 COV OUT = _prins;
var &y. &x.;
ods output eigenvectors=_eigenvectors eigenvalues=_eigenvalues;
run;
Covariance Matrix y X
Y 4.526000000 -2.408333333
X -2.408333333 5.195833333
Eigenvalues of the Covariance Matrix
Eigenvalue Difference Proportion Cumulative
1 7.29242620 4.86301907 0.7501 0.7501
2 2.42940713 0.2499 1.0000
Cov(y,y) Cov(y,x)
Cov(x,y) Cov(x,x)

9Copyright © 2011 i3 | CONFIDENTIAL
Calculate 2x2 covariances cov(X,Y) of X,Y:
Prepare covariance matrix: Cov-Matrix
Calculate Eigenvalues and Eigenvectors of the covariance matrix:
From covariance matrix to Eigenvectors / Eigenvalues
Y X
Y 4.53 -2.41
x -2.41 5.20
Cov(y,y) Cov(y,x)
Cov(x,y) Cov(x,x)
Eigenvalue1 7.29Eigenvalue2 2.42
x yEigenvector e1 (0.75, -0.66)Eigenvector e2 (0.66, 0.75)
0)det( EA
n
iii yyxx
nYX
1
))((1
1),cov(
020.541.2
41.253.4

10Copyright © 2011 i3 | CONFIDENTIAL Y
[cm
]
-7
-6
-5
-4
-3
-2
-1
0
1
2
3
4
5
6
7
X [cm]
-7 -6 -5 -4 -3 -2 -1 0 1 2 3 4 5 6 7
Y [
cm]
-7
-6
-5
-4
-3
-2
-1
0
1
2
3
4
5
6
7
X [cm]
-7 -6 -5 -4 -3 -2 -1 0 1 2 3 4 5 6 7
Subject=7
1. Calculate eigenvalues and eigenvectors e1 and e2 of covariance matrix (PROC
PRINCOMP)
2. Calculate centroid of the point set3. Translate point set such that the centroid is moved to the origin4. Transform point set into polar coordinates (with angle and radius r)5. Rotate point set by angle of the 1st eigenvector6. Calculate the bounding box and the length of the eigenvectors e’1 and e’2
Re-rotate bounding box by ange of the 1st eigenvector
7. AreaPCA=
Find a bounding box - Algorithm
|||| 21 ee
X [cm]
Y [c
m]
-7
-6
-5
-4
-3
-2
-1
0
1
2
3
4
5
6
7
-7 -6 -5 -4 -3 -2 -1 0 1 2 3 4 5 6 7
|e‘2| =2.78
|e‘1|=4.57
centroid
2. – 6. 7.
Tranform & rotate Rotate box

11Copyright © 2011 i3 | CONFIDENTIAL
3) Mean circle area - Algorithm
1. Transformation into polar coordinates (r,)2. Calculate the integer (INT) of each angle for each data point3. Calculate max radius r for each angle (360 different angles possible)4. For each remaining data point p‘ (r, ) calculate the circle area5. Am= ·r²
Y [
cm]
-7
-6
-5
-4
-3
-2
-1
0
1
2
3
4
5
6
7
X [cm]
-7 -6 -5 -4 -3 -2 -1 0 1 2 3 4 5 6 7
Mean circle areaSubject=7
Y [
cm]
-7
-6
-5
-4
-3
-2
-1
0
1
2
3
4
5
6
7
X [cm]
-7 -6 -5 -4 -3 -2 -1 0 1 2 3 4 5 6 7
area=37.10area=37.10area=37.10area=37.10area=37.10area=37.10area=37.10area=37.10area=37.10area=37.10area=37.10area=37.10area=37.10area=37.10
Mean circle areaSubject=7
Y [
cm]
-7
-6
-5
-4
-3
-2
-1
0
1
2
3
4
5
6
7
X [cm]
-7 -6 -5 -4 -3 -2 -1 0 1 2 3 4 5 6 7
Subject=7
1.-4.
5.
Am= ·r²
A1= ·r² ... ...A14= ·r²

12Copyright © 2011 i3 | CONFIDENTIAL
Mean circle area – Simple exampleY
[cm
]
-7
-6
-5
-4
-3
-2
-1
0
1
2
3
4
5
6
7
X [cm]
-7 -6 -5 -4 -3 -2 -1 0 1 2 3 4 5 6 7
area=24.54area=24.54area=24.54area=24.54
Mean circle sumusubjid=1
max_r x y rtheta pi n area_i
mean_area
0 0 0 0 03,1415
93 4 0 24,54
3,61 2 3 3,61 563,1415
93 4 40,84 24,54
2,24 -2 1 2,24 1533,1415
93 4 15,71 24,54
3,64 1 -3,5 3,64 2853,1415
93 4 41,63 24,54
Polar coordinates Circle Area
41.6
40.8
15.70
Y [
cm]
-7
-6
-5
-4
-3
-2
-1
0
1
2
3
4
5
6
7
X [cm]
-7 -6 -5 -4 -3 -2 -1 0 1 2 3 4 5 6 7
Mean circle sumusubjid=1
24.5

13Copyright © 2011 i3 | CONFIDENTIAL
Comparison of methods Y
[cm
]
-7
-6
-5
-4
-3
-2
-1
0
1
2
3
4
5
6
7
X [cm]
-7 -6 -5 -4 -3 -2 -1 0 1 2 3 4 5 6 7
Convex hullSubject=7
Y [
cm]
-7
-6
-5
-4
-3
-2
-1
0
1
2
3
4
5
6
7
X [cm]
-7 -6 -5 -4 -3 -2 -1 0 1 2 3 4 5 6 7
PCA ellipseSubject=7
Y [
cm]
-7
-6
-5
-4
-3
-2
-1
0
1
2
3
4
5
6
7
X [cm]
-7 -6 -5 -4 -3 -2 -1 0 1 2 3 4 5 6 7
Mean circle areaSubject=7
Convex hull PCA method Circle method
ACH=26.2 [cm²] APCA=39.9 [cm²] ACM=37.1 [cm²]
14Copyright © 2011 i3 | CONFIDENTIAL
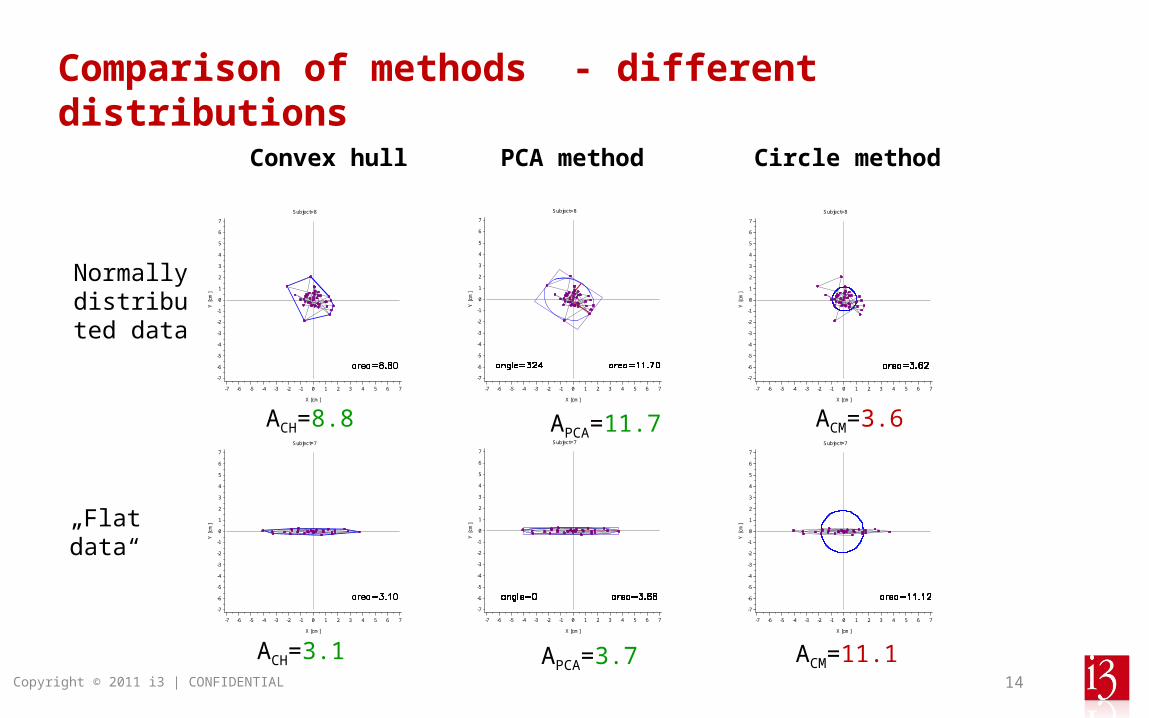
Comparison of methods - different distributions
Convex hull PCA method Circle method
Y [
cm]
-7
-6
-5
-4
-3
-2
-1
0
1
2
3
4
5
6
7
X [cm]
-7 -6 -5 -4 -3 -2 -1 0 1 2 3 4 5 6 7
Subject=7
Y [
cm]
-7
-6
-5
-4
-3
-2
-1
0
1
2
3
4
5
6
7
X [cm]
-7 -6 -5 -4 -3 -2 -1 0 1 2 3 4 5 6 7
Subject=7
Y [
cm]
-7
-6
-5
-4
-3
-2
-1
0
1
2
3
4
5
6
7
X [cm]
-7 -6 -5 -4 -3 -2 -1 0 1 2 3 4 5 6 7
Subject=7
Y [
cm]
-7
-6
-5
-4
-3
-2
-1
0
1
2
3
4
5
6
7
X [cm]
-7 -6 -5 -4 -3 -2 -1 0 1 2 3 4 5 6 7
Subject=8
Y [
cm]
-7
-6
-5
-4
-3
-2
-1
0
1
2
3
4
5
6
7
X [cm]
-7 -6 -5 -4 -3 -2 -1 0 1 2 3 4 5 6 7
Subject=8
Y [
cm]
-7
-6
-5
-4
-3
-2
-1
0
1
2
3
4
5
6
7
X [cm]
-7 -6 -5 -4 -3 -2 -1 0 1 2 3 4 5 6 7
Subject=8
„Flat data“
Normally distributed data
ACH=8.8 APCA=11.7 ACM=3.6
ACH=3.1 APCA=3.7 ACM=11.1

15Copyright © 2011 i3 | CONFIDENTIAL
Comparison of methods – different test data
Test data
Calculation Method N Mean Std min max
Pairwise comparison
p-valueF-test
NormalDistr.?
test01 1 Convex hull 10 1.78 1.22 0.1 3.31-2: 0.97891-3:<0.00012-3:<0.0001
<0.0001 No2 PCA ellipse 10 2.08 1.44 0.1 3.9
3 Mean circle 10 13.88 5.65 11.1 29.6
test02 1 Convex hull 10 3.58 2.45 0.3 6.71-2: 0.87851-3:<0.00012-3:<0.0001
<0.0001 Yes2 PCA ellipse 10 4.16 2.84 0.4 7.8
3 Mean circle 10 11.85 2.66 10.1 18.7
test03 1 Convex hull 10 5.36 3.68 0.4 10.01-2: 0.83291-3: 0.00142-3: 0.0062
0.0010 No2 PCA ellipse 10 6.23 4.25 0.5 11.6
3 Mean circle 10 11.30 1.54 10.0 14.5
test04 1 Convex hull 10 8.93 6.16 0.6 16.71-2: 0.83671-3: 0.64922-3: 0.9444
0.6683 Yes2 PCA ellipse 10 10.33 7.12 0.7 19.3
3 Mean circle 10 11.11 0.95 10.1 12.9

16Copyright © 2011 i3 | CONFIDENTIAL
Y [
cm]
-7
-6
-5
-4
-3
-2
-1
0
1
2
3
4
5
6
7
X [cm]
-7 -6 -5 -4 -3 -2 -1 0 1 2 3 4 5 6 7
Convex hullSubject=7
Y [
cm]
-7
-6
-5
-4
-3
-2
-1
0
1
2
3
4
5
6
7
X [cm]
-7 -6 -5 -4 -3 -2 -1 0 1 2 3 4 5 6 7
PCA ellipseSubject=7
Y [
cm]
-7
-6
-5
-4
-3
-2
-1
0
1
2
3
4
5
6
7
X [cm]
-7 -6 -5 -4 -3 -2 -1 0 1 2 3 4 5 6 7
Mean circle areaSubject=7
Summary
Convex hull Areaconvex hull < AreaPCA
Good approximation of the body sway area Data independent Encloses all data points
PCA ellipse Magnitude and direction Data independent Comparable result as convex hull Not all data points area enclosed
Circle method
Fast algorithm Crude approximation of the sway area Depends on data distribution Not all data points area enclosed
- -

17Copyright © 2011 i3 | CONFIDENTIAL
Questions &Answers
PharmaNet / [email protected] 965183 WiesbadenGermany
Contact details