differences in male and female predictors of success in ... · pdf filedifferences in male and...
TRANSCRIPT

Distribution Unlimited
Differences in Male and Female
Predictors of Success in the
Marine Corps: A Literature Review Shannon Desrosiers and Elizabeth Bradley
February 2015
Copyright © 2015 CNA
This document contains the best opinion of CNA at the time of issue.
It does not necessarily represent the opinion of the sponsor.
Distribution
Cleared for Public Release; Distribution Unlimited. Specific authority: N00014-11-D-0323.
Camp Lejeune, North Carolina — SgtMaj Robin Fortner, left, sergeant major of the
Ground Combat Element Integrated Task Force (GCE ITF), speaks with Sgt Jason
McMullen, light armored vehicle crewman, Company B, GCE ITF, during a limited
technical inspection at the 2nd Light Armored Reconnaissance Battalion ramp,
September 9, 2014. Each vehicle came with dozens of tools and upkeep equipment.
From October 2014 to July 2015, the GCE ITF will conduct individual- and collective-level
skill training in designated ground combat arms occupational specialties to facilitate
the standard-based assessment of the physical performance of Marines in a simulated
operating environment performing specific ground combat arms tasks. (Official Marine
Corps photo by Cpl Paul S. Martinez/Released)
Approved by: February 2015
Anita Hattiangadi, Research Team Leader
Marine Corps Manpower Team
Resource Analysis Division

i
Abstract
As part of the Marine Corps Force Integration Plan considering female integration
into previously closed Military Occupational Specialties and units, CNA was asked to
support the Marine Corps Recruiting Command’s research needs. This research
memorandum, which reviews the literature on predictors of male and female Marine
performance over the last 25 years, will inform CNA’s work examining the impact of
previous female integration as well as future trend analysis. Performance measures
include attrition and promotion at different milestones. We reviewed studies of
Marine Corps performance for enlisted personnel and officers. Some enlisted
equations were separately estimated for men and women, but officer equations were
not. We observe that some factors are solid predictors of lower Marine Corps enlisted
attrition for both men and women, such as time in the Delayed Entry Program,
Armed Forces Qualification Test score, education, race/ethnicity, enlistment waivers,
and being recruited as a high school senior. Other predictors of enlisted attrition,
such as age, vary by gender.

ii
This page intentionally left blank.

iii
Executive Summary
As part of the Marine Corps’ consideration of female integration into previously
closed Military Occupational Specialties (MOSs) and units, the Marine Corps Force
Innovation Office asked CNA to support the Marine Corps Recruiting Command’s
(MCRC’s) research needs. CNA’s support to MCRC as part of the Marine Corps Force
Integration Plan (MCFIP) includes a literature review on the predictors of male and
female performance, direct support of MCRC in conducting trend analysis, and
estimating the size of the qualified officer candidate population.
This research memorandum reviews the literature on predictors of Marine
performance, separately for men and women. We reviewed the past 25 years of work
on Marine performance for enlisted personnel and the officer corps, which will
inform our work examining past gender integration as well as future trend analysis.
Many studies of enlisted performance separately estimated effects by gender, but the
officer studies did not.
Overall, we find that some factors are solid predictors of Marine Corps enlisted
attrition and retention for both men and women. In general, spending more time in
the Delayed Entry Program (DEP), having a higher Armed Services Qualification Test
(AFQT) score, having a Tier 1 education credential, or being recruited as a high
school senior were predictive of lower attrition (i.e., recruit-training and first-term
attrition) and an increased likelihood of being recommended and eligible to reenlist
for both male and female Marines. In terms of race and ethnicity, white non-Hispanic
men and women have higher recruit-training and first-term attrition. Having no
enlistment waivers was predictive of lower 24-month and first-term attrition for both
men and women.
Other predictors of Marine Corps enlisted attrition, such as age, vary by gender.
Being older was a predictor of higher attrition in the DEP, in recruit training, and at
24 months for men, but age was an insignificant predictor of female attrition.
In officer retention, promotion, and Fitness Report (FITREP) studies, researchers did
not separately estimate equations by gender. Although we cannot glean anything
about gender differences in performance predictors from these studies, we do
observe that some factors—such as being married, having a higher ranking at The
Basic School (TBS), being commissioned through the United States Naval Academy
(USNA), or being a woman—were consistent predictors of higher officer retention,
promotion, and FITREP scores at different paygrades and years of service.
iv
Some factors were inconsistent predictors of officer retention, promotion, and
FITREP scores at different paygrades, such as being prior enlisted, older, black, or
holding an aviation MOS. Other factors were positive predictors of officer retention
and promotion but insignificant predictors of officer FITREP scores, such as having a
graduate degree or combat experience.
We also look at consistent predictors of enlisted promotion and good conduct. Poor
conduct includes such factors as non-judicial punishments (NJPs) and desertions.
Many factors that predicted high rates of enlisted retention also predicted high rates
of enlisted promotion and good conduct. These factors included more time in DEP, a
Tier 1 education credential, and higher AFQT scores. Among enlistment waiver types,
some were consistent predictors of poor conduct, such as “positive drug and alcohol
test,” “serious misdemeanor,” and “adult felony” waivers. Other factors, such as
ethnicity and marital status, were less consistent predictors of enlisted promotion
and good conduct.
There are several similarities between the predictors of enlisted and officer attrition,
including such demographic characteristics as age, marital status, and gender. Some
predictors, however, are not applicable to both groups. For example, time in DEP and
the trimester in which a recruit ships to recruit training will not apply to the officer
population. Instead, the officer retention studies investigate how commissioning
source and TBS performance help to predict officer retention. Certain factors
similarly predict enlisted and officer promotion, such as marital status and race,
while other factors uniquely predict officer promotion—again, such as
commissioning source and TBS ranking.
By understanding the strong predictors of past performance, we can better estimate
the future performance of Marines. The information contained in this literature
review will inform CNA’s other MCFIP work in support of MCRC’s research needs. In
particular, we can use the identified predictors of Marine performance in (1)
regression modeling of above- or below-average performance, as well as the ability or
propensity to serve in combat arms MOSs, (2) trend analysis identifying the
characteristics of female versus male Marine markets, and (3) analysis of whether the
demographics and quality of female enlistees will change over time with the lifting of
the combat exclusion policy.

v
Contents
Introduction ............................................................................................................................ 1
Identifying Predictors of Retention and Attrition ........................................................... 3
Predictors of Marine Corps enlisted retention and attrition measures ..................... 3
Delayed Entry Program (DEP) attrition ...................................................................... 3
Recruit-training attrition/separation ......................................................................... 6
First-term attrition ......................................................................................................... 8
Recommended and eligible for reenlistment ......................................................... 12
Reenlistment ................................................................................................................. 12
Predictors of Marine Corps officer retention and attrition measures ..................... 16
Retention to YOS 7 ....................................................................................................... 16
Retention to YOS 10 .................................................................................................... 18
Retention to O-5 ........................................................................................................... 19
Identifying Predictors of Promotion ................................................................................ 20
Predictors of Marine Corps enlisted promotion ........................................................... 20
Promotion to corporal (Cpl) ....................................................................................... 20
Meritorious promotion ................................................................................................ 21
Predictors of Marine Corps officer promotion ............................................................. 22
Promotion to major (Maj) ........................................................................................... 22
Promotion to lieutenant colonel (LtCol) .................................................................. 23
Promotion to colonel (Col) ......................................................................................... 24
Identifying Predictors of Conduct .................................................................................... 26
Predictors of enlisted Marine conduct ............................................................................ 26
Good conduct award ................................................................................................... 26
Misconduct separation ................................................................................................ 26
Demotion by 48 months ............................................................................................. 27
Desertion by 48 months ............................................................................................. 28
Identifying Predictors of Other Performance Measures .............................................. 29
Predictors of other enlisted performance measures ................................................... 29
vi
Navy and Marine Corps Achievement Medal .......................................................... 29
Predictors of other officer performance measures ...................................................... 30
Fitness Reports (FITREPs) ........................................................................................... 30
Conclusion ............................................................................................................................ 33
Appendix: Summary of the Included Literature ............................................................ 40
References ............................................................................................................................. 45
vii
List of Tables
Table 1. Predictors of enlisted retention and attrition measures, separately
for men and women ...................................................................................... 13 Table 2. Predictors of enlisted reenlistment and retention, jointly for men
and women ...................................................................................................... 15 Table 3. Predictors of officer retention and attrition, jointly for men and
women .............................................................................................................. 17 Table 4. Predictors of enlisted promotion, jointly for men and women ........... 21 Table 5. Predictors of officer promotion, jointly for men and women .............. 25 Table 6. Predictors of enlisted conduct, jointly for men and women ................ 27 Table 7. Predictors of other enlisted performance measures, jointly for
men and women ............................................................................................. 29 Table 8. Predictors of officer FITREP scores, jointly for men and women ........ 31 Table 9. Summary table of predictors of enlisted attrition and retention ........ 35 Table 10. Summary table of predictors of officer retention, promotion, and
Fitness Report scores (FITREPs) .................................................................. 37 Table 11. Summary table of predictors of enlisted promotion, good conduct,
and other performance measures .............................................................. 39 Table 12. DEP attrition studies ..................................................................................... 40 Table 13. MCRD attrition studies ................................................................................. 40 Table 14. First-term attrition studies .......................................................................... 41 Table 15. Reenlistment studies ..................................................................................... 41 Table 16. Officer retention studies .............................................................................. 42 Table 17. Enlisted promotion, conduct, and medal studies ................................... 42 Table 18. Officer promotion studies ........................................................................... 43 Table 19. Officer FITREP studies .................................................................................. 44

viii
This page intentionally left blank.

ix
Glossary
AFQT Armed Forces Qualification Test
ASVAB Armed Services Vocational Aptitude Battery
DAT Drug and Alcohol Test
DEP Delayed Entry Program
DTIC Defense Technical Information Center
ECP Enlisted Commissioning Program
FITREP Fitness Report
FMAM February, March, April, May
GCT General Classification Test
GPA Grade Point Average
IST Initial Strength Test
JJAS June, July, August, September
MCD Marine Corps District
MCFIP Marine Corps Force Integration Plan
MCRC Marine Corps Recruiting Command
MCRD Marine Corps Recruiting Depot
MECEP Marine Enlisted Commissioning Educational Program
MOS Military Occupational Specialty
NJP Non-Judicial Punishment
NPE Not Prior Enlisted
NPS Naval Postgraduate School
NROTC Navy Reserve Officer Training Corps
OCC Officer Commissioning Course
ONDJ October, November, December, January
PE Prior Enlisted
PEF Program Enlisted For
PFT Physical Fitness Test
PLC Platoon Leaders Class
PME Professional Military Education
RO Reviewing Officer
TBS The Basic School
USNA United States Naval Academy
YOS Years of Service

x
This page intentionally left blank.
1
Introduction
As part of the Marine Corps’ consideration of female integration in combat arms
Military Occupational Specialties (MOSs) and units under the Marine Corps Force
Integration Plan (MCFIP), CNA has been tasked with supporting the Marine Corps
Recruiting Command’s (MCRC’s) research needs. Task 4 includes a literature review
of predictors of female versus male Marine performance, direct support for MCRC’s
trend analysis, and the creation of officer qualified candidate population estimates
(adjusted medically, by propensity, and by gender, at the college student level and
the college graduate level).
This research memorandum is the deliverable for task 4a. We searched past CNA
studies, sources archived in the Defense Technical Information Center (DTIC), and
Google Scholar to perform this review of literature from the 1990s to the present on
predictors1 of female versus male Marine performance. This information was
necessary to support the research needs and regression modeling in task 4c—direct
support for trend analysis. This literature review helps to inform three questions that
are part of the task 4c trend analysis:
1. What are the accession characteristics of women with above- or below-average
performance?
2. What are the identifying characteristics of the female Marine recruit market
when compared with the male Marine recruit market?
3. With the lifting of the combat exclusion policy, will the demographics and
quality of female enlistees change over time?
Performance in the Marine Corps can be evaluated across several dimensions. Some
studies measure performance across various retention milestones, whereas others
evaluate performance at different promotion points. Still other studies predict other
1 In this memorandum, the term predictors of performance refers to variables that are
statistically significantly related to performance outcomes of interest, such as retention and
promotion. By using the term predictors we do not mean to imply that out-of-sample prediction
models have shown these variables to consistently predict the performance outcomes of
interest. This would be a much stronger relationship for which many of the studies included in
this literature review have not tested.
2
performance measures, such as the Good Conduct Medal2 and other personal
decorations, such as the Navy and Marine Corps Achievement Medal.
Enlisted women traditionally have had higher attrition than their male counterparts
in the Delayed Entry Program, in recruit training, and in the first term, but their long-
term retention rates have generally been higher, given that they are retained past
their initial contracts. Unfortunately, very few studies separately track male and
female predictors of career success. In this report, we highlight differences in male
and female success predictors, where observed, but note that the majority of
predictors are estimated for both men and women simultaneously.3 In the future,
researchers should separately estimate male and female equations if they are
interested in whether the career performance of men and women is affected by
different factors in different ways.
In this report, we also distinguish between enlisted and commissioned officer
performance predictors because performance measures are different for enlisted
Marines and officers. By understanding strong predictors of performance from past
Marine Corps studies, we can better identify good candidates for predicting
performance in future modeling efforts, such as that in task 4c—direct support for
trend analysis.
2 This medal is given for every three consecutive years of problem-free enlisted service.
3 When male and female predictors are estimated simultaneously, the model’s coefficients on
the predictors are the same for both men and women.
3
Identifying Predictors of Retention
and Attrition
Retention and attrition metrics are some of the most basic indicators of performance
in the Marine Corps. Identifying those who are likely to attrite early is critical if the
Marine Corps is to recruit a cost-effective and high-performing force. Predicting
whether a Marine stays in the Marine Corps until different career milestones is the
focus of several past studies. We first review the predictors of enlisted Marine
retention and attrition; then we turn to Marine officer retention. Later in this section,
Table 1 presents a summary of the literature on retention and attrition.
Predictors of Marine Corps enlisted retention
and attrition measures
Delayed Entry Program (DEP) attrition
The Marine Corps makes a significant investment in recruiting, mentoring, and
training Marines before they arrive at recruit training. While potential Marines are
waiting to ship to recruit training, they enter the DEP; however, not everyone who
arrives in the DEP will eventually ship to recruit training. Moreover, those who stay
longer in the DEP and do not attrite have lower later attrition rates in the Marine
Corps.4 Thus, while someone attriting from the DEP is expensive, the same person
attriting later in his or her Marine Corps career is more expensive. Table 12 in the
appendix provides an overview of the DEP attrition literature referenced in this
report.
One recent study finds that, between FY 2005 and FY 2012, 20.1 percent of male
Marine poolees and 28.6 percent of female Marine poolees attrited from the DEP [1].
Because male and female DEP attrition rates substantially differ, the study goes on to
estimate the factors that predict DEP attrition separately for men and women [1]. It is
4 We discuss this point in more detail later in this report.

4
important for recruiters to consider these different predictors of male and female
DEP attrition when trying to estimate the percentage of their poolees that will
ultimately ship to recruit training. For both men and women, the longer a recruit
stayed in the DEP, the more likely he or she was to attrite from the DEP. For men, the
following factors all decreased the likelihood of a poolee attriting from the DEP:
attending at least some college, being recruited as a high school senior,5 having an
Armed Forces Qualification Test (AFQT) score of 50 or above, or entering the DEP
during a period of high unemployment for 16- to 24-year-olds [1]. All of these factors
decreased female DEP attrition rates, as well, except attending at least some college,
which was not statistically significant [1]. The effects for women were generally
larger than the effects for men: for example, women who spent five months in the
DEP had DEP attrition rates that were 12.6 percentage points higher than women who
spent three months in the DEP, while men who spent five months in the DEP had DEP
attrition rates that were 7.8 percentage points higher than men who spent three
months in the DEP.
Moreover, Asian, black, and Hispanic men were more likely than white men to attrite
from the DEP. However, Hispanic and other-race women were less likely than white
women to attrite from the DEP, and there was no statistically significant difference in
the DEP attrition rates of Asian and black women compared with white women [1].
Men who were 22 or older were more likely to attrite from the DEP than men who
were younger than 22. Age, however, was not related to female DEP attrition. Single
men with no dependents were more likely to attrite from the DEP than married men
or men with dependents. In contrast, single women with no dependents were no
more likely to attrite from the DEP than married women or women with no
dependents.
Two earlier Naval Postgraduate School (NPS) theses estimated predictors of DEP
attrition simultaneously for men and women, one for FY 2000 to FY 2001 cohorts
and the other for FY 2000 to FY 2005 cohorts [2-3]. Both studies found that female,
black, or older poolees were more likely to attrite from the DEP than their peers [2-3].
These studies also found that those who were recruited as high school graduates
were less likely to drop out of the DEP than those recruited as high school seniors [2-
3]. A higher AFQT score was found to increase DEP attrition in the FY 2000 to FY
2005 study [3], but it was an insignificant predictor of DEP attrition in the FY 2000 to
FY 2001 study [2].
5 The negative relationship between being a high school senior and DEP attrition is found when
the number of DEP months is held constant. If DEP months are not held constant, high school
seniors (because of their longer average DEP stays) have higher attrition than high school
graduates.
5
The FY 2000 to FY 2005 study found that married poolees or those with dependents
were less likely to attrite than unmarried poolees or those without dependents [3].
Similarly, the FY 2000 to FY 2001 study found that those with dependent waivers
were less likely to attrite from the DEP than their peers [2]. In fact, those with
medical, age, or administrative enlistment waivers were found to be less likely to
attrite from the DEP than their nonwaivered peers [2].
Those who remained in the DEP longer were more likely to drop out of the DEP [2-3].
In addition, poolees who enlisted on the last day or week of the month were more
likely to attrite before they shipped to recruit training [2-3]. The season in which a
poolee entered the DEP also was found to be an important predictor of DEP attrition
in the FY 2000 to FY 2001 study. Those who signed contracts in the spring were the
least likely to attrite from the DEP [2]. The spring is generally a very difficult
recruiting period. Those who contract in the spring have already completed high
school, so they are available to ship right away and therefore have generally shorter
DEP times, on average, which could explain why they attrited from the DEP at lower
rates.
These two earlier studies found conflicting results when estimating how a poolee’s
recruiting district of origin affected DEP attrition. The FY 2000 to FY 2001 study
found that those recruited from the 1st, 6th, and 9th Marine Corps Districts (MCDs) (the
Northeast, Southeast, and Midwest) were more likely to attrite from recruit training
than those recruited from the 4th MCD (Eastern and Mid-Atlantic states) [2]. The FY
2000 to FY 2005 study found that those recruited from the 6th, 9th, and 12th MCDs (the
Southeast, Midwest, and West) were less likely to attrite than those from the 1st MCD
(the Northeast); it also found that those recruited from western regions were less
likely to attrite than those recruited from eastern regions [3]. DEP attrition by MCD is
likely to change over time, as both leadership and economic conditions in the
districts change. The FY 2000 to FY 2005 study included variables to represent the
health of the economy in various regions and found that those in districts with
higher 16- to 24-year-old unemployment rates were less likely to attrite from the DEP
than those recruited in districts with lower unemployment rates [3].
The FY 2000 to FY 2001 NPS study includes several other interesting variables not
found in any of the other known DEP attrition studies. If poolees took the Armed
Services Vocational Aptitude Battery (ASVAB) more than 25 days before enlistment,
they were less likely to attrite from the DEP [2]. In addition, those whose recruit-
training shipping dates were moved fewer than six times were less likely to attrite
from the DEP than those whose shipping dates moved six or more times [2]. Poolees
whose enlistment contract sources were recruiter generated (e.g., by recruiter
telephone calls or shopping mall canvassing) were more likely to attrite from the DEP
than those whose sources were recruitment programs (e.g., DEP referral, command
recruiter referral, priority prospect/“hot lead”) [2]. Furthermore, those who were

6
eligible to receive a bonus were more likely to attrite from the DEP than those who
were not [2].
In summary, spending less time in DEP, being recruited as a high school senior,
having an AFQT score of 50 or above, and higher 16- to 24-year-old unemployment
rates are associated with lower male and female DEP attrition rates. Race and
ethnicity also were significantly related to male and female DEP attrition rates, but
the direction of each factor’s relationship to DEP attrition differed by gender; for
example, being Hispanic increased attrition likelihood for men, while it decreased it
for women [1]. Other factors, such as college attendance, age, and marital and
dependent status, were significantly related to DEP attrition for men but did not help
to predict female DEP attrition [1]. These subtle differences between male and female
predictors of poolee performance are important to keep in mind as we examine the
factors that influence performance once poolees ship to recruit training and once
those in recruit training become Marines.
Recruit-training attrition/separation
A significant number of poolees who ship to recruit training do not successfully
complete the graduation requirements to become a Marine. From FY 1979 to FY
2009, male recruit-training attrition rates ranged from a high of 16 percent in FY
1982 to a low of 8 percent in FY 2009 [4]. Over the same time period, the female
recruit-training attrition rate peaked at 30 percent in FY 1993 and bottomed out at
around 12 percent in FY 1981 [4]. In the most recent period studied in [4] (FY 2000 to
FY 2009), recruit-training attrition ranged from 15 to 21 percent for women and from
8 to 12 percent for men. With female rates nearly twice those of men, it raises the
question of whether the factors that predict recruit-training completion also vary
between men and women.6
Several studies attempt to answer this question. Table 13 in the appendix
summarizes the studies referenced in this report that examine recruit-training
attrition. Some studies find a few common factors that predict attrition across men
and women. From FY 2002 to FY 2005, unmarried men and women were less likely to
attrite from recruit training than married men and women [5]. Two studies that
covered FY 1999 to FY 2009 found that black, Hispanic, or other-race men and
women were less likely than white men and women to attrite from recruit training [4-
5]. Reference [5] also found that younger male Marine recruits were less likely to
6 Men and women have different required accession standards. One study compares men and
women of similar fitness levels and finds more similar recruit-training attrition rates.
7
attrite from recruit training but that age was not significantly related to female
recruit-training attrition.
The two studies documented in [4-5] find that men and women who spent three or
more months in DEP were less likely to attrite from recruit training than those who
spent less time in DEP. Those who persist in the DEP might be more committed to
becoming Marines and, therefore, be more likely to make it through recruit training.
Another study finds that men who were not direct shippers or who attended recruit
training at Parris Island were less likely than their peers to attrite from recruit
training; it does not find the direct shipper result for women [4].7
In addition, two different studies on accession cohorts FY 1999 to FY 2009 and
accession cohorts FY 2002 to FY 2005 found that men and women who shipped in
October, November, December, or January (ONDJ) or June, July, August, or September
(JJAS) were less likely to attrite from recruit training than those who shipped in
February, March, April, or May (FMAM) [4-5]. Furthermore, the FY 2002 to FY 2005
accession cohort study found that men and women who were recruited as high
school seniors were less likely to attrite from recruit training [5], while the FY 1999
to FY 2009 cohort study found this only for men [4].
Several factors related to academic ability predict recruit-training attrition. Men who
had a Tier 1 education credential8 or higher AFQT scores were less likely to attrite
from recruit training [5-6]. Education tier and AFQT were not predictive of female
recruit-training attrition in any of the studies.
Also, from FY 2002 to FY 2005, men and women who performed better on Marine
Corps Recruit Depot (MCRD) Initial Strength Test (IST) crunches and run times were
less likely to attrite from recruit training, although these physical fitness measures
were stronger predictors for women than for men [5]. Of interest, these studies find
different results when studying the effect on recruit-training attrition of men and
women meeting retention height and weight standards. While earlier studies found
that meeting height and weight standards was predictive of lower attrition for men
and women, recent findings are more mixed. In the FY 1999 through FY 2009 study,
meeting retention height and weight standards at accession increased the likelihood
of female recruit-training attrition but decreased the likelihood of male recruit-
training attrition [4]. In the FY 2002 through FY 2005 study, however, meeting height
and weight standards again decreased the likelihood of recruit-training attrition for
men but had no effect for women [5].
7 It did not include a variable for whether women attended recruit training at San Diego or
Parris Island because women attend recruit training only at Parris Island.
8 Those with Tier 1 education credentials include those with high school diplomas.

8
Another study estimates the factors that predict recruit-training attrition from FY
2005 to FY 2012 for men and women separately and finds results similar to those of
the previous studies [7]. The authors find that certain variables have the same
relationship direction for both men and women. Male and female Asians and
Hispanics are less likely to attrite from recruit training than are white men and
women. Both men and women with IST scores in the middle and bottom thirds are
more likely to attrite from recruit training than those with IST scores in the top third
[7]. High-quality9 men and women and those without enlistment waivers are less
likely to attrite from recruit training [7]. Those who have spent three or more months
in DEP also are less likely to attrite from recruit training. Those who ship to recruit
training in ONDJ and FMAM are more likely to attrite from recruit training than those
who ship in JJAS [7].
Some variables were significant for only one gender in this study. Male Marines who
are older at accession are more likely to attrite from recruit training [7]. Men who are
eligible to receive enlistment bonuses are less likely to attrite from recruit training
[7]. Black women are less likely to attrite from recruit training than white women;
however, there is no statistically significant relationship for black male versus white
male recruit-training attrition [7]. Men who went through recruit training at Parris
Island are more likely to attrite [7].10
An FY 1997 to FY 1999 study assesses the relationship between different enlistment
waiver types and recruit-training attrition [8]. It finds that, for women, “drug use in
DEP” waivers predict the highest female recruit-training attrition rates. Meanwhile,
“dependent,” “drug use,” and “adult felony” waivers predict the highest male recruit-
training attrition rates [8].
First-term attrition
Marine Corps initial enlistment contracts are typically eight years with a three-, four-,
or five-year active-duty requirement, which we refer to as their first term, the most
common being a four-year first term. Historically, about 30 to 40 percent of first-
term attrition has been at recruit training. Recruit training is only three months long,
so those initial months are important ones. Table 14 in the appendix summarizes the
studies referenced in this report that examine first-term attrition.
9 High-quality recruits are those with Tier 1 education credentials and AFQT scores in
categories I through IIIA.
10 Since all women go to recruit training at Parris Island, the comparison of attrition rates
between MCRD Parris Island and MCRD San Diego does not apply to them.

9
There are many reasons for attrition after recruit-training graduation. First, Marines
might be honorably discharged because of injury or some other personal hardship.
They also might involuntarily leave for reasons including being discharged for failure
to maintain discipline or moral and professional standards, or breaking a rule, such
as drug use. Also, they might voluntarily choose to leave the service. We first look at
predictors of 24-month attrition, then 45- to 48-month attrition.
24-month attrition
Similar to DEP and recruit-training attrition, certain factors predict whether a Marine
will persist partway or all of the way through his or her first term. A study examining
Marines from FY 2005 to FY 2009 tracked 24-month attrition rates, which typically
include half of the active-duty term length and generally encompass all training
requirements, including recruit-training, but not the time spent in the DEP [1]. The
authors find that 15.3 percent of men and 24.5 percent of women attrite before 24
months of service [1].
The predictors of male and female 24-month attrition are similar to those factors
that predict first-term attrition rates, as we later discuss. One study found that white
men and women were more likely than Asian, black, Hispanic, or other-race men and
women to attrite in the first 24 months [1]. Academic quality mattered for 24-month
attrition as well. Men and women who had a Tier 1 education credential or were in
AFQT categories I through IIIA had lower 24-month attrition rates than those who
did not have these characteristics [1]. Those without enlistment waivers or who spent
3 to 12 months in the DEP were more likely to persist to 24 months [1]. The only
difference this study found in male versus female predictors of 24-month attrition
was the age of the Marine. Men who were over 21 were more likely to attrite in the
first 24 months than those who were younger; however, age was not a significant
factor in female 24-month attrition [1].
A more recent study that examined the FY 2005 to FY 2012 cohorts also analyzed
characteristics related to male and female 24-month attrition [7]. The authors found
that all of the factors that were related to female 24-month attrition also were related
to male 24-month attrition and in the same direction. As we saw in the FY 2005 to FY
2009 cohort study [1], when the FY 2010 to FY 2012 cohorts were added to the
analysis, male and female Asian, black, and Hispanic Marines were all still less likely
to attrite in the first 24 months of service than were white Marines and non-Hispanic
Marines [7]. Also, similar to the results of the previous study, high-quality men and
women in the FY 2005 to FY 2012 cohorts were less likely than their peers to attrite
before 24 months [7]. In addition, for the FY 2005 to FY 2012 cohorts, those in the
DEP for 3 or more months or who did not have enlistment waivers were less likely to
attrite before 24 months than those who were in the DEP for less time or who had
enlistment waivers [7]. Age was not a statistically significant determinant of attrition
before 24 months for men or women [7]. Those who shipped in ONDJ or FMAM were
more likely to attrite than those who shipped during the summer months [7].
10
In addition, the FY 2005 to FY 2012 cohort study included a few other variables that
were not included in the other attrition models. The authors found that both men
and women in the IST middle and bottom thirds were more likely to attrite than
those in the IST top third [7]. Men who received an enlistment bonus were
statistically significantly less likely to attrite from service than those who did not
receive one [7]. There was no statistically significant relationship, however, between
enlistment bonuses and female 24-month attrition [7].
First term (45- or 48-month) retention
Men are more likely than women to complete their first terms [4]. From FY 1985 to
FY 2005, male first-term attrition ranged from a low of around 25 percent between
FY 2003 and FY 2005 to a high of around 35 percent between FY 1986 and FY 1990.
Meanwhile, female first-term attrition ranged from a low of around 32 percent
between FY 2004 and FY 2005 to a high of around 55 percent in 1991 [4].
Some studies estimate the predictors of first-term attrition simultaneously for men
and women. One study that examined an FY 1984 recruit-training cohort of Marines
found that, in general, Marines who were black or Hispanic were more likely than
white Marines to complete their first terms [9]. Also, Tier 1 Marines and those with
AFQT scores in categories I through IIIA were more likely to complete their first
terms [9]. Those who met height and weight standards, had aviation MOSs, were
recruited from the western region, spent more time in the DEP, or were JJAS shippers
also were more likely to complete their first terms [9].
Some studies estimate the predictors of male and female first-term attrition
separately. As with DEP and recruit-training attrition rates, studies of the early 1980s
and early 2000s through 2012 found that Asian, black, and Hispanic women were
more likely than white women to complete their first terms [4, 7, 10]. As with women,
Asian, black, and Hispanic men also were less likely to attrite in their first terms than
were white men [4, 6-7].
Whether a Marine was recruited as a high school senior or a high school graduate
also is related to first-term completion. From FY 1999 to FY 2005, male and female
Marines who were recruited as high school seniors were more likely to complete their
first terms [4]. Another study found that, from FY 2005 to FY 2012, older Marines
were less likely to attrite from their first terms of service [7]. Whether a Marine is
high quality11 or simply has a high AFQT score also predicts whether he or she will
complete his or her first term. Between FY 1999 and FY 2000 and from FY 2005 to FY
2012, high-quality men and women were more likely to complete their first terms [4,
11 A high-quality Marine has a Tier 1 education credential and an AFQT score in categories I
through IIIA.

11
7]. Although high-quality men were less likely to attrite in their first terms, when
separate AFQT categories also were included for the FY 1999 to FY 2000 cohorts,
men in the lowest AFQT category (category IV) also were more likely to complete their
first terms [4].
Whether a Marine meets the retention height/weight standard is also an interesting
metric related to first-term attrition. Researchers find that this metric is usually an
effective predictor of male but not female first-term attrition. Between FY 1999 and
FY 2005, men who met the Marine Corps retention height/weight standards were less
likely to attrite during the first term, while this height/weight metric was not
significantly related to female first-term attrition [4]. In addition, IST scores can help
to predict whether Marines will complete their first terms of service. Male and female
Marines with IST scores in the middle and bottom thirds were more likely to attrite
from their first terms of service than those with IST scores in the top third [7].
Receiving an enlistment waiver to join the Marine Corps also helps to determine
whether someone will attrite during his or her first term of service. Men and women
who did not receive waivers were less likely to attrite than those who received
waivers [4, 7-8]. For women, the types of waivers that predicted the highest rates of
first-term attrition were pre-service drug use or physical waivers [8]. For men,
dependent, drug use, felony, or serious misdemeanor waivers predicted the highest
male first-term attrition rates [8]. Men who were not eligible to receive enlistment
bonuses also were more likely to attrite before the end of their contracts than men
who were eligible to receive them [7].
From FY 1999 to FY 2005, women and men who spent more time in the DEP were
less likely to attrite during their first terms [4, 7, 10]. In addition, for both men and
women, JJAS shippers were more likely to complete their first terms than those who
shipped to recruit training in other trimesters [4, 6].
Geographic origin also has been connected to the likelihood of first-term attrition for
men, but not women. Men who attended recruit training at MCRD San Diego were
more likely to complete their first terms [4, 7]. Where recruits attend recruit training
is related to the part of the country from which they are recruited; in general, men
attending recruit training in San Diego are from the western half of the United States,
whereas men attending recruit training at Parris Island are usually from east of the
Mississippi. All women attend MCRD Parris Island.12
The nature of the contract also can help to predict whether Marines attrite during
their first terms. From FY 1999 to FY 2005, men who were contract guarantees (i.e.,
enlisted under a certain PEF (Program Enlisted For)) were less likely to attrite during
12 As a result, there were no geographic predictors of first-term attrition for women.

12
their first terms than those who enlisted on open contracts (and could be placed in
any MOS); contract guarantee was not a significant predictor of female first-term
attrition [4].
Recommended and eligible for reenlistment
To reenlist, an enlisted Marine must be recommended and eligible for reenlistment.
Table 15 in the appendix summarizes the studies referenced in this report that refer
to reenlistment. The one study that looked at predictors of being recommended and
eligible to reenlist did not separately estimate predictors for men and women. It
found, however, that older Marines, in addition to those who were not married or had
no dependents, were more likely to be recommended and eligible for reenlistment
[11]. As we observed with most other performance milestones, those who performed
stronger academically (i.e., Tier 1 credentials and AFQT categories I through IIIA)
were more likely to be recommended and eligible for reenlistment (see Table 2) [11].
In addition, those who shipped in JJAS or FMAM or who spent three or more months
in the DEP were more likely to be recommended and eligible for reenlistment than
ONDJ shippers or those in the DEP for less than three months [11]. Finally, those
without enlistment waivers were more likely to be recommended and eligible for
reenlistment [11]. Gender was not significant in this model [11].
Reenlistment
Once a Marine’s initial enlisted contract expires, he or she can choose to either
request to reenlist and be approved (assuming the Marine is recommended and
eligible for reenlistment) or leave the military. One study of Marines from FY 2000 to
FY 2005 estimated a single equation for men and women and found that there were
several factors related to whether a Marine chose to reenlist for another term [11].
Those who had any dependents—whether a spouse, children, or both—or who had
dependent enlistment waivers were more likely to reenlist in the Marine Corps than
those who did not (see Table 2) [11]. It could be that those with dependents were
more likely to be the breadwinners for their families and reenlisted to support their
dependents through the wages and benefits offered by the military. Those with lower
AFQT scores or with ASVAB waivers also were more likely to reenlist after
completing their first terms [11]. Those with lower test scores presumably have fewer
outside options in the labor market and may be more willing to stay in the Marine
Corps instead of searching for civilian jobs. Those with felony waivers at the point of
enlistment were more likely to reenlist [11]. Those who committed a felony might be
reluctant to enter the civilian job market for fear that their options will be limited,
given their criminal records. We find it interesting that JJAS shippers and those who
spent less than three months in the DEP also were more likely to reenlist [11]. And,
controlling for other factors, women were more likely to reenlist than men [11].

13
Table 1. Predictors of enlisted retention and attrition measures, separately for men and womena
Predictor
DEP attrition [1-3] MCRD attrition [4-8] 24-month attrition [1, 7] First-term attrition [4, 6-10]
Men Women Men Women Men Women Men Women
Time in DEP + + — — — — — —
Attended some college — NS
Recruited as HS seniorb — — — —/NS — —
Tier 1 education — NS — — — —
AFQT = 50+ — — — NS — — — —
High quality — — — — — —
16- to 24-year-old
unemployment rate — —
Asian + NS — — — — —/NS —/NS
Black + NS —/NS — — — —/NS —
Other race NS — — — — — NS NS
Hispanic + — — — — — — —
Age + NS + NS +/NS NS — —
Single + NS — —
No dependents + NS —/+ N/A + N/A + N/A
MCRD Parris Island
ONDJ/fall and winter
shippers —/+ —/+/NS + + +/NS +/NS
JJAS/summer shippers — —/NS — — — —
FMAM/spring shippers + + + + +/NS +/NS
MCRD IST crunches — —
MCRD IST run times + +
MCRD IST middle third + + + + + +
MCRD IST bottom third + + + + + +

14
Predictor
DEP attrition [1-3] MCRD attrition [4-8] 24-month attrition [1, 7] First-term attrition [4, 6-10]
Men Women Men Women Men Women Men Women
Enlistment bonus — NS — NS — NS
Met retention height and
weight standards — +/NS — NS
“Drug use in DEP” waiver + + + +
“Dependent” waiver + NS +
“Adult felony” waiver + NS +
“Physical” waiver +
No waivers — — — — — —
Enlisted under a PEF — NS
a. When findings are inconsistent across studies, we show all findings (e.g., -/NS means that the effect was negative and significant in
one study, but not significant in another study). b. Those recruited as high school (HS) seniors have higher DEP attrition unless one controls for months in the DEP.
15
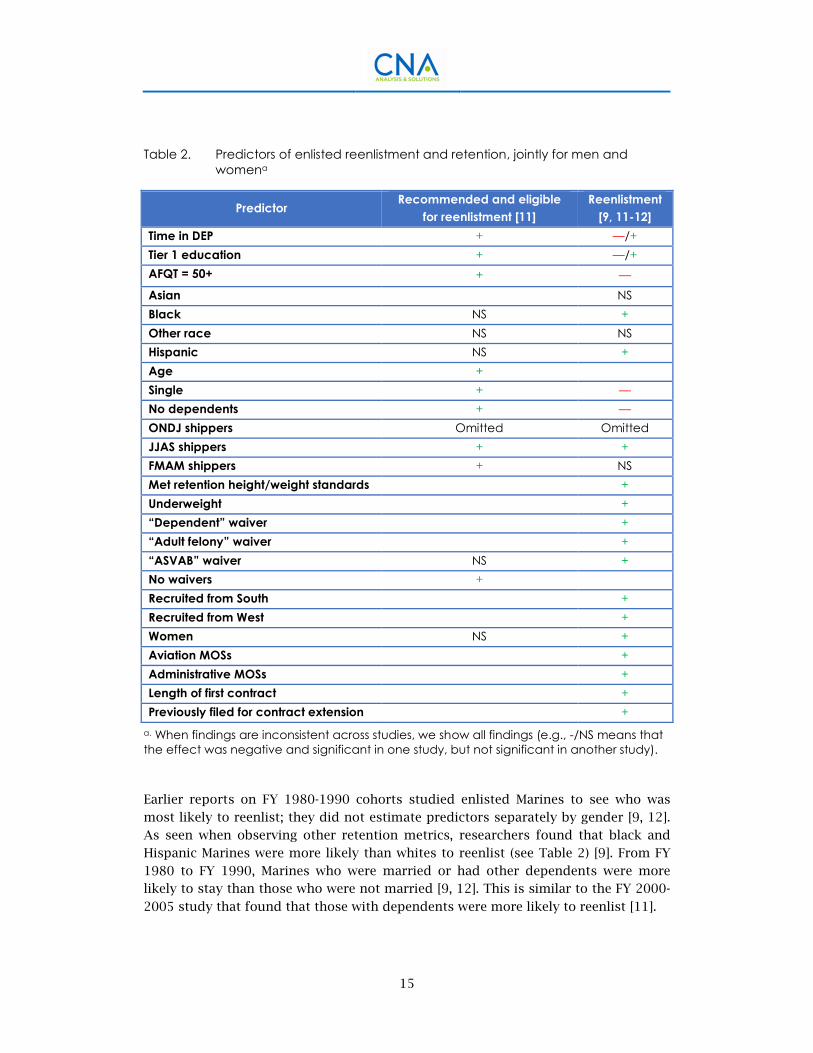
Table 2. Predictors of enlisted reenlistment and retention, jointly for men and
womena
Predictor Recommended and eligible
for reenlistment [11] Reenlistment
[9, 11-12]
Time in DEP + —/+
Tier 1 education + —/+
AFQT = 50+ + —
Asian NS
Black NS +
Other race NS NS
Hispanic NS +
Age +
Single + —
No dependents + —
ONDJ shippers Omitted Omitted
JJAS shippers + +
FMAM shippers + NS
Met retention height/weight standards +
Underweight +
“Dependent” waiver +
“Adult felony” waiver +
“ASVAB” waiver NS +
No waivers +
Recruited from South +
Recruited from West +
Women NS +
Aviation MOSs +
Administrative MOSs +
Length of first contract +
Previously filed for contract extension +
a. When findings are inconsistent across studies, we show all findings (e.g., -/NS means that
the effect was negative and significant in one study, but not significant in another study).
Earlier reports on FY 1980-1990 cohorts studied enlisted Marines to see who was
most likely to reenlist; they did not estimate predictors separately by gender [9, 12].
As seen when observing other retention metrics, researchers found that black and
Hispanic Marines were more likely than whites to reenlist (see Table 2) [9]. From FY
1980 to FY 1990, Marines who were married or had other dependents were more
likely to stay than those who were not married [9, 12]. This is similar to the FY 2000-
2005 study that found that those with dependents were more likely to reenlist [11].

16
The two reenlistment studies from FY 1980 to FY 1990 also differed in the estimated
relationship between some Marine characteristics and the reenlistment decision. In
the FY 1984 cohort study, those with high school diplomas were more likely than
those without diplomas to be retained beyond the first term [9]. The study from FY
1980 to FY 1990, however, found the opposite result: those with high school degrees
were less likely to reenlist [12]. In addition, as we saw with first-term retention, those
in aviation MOSs were more likely to be retained past their first terms in the FY 1984
cohort studies than those in other occupations [9]. In the FY 1980 to FY 1990 studies,
those with administrative MOSs were more likely to reenlist than those in any other
MOS [12].
The two reenlistment studies from FY 1980 to FY 1990 also included several
characteristics in their models different from those in the more recent FY 2000 to FY
2005 study. In the FY 1984 study, those who were underweight or who met retention
height and weight standards were more likely to be retained past their first terms
than those who were overweight [9]. Marines who were recruited in the South or in
the West were more likely to be retained beyond the first term than those who were
recruited from other regions [9]. Also, those who spent time in the DEP were more
likely to be retained past their first terms than those who did not [9]. In the FY 1980
to FY 1990 study, those who had longer first contract lengths were more likely to
reenlist along with those who had previously filed for a contract extension [12].
Predictors of Marine Corps officer retention
and attrition measures
There are several similarities between the predictors of enlisted and officer attrition,
including such demographic characteristics as age, marital status, and gender. Some
predictors, however, are not universally studied for both groups. For example, such
variables as time in DEP and the trimester a recruit ships to recruit training have not
been studied for the officer population since they do not have correlates. Instead,
officer retention studies investigate how factors, such as commissioning source and
performance at The Basic School (TBS), help to predict officer retention. Table 16 in
the appendix summarizes the officer retention studies referenced in this report.
Retention to YOS 7
First, one early study on officers who were commissioned from 1986 to 1992
estimated the likelihood that an officer is retained to seven years of active
component service (YOS) [13]. Typically, officer initial service commitments are three
to five years, and eight years, on average, for pilots. The average officer retention
rate to the seven-year point for these commissioning year cohorts was 73 percent
17
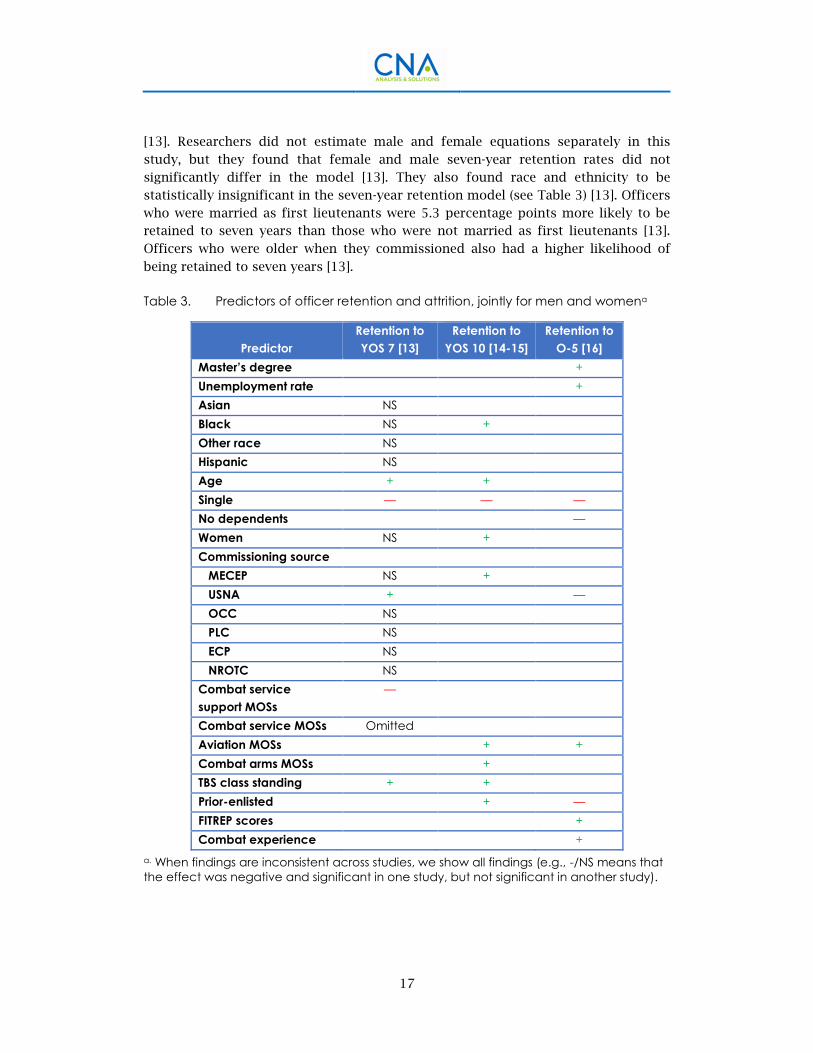
[13]. Researchers did not estimate male and female equations separately in this
study, but they found that female and male seven-year retention rates did not
significantly differ in the model [13]. They also found race and ethnicity to be
statistically insignificant in the seven-year retention model (see Table 3) [13]. Officers
who were married as first lieutenants were 5.3 percentage points more likely to be
retained to seven years than those who were not married as first lieutenants [13].
Officers who were older when they commissioned also had a higher likelihood of
being retained to seven years [13].
Table 3. Predictors of officer retention and attrition, jointly for men and womena
Predictor
Retention to
YOS 7 [13]
Retention to
YOS 10 [14-15]
Retention to
O-5 [16]
Master’s degree +
Unemployment rate +
Asian NS
Black NS +
Other race NS
Hispanic NS
Age + +
Single — — —
No dependents —
Women NS +
Commissioning source
MECEP NS +
USNA + —
OCC NS
PLC NS
ECP NS
NROTC NS
Combat service
support MOSs
—
Combat service MOSs Omitted
Aviation MOSs + +
Combat arms MOSs +
TBS class standing + +
Prior-enlisted + —
FITREP scores +
Combat experience +
a. When findings are inconsistent across studies, we show all findings (e.g., -/NS means that
the effect was negative and significant in one study, but not significant in another study).

18
Commissioning source and prior-enlisted variables were two of the important officer-
specific factors that helped to explain retention to the seven-year mark. Non-prior-
enlisted (NPE) United States Naval Academy (USNA) graduates were more likely to be
retained than NPE officers who were commissioned via the Platoon Leaders Class
(PLC), Officer Candidate Course (OCC), or the Naval Reserve Officer Training Corps
(NROTC) [13]. There were similar findings for prior-enlisted (PE) officers
commissioned through OCC, the Enlisted Commissioning Program (ECP), and NROTC:
officers commissioned through all of these programs were less likely to be retained
to seven years than PE officers commissioned through the USNA [13]. However, PE
USNA commissioned officers had a retention rate to seven years that was 15.7
percentage points lower than those who were commissioned through the Marine
Corps Enlisted Commissioning Educational Program (MECEP) [13].
Those in combat service support MOSs were less likely to be retained to seven years
than those with combat support MOSs [13]. TBS class rank also was related to seven-
year retention. The higher the class standing at TBS graduation, the more likely the
officer was retained to seven years [13].
Retention to YOS 10
Two studies examine officer retention to the 10-YOS milestone [14-15]. In both
studies, similar factors predict retention to YOS 10. The first study used
commissioning cohort data from FY 1980 to FY 1993 and found that 72 percent of
those commissioned during this time were retained to 10 YOS [14]. The other study
examines officers who were commissioned between FY 1980 and FY 1990. These
studies do not separately estimate equations for men and women. In both studies, as
with retention to 7 YOS, those who were married or older at commissioning were
more likely to be retained to 10 YOS (see Table 3) [14-15]. In addition, the second
study also found that female, black, or PE Marines were more likely to be retained to
10 YOS than those who were male, white, or NPE, respectively [15].
Both studies also found that an officer’s ranking at TBS, commissioning source, and
MOS were important predictors of 10 YOS retention [14-15]. The higher the final TBS
ranking of an officer, the more likely he or she was to be retained to 10 YOS [14-15].
Also, both studies reported that those commissioned through MECEP had the
greatest likelihood of being retained to 10 total YOS [14-15]. Those in combat arms
MOSs were the most likely to be retained to 10 YOS, except for pilots [14-15]. Because
pilots typically have a 5-year active-duty commitment after completing flight school,
many pilots’ active-duty Marine Corps commitments do not expire until much closer
to the 10-YOS milestone. This could explain why they would be more likely to be
retained until that point.

19
Retention to O-5
A study of FY 1980 to FY 1984 accession cohorts examined the predictors of officer
continuation in the Marine Corps until O-5 promotion boards [16]. This study did not
separately estimate equations for men and women. Similar to what is observed in the
studies of retention to 7 and 10 YOS, those who were married with dependents were
more likely to remain in the Marine Corps until the O-5 promotion boards than those
who were single without dependents (see Table 3) [16]. In addition, although an
aviator’s initial contract has expired by the time he or she is in zone for promotion to
O-5, this study found that aviators were more likely than nonaviators to be retained
to the O-5 promotion boards [16].
This FY 1980 to FY 1984 cohort study also found that PE Marines were less likely to
continue to O-5 promotion boards [16]. This could be because PE time plus
commissioned officer time often makes officers retirement eligible before they come
in zone for O-5 promotion. Those commissioned in the USNA had the lowest
likelihood of being retained to the O-5 promotion boards [16]. Also, this study added
variables to the model that were not examined in previous officer retention studies.
Those with high fitness report (FITREP) ratings, those with master’s degrees, or those
with combat experience were more likely to be retained to the O-5 promotion boards
[16]. Furthermore, this study accounted for the unemployment rate in its model. The
higher the unemployment rate, the more likely a Marine was to stay in the Marine
Corps until his or her O-5 promotion boards [16]. Similar to enlisted Marines, an
officer’s decision to stay in the Marine Corps is sensitive to economic conditions and
his or her outside prospects in the civilian labor market.

20
Identifying Predictors of Promotion
Promotion is another performance measure that is frequently studied to assess the
factors that contribute to Marines’ success. Numerous studies for both the Marine
Corps’ enlisted force and commissioned officers have identified factors that are
related to the likelihood of promotion to various grades. In this section, we
summarize previous work on Marine Corps promotion and attempt to identify
common predictors among studies.
Table 17 and Table 18 in the appendix summarize the enlisted and officer promotion
studies referenced in this report, respectively. We also highlight the ways in which
the predictors of promotion and retention differ.
Predictors of Marine Corps enlisted
promotion
Promotion to corporal (Cpl)
Promotion to corporal (E-4) is the first truly competitive promotion point in the
enlisted ranks because it is the first promotion that is not based solely on meeting
time-in-grade and time-in-service requirements. The number of E-4s is controlled by
automated composite score screening, and an E-4 promotion is only granted to fill
vacancies in E4 requirements throughout the service [17]. The FY 1984 cohort was
analyzed to identify the characteristics of those who were likely to promote to
corporal. The study did not separately estimate equations for men and women. White
and Hispanic Marines were more likely to promote to E-4 than Marines who were
non-white and non-Hispanic (see Table 4) [9]. This is somewhat different from the
factors that predict retention, where Marines were more likely to be retained if they
were non-white [1, 4, 6-7, 10].
Other factors that predicted promotion to corporal were similar to the factors that
predicted retention. Because E-4 is the first competitive promotion point for the
enlisted ranks, it is no surprise that academic ability is related to promotion to
corporal. High school diploma graduates and those with AFQT scores in categories I
through IIIA were more likely to promote to corporal [9]. Those who were married

21
when joining the Marine Corps also were more likely to be promoted to corporal than
those who were unmarried when they initially joined [9]. Those who were
underweight or met retention height/weight standards were more likely to be
promoted to corporal than those who were overweight [9]. Similar to what was found
for retention measures, those who were recruited from the West or who spent time in
the DEP were more likely to promote to corporal [9]. Also, those in aviation MOSs
were more likely to promote to corporal than those who were not.
Meritorious promotion
Per Marine Corps Order, Marines can sometimes be promoted meritoriously before
they are in-zone for promotion based on exceptionally strong performance within
their paygrades, subject to YOS limitations. One study of FY 2000 to FY 2005 Marines
analyzed the factors that predict meritorious promotion in the first 48-months,
simultaneously for men and women. Hispanic and other-race Marines were more
likely to receive meritorious promotions than non-Hispanic or white Marines,
respectively (see Table 4) [11].
Table 4. Predictors of enlisted promotion, jointly for men and womena
Predictor
Promotion to
corporal [9]
Meritorious
promotion [11]
Time in DEP + NS
Tier 1 education + +
AFQT = 50+ + +
Asian —
Black —
Other race — +
Hispanic + +
Single —
No dependents +
ONDJ shippers NS
JJAS shippers +
FMAM shippers NS
Met height and weight standards +
Underweight +
“Drug use in DEP” waiver +
“Dependent” waiver +
Recruited from West +
Women +
Aviation MOSs +
22
a. When findings are inconsistent across studies, we show all findings (e.g., -/NS means that
the effect was negative and significant in one study, but not significant in another study).
In addition, as seen in other studies, those with AFQT scores in categories I through
IIIA or those who had Tier 1 education credentials were more likely to be promoted
meritoriously. While time spent in the DEP was not significantly related to
meritorious promotion, JJAS shippers were more likely to be promoted meritoriously
[11]. Note that Marines without dependents were more likely to be promoted
meritoriously; however, those with dependent enlistment waivers also were more
likely to be promoted meritoriously than those without these waivers [11].
Furthermore, and perhaps counterintuitively, those with drug waivers were more
likely to be promoted meritoriously than those without these waivers [11]. Finally,
women were more likely than men to promote meritoriously [11].
Predictors of Marine Corps officer promotion
As was the case for the enlisted versus officer retention models, certain factors
similarly predict enlisted and officer promotion, such as marital status and race,
whereas other factors uniquely predict officer promotion.
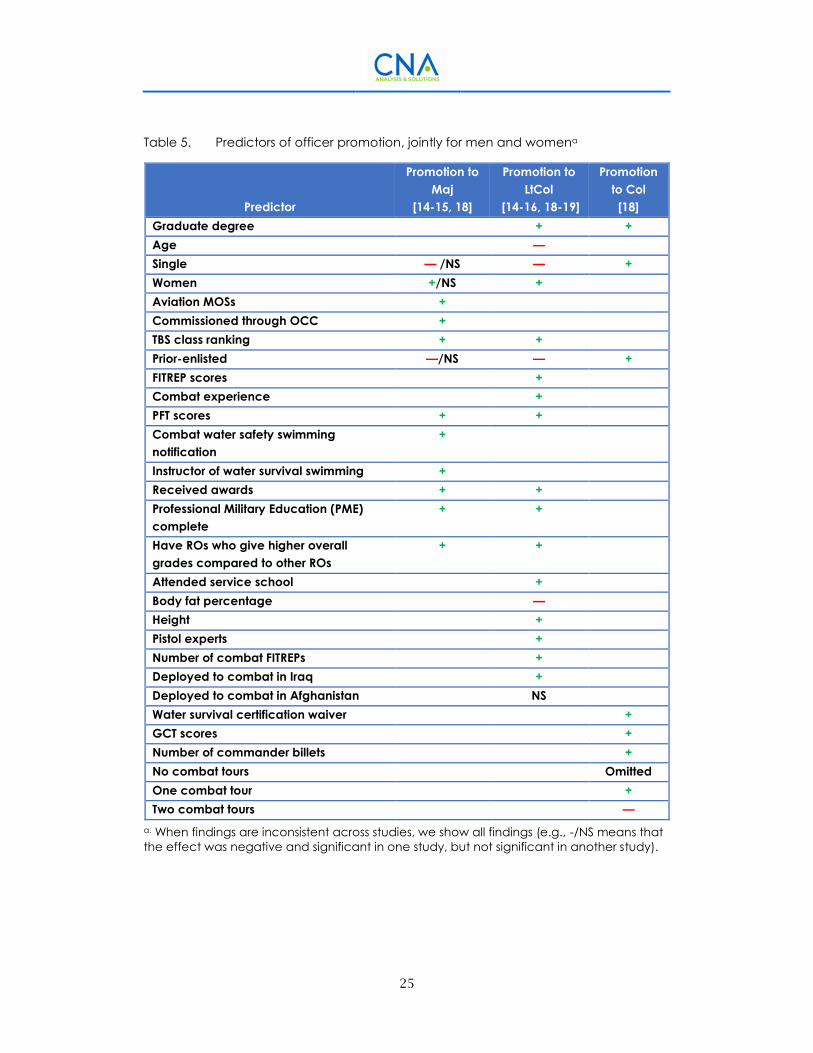
Promotion to major (Maj)
Three NPS theses, which spanned a similar window of Marines commissioned in the
1980s and 1990s, estimated various multivariate models to explore factors that are
related to promotion to major (O-4). To provide perspective on the competitiveness
of promotion to O-4, around 82 percent of Marines who were commissioned between
1980 and 1993 and continued to the O-4 promotion boards were eventually
promoted to O-4 [14]. Factors from these studies, such as marital status and race,
similarly predict enlisted and officer promotion.
In one study of officers commissioned between 1980 and 1990, women were more
likely than men to be promoted to O-4 (see Table 5) [15]. In two of the studies of the
FY 1980 to FY 1990 cohorts, black officers were less likely to promote to major than
white officers [14-15]. In addition, and as seen in the enlisted promotion studies,
married Marines were more likely to promote to O-4 than unmarried Marines [15, 18].
PE Marines were less likely to promote to O-4 [15].
Other factors from these promotion studies in the FY 1980 to FY 1990 period
uniquely predict officer promotion. As TBS class ranking increased, so did the
likelihood of promotion to O-4 [14-15]. Commissioning source was an important
predictor of O-4 promotion over this time period. Those commissioned through OCC
outperformed those from other commissioning sources in terms of promotion to O-4
[14-15].
23
Pilots were less likely to promote to O-4 than nonaviators in the FY 1980 to FY 1990
period, although, as earlier discussed, they were more likely to be retained at various
promotion points [14-15].
One NPS thesis that examined 2008 promotion board rates included unique variables
in the model of promotion to O-4 [18]. The researchers found that those with higher
Physical Fitness Test (PFT) scores were more likely to promote to O-4 [18]. Those who
have combat water safety swimmer notifications or who were instructors of water
survival swimming were more likely to promote to major [18]. Those who received
personal awards or attended all appropriate levels of schooling for promotion also
were more likely to promote to major [18]. This same study also finds that Marine
officers who have Reviewing Officers (ROs) who give higher overall grades compared
with other ROs are more likely to promote to O-4.
Promotion to lieutenant colonel (LtCol)
Promotion to lieutenant colonel is perhaps the most analyzed promotion point in the
Marine Corps literature. This promotion point is considerably more competitive than
promotion to O-4. Of those who survived to O-5 promotion boards in the FY 1980 to
FY 1989 cohorts, only 65 percent were promoted to O-5 [14].
Five NPS theses analyzed promotion to LtCol for officers who commissioned from
1980 on and those who promoted in the FY 2012 promotion cohort. Unfortunately,
none of these studies separately estimated the predictors of male and female
promotions to LtCol. Several studies found that women were more likely than men to
promote to LtCol, all else equal (see Table 5) [14, 16, 19]. More specifically, a study
on FY 1980 to FY 1989 commissioning cohorts found that women were 1.5 times
more likely than men to promote to O-5 [14].
Married officers were more likely to promote to O-5 than unmarried officers [15, 19].
Also, one study found that those who were younger at commissioning were more
likely to promote to O-5 than those who were older at commissioning [14]. PE
Marines were less likely to be promoted to O-5 than NPE Marines [15].
Education is also a significant predictor in many studies of promotion to LtCol.
Those who completed professional military education [16, 19], have completed a
graduate degree [16, 19], or attended the appropriate service school [18] were more
likely to be promoted to LtCol.
The physical fitness level of a Marine also has proved to be an important predictor of
promotion to O-5. Those with higher PFT scores [18-19] were more likely to promote
to O-5. Those with low body fat or who were taller also were more likely to promote
to LtCol [19]. Marines, however, must stand out in more ways than just physical
fitness to be selected for promotion to O-5. For example, Marines who had higher
24
FITREP scores [16, 18-19], received awards [16], or qualified as pistol experts [19]
also were more likely to be promoted to O-5.
Combat tours also contribute to the likelihood that a Marine will be promoted to
LtCol. Having a combat tour [18] or several combat FITREPs [19] was positively
related to promotion to O-5. Deploying to the Iraq combat theatre was specifically
positively related to promotion to O-5; however, combat deployments to Afghanistan
were not [19].
As seen in studies of promotion to lower paygrades, TBS class ranking,
commissioning source, and MOS also are important predictors of promotion. A
higher TBS class ranking was associated with a higher likelihood that one promoted
to O-5 [14-15]. For promotion to O-5, there was no clear commissioning source that
dominated the likelihood of promotion to O-5. Commissioning source results differ,
depending on the study [14-15, 18]. Aviation MOS results also differ, depending on
the study. A few studies found that aviators were more likely to promote to O-5 [15-
16], while others found that aviators were less likely to promote to O-5 [19]. The
differing results might be attributed to the different time periods over which these
studies were conducted.
Promotion to colonel (Col)
One NPS officer promotion study attempted to identify explanatory factors for
promotion rates to colonel for the 2008 promotion board [18]. Contrary to what was
observed for promotion to O-4 and O-5, those who were married were less likely to
promote to colonel than those who were unmarried (see Table 5). Another interesting
result is that those who had a water survival certification waiver were more likely to
promote to colonel than those who did not [18]. It is not surprising that those with
higher General Classification Test (GCT) scores, a graduate degree, or a higher
number of commander billets were more likely to promote to colonel. Those who
served one combat tour were more likely to promote to colonel than Marines who
had never served in combat, while those who served two combat tours were less
likely to promote to colonel than those who had never served in combat [18]. Finally,
Marines who commissioned through a PE commissioning program were more likely
to promote to colonel than those who commissioned through other sources [18].
25
Table 5. Predictors of officer promotion, jointly for men and womena
Predictor
Promotion to
Maj
[14-15, 18]
Promotion to
LtCol
[14-16, 18-19]
Promotion
to Col
[18]
Graduate degree + +
Age —
Single — /NS — +
Women +/NS +
Aviation MOSs +
Commissioned through OCC +
TBS class ranking + +
Prior-enlisted —/NS — +
FITREP scores +
Combat experience +
PFT scores + +
Combat water safety swimming
notification
+
Instructor of water survival swimming +
Received awards + +
Professional Military Education (PME)
complete
+ +
Have ROs who give higher overall
grades compared to other ROs
+ +
Attended service school +
Body fat percentage —
Height +
Pistol experts +
Number of combat FITREPs +
Deployed to combat in Iraq +
Deployed to combat in Afghanistan NS
Water survival certification waiver +
GCT scores +
Number of commander billets +
No combat tours Omitted
One combat tour +
Two combat tours —
a. When findings are inconsistent across studies, we show all findings (e.g., -/NS means that
the effect was negative and significant in one study, but not significant in another study).
26
Identifying Predictors of Conduct
Predictors of enlisted Marine conduct
Good conduct is another Marine performance measure of interest. In these studies,
conduct measures are analyzed for enlisted Marines only.
Table 17 in the appendix summarizes the studies cited in this report that examine
predictors of good conduct and misconduct.
Good conduct award
A study of FY 2000 to FY 2005 Marine cohorts examined the predictors of good
conduct. Several factors related to whether a Marine received the good conduct
award. Typically, recipients of this award had no prior waivers (see Table 6) [11].
Also, those with higher AFQT scores or a Tier 1 education credential were more likely
to receive good conduct awards [11]. Furthermore, Marines who were unmarried were
more likely to receive good conduct awards than Marines who were married [11].
Finally, recruits who were FMAM or ONDJ shippers or who have spent more than
three months in the DEP were more likely to receive good conduct awards [11].
Next, we explore a few performance measures that indicate bad conduct. We expect
that the predictors of bad conduct measures will differ or even be the opposite of
those that predict good conduct.
Misconduct separation
The FY 2000 to FY 2005 cohort study also examined predictors of bad conduct. The
predictors of misconduct separations are quite different from the predictors of good
conduct awards. As we might expect, Marines with dependent, drug, drug and
alcohol test (DAT), serious misdemeanor, or felony waivers on shipping to recruit
training were more likely to be discharged because of misconduct than those who did
not have these types of waivers (see Table 6) [11]. Non-Hispanics, those without
dependents (including those who were unmarried), or those who were younger were
more likely to have misconduct separations [11]. This is somewhat surprising
because unmarried Marines also were more likely to receive good conduct awards

27
[11]. We see that the opposite is true when it comes to academic ability; those with
lower AFQT scores or who had Tier 2 or Tier 3 education credentials, or those with
less than three months in the DEP were more likely to separate because of
misconduct [11].
Table 6. Predictors of enlisted conduct, jointly for men and womena
Predictor
Good conduct
award
[11]
Misconduct
separation
[11]
Demotion by
48 months
[11]
Desertion by
48 months
[11]
Time in DEP + — — —
Tier 1 education + — — —
AFQT = 50+ + — — —
Hispanic — +
Age —
Single + +
No dependents +
ONDJ shippers +
JJAS shippers Omitted
FMAM shippers +
Waivers
Drug use in DEP + + +
Dependent + +
Positive DAT + +
Serious misdemeanor + + +
Felony + +
No waivers +
a. When findings are inconsistent across studies, we show all findings (e.g., -/NS means that
the effect was negative and significant in one study, but not significant in another study).
Demotion by 48 months
The same study [11] found that Marines who were most likely to be demoted by 48
months shared characteristics with those who separated for misconduct. Those with
drug, DAT, serious misdemeanor, or felony waivers were more likely to be demoted
by 48 months (see Table 6). Marines who were younger, had lower AFQT scores, had
Tier 2 or 3 education credentials, or spent less than three months in the DEP were
more likely than their peers to be demoted.

28
Desertion by 48 months
Several characteristics are related to desertion. The FY 2000 to FY 2005 study found
that Marines with dependent, drug, or serious misdemeanor waivers were more likely
to desert than those who had no waivers or who had physical waivers (see Table 6)
[11]. Hispanics also were more likely to desert before 48 months of service [11]. As
with demotion, those with low AFQT scores and a Tier 2 or 3 education [11], those
who were unmarried, or those who spent less than three months in the DEP were
more likely than their peers to desert by 48 months of service [11].
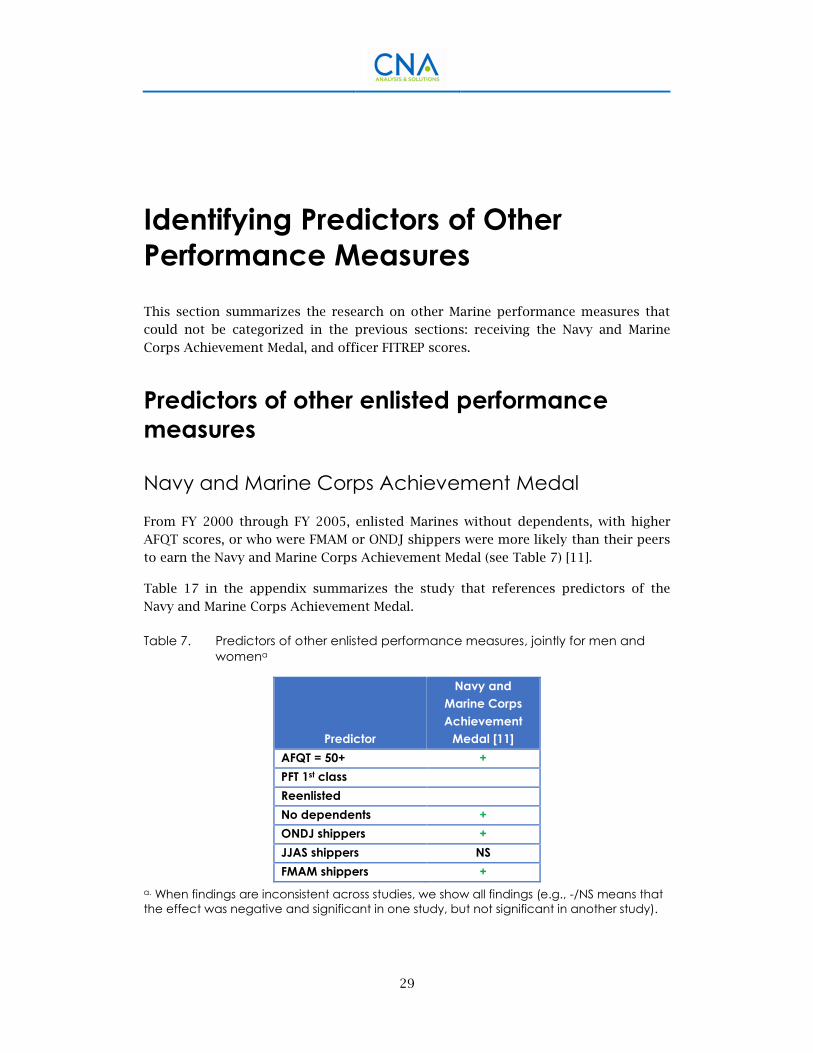
29
Identifying Predictors of Other
Performance Measures
This section summarizes the research on other Marine performance measures that
could not be categorized in the previous sections: receiving the Navy and Marine
Corps Achievement Medal, and officer FITREP scores.
Predictors of other enlisted performance
measures
Navy and Marine Corps Achievement Medal
From FY 2000 through FY 2005, enlisted Marines without dependents, with higher
AFQT scores, or who were FMAM or ONDJ shippers were more likely than their peers
to earn the Navy and Marine Corps Achievement Medal (see Table 7) [11].
Table 17 in the appendix summarizes the study that references predictors of the
Navy and Marine Corps Achievement Medal.
Table 7. Predictors of other enlisted performance measures, jointly for men and
womena
Predictor
Navy and
Marine Corps
Achievement
Medal [11]
AFQT = 50+ +
PFT 1st class
Reenlisted
No dependents +
ONDJ shippers +
JJAS shippers NS
FMAM shippers +
a. When findings are inconsistent across studies, we show all findings (e.g., -/NS means that
the effect was negative and significant in one study, but not significant in another study).
30
Predictors of other officer performance
measures
Fitness Reports (FITREPs)
The last studies that we discuss are those that identify the predictors of officer
FITREP scores at each paygrade, from O-1 through O-4 [15]. Table 19 in the appendix
summarizes the studies referenced in this report that examine predictors of officer
FITREP scores. The number of cohorts that researchers can observe decreases as
paygrades increase. For instance, the O-1 model uses cohorts from FY 1980 to FY
1997, the O-2 model uses FY 1980–1995 cohorts, the O-3 model uses FY 1980–1990
cohorts, and the O-4 model uses FY 1980–1983 cohorts [15].
Results for the O-1 model indicated that those who were married at O-1 had higher
FITREP scores than those who were unmarried at O-1 (see Table 8) [15]. Marines who
were older at commissioning or who were black had lower FITREP scores than their
younger or white peers, respectively [15]. As observed in some of the retention and
promotion literature, combat service, TBS class ranking, MOS, being PE, and
commissioning source also influenced how well someone performed on his or her
FITREP. Combat FITREPs generally were scored higher than noncombat FITREPs [15].
Also, those who graduated with higher TBS class standings had better FITREP scores
[15]. Those in ground support MOSs had lower FITREP scores than infantry officers,
while those in service or aviation support MOSs generally received higher FITREP
scores than their peers in infantry MOSs [15]. PE officers also outperformed NPE
officers on their FITREPs [15]. Those commissioned through the USNA outperformed
those from all other commissioning sources on FITREPs [15]. Finally, female O-1s
tend to receive higher FITREP scores than male O-1s, holding all else constant [15].
The sign of the results for the O-2 FITREP model were the same as for the O-1 model,
in terms of marital status, commissioning age, gender, the role of combat FITREPs,
TBS class rank, and commissioning source. However, white O-2s outperformed other-
race O-2s on their FITREPs [15]. In addition to MOSs that were found to be
statistically significant for the O-1 FITREPs, O-2 Marines in infantry MOSs
outperformed their peers in service MOSs or pilot MOSs [15].
Results for the O-3 model indicated that O-3s who were married, had higher TBS
rankings, or were commissioned through the USNA had better FITREP scores than
their peers, on average [15]. However, black O-3 Marines had lower FITREP scores
than their white peers [15].

31
Table 8. Predictors of officer FITREP scores, jointly for men and womena
Predictor
All officers
[20]
O-1
[15]
O-2
[15]
O-3
[15]
O-4
[15]
White Omitted Omitted + Omitted Omitted
Black — — NS — NS
Other race NS Omitted NS NS
Hispanic —
Age — —
Single — — —
Women + + NS NS
Commissioning
source
ECP Omitted
MCP —
OCC —
PLC —
MECEP —
NROTC NS
USNA — + + +
TBS class ranking + + + +
GCT score —
Most
competitive
institution
+
College GPA +
Business majors +
Prior-enlisted +
Combat FITREP + +
Ground support
MOS —
Infantry MOS Omitted +
Service MOS + —
Aviation MOS + —
a. When findings are inconsistent across studies, we show all findings (e.g., -/NS means that
the effect was negative and significant in one study, but not significant in another study).
For the O-4 FITREP model, black and white officers scored the same on FITREPs,
holding all else constant [15]. Also, those who served in a joint O-4 tour had higher
FITREP scores than those who did not [15].
Another recent study focused on how various quality measures affected FITREP
scores from 1999 to 2011 [20]. The researchers found that TBS class ranking affected

32
average FITREP scores. Those in the middle and bottom TBS thirds had lower FITREP
scores, on average, across all of the paygrades observed [20]. Moreover, as GCT
scores increased, FITREP scores decreased [20]. Another predictor of FITREP scores
was commissioning source. Those commissioned through OCC, PLC, MECEP, and
USNA had lower FITREP scores on average than those commissioned through ECP
[20].
In addition, several officer education variables were included in the model of FITREP
predictors. Those attending the most competitive institutions had higher FITREP
scores, all else equal, than those from institutions that are not as competitive [20].
The authors also found that, as GPA increased, FITREP scores also increased, on
average [20]. Business majors were found to have higher FITREP scores than those
majoring in other subjects [20]. Furthermore, black and Hispanic Marines had lower
FITREP scores than white Marines [20].
33
Conclusion
As part of the Marine Corps’ consideration of female integration in combat arms
MOSs and units, CNA has been tasked with supporting MCRC’s research needs. This
research memorandum is the deliverable for task 4a, a literature review of predictors
of female versus male Marine performance. This information was necessary to
support the research needs in task 3b (the relationship between recruit
characteristics and female recruit training success) and task 4c (direct support for
trend analysis). By understanding the strong predictors of past performance, we can
better estimate the future performance of Marines.
We identify the predictors of performance in the Marine Corps across several
dimensions. Some studies measure performance at various retention milestones,
while others evaluate performance at different promotion points. Still other studies
predict performance measures, such as good conduct and personal achievement
medals.
Overall, we observe that some factors consistently explain Marine Corps enlisted
attrition and retention for both men and women. In general, spending more time in
the DEP, having a higher AFQT score, having a Tier 1 education, or being recruited as
a high school senior were predictive of lower recruit-training and first-term attrition
and an increased likelihood of being recommended and eligible to reenlist for both
male and female Marines (see Table 9). In terms of race and ethnicity, white non-
Hispanic men and women have higher recruit-training and first-term attrition rates.
Having no enlistment waivers was predictive of lower 24-month and first-term
attrition for both men and women.
Other predictors of enlisted attrition and retention, such as age, vary by gender.
Being older was a predictor of higher attrition in the DEP, in recruit training, and at
24 months for men, but an insignificant predictor for women.
In officer retention, promotion, and FITREP studies, researchers did not separately
estimate equations by gender. Although we cannot glean anything about gender
differences from these studies, we do observe that some factors—such as being
married, having a higher TBS ranking, being commissioned through the USNA, or
being a woman—were consistent predictors of officer retention, promotion, and
FITREP scores at different paygrades and years of service (see Table 10).

34
Some factors were inconsistent predictors of officer success at different paygrades,
such as being PE (higher retention, promotion, and FITREP scores at some paygrades,
lower at others), age (older officers were more likely to retain but less likely to
promote and had lower FITREP scores), being a black officer, and aviation MOSs (both
of which were more likely to retain but received lower FITREP scores).
Other factors were positive predictors of officer retention and promotion but
insignificant predictors of officer FITREP scores, such as combat experience and
having a graduate degree. Still others were positive predictors of only promotion,
such as PFT scores, awards received, PME completed, and having a Reviewing Officer
who gives higher overall scores compared with other ROs. Having more combat
FITREPs was predictive of higher promotion and FITREP scores.
Lastly, we looked at consistent predictors of enlisted promotion, conduct, and other
performance measures. Poor conduct includes such factors as desertion, which
affects very few people. Many factors that predicted high rates of enlisted retention
also predicted high rates of enlisted promotion and low rates of poor conduct
(misconduct separation, desertion, or demotion) (see Table 11). These factors
included more time in DEP, a Tier 1 education credential, and higher AFQT scores.
Other factors were less consistent predictors of enlisted promotion, conduct, and
other performance measures. These factors include ethnicity (Hispanics were more
likely to promote and less likely to receive a misconduct separation, but more likely
to desert), marital status (single Marines were more likely to receive a good conduct
award, but less likely to promote and more likely to desert), and having no
dependents (more likely to be meritoriously promoted or receive the Navy and
Marine Corps Achievement Medal, but more likely to separate for misconduct).
Among waiver types, some were solely predictors of poor conduct (misconduct
separation, desertion, or demotion), such as “positive DAT” waiver, “serious
misdemeanor” waiver, and “adult felony” waiver, while others were predictive of
higher promotion rates and poor conduct, such as “drug use in DEP” waiver and
“dependent” waiver.
This literature review of the predictors of female and male performance will be
informative for our research needs in task 4c. In particular, we can use the identified
predictors of Marine performance in our (1) regression modeling of above- or below-
average performance, (2) trend analysis of identifying the characteristics of the
female versus male Marine markets, and (3) analysis of whether the demographics
and quality of female enlistees will change over time with the lifting of the combat
exclusion policy.

35
Table 9. Summary table of predictors of enlisted attrition and retentiona
Predictor
DEP attrition
[1-3]
MCRD attrition
[4-8]
24-month
attrition [1, 7]
First-term attrition
[4, 6-10]
Rec./elig. for
reenlist-
ment [11]
Reenlist-
ment
[9, 11-12] Men Women Men Women Men Women Men Women
Women NS +
Time in DEP + + — — — — — — + —/+
College background — NS
Recruited as HS
seniorb — — — —/NS — —
Tier 1 education — NS — — — — + —/+
AFQT = 50+ — — — — — — — — + —
High quality — — — — — —
16- to 24-year-old
unemployment rate — —
Asian + NS —/NS —/NS — — —/NS —/NS NS
Black + NS —/NS — — — —/NS — NS +
Other race NS — — — — — NS NS NS NS
Hispanic + — — — — — — — NS +
Age + NS + NS +/NS NS — — +
Single + NS — — + —
No dependents + NS + —
MCRD Parris Island — N/A + N/A + N/A
ONDJ shippers —/+ —/+/NS + + +/NS +/NS Omitted Omitted
JJAS shippers — —/NS — — — — + +
FMAM shippers + + + + +/NS +/NS + NS
MCRD IST crunches — —
MCRD IST run times + +

36
Predictor
DEP attrition
[1-3]
MCRD attrition
[4-8]
24-month
attrition [1, 7]
First-term attrition
[4, 6-10]
Rec./elig. for
reenlist-
ment [11]
Reenlist-
ment
[9, 11-12] Men Women Men Women Men Women Men Women
MCRD IST middle third + + + + + +
MCRD IST bottom third + + + + + +
Enlistment bonus — NS — NS — NS
Met height and weight
standards — +/NS — NS
+
Underweight +
Waivers
Drug use in DEP + + + +
Dependent + NS + +
Adult felony + NS + +
Physical +
ASVAB waiver +
No waivers — — — — — — +
Enlisted under a PEF — NS
Recruited from South +
Recruited from West +
Women +
Aviation MOSs +
Administrative MOSs +
Length of first contract +
Previously filed for a
contract extension
+
a. When findings are inconsistent across studies, we show all findings (e.g., -/NS means that the effect was negative and significant in
one study, but not significant in another study). b. Those recruited as high school (HS) seniors have higher DEP attrition unless one controls for months in the DEP.
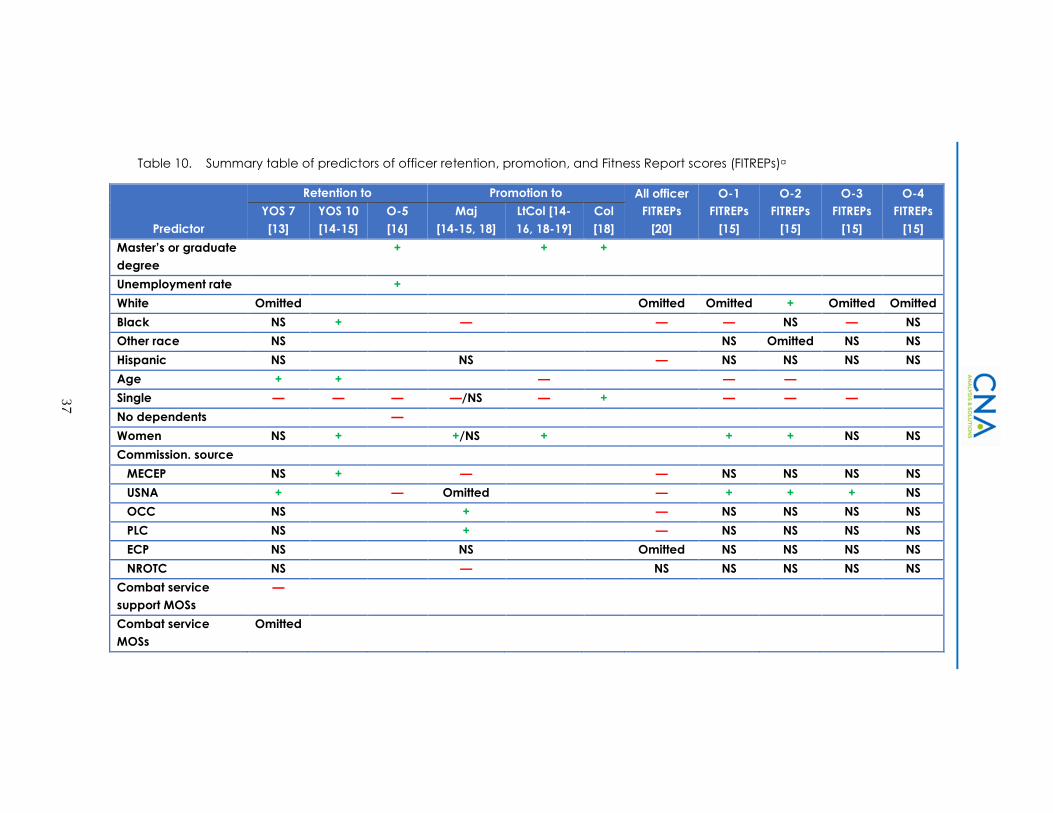
37
Table 10. Summary table of predictors of officer retention, promotion, and Fitness Report scores (FITREPs)a
Predictor
Retention to Promotion to All officer
FITREPs
[20]
O-1
FITREPs
[15]
O-2
FITREPs
[15]
O-3
FITREPs
[15]
O-4
FITREPs
[15]
YOS 7
[13]
YOS 10
[14-15]
O-5
[16]
Maj
[14-15, 18]
LtCol [14-
16, 18-19]
Col
[18]
Master’s or graduate
degree
+ + +
Unemployment rate +
White Omitted Omitted Omitted + Omitted Omitted
Black NS + — — — NS — NS
Other race NS NS Omitted NS NS
Hispanic NS NS — NS NS NS NS
Age + + — — —
Single — — — —/NS — + — — —
No dependents —
Women NS + +/NS + + + NS NS
Commission. source
MECEP NS + — — NS NS NS NS
USNA + — Omitted — + + + NS
OCC NS + — NS NS NS NS
PLC NS + — NS NS NS NS
ECP NS NS Omitted NS NS NS NS
NROTC NS — NS NS NS NS NS
Combat service
support MOSs
—
Combat service
MOSs
Omitted

38
Predictor
Retention to Promotion to All officer
FITREPs
[20]
O-1
FITREPs
[15]
O-2
FITREPs
[15]
O-3
FITREPs
[15]
O-4
FITREPs
[15]
YOS 7
[13]
YOS 10
[14-15]
O-5
[16]
Maj
[14-15, 18]
LtCol [14-
16, 18-19]
Col
[18]
Aviation MOSs + + — + —
Combat arms MOSs +
Ground support MOS —
Infantry MOS Omitted +
Service MOS + —
TBS class ranking + + + + + + + +
GCT score —
Most competitive
institution
+
College GPA +
Business majors +
Prior-enlisted + — — — + +
FITREP scores + +
Combat experience + +
PFT scores + +
Received awards + +
PME complete + +
Have ROs who give
higher overall grades
than other ROs
+ +
Number of combat
FITREPs
+ +
a. When findings are inconsistent across studies, we show all findings (e.g., -/NS means that the effect was negative and significant in
one study, but not significant in another study).
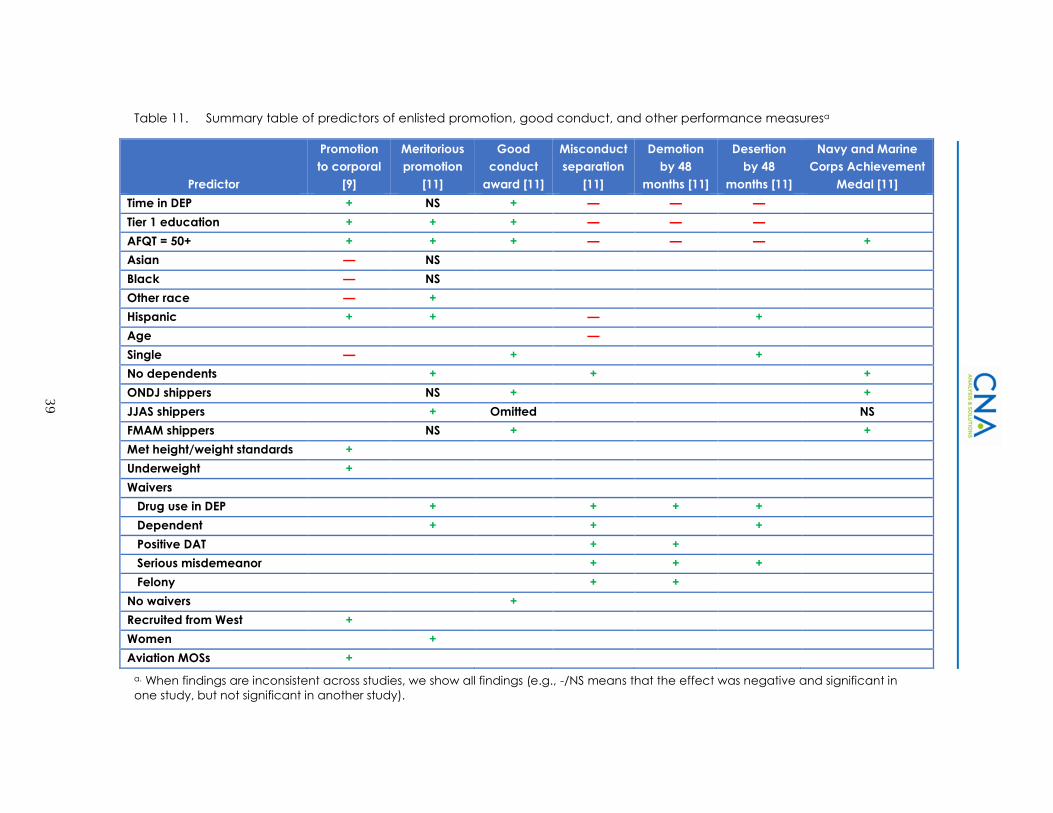
39
Table 11. Summary table of predictors of enlisted promotion, good conduct, and other performance measuresa
Predictor
Promotion
to corporal
[9]
Meritorious
promotion
[11]
Good
conduct
award [11]
Misconduct
separation
[11]
Demotion
by 48
months [11]
Desertion
by 48
months [11]
Navy and Marine
Corps Achievement
Medal [11]
Time in DEP + NS + — — —
Tier 1 education + + + — — —
AFQT = 50+ + + + — — — +
Asian — NS
Black — NS
Other race — +
Hispanic + + — +
Age —
Single — + +
No dependents + + +
ONDJ shippers NS + +
JJAS shippers + Omitted NS
FMAM shippers NS + +
Met height/weight standards +
Underweight +
Waivers
Drug use in DEP + + + +
Dependent + + +
Positive DAT + +
Serious misdemeanor + + +
Felony + +
No waivers +
Recruited from West +
Women +
Aviation MOSs +
a. When findings are inconsistent across studies, we show all findings (e.g., -/NS means that the effect was negative and significant in
one study, but not significant in another study).
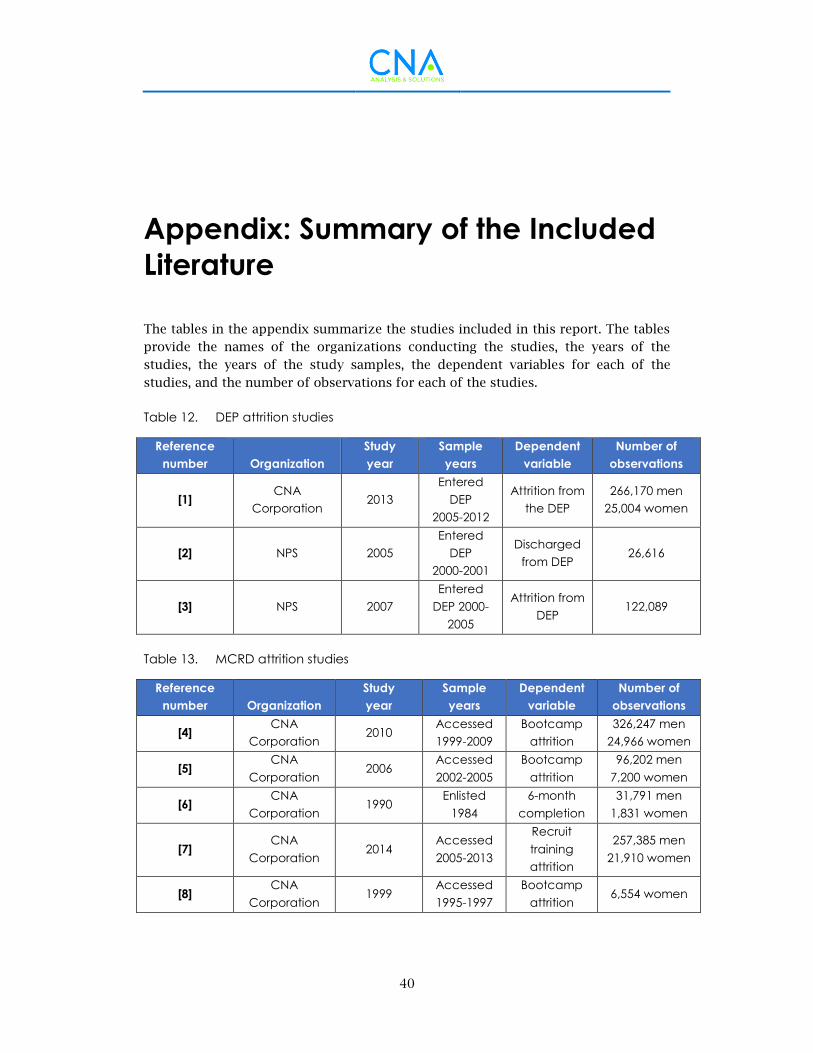
40
Appendix: Summary of the Included
Literature
The tables in the appendix summarize the studies included in this report. The tables
provide the names of the organizations conducting the studies, the years of the
studies, the years of the study samples, the dependent variables for each of the
studies, and the number of observations for each of the studies.
Table 12. DEP attrition studies
Reference
number Organization
Study
year
Sample
years
Dependent
variable
Number of
observations
[1] CNA
Corporation 2013
Entered
DEP
2005-2012
Attrition from
the DEP
266,170 men
25,004 women
[2] NPS 2005
Entered
DEP
2000-2001
Discharged
from DEP 26,616
[3] NPS 2007
Entered
DEP 2000-
2005
Attrition from
DEP 122,089
Table 13. MCRD attrition studies
Reference
number Organization
Study
year
Sample
years
Dependent
variable
Number of
observations
[4] CNA
Corporation 2010
Accessed
1999-2009
Bootcamp
attrition
326,247 men
24,966 women
[5] CNA
Corporation 2006
Accessed
2002-2005
Bootcamp
attrition
96,202 men
7,200 women
[6] CNA
Corporation 1990
Enlisted
1984
6-month
completion
31,791 men
1,831 women
[7] CNA
Corporation 2014
Accessed
2005-2013
Recruit
training
attrition
257,385 men
21,910 women
[8] CNA
Corporation 1999
Accessed
1995-1997
Bootcamp
attrition 6,554 women
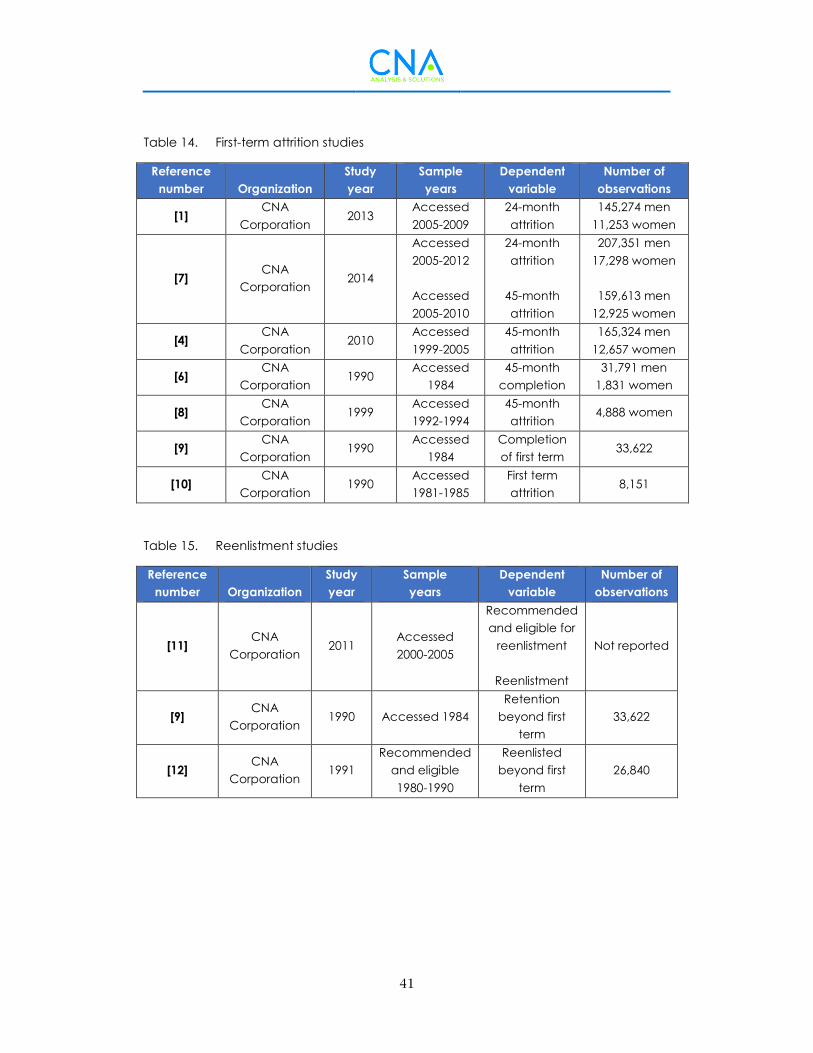
41
Table 14. First-term attrition studies
Reference
number Organization
Study
year
Sample
years
Dependent
variable
Number of
observations
[1] CNA
Corporation 2013
Accessed
2005-2009
24-month
attrition
145,274 men
11,253 women
[7] CNA
Corporation 2014
Accessed
2005-2012
Accessed
2005-2010
24-month
attrition
45-month
attrition
207,351 men
17,298 women
159,613 men
12,925 women
[4] CNA
Corporation 2010
Accessed
1999-2005
45-month
attrition
165,324 men
12,657 women
[6] CNA
Corporation 1990
Accessed
1984
45-month
completion
31,791 men
1,831 women
[8] CNA
Corporation 1999
Accessed
1992-1994
45-month
attrition 4,888 women
[9] CNA
Corporation 1990
Accessed
1984
Completion
of first term 33,622
[10] CNA
Corporation 1990
Accessed
1981-1985
First term
attrition 8,151
Table 15. Reenlistment studies
Reference
number Organization
Study
year
Sample
years
Dependent
variable
Number of
observations
[11] CNA
Corporation 2011
Accessed
2000-2005
Recommended
and eligible for
reenlistment
Reenlistment
Not reported
[9] CNA
Corporation 1990 Accessed 1984
Retention
beyond first
term
33,622
[12] CNA
Corporation 1991
Recommended
and eligible
1980-1990
Reenlisted
beyond first
term
26,840
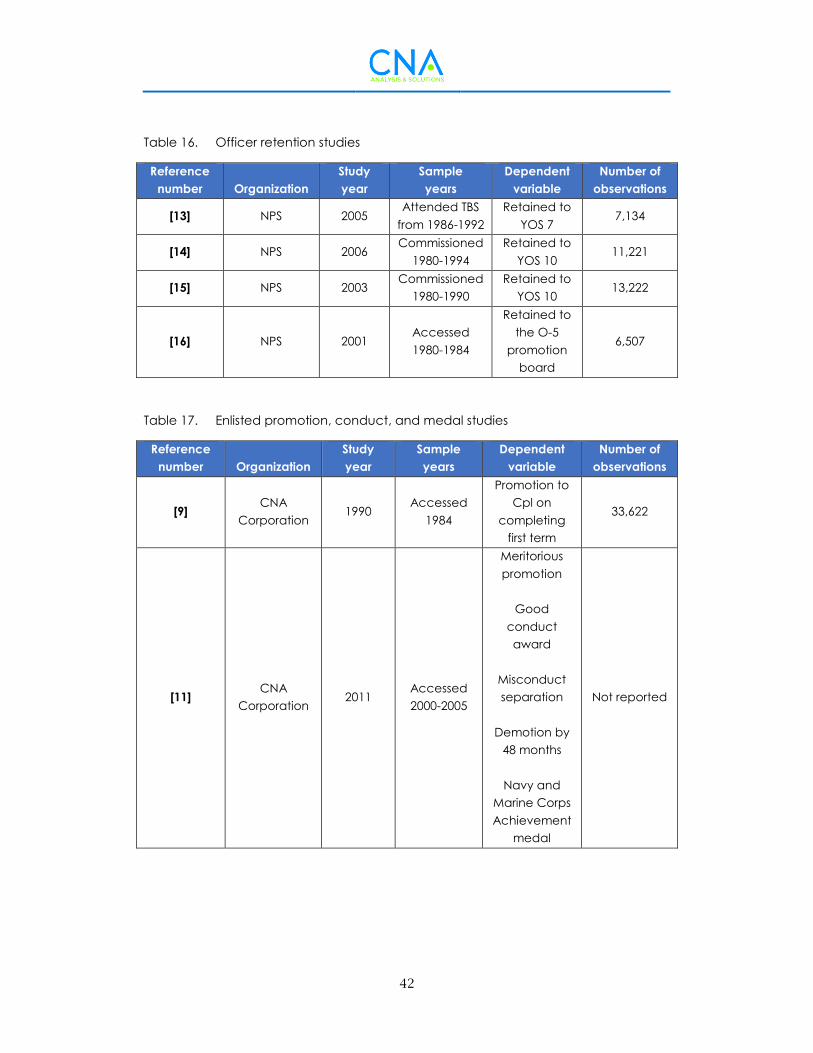
42
Table 16. Officer retention studies
Reference
number Organization
Study
year
Sample
years
Dependent
variable
Number of
observations
[13] NPS 2005 Attended TBS
from 1986-1992
Retained to
YOS 7 7,134
[14] NPS 2006 Commissioned
1980-1994
Retained to
YOS 10 11,221
[15] NPS 2003 Commissioned
1980-1990
Retained to
YOS 10 13,222
[16] NPS 2001 Accessed
1980-1984
Retained to
the O-5
promotion
board
6,507
Table 17. Enlisted promotion, conduct, and medal studies
Reference
number Organization
Study
year
Sample
years
Dependent
variable
Number of
observations
[9] CNA
Corporation 1990
Accessed
1984
Promotion to
Cpl on
completing
first term
33,622
[11] CNA
Corporation 2011
Accessed
2000-2005
Meritorious
promotion
Good
conduct
award
Misconduct
separation
Demotion by
48 months
Navy and
Marine Corps
Achievement
medal
Not reported

43
Table 18. Officer promotion studies
Reference
number Organization
Study
year Sample years
Dependent
variable
Number of
observations
[14] NPS 2006
Commissioned
1980-1994
Commissioned
1980-1988
Promotion to
Maj
Promotion to
LtCol
11,776
5,737
[15] NPS 2003
Commissioned
1980-1990
Commissioned
1980-1983
Promotion to
Maj
Promotion to
LtCol
7,281
1,785
[18] NPS 2008
Considered by
Fall 2006
promotion
boards
Promotion to
Maj
Promotion to
LtCol
Promotion to
Col
744
520
196
[16] NPS 2001
Considered by
1998-2001
promotion
boards
Promotion to
LtCol 1,627
[19] NPS 2011
Considered by
2004-2012
promotion
boards
Promotion to
LtCol 8,428
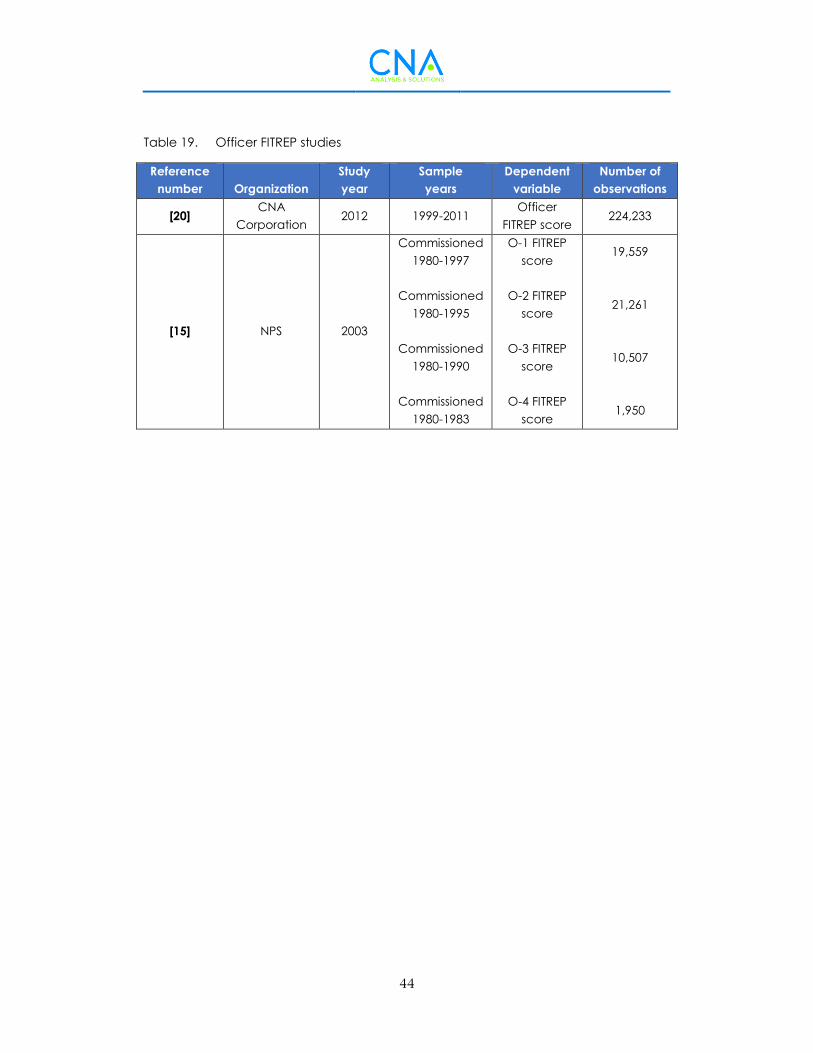
44
Table 19. Officer FITREP studies
Reference
number Organization
Study
year
Sample
years
Dependent
variable
Number of
observations
[20] CNA
Corporation 2012 1999-2011
Officer
FITREP score 224,233
[15] NPS 2003
Commissioned
1980-1997
Commissioned
1980-1995
Commissioned
1980-1990
Commissioned
1980-1983
O-1 FITREP
score
O-2 FITREP
score
O-3 FITREP
score
O-4 FITREP
score
19,559
21,261
10,507
1,950

45
References
[1] Peterson, Jeff, Jared Huff, and Aline Quester. 2013. The Role of the Delayed Entry Program in Recruiting the All-Volunteer Force. CNA Corporation. DRM-2013-U-005418-Final.
[2] Bruno, Michael G. 2005. “Analysis of Recruit Attrition From the U.S. Marine Corps Delayed Entry Program.” Master's thesis, Naval Postgraduate School.
[3] Baykiz, Murat Sami. 2007. “An Analysis of Marine Corps Delayed Entry Program (DEP) Attrition by High School Graduates and High School Seniors.” Master's thesis, Naval Postgraduate School.
[4] Quester, Aline. 2010. Marine Corps Recruits: A Historical Look at Accessions and Bootcamp Performance. CNA Corporation. CAB D0023537.A1/Final.
[5] McHugh, Cathleen, and Aline Quester. 2006. What Characteristics Are Associated With Marine Corps Bootcamp Success for Female Recruits? CNA Corporation. CME D0013762.A1.
[6] North, James. 1990. Length of Time in the Delayed-Entry Program and Its Effect on Marine Corps First-Term Survival. CNA Corporation. CRM 90-62.
[7] Trost, Robert, Jeff Peterson, Robert Shuford, Aline Quester, and Cathy Hiatt. 2014. Assessing How Delayed Entry Program Physical Fitness Is Related to In-Service Attrition, Injuries, and Physical Fitness. CNA Corporation. DRM-2014-U-007869.
[8] Quester, Aline. 1999. Enlistment Waivers, Educational Background, and Attrition From the Marine Corps: Female Accessions. CNA Corporation. CRM 99-035.
[9] Quester, Aline, James North, and Theresa Kimble. 1990. Identifying Successful Marine Corps Recruits. CNA Corporation. CRM 89-314.
[10] Quester, Aline, and Greg Steadman. 1990. Enlisted Women in the Marine Corps: First-Term Attrition and Long-Term Retention. CNA Corporation. CRM 90-71.
[11] Malone, Lauren, and Neil Carey. 2011. Waivered Recruits: An Evaluation of Their Performance and Attrition Risk. CNA Corporation. CRM D0023955.A2/Final.
[12] Quester, Aline, and Adebayo M. Adedeji. 1991. Reenlisting in the Marine Corps: The Impact of Bonuses, Grade, and Dependency Status. CNA Corporation. CRM 91-64.
[13] Jobst, Mark, and Jeffrey Palmer. 2005. “Analysis of the USMC FITREP: Contemporary or Inflexible?” Master's thesis, Naval Postgraduate School.

46
[14] Perry, Tracy A. 2006. “An Analysis of Primary Military Occupational Specialties on Retention and Promotion of Mid-Grade Officers in the U.S. Marine Corps.” Master's thesis, Naval Postgraduate School.
[15] Ergun, Levent. 2003. “An Analysis of Officer Accession Programs and the Career Development of U.S. Marine Corps Officers.” Master's thesis, Naval Postgraduate School.
[16] Branigan, Gregory A. 2001. “The Effect of Graduate Education on the Retention and Promotion of Marine Corps Officers.” Master's thesis, Naval Postgraduate School.
[17] Marine Corps Order P1400.32D Ch 2. Jun. 14, 2012. Marine Corps Promotion Manual: Volume 2, Enlisted Promotions.
[18] Hoffman, Joel M. 2008. “Significant Factors in Predicting Promotion to Major, Lieutenant Colonel, and Colonel in the United States Marine Corps.” Master's thesis, Naval Postgraduate School.
[19] Reynolds, Jacob L. 2011. “Effect of Being an Aviator on Promotion to O-5 in the USMC.” Master's thesis, Naval Postgraduate School.
[20] Clemens, Adam, Lauren Malone, Shannon Phillips, and Gary Lee. 2012. An Evaluation of the Fitness Report System for Marine Officers. CNA Corporation. DRM-2012-U-001003.

The CNA Corporation
This report was written by CNA Corporation’s Resource Analysis Division
(RAD).
RAD provides analytical services—through empirical research, modeling,
and simulation—to help develop, evaluate, and implement policies,
practices, and programs that make people, budgets, and assets more
effective and efficient. Major areas of research include health research
and policy; energy and environment; manpower management;
acquisition and cost; infrastructure; and military readiness.
DRM-2014-U-009327-Final
www.cna.org ● 703-824-2000
3003 Washington Boulevard, Arlington, VA 22201
CNA Corporation is a not-for-profit research organization
that serves the public interest by providing
in-depth analysis and result-oriented solutions
to help government leaders choose
the best course of action
in setting policy and managing operations.
Nobody gets closer—
to the people, to the data, to the problem.