differences in food environment perceptions and spatial attributes of food shopping between...
TRANSCRIPT
Research ArticleDifferences in Food Environment Perceptions and SpatialAttributes of Food Shopping Between Residents of Low andHigh Food Access AreasInderbir Sohi, MSPH1; Bethany A. Bell, PhD2; Jihong Liu, ScD1; Sarah E. Battersby, PhD3;Angela D. Liese, PhD1,4
1Departmeof South C2College o3Departme4Center foColumbia,Address foBiostatisticPublic HeaPhone: (80�2014 SOhttp://dx.d
Journal of
ABSTRACT
Objective: To explore potential differences in food shopping behaviors and healthy food availabilityperceptions between residents living in areas with low and high food access.Design: A cross-sectional telephone survey to assess food shopping behaviors and perceptions. Data froman 8-county food environment field census used to define the Centers for Disease Control and Prevention(CDC) healthier food retail tract and US Department of Agriculture Economic Research Service fooddesert measure.Participants: A total of 968 residents in 8 South Carolina counties.Main Outcome Measures: Residents’ food shopping behaviors and healthy food availability percep-tions.Analysis: Linear and logistic regression.Results: Compared with residents in high food access areas, residents in low food access areas traveledfarther to their primary food store (US Department of Agriculture Economic Research Service: 8.8 vs7.1 miles, P ¼ .03; CDC: 9.2 vs 6.1 miles, P < .001), accumulated more total shopping miles per week(CDC: 28.0 vs 15.4 miles; P < .001), and showed differences in perceived healthy food availability(P < .001) and shopping access (P < .001).Conclusions and Implications: These findings lend support to ongoing community and policy inter-ventions aimed at reducing food access disparities.Key Words: healthy food access, food environment, food shopping behaviors, food access disparities(J Nutr Educ Behav. 2014;-:1-9.)
INTRODUCTION
The rise in obesity rates in the US hasbeen a driving force of researchinto ‘‘obesogenic environments.’’1-3
Several studies have found that alarge number of fast-food restaurantsand few grocery stores in a resident'sfood environment were associatedwith a higher odds of obesity amongarea residents, although the relation-
nt of Epidemiology and Biostatistics,arolina, Columbia, SCf Education, University of South Cant of Geography, University of Sour Research in Nutrition and HealthSCr correspondence: Angela D. Lieses, Center for Research in Nutritionlth, University of South Carolina,3) 777-9414; Fax: (803) 777-2524; E-CIETY FOR NUTRITION EDUCoi.org/10.1016/j.jneb.2013.12.006
Nutrition Education and Behav
ship varied between metro and non-metro areas.4,5 Policy makers in theUS have questioned the extent towhich healthy foods are easilyaccessible and available.6 The USDepartment of Agriculture (USDA)Economic Research Service (ERS) hasreported that limited access to majorfood outlets such as grocery storesand supermarkets affects over 23.5million people living in 6,529
Arnold School of Public Health, University
rolina, Columbia, SCth Carolina, Columbia, SCDisparities, University of South Carolina,
, PhD, Department of Epidemiology andand Health Disparities, Arnold School of915 Greene Street, Columbia, SC, 29208;mail: [email protected] AND BEHAVIOR
ior � Volume -, Number -, 2014
different Census tracts.7,8 In anupdated USDA ERS report based on2010 Census and supermarket data,this statistic increased to 29.7million people, who lived in a low-income area > 1 mile from a super-market.9 Several community foodaccess (CFA) measures have beencreated to identify and quantify areasthat are considered to have low accessto healthier food retailers. The 2009and 2013 Centers for Disease Controland Prevention (CDC) State IndicatorReport on Fruits and Vegetables10,11
categorized each state's Census tractsbased on the presence or absence ofretailers that are considered healthy:as a healthier food retail tract (HFRT)or non–healthier food retail tract(non-HFRT). The 2009 USDA ERSAccess to Affordable and NutritiousFood—Measuring and UnderstandingFood Deserts and Their Consequences:Report to Congress12 identified areaswith limited access to nutritiousfoods and classified each Census tract
1
2 Sohi et al Journal of Nutrition Education and Behavior � Volume -, Number -, 2014
as a food desert (FD) or non–fooddesert (non-FD) based on its medianfamily income and supermarket ac-cess. This was recently updated inthe Food Access Research Atlas inMarch, 2013.8
To the authors' knowledge, thesemeasures of CFAhave not been studiedwith respect to food shopping behav-iors or residents' perceptions of foodretail access. The only descriptivestudy of USDA ERS FDs to date focusedon socioeconomic characteristics.7 Un-derstanding residents' perceptions oftheir food environment gives insightsinto their subjective attitudes andexperiences, which in turn can influ-ence shopping and ultimately healthbehaviors.13
The purpose of this study was toexplore differences in healthy foodavailability perceptions and spatialattributes of food shopping betweenresidents of low vs high food accessareas. Shopping behaviors weredefined as actions related to residents'food shopping travel and time, suchas distance to the nearest shoppingstore and total number of shoppingmiles per week. This is different fromin-store behaviors such as types offoods purchased and purchasingfrequency, with which the study wasnot concerned. The hypotheses werethat residents of low access areaswould rate their healthy food avail-ability and food shopping access aspoorer, travel further distances totheir primarily used food store, takefewer shopping trips per week, accruemore total shopping miles per week,and be more likely to shop at a super-center and less likely to shop at thenearest store.
METHODSStudy Area and FoodEnvironment Database
To recreate the food access measuresin the sample, the researchers useddata from a previously conductedfield census of retail food outlets in 8South Carolina counties, covering169 Census tracts.14 This dataset wasmanaged with ArcGIS 10.1 (Esri,Redlands, CA, 2012) and included ge-ospatial information and store type at-tributes on all retail food outletslocated in 1 urban and 7 ruralcounties. Of the 2,208 total food
outlets, 102 supermarkets and largegrocery stores were used to derive theCFA measures.
Community Food AccessMeasures
Using the data described above14 and2010 US Census data,15 the 2measures of CFA were replicated forthe study area.
The CDC HFRT measure identifieswhether a Census tract has a super-market, large grocery store, ware-house club, or fruit and vegetablemarket within the tract or within0.5 miles of the boundary.10 Super-markets are defined as food storeswith $ 50 annual payroll employees,whereas large grocery stores have 10–49 employees. To compare the CDCdefinition with the USDA ERS defini-tion described subsequently, thefocus was on non-HFRTs. The replica-tion of this measure relied on super-markets, large grocery stores, andfruit and vegetable markets, andused 2010 Census geographies, iden-tifying 49 of 169 Census tracts asnon-HFRTs.
For the USDA ERS FD measure, aCensus tract was identified as a low-income tract if it met the US TreasuryDepartment's New Market Tax Creditprogram eligibility criteria (ie, apoverty rate of at least 20%, a medianfamily income < 80% of the statewidemedian family income for tracts innon-metropolitan areas, or a medianfamily income < 80% of the metro-politan area median family incomefor tracts in metropolitan areas).8,12
The Census tract also had to be low-access, such that at least 500 residentsor 33% of the tract population resided> 1 mile from a supermarket in anurban tract or > 10 miles in a ruraltract, based on Euclidean distance.The USDA ERS defined a supermarketas a retailer that must have at least$2million in annual sales and containthe major food departments.8,12
To evaluate the access and incomecriterion, population and economicdata were derived from the 0.5 �0.5-km gridded population estimates.The replication of this measure identi-fied 38 of 169 Census tracts as FDs andrelied on supermarkets, large grocerystores, and warehouse clubs and2010 census geographies.
Both CFA measures were replicatedbased on accurate ground-trutheddata14,16 instead of using thesecondary commercial databasesunderlying the agency publi-cations.9,10 This was because the foodenvironment data were moreaccurate14,17 and collected closer intime (ie, 2009) to the point of datacollection on the study sample(ie, 2010). In addition, a 10-mile buffercorridor was created around the studyarea, using InfoUSA (Papillion, NE)and Dun & Bradstreet (Short Hills, NJ)commercial data, to account foredge effects owing to food stores thatcould lie outside the boundaries of thestudy area.
Study Sample
The University of South CarolinaInstitutional Review Board reviewedand approved the study's protocol.Data on residents' perceptions andshopping behaviors were obtainedvia telephone interviews of 968residents of the 8 counties. The Uni-versity of South Carolina SurveyResearch Laboratory sampled 2,477phone numbers, which were a simplerandom sample of publicly availablelisted phone numbers, representinghouseholds of 64 zip codes in the169 Census tracts. Respondents hadto be $ 18 years of age and theprimary food shopper of the house-hold, speak English, and residewithin the study area boundaries.The estimated response rate, after us-ing American Association for PublicOpinion Research Response Rate For-mula 4,18 was 47.1%. Respondentdata were geocoded and linked tothe geo-spatial data, so that eachparticipant was assigned to her orhis residential Census tract's designa-tion according to the USDA ERS8 andCDC.10
Assessment of Food ShoppingBehaviors and Perceptions ofHealthy Food Availability
Study respondents were asked toname their primary food store anddescribe the store type, their reasonsfor shopping at that store, and howoften they shopped. The primaryfood stores were identified in a
Journal of Nutrition Education and Behavior � Volume -, Number -, 2014 Sohi et al 3
food environment database.14 Theresearchers used ArcGIS 10.1 tocompute road network distances inmiles and determine whether re-spondents shopped at the nearestfood store. Shopping miles perweek were computed by multiplyingthe shopping frequency with thedistance to the primarily used foodstore times 2. Supercenter use wasdefined as shopping at a primaryretail establishment that sold bothfood and general merchandise, suchas Wal-Mart.19
Perceptions of healthy food avail-ability and shopping access wereassessed with 4 questions.20 Specif-ically, respondents were asked about(1) the selection and (2) quality offresh fruits and vegetables, (3) the se-lection of low-fat products, and (4)the lack of access to adequate foodshopping in their neighborhood(defined as 1 mile or a 20-minutewalk from their home). Responseswere coded on a Likert scale rangingfrom 1 (strongly agree) to 5 (stronglydisagree) for Questions 1–3, andfrom 1 to 4 (1 ¼ very serious problem;2 ¼ somewhat serious problem; 3 ¼minor problem; 4 ¼ not really a prob-lem) for Question 4. These questionshave been shown to have high test-retest reliability statistics (based oninterclass correlations and Phi coeffi-cients) in the study population,ranging from 0.55 to 0.71 for the per-ceptions of the food environment andfrom 0.51 to 0.83 for the perceivedpresence of food outlets.20 The first 3perception questions were reverse-coded and transformed to a pointscale of 0–4, in which a higher num-ber indicated stronger agreementwith availability. A composite scoreranging from 0 to 12 was created.The food shopping access questionwas assessed on a point scale of 0–3,in which a higher number indicatedbetter access.
Statistical Analysis
Distance to primarily used food storeand shopping frequency per weekwere winsorized at the 95th and99th percentiles, respectively, toaddress extreme outliers and skew-ness. A universal exclusion variableremoved individuals with missingdata on any of the study variables,
which resulted in a final sample sizeof 685 participants. There were nosignificant differences in sociodemo-graphic characteristics (such as race,age, and education level) betweenthe original and final study samples.Race was coded as 0 (non-Hispanicwhite) and 1 (other races). All statisti-cal analyses were conducted with SAS(version 9.3, Cary, NC, 2011).Bonferroni-adjusted alpha levels wereset for all statistical tests.
Ordinary least squares regressionprovided estimates of the unstan-dardized regression coefficients, Pvalues, and overall model R2 forcontinuous outcomes. Point esti-mates, including unstandardizedregression coefficients (bs), wereused to examine differences inadjusted means for all continuousoutcome variables, while controllingfor other predictors. The authorscalculated Cohen's d, an effect sizemeasure that indicates a standardizedmagnitude of the observed differencebetween access groups, so they couldcompare residents' mean shoppingbehaviors and food perceptionsacross study variables. Cohen's d
cutoffs are defined as follows: < .2 in-dicates a small effect size, .5 indicatesa moderate effect size, and > .8 indi-cates a large effect size.21 Assump-tions for ordinary least squaresregression models were examined;no violations were noted. Logistic re-gression provided unstandardizedregression coefficients, P values,odds ratios, and corresponding 95%confidence intervals for the categori-cal outcomes.
RESULTS
Of the study sample of 685, 117 par-ticipants lived in Census tracts identi-fied as USDA ERS FDs, and 284 in CDCnon-HFRTs. Most study participantswere non-Hispanic white (65.8%)and female (77.7%), had a high schooldegree (35.6%), owned a personalvehicle (94.0%), were married(64.1%), lived in a non-urban area(81.2%), did not receive food assis-tance (90.4%), and had an averageage in the late 50s and an annualhousehold income of $40,000–$49,900. Differences in characteristicsbetween residents of low and highfood access areas were observed for
(1) urban residence (non-HFRT vsHFRT: 3.5% vs 29.7%; P < .001), (2)marital status (non-HFRT vs HFRT:59.2% vs 67.6%; P ¼ .02), (3) highschool education (non-HRFT vsHRFT: 42.6% vs 30.7%; P < .001),and (4) race/ethnicity (FD vs non-FD:55.6% vs 68.0%, P ¼ .01; non-HFRTvs HFRT: 60.9% vs. 69.3%, P ¼ .02).Table 1 displays the sociodemo-graphic characteristics of the finalstudy samples.
Table 2 lists descriptive characteris-tics of food shopping behaviors andfood environment perceptions. Inthis unadjusted analysis, the differ-ences between residents of FDs vsnon-FD were distance to primaryused food store (11.4 vs 9.6 miles),distance to the nearest food store(8.2 vs 5.4 miles), and food shoppingaccess score, a measure of perception(1.7 vs 2.1). Substantial differences in3 of the shopping behaviors and allmeasures of perceptions of the foodenvironment were observed forresidents of non-HFRTs vs HFRTs. Us-ing Bonferroni-adjusted alpha levelsof .005 (.05/11), the difference indistance to primarily used food storeunder the USDA ERS measure was nolonger significant.
Table 3 shows results of multi-variate models, controlling for de-mographic and socioeconomiccharacteristics. Residents of FDs trav-eled significantly farther distancesto their primarily used food store(8.8 vs 7.1 miles). However, afterapplying the Bonferroni correctionin which the adjusted alpha levelbecame .007, the distance to the pri-marily used food store was no longerstatistically significantly different be-tween residents of FDs and non-FDs.No significant differences in thefrequency of shopping (1.8 vs 1.9times per week), likelihood of shop-ping at the nearest store (odds ratio[OR] ¼ 1.0; 95% confidence interval[CI], 0.3–3.8), total shopping milesper week (26.7 vs 19.2 miles), or like-lihood of supercenter use (OR ¼ 0.7;95% CI, 0.4–1.1) were found.Residents of FDs rated their foodshopping access as significantlypoorer (of 2.0 vs 2.4) than residentsof non-FDs, but their healthy foodavailability rating (6.9 vs 7.6) wasnot significantly different. TheCohen's d statistic showed moderateeffect sizes for the significant
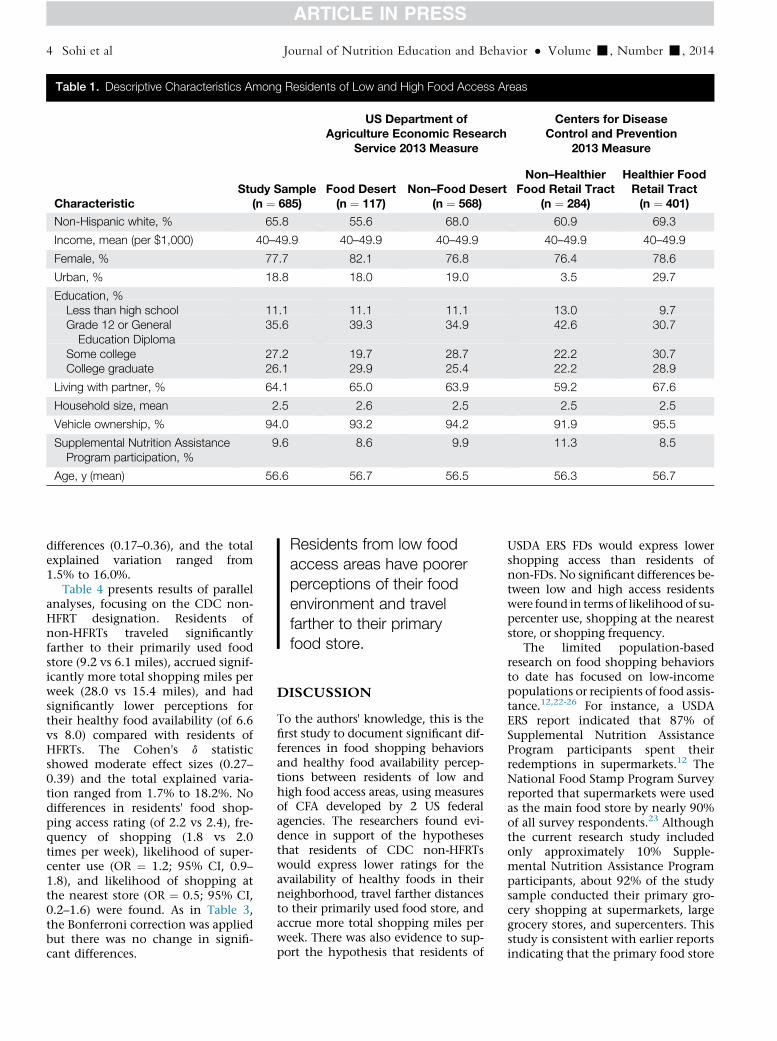
Table 1. Descriptive Characteristics Among Residents of Low and High Food Access Areas
CharacteristicStudy Sample
(n ¼ 685)
US Department ofAgriculture Economic Research
Service 2013 Measure
Centers for DiseaseControl and Prevention
2013 Measure
Food Desert(n ¼ 117)
Non–Food Desert(n ¼ 568)
Non–HealthierFood Retail Tract
(n ¼ 284)
Healthier FoodRetail Tract(n ¼ 401)
Non-Hispanic white, % 65.8 55.6 68.0 60.9 69.3
Income, mean (per $1,000) 40–49.9 40–49.9 40–49.9 40–49.9 40–49.9
Female, % 77.7 82.1 76.8 76.4 78.6
Urban, % 18.8 18.0 19.0 3.5 29.7
Education, %Less than high school 11.1 11.1 11.1 13.0 9.7Grade 12 or GeneralEducation Diploma
35.6 39.3 34.9 42.6 30.7
Some college 27.2 19.7 28.7 22.2 30.7College graduate 26.1 29.9 25.4 22.2 28.9
Living with partner, % 64.1 65.0 63.9 59.2 67.6
Household size, mean 2.5 2.6 2.5 2.5 2.5
Vehicle ownership, % 94.0 93.2 94.2 91.9 95.5
Supplemental Nutrition AssistanceProgram participation, %
9.6 8.6 9.9 11.3 8.5
Age, y (mean) 56.6 56.7 56.5 56.3 56.7
Residents from low foodaccess areas have poorerperceptions of their foodenvironment and travelfarther to their primaryfood store.
4 Sohi et al Journal of Nutrition Education and Behavior � Volume -, Number -, 2014
differences (0.17–0.36), and the totalexplained variation ranged from1.5% to 16.0%.
Table 4 presents results of parallelanalyses, focusing on the CDC non-HFRT designation. Residents ofnon-HFRTs traveled significantlyfarther to their primarily used foodstore (9.2 vs 6.1 miles), accrued signif-icantly more total shopping miles perweek (28.0 vs 15.4 miles), and hadsignificantly lower perceptions fortheir healthy food availability (of 6.6vs 8.0) compared with residents ofHFRTs. The Cohen's d statisticshowed moderate effect sizes (0.27–0.39) and the total explained varia-tion ranged from 1.7% to 18.2%. Nodifferences in residents' food shop-ping access rating (of 2.2 vs 2.4), fre-quency of shopping (1.8 vs 2.0times per week), likelihood of super-center use (OR ¼ 1.2; 95% CI, 0.9–1.8), and likelihood of shopping atthe nearest store (OR ¼ 0.5; 95% CI,0.2–1.6) were found. As in Table 3,the Bonferroni correction was appliedbut there was no change in signifi-cant differences.
DISCUSSION
To the authors' knowledge, this is thefirst study to document significant dif-ferences in food shopping behaviorsand healthy food availability percep-tions between residents of low andhigh food access areas, using measuresof CFA developed by 2 US federalagencies. The researchers found evi-dence in support of the hypothesesthat residents of CDC non-HFRTswould express lower ratings for theavailability of healthy foods in theirneighborhood, travel farther distancesto their primarily used food store, andaccrue more total shopping miles perweek. There was also evidence to sup-port the hypothesis that residents of
USDA ERS FDs would express lowershopping access than residents ofnon-FDs. No significant differences be-tween low and high access residentswere found in terms of likelihood of su-percenter use, shopping at the neareststore, or shopping frequency.
The limited population-basedresearch on food shopping behaviorsto date has focused on low-incomepopulations or recipients of food assis-tance.12,22-26 For instance, a USDAERS report indicated that 87% ofSupplemental Nutrition AssistanceProgram participants spent theirredemptions in supermarkets.12 TheNational Food Stamp Program Surveyreported that supermarkets were usedas the main food store by nearly 90%of all survey respondents.23 Althoughthe current research study includedonly approximately 10% Supple-mental Nutrition Assistance Programparticipants, about 92% of the studysample conducted their primary gro-cery shopping at supermarkets, largegrocery stores, and supercenters. Thisstudy is consistent with earlier reportsindicating that the primary food store
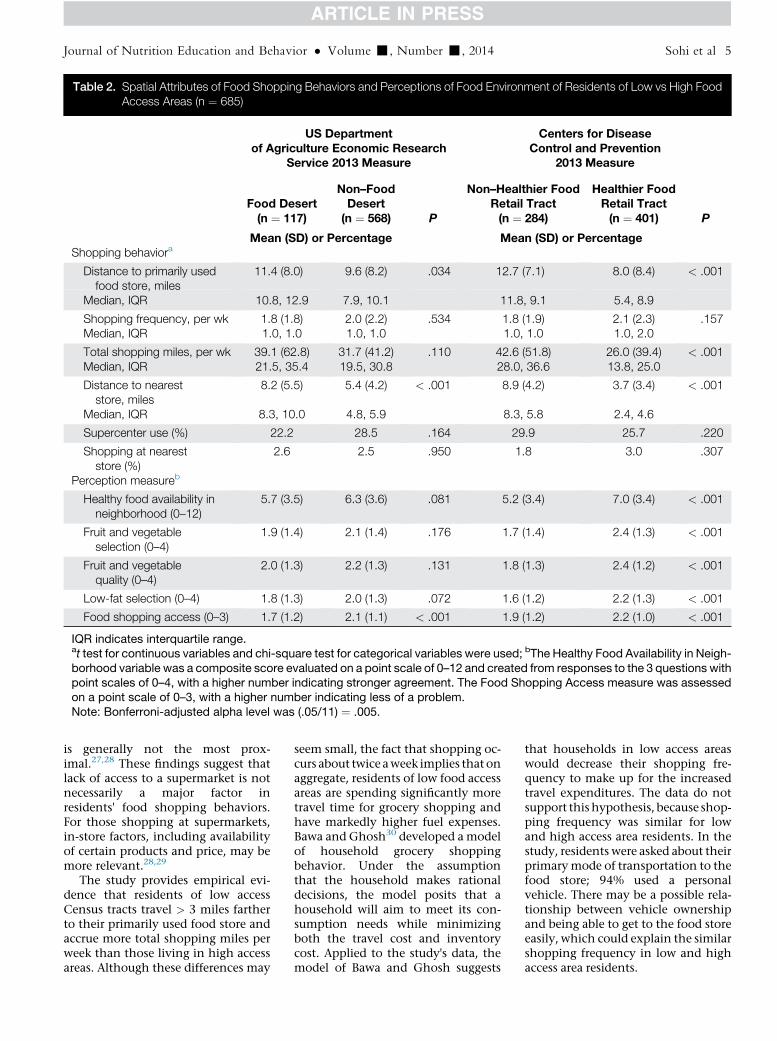
Table 2. Spatial Attributes of Food Shopping Behaviors and Perceptions of Food Environment of Residents of Low vs High FoodAccess Areas (n ¼ 685)
US Departmentof Agriculture Economic Research
Service 2013 Measure
Centers for DiseaseControl and Prevention
2013 Measure
Food Desert(n ¼ 117)
Non–FoodDesert(n ¼ 568) P
Non–Healthier FoodRetail Tract(n ¼ 284)
Healthier FoodRetail Tract(n ¼ 401) P
Mean (SD) or Percentage Mean (SD) or PercentageShopping behaviora
Distance to primarily usedfood store, miles
11.4 (8.0) 9.6 (8.2) .034 12.7 (7.1) 8.0 (8.4) < .001
Median, IQR 10.8, 12.9 7.9, 10.1 11.8, 9.1 5.4, 8.9
Shopping frequency, per wk 1.8 (1.8) 2.0 (2.2) .534 1.8 (1.9) 2.1 (2.3) .157Median, IQR 1.0, 1.0 1.0, 1.0 1.0, 1.0 1.0, 2.0
Total shopping miles, per wk 39.1 (62.8) 31.7 (41.2) .110 42.6 (51.8) 26.0 (39.4) < .001Median, IQR 21.5, 35.4 19.5, 30.8 28.0, 36.6 13.8, 25.0
Distance to neareststore, miles
8.2 (5.5) 5.4 (4.2) < .001 8.9 (4.2) 3.7 (3.4) < .001
Median, IQR 8.3, 10.0 4.8, 5.9 8.3, 5.8 2.4, 4.6
Supercenter use (%) 22.2 28.5 .164 29.9 25.7 .220
Shopping at neareststore (%)
2.6 2.5 .950 1.8 3.0 .307
Perception measureb
Healthy food availability inneighborhood (0–12)
5.7 (3.5) 6.3 (3.6) .081 5.2 (3.4) 7.0 (3.4) < .001
Fruit and vegetableselection (0–4)
1.9 (1.4) 2.1 (1.4) .176 1.7 (1.4) 2.4 (1.3) < .001
Fruit and vegetablequality (0–4)
2.0 (1.3) 2.2 (1.3) .131 1.8 (1.3) 2.4 (1.2) < .001
Low-fat selection (0–4) 1.8 (1.3) 2.0 (1.3) .072 1.6 (1.2) 2.2 (1.3) < .001
Food shopping access (0–3) 1.7 (1.2) 2.1 (1.1) < .001 1.9 (1.2) 2.2 (1.0) < .001
IQR indicates interquartile range.at test for continuous variables and chi-square test for categorical variables were used; bThe Healthy Food Availability in Neigh-borhood variable was a composite score evaluated on a point scale of 0–12 and created from responses to the 3 questions withpoint scales of 0–4, with a higher number indicating stronger agreement. The Food Shopping Access measure was assessedon a point scale of 0–3, with a higher number indicating less of a problem.Note: Bonferroni-adjusted alpha level was (.05/11) ¼ .005.
Journal of Nutrition Education and Behavior � Volume -, Number -, 2014 Sohi et al 5
is generally not the most prox-imal.27,28 These findings suggest thatlack of access to a supermarket is notnecessarily a major factor inresidents' food shopping behaviors.For those shopping at supermarkets,in-store factors, including availabilityof certain products and price, may bemore relevant.28,29
The study provides empirical evi-dence that residents of low accessCensus tracts travel > 3 miles fartherto their primarily used food store andaccrue more total shopping miles perweek than those living in high accessareas. Although these differences may
seem small, the fact that shopping oc-curs about twice aweek implies that onaggregate, residents of low food accessareas are spending significantly moretravel time for grocery shopping andhave markedly higher fuel expenses.Bawa and Ghosh30 developed a modelof household grocery shoppingbehavior. Under the assumptionthat the household makes rationaldecisions, the model posits that ahousehold will aim to meet its con-sumption needs while minimizingboth the travel cost and inventorycost. Applied to the study's data, themodel of Bawa and Ghosh suggests
that households in low access areaswould decrease their shopping fre-quency to make up for the increasedtravel expenditures. The data do notsupport this hypothesis, because shop-ping frequency was similar for lowand high access area residents. In thestudy, residents were asked about theirprimarymode of transportation to thefood store; 94% used a personalvehicle. There may be a possible rela-tionship between vehicle ownershipand being able to get to the food storeeasily, which could explain the similarshopping frequency in low and highaccess area residents.
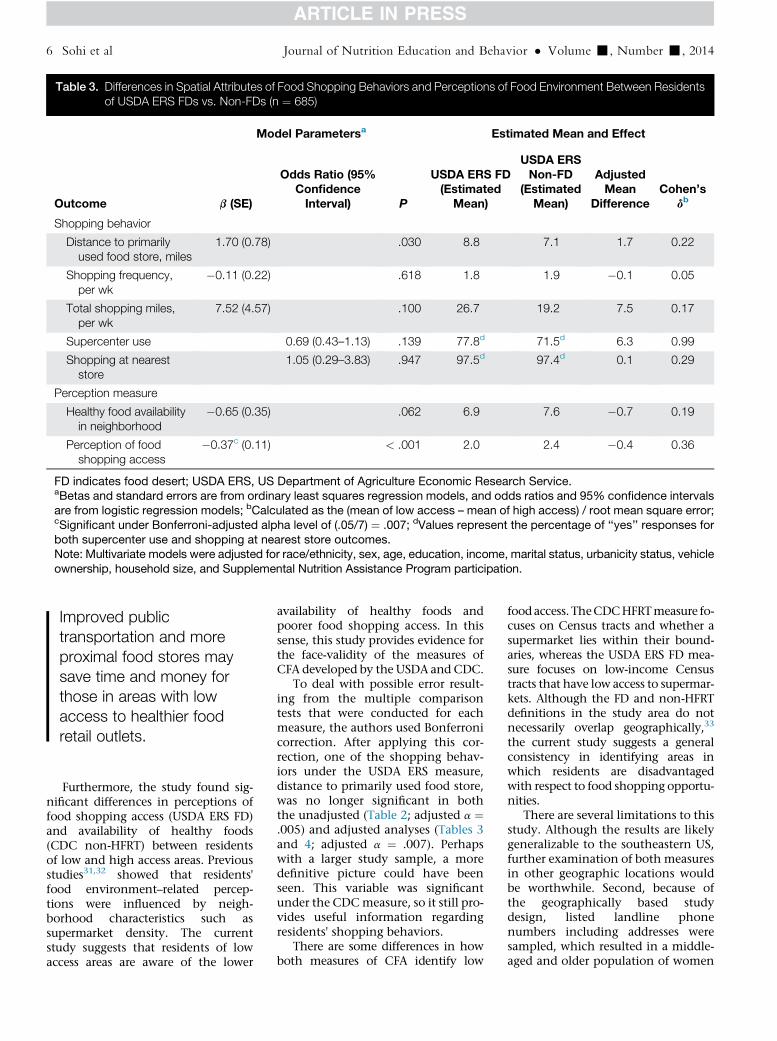
Table 3. Differences in Spatial Attributes of Food Shopping Behaviors and Perceptions of Food Environment Between Residentsof USDA ERS FDs vs. Non-FDs (n ¼ 685)
Outcome
Model Parametersa Estimated Mean and Effect
b (SE)
Odds Ratio (95%ConfidenceInterval) P
USDA ERS FD(Estimated
Mean)
USDA ERSNon-FD
(EstimatedMean)
AdjustedMean
DifferenceCohen’s
db
Shopping behavior
Distance to primarilyused food store, miles
1.70 (0.78) .030 8.8 7.1 1.7 0.22
Shopping frequency,per wk
�0.11 (0.22) .618 1.8 1.9 �0.1 0.05
Total shopping miles,per wk
7.52 (4.57) .100 26.7 19.2 7.5 0.17
Supercenter use 0.69 (0.43–1.13) .139 77.8d 71.5d 6.3 0.99
Shopping at neareststore
1.05 (0.29–3.83) .947 97.5d 97.4d 0.1 0.29
Perception measure
Healthy food availabilityin neighborhood
�0.65 (0.35) .062 6.9 7.6 �0.7 0.19
Perception of foodshopping access
�0.37c (0.11) < .001 2.0 2.4 �0.4 0.36
FD indicates food desert; USDA ERS, US Department of Agriculture Economic Research Service.aBetas and standard errors are from ordinary least squares regression models, and odds ratios and 95% confidence intervalsare from logistic regression models; bCalculated as the (mean of low access – mean of high access) / root mean square error;cSignificant under Bonferroni-adjusted alpha level of (.05/7) ¼ .007; dValues represent the percentage of ‘‘yes’’ responses forboth supercenter use and shopping at nearest store outcomes.Note: Multivariate models were adjusted for race/ethnicity, sex, age, education, income, marital status, urbanicity status, vehicleownership, household size, and Supplemental Nutrition Assistance Program participation.
Improved publictransportation and moreproximal food stores maysave time and money forthose in areas with lowaccess to healthier foodretail outlets.
6 Sohi et al Journal of Nutrition Education and Behavior � Volume -, Number -, 2014
Furthermore, the study found sig-nificant differences in perceptions of
food shopping access (USDA ERS FD)and availability of healthy foods(CDC non-HFRT) between residentsof low and high access areas. Previousstudies31,32 showed that residents'food environment–related percep-tions were influenced by neigh-borhood characteristics such assupermarket density. The currentstudy suggests that residents of lowaccess areas are aware of the loweravailability of healthy foods andpoorer food shopping access. In thissense, this study provides evidence forthe face-validity of the measures ofCFA developed by the USDA and CDC.
To deal with possible error result-ing from the multiple comparisontests that were conducted for eachmeasure, the authors used Bonferronicorrection. After applying this cor-rection, one of the shopping behav-iors under the USDA ERS measure,distance to primarily used food store,was no longer significant in boththe unadjusted (Table 2; adjusted a ¼.005) and adjusted analyses (Tables 3and 4; adjusted a ¼ .007). Perhapswith a larger study sample, a moredefinitive picture could have beenseen. This variable was significantunder the CDCmeasure, so it still pro-vides useful information regardingresidents' shopping behaviors.
There are some differences in howboth measures of CFA identify low
food access. TheCDCHFRTmeasure fo-cuses on Census tracts and whether asupermarket lies within their bound-aries, whereas the USDA ERS FD mea-sure focuses on low-income Censustracts that have low access to supermar-kets. Although the FD and non-HFRTdefinitions in the study area do notnecessarily overlap geographically,33
the current study suggests a generalconsistency in identifying areas inwhich residents are disadvantagedwith respect to food shopping opportu-nities.
There are several limitations to thisstudy. Although the results are likelygeneralizable to the southeastern US,further examination of both measuresin other geographic locations wouldbe worthwhile. Second, because ofthe geographically based studydesign, listed landline phonenumbers including addresses weresampled, which resulted in a middle-aged and older population of women
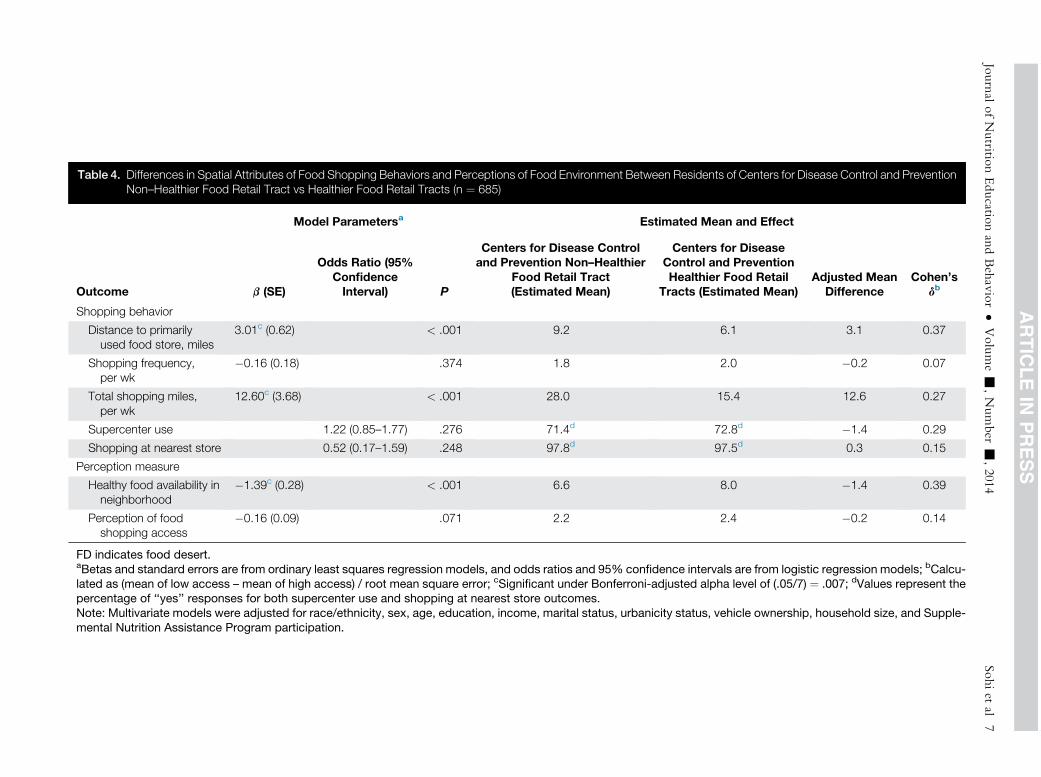
Table 4. Differences in Spatial Attributes of Food Shopping Behaviors and Perceptions of Food Environment Between Residents of Centers for Disease Control and PreventionNon–Healthier Food Retail Tract vs Healthier Food Retail Tracts (n ¼ 685)
Outcome
Model Parametersa Estimated Mean and Effect
b (SE)
Odds Ratio (95%ConfidenceInterval) P
Centers for Disease Controland Prevention Non–Healthier
Food Retail Tract(Estimated Mean)
Centers for DiseaseControl and PreventionHealthier Food Retail
Tracts (Estimated Mean)Adjusted Mean
DifferenceCohen’s
db
Shopping behavior
Distance to primarilyused food store, miles
3.01c (0.62) < .001 9.2 6.1 3.1 0.37
Shopping frequency,per wk
�0.16 (0.18) .374 1.8 2.0 �0.2 0.07
Total shopping miles,per wk
12.60c (3.68) < .001 28.0 15.4 12.6 0.27
Supercenter use 1.22 (0.85–1.77) .276 71.4d 72.8d �1.4 0.29
Shopping at nearest store 0.52 (0.17–1.59) .248 97.8d 97.5d 0.3 0.15
Perception measure
Healthy food availability inneighborhood
�1.39c (0.28) < .001 6.6 8.0 �1.4 0.39
Perception of foodshopping access
�0.16 (0.09) .071 2.2 2.4 �0.2 0.14
FD indicates food desert.aBetas and standard errors are from ordinary least squares regression models, and odds ratios and 95% confidence intervals are from logistic regression models; bCalcu-lated as (mean of low access – mean of high access) / root mean square error; cSignificant under Bonferroni-adjusted alpha level of (.05/7) ¼ .007; dValues represent thepercentage of ‘‘yes’’ responses for both supercenter use and shopping at nearest store outcomes.Note: Multivariate models were adjusted for race/ethnicity, sex, age, education, income, marital status, urbanicity status, vehicle ownership, household size, and Supple-mental Nutrition Assistance Program participation.
JournalofNutritio
nEducatio
nandBehavior�
Volume-
,Number
-,2014
Sohiet
al7
8 Sohi et al Journal of Nutrition Education and Behavior � Volume -, Number -, 2014
who were significantly more likely tobe responsible for a household's foodshopping and food preparation,compared with men.1,34 Thus, theresults may not extend to house-holds relying exclusively on cellphones, which are known to bemore frequent in younger agegroups.35 Another limitation wasthat the study sample was limited toEnglish speakers and did not representthe part of the population that doesnot speak English. This may havecaused some selection bias andaffected the results, if the study sam-ple was not representative of the gen-eral population. The study also didnot collect data using travel diariesor global positioning system devicesfor multiple days, which would haveallowed characterization of travelspace and time.26,36 The limitedpopulation used in the study maycause some concern. A larger samplesize would have been preferred, butthe initial sample size had to bereduced to deal with missing data. Aminor limitation was that the foodenvironment data was collected in2009, and thus was a little older thanthe data collection on the studysample, which was completed in2010. A final limitation was thatparticipants of African American(n ¼ 222), Hispanic (n ¼ 2), andother race/ethnicity (n ¼ 10) werecombined into 1 category and race/ethnicity was coded as non-Hispanicwhite (n ¼ 451) vs other.
A person’s foodenvironment should betaken into account whendietary recommendationsare made.
A strength of the study is thatbecause the food access measureswere derived from ground-trutheddata, identification of the low andhigh access areas was substantiallymore valid than if it had relied on un-validated food outlet data.37 Finally,the study area contained both urbanand rural areas, and thus expandedgeneralizability beyond previousresearch that largely focused on urbanareas.
IMPLICATIONS FORRESEARCH ANDPRACTICE
The study's findings provide supportfor the need for current policies aimedat improving healthy food access forvulnerable populations, especiallythose living in disadvantaged lowaccess areas and relying on food assis-tance. Meaningful differences in dis-tance traveled to primary food storeand perceptions of access were foundbetween residents of low and highaccess areas. If the findings arereplicated with national data, policymakers may want to considerproviding food assistance recipientsin low access areas with additional re-sources to cover the higher expendi-tures incurred through farther travelto their main food store. Alterna-tively, consideration could be givento improving public transportationand developing more proximal retailopportunities. Finally, when healthcare providers make recommenda-tions regarding diet and lifestylechoices, they may want to considertheir patients' food environment.
ACKNOWLEDGMENTS
The data used for this analysis werecollected by a project supported bythe National Cancer Institute (GrantR21CA132133) and a grant from theRIDGE Center for Targeted Studies atthe Southern Rural Development Cen-ter at Mississippi State University. Thecontents of this article are solely the re-sponsibility of the authors and do notnecessarily represent the official viewsof the National Cancer Institute/National Institutes of Health or theRIDGE Center. The authors thankJames Hibbert for conducting all Arc-GIS analyses, and Timothy Barnesand Xiaoguang Ma for providing assis-tance with data management.
REFERENCES
1. Lake AA, Hyland RM, Mathers JC,Rugg-Gunn AJ, Wood CE,Adamson AJ. Food shopping andpreparation among the 30-somethings:whose job is it? (The ASH30 study).British Food Journal. 2006;108:475-486.
2. Flegal KM, Carroll MD, Ogden CL,Curtin LR. Prevalence and trends in
obesity among US adults, 1999-2008.JAMA. 2010;303:235-241.
3. Rodriguez G, Sjoberg A, Lissner L,Moreno LA. Food patterns and nutrientintake in relation to childhood obesity.In: Moreno LA, Pigeot I, Ahrens W,eds. Epidemiology of Obesity in Childrenand Adolescents. New York, NY:Springer; 2011:329-346.
4. Ahern M, Brown C, Dukas S. A na-tional study of the association betweenfood environments and county-levelhealth outcomes. J Rural Health. 2011;27:367-379.
5. Spence JC, Cutumisu N, Edwards J,Raine KD, Smoyer-Tomic K. Relationbetween local food environments andobesity among adults. BMC PublicHealth. 2009;9:192.
6. Power ML. The human obesityepidemic, the mismatch paradigm, andour modern ‘‘captive’’ environment.Am J Hum Biol. 2012;24:116-122.
7. Dutko P, Ver Ploeg M, Farrigan T.Characteristics and influential factorsof food deserts. http://www.ers.usda.gov/publications/err-economic-research-report/err140.aspx. Accessed October25, 2013.
8. USDA Food Access Research Atlas.US Department of Agriculture, Eco-nomic Research Service. http://www.ers.usda.gov/data-products/food-access-research-atlas/go-to-the-atlas.aspx. Ac-cessed March 22, 2013.
9. Ver Ploeg M, Breneman V, Dutko P,et al. Access to affordable and nutritiousfood: updated estimates of distance tosupermarkets using 2010 data. http://www.ers.usda.gov/publications/err-economic-research-report/err143.aspx.Accessed September 4, 2013.
10. State Indicator Report on Fruits andVegetables, 2013. Centers for DiseaseControl and Prevention. http://www.cdc.gov/nutrition/downloads/State-Indicator-Report-Fruits-Vegetables-2013.pdf. Accessed September 2, 2013.
11. State Indicator Report on Fruits andVegetables, 2009. Centers for DiseaseControl and Prevention. http://www.fruitsandveggiesmatter.gov/downloads/StateIndicatorReport2009.pdf. AccessedJanuary 23, 2014.
12. Ver Ploeg M, Breneman V, Farrigan T,Hamrick K, Hopkins D, Kaufman P.Access to affordable and nutritiousfood: measuring and understandingfood deserts and their consequences:report to Congress. 2009. http://www.ers.usda.gov/Publications/AP/AP036/.Accessed January 23, 2014.
Journal of Nutrition Education and Behavior � Volume -, Number -, 2014 Sohi et al 9
13. Gustafson AA, Sharkey J, Samuel-HodgeCD, et al. Perceived and objectivemeasures of the food store environmentand the association with weight and dietamong low-income women in NorthCarolina. Public Health Nutr. 2011;14:1032-1038.
14. Liese AD, Colabianchi N,Lamichhane A, et al. Validation of threefood outlet databases: completeness andgeospatial accuracy in tural and urbanfood environments. Am J Epidemiol.2010;172:1324-1333.
15. UnitedStatesCensus 2010.United StatesCensusBureau. http://www.census.gov/2010census. Accessed April 19, 2013.
16. Liese AD, Hibbert JD, Ma X, Bell BA,Battersby SE. Where are the food de-serts? A comparison of policy-relevantmeasures of community food environ-ment in South Carolina. J HungerEnviron Nutr. In press.
17. Powell LM, Han E, Zenk SN, et al.Field validation of secondary commer-cial data sources on the retail food outletenvironment in the U.S. Health Place.2011;17:1122-1131.
18. Standard definitions, final dispositionsof case codes and outcome rates forsurveys. American Association for Pub-lic Opinion Research. http://www.aapor.org/AM/Template.cfm?Section¼Standard_Definitions%20&Template¼/CM/ContentDisplay.cfm&ContentID¼1819. Accessed September 5, 2013.
19. North American Industry ClassificationSystem. US Census Bureau. http://www.census.gov/epcd/www/naics.html.Accessed September 5, 2013.
20. Ma X, Barnes TL, Freedman DA,Bell BA, Colabianchi N, Liese AD.Test-retest reliability of a questionnairemeasuring perceptions of neighbor-hood food environment. Health Place.2013;21:65-69.
21. Null hypothesis testing and effect sizes.Statistics for Psychology. http://staff.bath.ac.uk/pssiw/stats2/page2/page14/page14.html. Accessed June 15, 2013.
22. Jilcott SB, McGuirt JT, Carr LJ, Wu Q,Keyserling TC. Associations betweenbody mass index, shopping behaviors,amenity density, and characteristics ofthe neighborhood food environmentamong female adult SupplementalNutri-tion Assistance Program (SNAP) partici-pants in eastern North Carolina. Ecologyof Food and Nutrition. 2013;51:526-541.
23. Ohls JC, Ponza M, Moreno L, Zam-browski A, Cohen R. Food stampparticipants’ access to food retailers.United States Department of Agricul-ture. http://www.fns.usda.gov/sites/default/files/retailer.pdf. Accessed June15, 2013.
24. Moore LV, Diez Roux AV,Nettleton JA, Jacobs DR Jr. Associa-tions of the local food environmentwith diet quality—a comparison of as-sessments based on surveys andgeographic information systems: themulti-ethnic study of atherosclerosis.Am J Epidemiol. 2008;167:917-924.
25. Hirsch JA, Hillier A. Exploring the roleof the food environment on food shop-ping patterns in Philadelphia, PA,USA: a semiquantitative comparisonof two matched neighborhood groups.Int J Environ Res Public Health. 2013;10:295-313.
26. Gustafson A, Christian JW, Lewis S,Moore K, Jilcott S. Food venue choice,consumer food environment, but notfood venue availability within dailytravel patterns are associated with die-tary intake among adults, LexingtonKentucky 2011. Nutr J. 2013;12:17.
27. Hillier A, Cannuscio CC, Karpyn A,McLaughlin J, Chilton M, Glanz K.How far do low-income parents travelto shop for food? Empirical evidencefrom two urban neighborhoods. UrbanGeogr. 2011;32:712-729.
28. Drewnowski A, Aggarwal A,Hurvitz PM, Monsivais P,Moudon AV. Obesity and supermarketaccess: proximity or price? Am J PublicHealth. 2012;102:e74-e80.
29. Krukowski RA, West DS, Harvey-Berino J, ElainePrewittT.Neighborhoodimpact on healthy food availability andpricing in food stores. J Commun Health.2010;35:315-320.
30. Bawa K, Ghosh A. A model of house-hold grocery shopping behavior. Mar-keting Letters. 1999;10:149-160.
31. Moore LV, Diez Roux AV, Brines S.Comparing perception-based andgeographic information system (GIS)-based characterizations of the localfood environment. J Urban Health.2008;85:206-216.
32. Blitstein JL, Snider J, Evans WD.Perceptions of the food shoppingenvironment are associated withgreater consumption of fruits andvegetables. Public Health Nutr. 2012;15:1124-1129.
33. Liese AD, Barnes TL, Lamichhane AP,Hibbert JD, Colabianchi N,Lawson AB. Characterizing the foodretail environment: impact of count,type and geospatial error in two sec-ondary data sources. J Nutr Educ Behav.2013;45:435-442.
34. Dholakia RR, Pedersen B, Hikmet N.Married males and shopping: are theysleeping partners. International Journalof Retail and Distribution Management.1995;23:27-33.
35. Blumberg SJ, Luke JV. Wireless substi-tution: early release of estimates fromthe National Health Interview Survey,January–June 2009. Centers for DiseaseControl and Prevention. http://www.cdc.gov/nchs/data/nhis/earlyrelease/wireless200912.pdf. Accessed January 23, 2014.
36. Zenk SN, SchulzAJ,Matthews SA, et al.Activity space environment and dietaryand physical activity behaviors: a pilotstudy. Health Place. 2011;17:1150-1161.
37. McKinnon RA, Reedy J,Morrissette MA, Lytle LA,Yaroch AL. Measures of the food envi-ronment: a compilation of the litera-ture, 1990-2007. Am J Prev Med. 2009;36:124-133.