dietary whi dietary modification (dm) trial. dietary whi – dm trial leslie ford, md session...
TRANSCRIPT

Dietary
WHI
Dietary Modification (DM) Trial

Dietary
WHI – DM Trial
Leslie Ford, MDSession Moderator
Associate Director of Clinical ResearchDivision of Cancer Prevention, National Cancer InstituteNational Institutes of HealthRockville, Maryland

Carolyn CliffordCarolyn Clifford 1941-20011941-2001

Dietary
DM Trial Morning Session IThe Intervention
Background Hypothesis and Design The Dietary Change Program Personal Accounts of Dietary Change
Participants Audience Questions

Dietary
DM TrialBackground and Hypothesis
Background Maureen Henderson, OBE, MD, DPH
Hypothesis and Design Ross Prentice, PhD
Dietary
Dietary Modification Trial Background
Maureen Henderson, OBE, MD, DPHPast Principal InvestigatorSeattle Clinical Center
Emeritus Professor of Epidemiology and Medicine University of WashingtonSeattle, Washington

Dietary
Breast cancer incidence per 100,000 women
55-69 years of age
Breast Cancer Rates by Country
Cancer Incidence in Five Continents vol. V. WHO, IARC, 1987

Dietary
Feasibility & Safety of the Intervention
Feasibility Low-fat eating patterns can be achieved and maintained
by women of all ages, income, breast cancer risk levels, and racial and ethnic backgrounds
Safety No serious side effects during either two year study or
among a sample of study women 2 years later Eating 5+ servings of fruit and vegetables and 6+ servings
of grains were made into specific goals for the WHI instead of recommendations as in the two pilot studies.
Women’s Health Trial Vanguard 1984 and Women’s Health Trial: Feasibility in Minority Populations 1995

Dietary
Colorectal Cancer

Dietary
Coronary Heart Disease
WHI designed primarily for breast cancer
However, WHT pilot studies showed: A persistent reduction in:
Total fat intake
Saturated fat intake
Total blood cholesterol
No increase in polyunsaturated fats
For safety reasons no further changes in P/S ratio were proposed for the WHI

Women’s Health Trial Vanguard Pilot Study: Intervention Group
Measure Baseline Year 1 Year 2
Total fat, percent of calories
39.1% 21.6% 22.6%
Saturated fat, percent of calories
13.8% 7.0% 7.2%
Blood cholesterol 221 mg/dL207
md/dL 210
mg/dL
Prev Med. 1990; 19: 115-133Dietary

Dietary
Dietary Modification Trial Hypothesis and Design
Ross Prentice, PhDPrincipal InvestigatorClinical Coordinating Center
Member, Public Health Sciences Division Fred Hutchinson Cancer Research CenterSeattle, Washington

Dietary
Premise of the DM Trial
International comparisons, time trend and migrant studies, motivated the trial, and led to the basic trial hypothesis for a 20% versus a 40% energy from fat diet.
1
BreastCancerRelative
Risk
0 5 10
Years from Randomization

Dietary
Adherence Assumptions
Feasibility study data were used to specify an adherence assumption.
0
5
10
15
20
25
30
35
40
Base
line
Yr 1
Year
2Yr
3Yr
4Yr
5Yr
6Yr
7Yr
8Yr
9
Yr 1
0
Intervention
Comparison
13% 11%

Dietary
Breast Cancer IncidenceAge-Adjusted
Women of ages 45-69 1973-1977 versus per capita fat consumption 1975 -1977

Dietary
Dietary Fat & Postmenopausal Breast Cancer
Case-control Studies Howe et al (1990, JNCI) 1 1.20 1.24 1.24 1.46 (p<.0001)
Cohort StudiesHunter et al (1996, NEJM) 1 1.01 1.12 1.07 1.05 (p=0.21)
Ability to adequately characterize and adjust for measurement error?
Fat Consumption Quintile

Dietary
Underreporting of Energy and Protein
BMJ 1995; 311: 986-989. Lancet 2003; 362: 212-214

Dietary
DM Eligibility & Assumptions
Women having FFQ% energy from fat <32% were excluded.
National breast cancer incidence rates projected for control group.
Loss to follow-up and competing risk assumptions incorporated.
Assumptions combine to give a projected 14% lower breast cancer incidence in the intervention (I) versus the comparison (C) group

Dietary
Some Elements of Study Design
Target sample size 48,000 Excludes women with prior breast or colorectal cancer Age and ethnicity goals 40% Intervention; 60% Comparison Projected power
Invasive breast cancer 86% Colorectal cancer 90% Coronary heart disease 86%
Dietary intervention program based on NCI- sponsored feasibility studies

Dietary
DM TrialDietary Change Session
Dietary Change Program Deborah Bowen, PhD
Predictors of Change Lesley Tinker, PhD, RD

Dietary
The Dietary Change Program
Deborah J. Bowen, PhDCo-investigatorClinical Coordinating Center
Professor – University of Washington Member - Fred Hutchinson Cancer Research Center Seattle, Washington

Dietary
Dietary Change Goals:Intervention Group
Photos courtesy of USDA Agricultural Research Service
20% energy from fat
5 or more fruit and vegetable servings daily
6 or more grain servings daily

Dietary
Packaging the Strategies:Structure of the Intervention
18 group sessionsYear 1
Quarterly maintenance sessionsYear 2 and beyond
END OF DM TRIALBASELINE•Motivational Interviewing –3 personal contacts
•Targeted Messaging – Mailing
•Tailored Feedback: Personal Evaluation of Fat Intake – Group sessions
•Tailored Feedback: Personal Evaluation of Fat Intake–Mailing
•Clinical Center augmentations
CO
RE
AU
GM
EN
TA
TIO
NS

Dietary
Fats of Life – Fats in Foods
Higher fat meal = 49 fat grams
Fried chicken breast (3 oz)Potato salad (1/2 cup)Green beans and bacon (1/2 cup)Cornbread (3 by 3 1 inches)
Lower fat meal = 10 fat grams
Roast chicken breast no skin (3 oz)Brown rice (1/2 cup) Green beans (1/2 cup) with 1 tsp
seasoned oilWhole wheat roll, 1 medium

Dietary
Nutritional strategies
Fat identification
Food purchasing
Food preparation
Fat budgeting

Dietary
Behavioral strategies
Self-Management
Cognitive behavioral strategies
Social support and interaction
Relapse prevention
Self-determination and self-efficacy

Dietary
Adherence strategies
Regular contact
Record keeping
Reinforcement of progress
Dietary
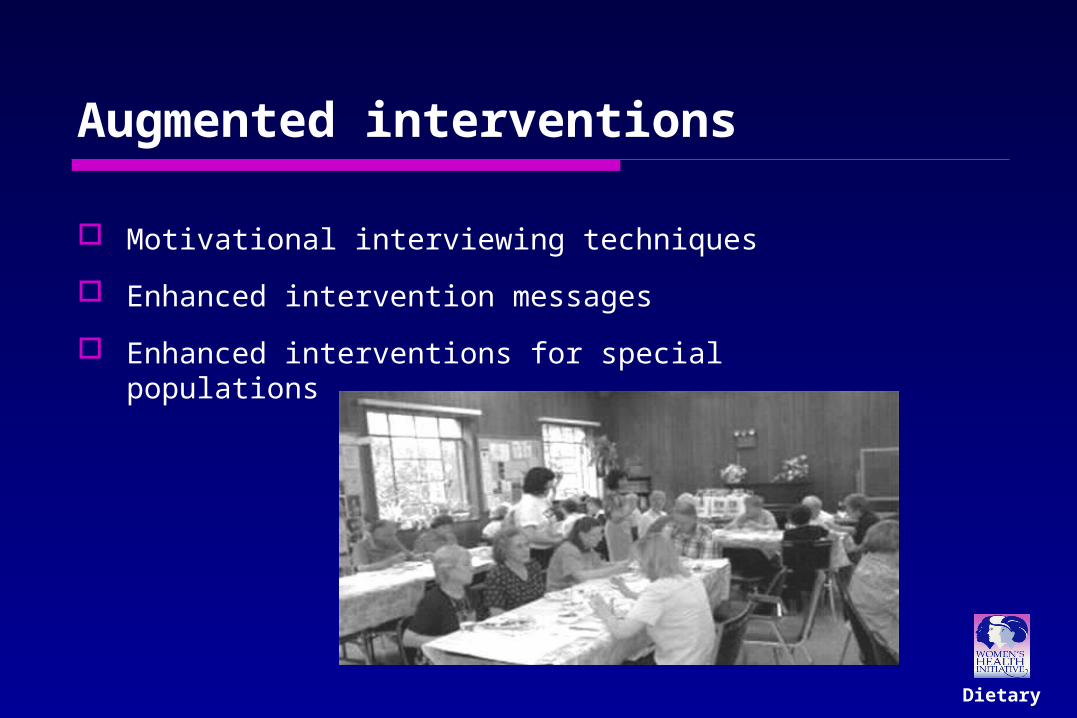
Augmented interventions
Motivational interviewing techniques
Enhanced intervention messages
Enhanced interventions for special populations

Dietary
Predictors of Dietary Change
Lesley Tinker, PhD, RDCo-investigatorClinical Coordinating Center
Nutrition Scientist Fred Hutchinson Cancer Research Center Seattle, Washington

Dietary
What Have We Learned?
More lowering of % calories from fat among: *** Women who attended more dietary sessions *** Women who self-monitored their food intake Women less than 65 years of age at baseline White women compared to African American women Women with BMI <35 White women compared to Hispanic women Women with household incomes above $20,000
annually Women also randomized to the HT Trial
J Am Diet Assoc. 2004; 104: 654-658
Yr1 Yr5

Dietary
Physical & Emotional Predictors of Dietary Change
Lower fat intake at Year 1
Higher emotional well-being
at baseline
Higher session attendance or self-monitoring during Year 1
J Am Diet Assoc. 2002; 102: 789-800
Some of the effect of emotional well-being on fat intake is mediated by session attendance and self-monitoring.

Changes in Grams of Fat from Foods
Intervention Group
Food Baseline Yr 1 - Base Yr 2 – Yr 1Added fats 16.1 -12.5 0.8
Meats 13.6 -6.7 0.5
Desserts 7.1 -6.1 0.4
Milk, cheese 5.7 -3.5 0.2
Mixed dishes 6.0 -2.3 0.1
High-fat breads, salty snacks 3.7 -2.6 0.2
J Am Diet Assoc. 2003; 103: 454-460
Dietary

Dietary
DM Trial Personal Accounts from Participants
Facilitators:Yasmin Mossavar-Rahmani, PhD (NYC)Linda Snetselaar, PhD, RD (Iowa)
Participants:Dolores Buckley (Worcester)Betty Cintas (Stanford) Sylvia Grendisa (Buffalo) Olga Lamarche (Seattle)Marcia Mazur (George Washington University)

Dietary
Audience Questions
Leslie Ford, MD
Associate Director of Clinical ResearchDivision of Cancer Prevention, National Cancer InstituteNational Institutes of HealthRockville, Maryland

Dietary
DM Trial – The Results
Overview and Baseline DemographicsNorman Lasser, MD, PhD
Dietary AssessmentCynthia Thomson, PhD, RD
Dietary Change and BiomarkersBette Caan, DrPH

Dietary
DM Trial – The Results
Breast Cancer Ross Prentice, PhD
Colorectal Cancer Shirley Beresford, PhD
Heart Disease and StrokeLinda Van Horn, PhD, RD
Summary and Dietary ImplicationsPeter Greenwald, MD, DrPH
Audience QuestionsLeslie Ford, MD (Moderator)

Dietary
Recruitment, Retention, and Baseline Demographics
Norman Lasser, MD, PhDPrincipal InvestigatorNewark Clinical Center
Professor of MedicineUniversity of Medicine and Dentistry of New Jersey, New Jersey Medical School Newark, New Jersey

WHI DM Trial
Dietary
373,092 completed the eligibility
screening form
56,139 eligible
48,835 randomized
Intervention 19,541
Comparison 29,294
Status 3/31/05
17,674 alive & retained
1,867 lost, deceased, or withdrew
Status 3/31/0526,677 alive & retained
2,667 lost, deceased, or withdrew
316,953 excluded (refused, low fat intake,
info not avail)
7,304 excluded (staff/participant
reevaluation, history of breast cancer, other)
19,541 included in analysis 29,294 included in analysis

Dietary
WHI DM Trial: Race and Ethnicity

Dietary
WHI DM Trial: Age at Baseline
Average age 62.3 years

Dietary
Baseline Physical Characteristics
Waist circumference 89 cm
Physical activity10 METS
Smoking93% never or past7% current
Alcohol28% never or past72% current
Calories1790

Dietary
Overlap with WHI Hormone or Calcium Vitamin D Trials
Hormone Trials
p=0.05
Calcium plus D Trial
p<0.001

Dietary
GeneralizabilityBaseline characteristics DM and OS

Dietary
Dietary Assessment
Cynthia Thomson, PhD, RDCo-Principal InvestigatorTucson/Phoenix Clinical Center University of ArizonaTucson, Arizona

Dietary
How Was Diet Measured?
Food FrequencyQuestionnaire
All
Food FrequencyQuestionnaire
All
Food FrequencyQuestionnaireRotating 1/3
of participants
Study Start Year 1 Year 2Close-out
4-day food recordsCase only analysis
4-day food records4.6% of participants
Repeat (x2)24 hr Recalls4.6% of participants
Assess change in intake over time
Calibrate with other
diet measures
Year 3,6,9Assess
intervention effects
24 hour recalls1% of participants

Dietary
WHI Food Frequency Questionnaire

Dietary
Advantages and Disadvantages
Food Frequency• Long term eating
•Low participant burden•Administer by mail
•Cost-effective
•Limited foods•Less detail
•Ability to recall•Report bias
Recalls•Short-term eating
•More detail•Less report bias
•Participant burden•Ability to make contact
•Ability to recall•More costly
Records•Short term eating
•More detail
•Participant burden•Completeness
•Behavior change•More costly

Dietary
Dealing with Uncertainty
Multiple measures of self-report Biomarkers
Double-labeled water – caloric intake Urinary nitrogen – protein Plasma carotenoids – fruit and vegetable intake
Composite of self-report and biomarkers WHI DM Nutritional Biomarkers Study
Assess factors that influence the accuracy of self-report Develop mathematical formulae for improving self-
report of caloric intake

Dietary
Dietary Changes & Biomarkers
Bette Caan, DrPHPrincipal InvestigatorOakland Clinical Center
Senior Research Scientist Division of Research, Kaiser Permanente Medical Program Oakland, California

Dietary
Dietary Intake: Percent Calories from Fat
Howard BV et al. JAMA Feb 2006
37
28.8
35 35.1
24.3
0
5
10
15
20
25
30
35
40
Baseline Yr 1 Year 2 Yr 3 Yr 4 Yr 5 Yrs 5, 6,7
ControlIntervention
C-I, actual = 10.7
C-I, design = 13
C-I, actual = 8.2
C-I, design = 11

Dietary
Dietary Changes in the Intervention Group: Types of Fat
JAMA 2006; 295; 655-666

Dietary
Dietary Intake: Fruits and Vegetables
3.8
4.9
3.6
3.9
5.1
0
2
4
6
Basel
ine
Yr 1
Year 2
Yr 3 Yr 4 Yr 5
Yrs 5
, 6, 7
Serv
ings p
er
day
Control
Intervention
JAMA 2006; 295; 655-666

Dietary
Dietary Intake: Grains & Whole Grains
JAMA 2006; 295; 655-666

Dietary
Nutrient Intakes & Blood Biomarkers
BaselineBaseline-Year 3, Inter-Cont
Daily Nutrient Intakes
Folate (dietary), μg 259 + 62 (+24.5%**)
Fiber, g 15.4 + 3.1* (+20.0%)
Red meats, servings 0.9 - 0.2 (-22.0% **)
Biomarkers in Blood
Total cholesterol, mg/dL 224 - 3.3 *
LDL-cholesterol, mg/dL 133 - 3.6 *
HDL-cholesterol, mg/dL 60.1 - 0.4
Total carotenoids, μg/dL 0.88 + 0.04 (+ 5% )
Gamma tocopherol, μg/dL 2.3 - 0.21 *
JAMA 2006; 295; 629-642; JAMA 2006; 295; 642-654;
JAMA 2006; 295; 655-666
* p<.05
** p<.001 Dietary

Dietary
0 1‡ 2‡ 3‡ 4‡ 5‡ 6‡ 7‡ 8‡ 9†-4
-3
-2
-1
0
1
2
3
4
Mea
n D
iffe
renc
e (k
g)
Years of Intervention
InterventionControl
Changes in Body Weight
JAMA 2006; 295; 39-49

Dietary
Breast Cancer
Ross Prentice, PhDPrincipal InvestigatorClinical Coordinating Center
Member, Public Health Sciences Division Fred Hutchinson Cancer Research CenterSeattle, Washington

Risk of Breast Cancer and Other Major Clinical Outcomes
JAMA 2006; 295; 629-642 Dietary
Dietary
Invasive Breast Cancer
Cu
mu
lative
Ha
za
rd
0 1 2 3 4 5 6 7 8 9
Time (y ears)
0.0
00
.01
0.0
20
.03
0.0
4
ComparisonIntervention
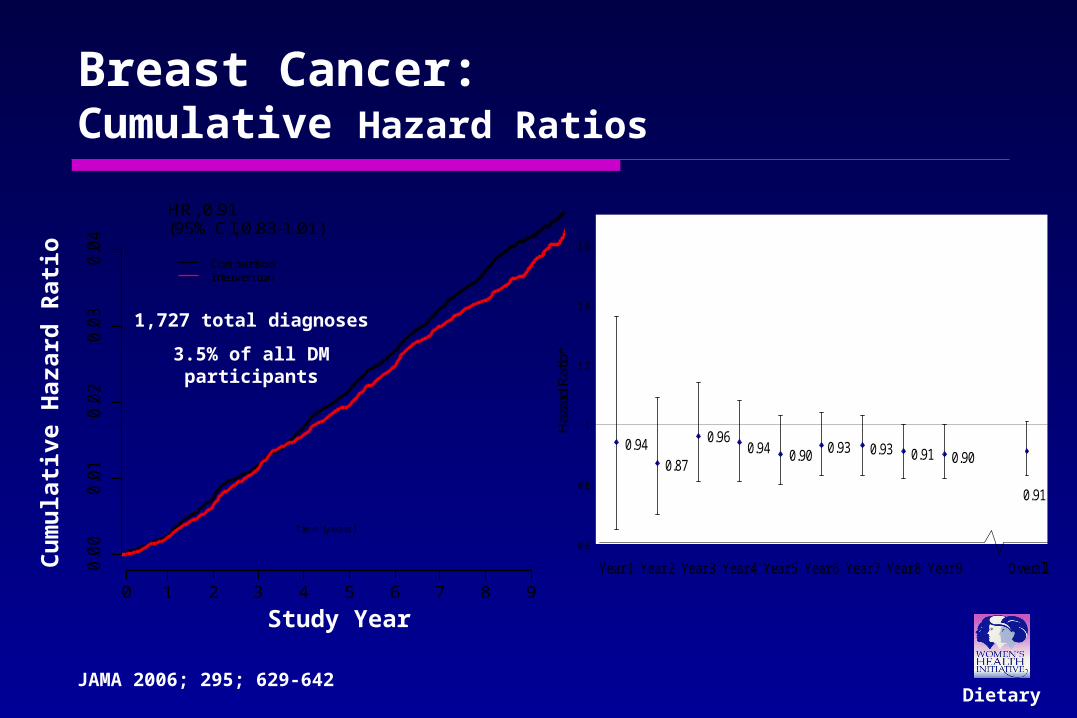
HR, 0.91(95% CI, 0.83-1.01)
Events
Intervention 47 79 92 80 72 94 89 46 33
Comparison 74 140 123 137 136 137 145 97 58
Number at Risk
Intervention 19541 19328 19084 18798 18520 18263 17900 15507 10245 5075
Comparison 29294 28908 28536 28195 27806 27372 26977 23337 15373 7580
0.940.87
0.960.94 0.90 0.93 0.93 0.91 0.90
0.91
0.6
0.8
1
1.2
1.4
1.6
OverallYear 9Year 8Year 7Year 6Year 5Year 4Year 3Year 2Year 1Ha
zard
Rat
io*
*Hazard ratio at a particular year based on cumulative data from randomization through that year
Breast Cancer: Cumulative Hazard Ratios
1,727 total diagnoses
3.5% of all DM participants
Study Year
Cu
mu
lati
ve H
aza
rd R
ati
o
JAMA 2006; 295; 629-642

Dietary
Blood Hormone ConcentrationsFigure 3. Change* from Baseline to Year 1 in the Intervention Compared to the Comparison Group for Blood Hormone Concentrations Adjusted for Baseline
Differences
0.85
0.98
0.96
0.99
1.09
0.6 0.7 0.8 0.9 1 1.1 1.2 1.3 1.4 1.5 1.6
Estradiol
Estrone
Estrone-sulfate
Testosterone
Sex Hormone Binding Globulin
*Logarithm of change based on intervention minus control group average difference between year one and baseline log-biomarker values
Relative Change from Baseline
Reduced Increased
Estrone
Estrone-sulfate
Testosterone
Sex hormone binding globulin
Estradiol
JAMA 2006; 295; 629-642

Hazard Ratios by Dietary Factors
DietaryJAMA 2006; 295; 629-642
Dietary
Interpretation
Intensive intervention resulted in significant and sustained dietary fat reduction and vegetable and fruit increase.
Observed 9% lower breast cancer rate (15% among “adherent women”) may be attributable to chance.
JAMA 2006; 295; 629-642

Dietary
Interpretation (continued)
Longer follow-up needed for a more definitive evaluation of low-fat eating pattern and breast cancer hypothesis: Power reduced by 8.1 rather than 9 years of
average follow-up and by less than targeted adherence.
Greater evidence of breast cancer reduction among women having higher baseline % energy from fat.
JAMA 2006; 295; 629-642

Dietary
Colorectal Cancer
Shirley A.A. Beresford, PhDPrincipal InvestigatorSeattle Clinical Center
Professor, Epidemiology – University of WashingtonMember - Fred Hutchinson Cancer Research Center Seattle, Washington

Dietary
Colorectal Cancer
Objective:
To evaluate the effects
of a low-fat dietary pattern
on risk of colorectal cancer
in postmenopausal women
JAMA 2006; 295; 642-654

Dietary
Colorectal Cancer:Cumulative Hazard Ratios
480 total diagnoses
(1% of all DM participants)
JAMA 2006; 295; 642-654

Dietary
Colorectal Cancer:Annualized Rates and Hazard Ratios
0
2
4
6
8
10
12
14
Case
s p
er
year
per
10
,00
0 w
om
en
Total Proximal Distal Rectal
I ntervention
Comparison
(0.90, 1.28)
(0.96, 1.61)
(0.56, 1.19) (0.77, 1.61)
HR=1.08
HR=1.25
HR=1.11HR=0.86
JAMA 2006; 295; 642-654

Dietary
Bowel Examinations: Polyps/Adenomas
Rectal Exam
Hemoccult guaiac
Sigmoidoscopy/flex. sig/colonoscopy
Barium enema x-ray
HR, 0.9195% CI, 0.87-0.95
JAMA 2006; 295; 642-654
Int Cmp

Colorectal Cancer Hazard Ratios by Baseline Participant Characteristics
Age at enrollment
50-59 yr60-69 yr 0.1870-79 yr
Aspirin use No< 325 mg 0.01> 325 mg
Baseline current E-alone user or randomized to E-alone active arm
YesNo
Baseline current E+P user or randomized to E+P active arm
YesNo
P Value
0.92
0.010.62
1.19
1.08
0.540.90
1.10
1.24
1.001.44
0.87
0.1 1.0 10.0Hazard Ratio (------95% CI ------)
Favors Intervention Favors ComparisonJAMA 2006; 295; 642-654
Dietary

Colorectal Hazard Ratios by Baseline Dietary Factors
Dietary energy (kilocalories)<1391.81391.8 – <1663.61663.6 – <1958.71958.7 +
Dietary percent energy from fat<27.927.9 – 32.332.3 – 36.836.8 +
Alcohol intakeNever DrinkerPast Drinker < 1 drink per day 1+ drink per day
0.09
P Value
0.29
0.61
2.000.92
1.00
1.16
0.99
1.22
1.07
1.01
0.73
1.17
1.37
1.07
0.1 1.0 10.0Hazard Ratio (------95% CI ------)
Favors Intervention Favors ComparisonJAMA 2006; 295; 642-654
Dietary

Dietary
Colorectal Cancer - Conclusions
The low fat dietary pattern intervention did not reduce the risk of colorectal cancer over 8.1 years
Reduction in polyps and adenomas associated with the intervention suggest longer follow-up is needed before long term effects can be ruled out.
JAMA 2006; 295; 642-654

Dietary
Cardiovascular Disease(Heart Disease and Stroke)
Linda Van Horn, PhD, RDPrincipal InvestigatorChicago Northwestern Clinical Center
Professor, Northwestern University Feinberg School of Medicine Chicago, Illinois

Dietary
Definitions
Coronary heart disease (CHD): Heart attack, heart bypass surgery, stent, or angioplasty
Stroke:Lack of blood flow to the brain or bleeding in the brain leading to weakness or paralysis, and impairment of speech or other functions
JAMA 2006; 295; 655-666
Dietary
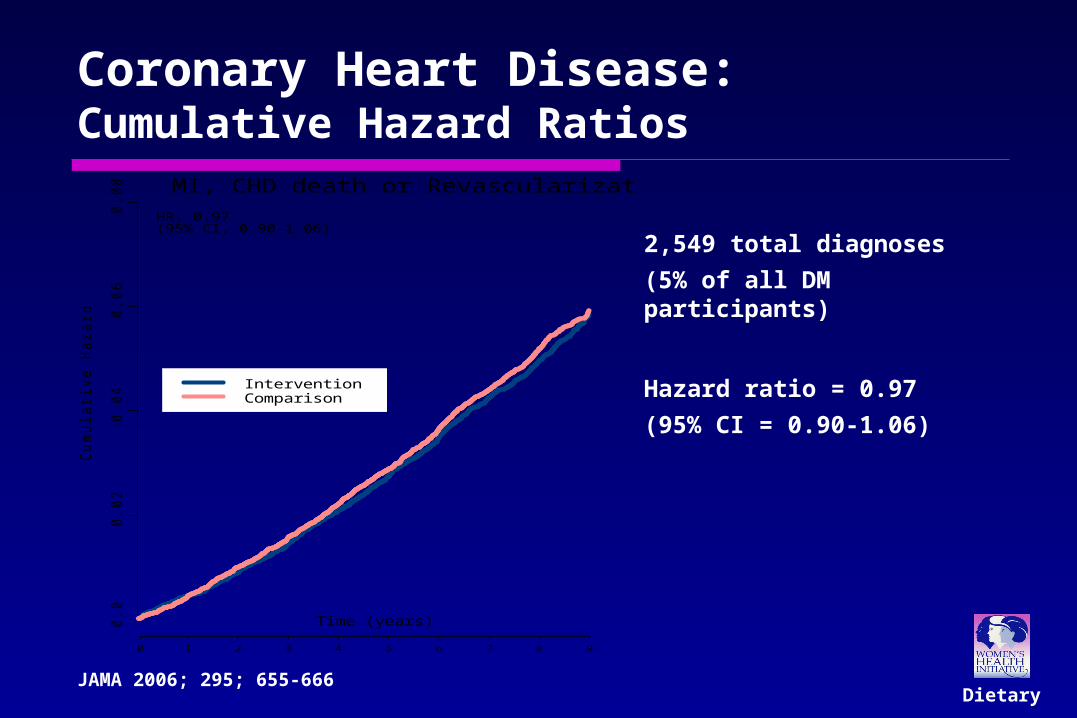
Coronary Heart Disease:Cumulative Hazard Ratios
Cu
mu
lative
Ha
za
rd
MI, CHD death or Revascularization
0.0
0.0
20
.04
0.0
60
.08
0 1 2 3 4 5 6 7 8 9
Time (years)
InterventionComparison
EventsIntervention 87 86 106 121 123 140 136 95 71Comparison 129 162 161 184 188 213 206 161 91
Number at RiskIntervention 19541 19299 19063 18776 18477 18189 17811 15429 10156 5014Comparison 29294 28864 28484 28121 27712 27251 26813 23173 15283 7523
HR, 0.97 (95% CI, 0.90-1.06)
2,549 total diagnoses
(5% of all DM participants)
Hazard ratio = 0.97
(95% CI = 0.90-1.06)
JAMA 2006; 295; 655-666

Dietary
Stroke:Cumulative Hazard Ratios
1,076 total diagnoses
(2% of all DM participants)
Hazard Ratio = 1.02
(95% CI = 0.90-1.15)
Cu
mu
lative
Ha
za
rd
Stroke
0.0
0.0
20
.04
0.0
60
.08
0 1 2 3 4 5 6 7 8 9
Time (years)
InterventionComparison
EventsIntervention 29 54 48 52 47 60 57 44 28Comparison 54 54 72 82 70 82 88 70 40
Number at RiskIntervention 19541 19348 19132 18900 18662 18438 18122 15744 10397 5159Comparison 29294 28936 28657 28376 28057 27704 27376 23734 15665 7743
HR, 1.02 (95% CI, 0.90-1.15)
JAMA 2006; 295; 655-666

Changes in Risk FactorsRisk factor Baseline Difference at
year 3 (I-C)LDL-cholesterol,
mg/dL 133 - 3.6 *
Diastolic blood pressure, mm Hg 76 - 0.3 **
Factor VIIC, % 131 - 4.9 **
Triglycerides, mg/dL` 139 0
HDL-cholesterol, mg/dL 60 - 0.4
Glucose, mg/dL 100 - 1.1
Insulin, µIU/mL 10 0
* p<.05; ** p<.001
IMP
RO
VED
NO
CH
AN
GE
DietaryJAMA 2006; 295; 655-666

Changes in Types of Fat
Type of fat Baseline Difference: Yr 1 (I-C)
Difference: Yr 6 (I-C)
Saturated fat, % calories 12.7 - 3.7 * - 2.9 *
Trans fat, % calories 2.7 - 0.8 * - 0.6 *
Polyunsaturated fat, % calories 7.8 - 2.0 * - 1.5 *
P/S ratio 0.6 0 0
* p<.001
DietaryJAMA 2006; 295; 655-666

Dietary
0 0.2 0.4 0.6 0.8 1 1.2
Fruit/ vegetable≥6.5 servings
Trans fat <1.1 % calories
Saturated fat <6.1% calories
Decreased Risk
Intake at Year 1
Additional Analyses:
Heart Disease Risk
JAMA 2006; 295; 655-666

Dietary
Cardiovascular Disease: Conclusions
Postmenopausal women who initiated a low fat dietary pattern had no significant reductions in coronary heart disease, stroke, or cardiovascular disease (CVD) after 8.1 years.
Some CVD risk factors were modestly improved, especially among women with greater adherence to dietary recommendations.
Interventions on specific dietary factors known to influence risk of CVD and potentially initiated younger in life may be needed to improve risk factors and CVD risk.
JAMA 2006; 295; 655-666

Women’s Health InitiativeWomen’s Health InitiativeThe Dietary Modification ResultsThe Dietary Modification ResultsSummary & Dietary ImplicationsSummary & Dietary Implications
Peter Greenwald MD, DrPHPeter Greenwald MD, DrPH
Division of Cancer PreventionDivision of Cancer Prevention
National Cancer Institute, NIHNational Cancer Institute, NIH
February 28, 2006February 28, 2006

Women’s Health Initiative
Dietary Fat & Breast Cancer
Studied Did Not Study
Eating Fat Being Fat
% Calories from Fat Grams of Fat
Total Fat Type of Fat
Post-menopausal Pre-menopausal
Exercise
Breast Cancer Risk Breast Cancer Prognosis
80

Women’s Health Initiative
Fabulous study, BUT some limitations
1. Reductionist thinking hinders dietary research
2. Public message may ↓ reporting of fat intake
3. Lack of lab measures to validate intake
4. Carcinogenesis takes many years
81

The Causes of Cancer – Richard Doll & Richard Peto, 1981
DietDiet35%35%
OtherOtherFactorsFactors
35%35%
TobaccoTobacco30%30%

What is the Right Message?
Reduce consumption of fat (especially saturated fat) and cholesterol
Consume nutritionally adequate and varied diets, based primarily on foods of plant origin
Choose a diet Choose a diet low in fat, low in fat,
saturated fat, saturated fat, and cholesteroland cholesterol

One Size Doesn’t Fit AllSteps to Healthier You
• Make smart choices from every food group• Find your balance between food and physical activity• Get the most nutrition out of your calories
USDA 2005

Nutrigenomics & BeyondMapping Individual Health
DIET &DIET &– Gene polymorphismsGene polymorphisms
– Nutritional EpigenomicsNutritional Epigenomics
– TranscriptomicsTranscriptomics
– ProteomicsProteomics
– MetabolomicsMetabolomics

Women’s Health Initiative
Future Needs
1. ↑ Basic Nutritional Science
…omics ↔ …ologies
2. Truly Validated Markers of Dietary Intake, Effect (Molecular Targets) & Susceptibility
At various times of life
3. ↑ Research on Bioactive Food Compounds
4. ↑ Research & Development of Engineered Foods
5. ↑ Dietary Intervention Trials
6. ↑ Robust Nutritional Science at NIH
Intramural & Extramural
7. Long-term Follow-up of WHI Participants
86

Nutrition “is the ultimate biochemical interaction – the human organism reacting with the environment, daily, in a very intimate sense. And it’s been starved for research funding.”
Bernadine Healy, 2004

Dietary
Audience Questions
Leslie Ford, MD
Associate Director of Clinical ResearchDivision of Cancer Prevention, National Cancer InstituteNational Institutes of HealthRockville, Maryland