diet of the australian sea lion (neophoca cinerea): an ... · diet of the australian sea lion...
TRANSCRIPT

Diet of the Australian sea lion (Neophoca cinerea): an
assessment of novel DNA-based and contemporary methods to
determine prey consumption
Kristian John Peters
BSc (hons), LaTrobe University, Victoria
Submitted in fulfilment of the requirements for the degree of
Doctor of Philosophy
University of Adelaide (October, 2016)

2

3
DECLARATION OF ORIGINALITY
I certify that this work contains no material which has been accepted for the award of any
other degree or diploma in my name, in any university or other tertiary institution and, to the
best of my knowledge and belief, contains no material previously published or written by
another person, except where due reference has been made in the text. In addition, I certify
that no part of this work will, in the future, be used in a submission in my name, for any other
degree or diploma in any university or other tertiary institution without the prior approval of
the University of Adelaide and where applicable, any partner institution responsible for the
joint-award of this degree.
I give consent to this copy of my thesis when deposited in the University Library, being made
available for loan and photocopying, subject to the provisions of the Copyright Act 1968.
I acknowledge that copyright of published works contained within this thesis resides with the
copyright holder(s) of those works.
I also give permission for the digital version of my thesis to be made available on the web, via
the University’s digital research repository, the Library Search and also through web search
engines, unless permission has been granted by the University to restrict access for a period of
time.
Signed: Kristian John Peters
Date: 28 October 2016

4

5
TABLE OF CONTENTS
DECLARATION OF ORIGINALITY .................................................................................. 3
LIST OF FIGURES ............................................................................................................ 10
LIST OF TABLES .............................................................................................................. 14
THESIS ABSTRACT ......................................................................................................... 18
ACKNOWLEDGMENTS ................................................................................................... 20
LIST OF PUBLICATIONS ................................................................................................. 23
CHAPTER 1 ...................................................................................................................... 25
General Introduction ........................................................................................................ 25
INTRODUCTION ........................................................................................................... 26
THESIS ORGANISATION AND STRUCTURE ............................................................ 39
REFERENCES ................................................................................................................ 43
CHAPTER 2 ...................................................................................................................... 63
Diet of the endangered Australian sea lion (Neophoca cinerea) in South Australia. ...... 63
ABSTRACT .................................................................................................................... 64
STATEMENT OF AUTHORSHIP .................................................................................. 65
INTRODUCTION ........................................................................................................... 67
MATERIALS AND METHODS ..................................................................................... 70
Sample collection ......................................................................................................... 70
Hard part analysis ........................................................................................................ 72

6
Data analysis ................................................................................................................ 74
RESULTS ....................................................................................................................... 75
Prey hard-parts ............................................................................................................. 75
Diet diversity ............................................................................................................... 76
Fish and crustaceans..................................................................................................... 77
Cephalopods ................................................................................................................ 80
DISCUSSION ................................................................................................................. 86
Insights into habitat use ................................................................................................ 89
Potential overlap with fisheries .................................................................................... 91
Conclusions and future directions ................................................................................. 92
Acknowledgements ...................................................................................................... 92
REFERENCES ................................................................................................................ 93
CHAPTER 3 .................................................................................................................... 107
PCR-based techniques to determine diet of the endangered Australian sea lion
(Neophoca cinerea): a comparison with morphological analysis ................................... 107
ABSTRACT .................................................................................................................. 108
STATEMENT OF AUTHORSHIP ................................................................................ 109
INTRODUCTION ......................................................................................................... 111
MATERIALS AND METHODS ................................................................................... 114
Trial animals .............................................................................................................. 114
Daily Feeding and experimental diet .......................................................................... 114
Male and female diets ................................................................................................ 115
Faecal collection and preparation ............................................................................... 116
DNA preparation and extraction ................................................................................. 116
Morphological analysis preparation ............................................................................ 116
Primer design ............................................................................................................. 117
Conventional PCR ..................................................................................................... 118
Sequencing ................................................................................................................ 119
Real-time quantitative PCR (qPCR) ........................................................................... 119
Data analysis .............................................................................................................. 120
RESULTS ..................................................................................................................... 120

7
Sample collection ....................................................................................................... 120
Prey hard-parts ........................................................................................................... 121
PCR optimisation ....................................................................................................... 121
Prey detection by PCR and comparison to hard parts .................................................. 123
Comparison of prey detection between PCR techniques ............................................. 123
qPCR prey comparisons ............................................................................................. 124
DISCUSSION ............................................................................................................... 127
Hard part analysis ...................................................................................................... 128
Limitations of DNA-based study ................................................................................ 130
PCR techniques .......................................................................................................... 130
Conclusion and future directions ................................................................................ 133
ACKNOWLEDGEMENTS ........................................................................................... 134
REFERENCES .............................................................................................................. 135
CHAPTER 4 .................................................................................................................... 143
Fine-scale diet of the Australian sea lion (Neophoca cinerea) using DNA-based analysis
of faeces ........................................................................................................................... 143
ABSTRACT .................................................................................................................. 144
STATEMENT OF AUTHORSHIP ................................................................................ 145
INTRODUCTION ......................................................................................................... 147
MATERIALS AND METHODS ................................................................................... 149
Sample collection ....................................................................................................... 149
Molecular analysis ..................................................................................................... 150
16S Fish primer set .................................................................................................... 151
16S Cephalopod primer set ........................................................................................ 156
PCR reactions ............................................................................................................ 156
Clone sequencing ....................................................................................................... 157
Sequence screening .................................................................................................... 157
Data analysis .............................................................................................................. 158
RESULTS ..................................................................................................................... 160
Prey hard-parts ........................................................................................................... 160

8
Clone library overview ............................................................................................... 161
Inter-colony and individual diet comparisons ............................................................. 161
16S Fish primer set .................................................................................................... 161
16S Cephalopod primer set ........................................................................................ 164
Dietary comparison between sites .............................................................................. 165
Comparisons between individual and pooled DNA data sets ...................................... 166
Assessment of prey diversity from individual and pooled datasets .............................. 167
Effectiveness of sample size (number of individuals) and prey diversity .................... 168
DISCUSSION ............................................................................................................... 172
Limitations ................................................................................................................. 173
Prey diversity ............................................................................................................. 174
Pooled and individual clone library datasets ............................................................... 177
Ecological implications .............................................................................................. 178
Conclusions and future directions ............................................................................... 179
ACKNOWLEDGEMENTS ........................................................................................... 180
REFERENCES .............................................................................................................. 181
CHAPTER 5 .................................................................................................................... 193
Insights into seasonal prey use of the Australian sea lion (Neophoca cinerea) using faecal
DNA and high-throughput sequencing........................................................................... 193
ABSTRACT .................................................................................................................. 194
STATEMENT OF AUTHORSHIP ................................................................................ 195
INTRODUCTION ......................................................................................................... 197
MATERIALS AND METHODS ................................................................................... 200
Sample collection ....................................................................................................... 200
Hard part analysis ...................................................................................................... 201
DNA extraction .......................................................................................................... 202
Primer sets ................................................................................................................. 202
Primer adjustments for GS-FLX sequencing .............................................................. 204
PCR reactions ............................................................................................................ 204
Roche GS-FLX sequencing and analysis .................................................................... 205
Data analysis .............................................................................................................. 206

9
Assessment of sampling effort ................................................................................... 207
RESULTS ..................................................................................................................... 208
Prey hard parts ........................................................................................................... 208
DNA analysis overview ............................................................................................. 208
Fish primer set and prey composition ......................................................................... 209
Cephalopod primer set and prey composition ............................................................. 216
Seasonal and yearly comparisons ............................................................................... 216
DISCUSSION ............................................................................................................... 221
Study limitations ........................................................................................................ 222
DNA analysis ............................................................................................................. 224
Prey diversity at Seal Bay .......................................................................................... 224
Conclusion and future directions ................................................................................ 228
ACKNOWLEDGEMENTS ........................................................................................... 229
REFERENCES .............................................................................................................. 229
CHAPTER 6 .................................................................................................................... 247
General Discussion and Future Directions ..................................................................... 247
GENERAL DISCUSSION ............................................................................................ 248
FUTURE STUDIES OF ASL DIET .............................................................................. 256
REFERENCES .............................................................................................................. 258

10
LIST OF FIGURES
CHAPTER 1
Figure 1. The distribution of ASL breeding colonies in Western Australia ▲ (A, B) and
South Australia ○ (C-F). ...................................................................................................... 29
CHAPTER 2
Figure 1. Location of ASL breeding colonies where faecal (n = 345) and regurgitate (n = 8)
samples were collected in South Australia.. ......................................................................... 71
Figure 2. Box plots indicating size ranges of estimated mantle length (mm) and mass (g) of
cephalopods based on regression equations from key families detected in this study
(Ommastrephidae, Loliginidae, Octopodidae and Sepiidae). ................................................ 83
Figure 3. Mantle length (mm) and mass (g) (mean ± SD) of cephalopods (Octopodidae,
Loliginidae, Sepiidae and Ommastrephidae) based on data from the minimum number of
individuals recovered from faeces (n = 345) and regurgitates (n = 8) collected at nine
breeding colonies of ASL in South Australia between 2003 and 2007.. ............................... 84
Figure 4. Mass (mean ± SD) of cephalopods consumed by ASL by taxonomic family
estimated in the current study and from regurgitates and stomachs derived by McIntosh et al.
(2006) from the Seal Bay colony. ........................................................................................ 85
Figure 5 (supplementary). Box plots indicating size ranges estimated from mass (g)
regression equations of key cephalopod families detected in this study (Ommastrephidae,
Loliginidae, Octopodidae and Sepiidae).. ............................................................................ 86

11
CHAPTER 3
Figure 1. Striped perch, squid and shark qPCR estimates from faeces collected from the
male. Quantitative estimates were compared for faeces collected during the dietary
proportions fed (60%, 50%, 30% and 10%). ...................................................................... 126
Figure 2. Comparison of striped perch qPCR estimates from faeces collected from the male
and female Australian sea lion when daily dietary proportions contained 50% (3 kg) striped
perch. ................................................................................................................................ 127
CHAPTER 4
Figure 1. Study sites of two Australian sea lion colonies Lilliput Island and Kangaroo
Island.. .............................................................................................................................. 152
Figure 2. Outline of experimental procedure used to generate prey sequence data from
Australian sea lion faeces collected from Kangaroo and Lilliput Island, South Australia. .. 153
Figure 3. Hierarchical similarity cluster analysis of fish and cephalopod prey sequences
obtained from Australian sea lions at Kangaroo Island (KI ▼) and Lilliput Island (LI ○). . 166
Figure 4. Asymptotic curves of prey sequence diversity obtained for fish (○) and
cephalopods (●) from individual clone libraries.. ............................................................... 169
Figure 5. Asymptotic curves of prey sequence diversity obtained for fish (○) and
cephalopods (●) from individual clone libraries for Lilliput Island (LI). ............................ 170

12
Figure 6. Asymptotic curves of fish prey sequence diversity obtained for combined (pooled)
DNA from 6 individuals at KI (o) and LI (▲).. ................................................................. 171
Figure 7. The relationship between the number of prey taxa identified from cloning PCR
products and the number of individuals sampled. .............................................................. 172
CHAPTER 5
Figure 1. Location of study site, Seal Bay on Kangaroo Island. Local benthic habitat is
indicated low profile reef (dark grey) and sea grass meadow with unvegetated soft bottom
(light grey) (Edyvane et al. 1999; Bryars, 2003).. .............................................................. 202
Figure 2. Asymptotic curves of prey sequence diversity obtained using next-generation
sequencing for fishes (top left) and cephalopods (bottom right) from ASL faecal DNA.
Asymptotes were calculated as a function of (A) total number of sequences and (B) the
number of seasons sampled... ............................................................................................ 212
Figure 3. Number of taxa (upper) and Shannon diversity index (lower) of fish and
cephalopod prey identified from DNA sequences and hard parts recovered from ASL faeces
collected across seasons at Seal Bay, Kangaroo Island between 2005 and 2007. Error bars are
95% confidence intervals. ................................................................................................. 219
Figure 4. Cumulative percent (%) of bony fish and cartilaginous fish prey sequences by
taxonomic order for each season, and for the total number of sequences recovered (combined
seasons). Data were standardised within seasons and across seasons and years.. ................ 220

13
Figure 5. Cumulative percent (%) of cephalopod prey sequences by taxonomic order for each
season, and for the total number of sequences recovered (combined seasons).. .................. 221

14
LIST OF TABLES
CHAPTER 1
Table 1. ASL prey from colonies in South Australia (SA) and Western Australia (WA).
Colony names and areas are: Seal Bay (SB) (Kangaroo Island), Yorke Peninsula (YP), Lewis
Island (LE) (Eyre Peninsula), Dangerous Reef (DR) (Spencer Gulf), Lilliput Island (LI) (N
Nuyts Archipelago) (see Fig. 1). Sample types are regurgitate (R), stomachs from dead ASL
(S), faeces (F) and videos attached to ASL (V). ................................................................... 32
CHAPTER 2
Table 1. The distribution of sampling effort, frequency of occurence (FO) and numerical
abundance (NA) of diagnostic prey structures (cephalopod beaks, fish otoliths, vertebral
processes and crustacean carapaces) recovered from faeces (n = 345) and regurgitates (n = 8)
from nine breeding colonies of ASL in South Australia between 2003 and 2007.. ............... 72
Table 2. Regression formulae used to estimate prey mass (g) and length (mm) from fish
otoliths and cephalopod beaks recovered from faeces and regurgitates of ASL.. .................. 74
Table 3. Frequency of occurrence (FO) and numerical abundance (NA) of diagnostic prey
items recovered from Australian sea lion faecal (n = 345) and regurgitate (n = 8) samples.. 78
Table 4. Biomass (g) (mean ± SD), median, range, total mass) and length (mm) (mean ± SD),
median, range) estimates of fish consumed by ASL based on prey items in faeces and
regurgitates.. ....................................................................................................................... 79

15
Table 5. Biomass (g) (mean ± SD), median, range, total mass) and mantle length (mm)
(mean ± SD), median, range) estimates of all cephalopods consumed by ASL based on prey
items in faeces and regurgitates.. ......................................................................................... 81
Table 6. Estimated mass (g) and percent biomass contribution (BM) (%) of cephalopods by
taxonomic family consumed by ASL based on prey items in faeces and regurgitates.. ......... 82
CHAPTER 3
Table 1. Contribution of diet, prey species, number of days fed, and number of scats
collected for hard-part and DNA-based diet analyses for the adult male and female
experimental trial.. ............................................................................................................ 115
Table 2. Primer sequences used to amplify prey DNA from ASL faeces in this study. ...... 118
Table 3. Total number of fish otoliths ingested and number recovered from scats for
experimental diets fed to the male Australian sea lion........................................................ 122
Table 4. Frequency of occurrence (FOO) and numerical abundance (NA) of prey items
recovered from faeces produced by the male Australian sea lion. ...................................... 122
Table 5. Diet assessment methods used to detect prey (presence / absence) in faeces collected
from the adult male Australian sea lion. Samples (1 - 28) correspond to faeces collected
during the experimental diet periods (see text).. ................................................................. 125

16
CHAPTER 4
Table 1. DNA extracted from fish, crustacean and cephalopod species used as positive
controls to test the suitability of the mitochondrial 16S fish and cephalopod and primer sets.
......................................................................................................................................... 154
Table 2. Primer sequences (5' - 3') used to amplify fish and cephalopod prey DNA from
Australian sea lion faecal samples.. ................................................................................... 155
Table 3. Taxonomic assignment and numerical abundance of prey sequences obtained from
Australian sea lion faeces collected from KI and LI, South Australia. ................................ 162
Table 4. Estimated number of clone sequences required to achieve 95 % coverage of the
asymptotic prey diversity for each clone library.. .............................................................. 168
Table 5. Total number of prey identified per site and estimate of the number individuals
required to be sampled per site and combined sites to achieve 95 % coverage of the
asymptotic number of prey taxa. ........................................................................................ 171
CHAPTER 5
Table 1. Primer sequences (5' - 3') used to amplify fish and cephalopod prey DNA from ASL
faecal samples collected from Seal Bay, Kangaroo Island.................................................. 203
Table 2. Numerical abundance and frequency of occurrence (in parentheses) of diagnostic
prey items identified from hard-parts recovered from ASL faecal samples (n = 176).. ....... 211
17
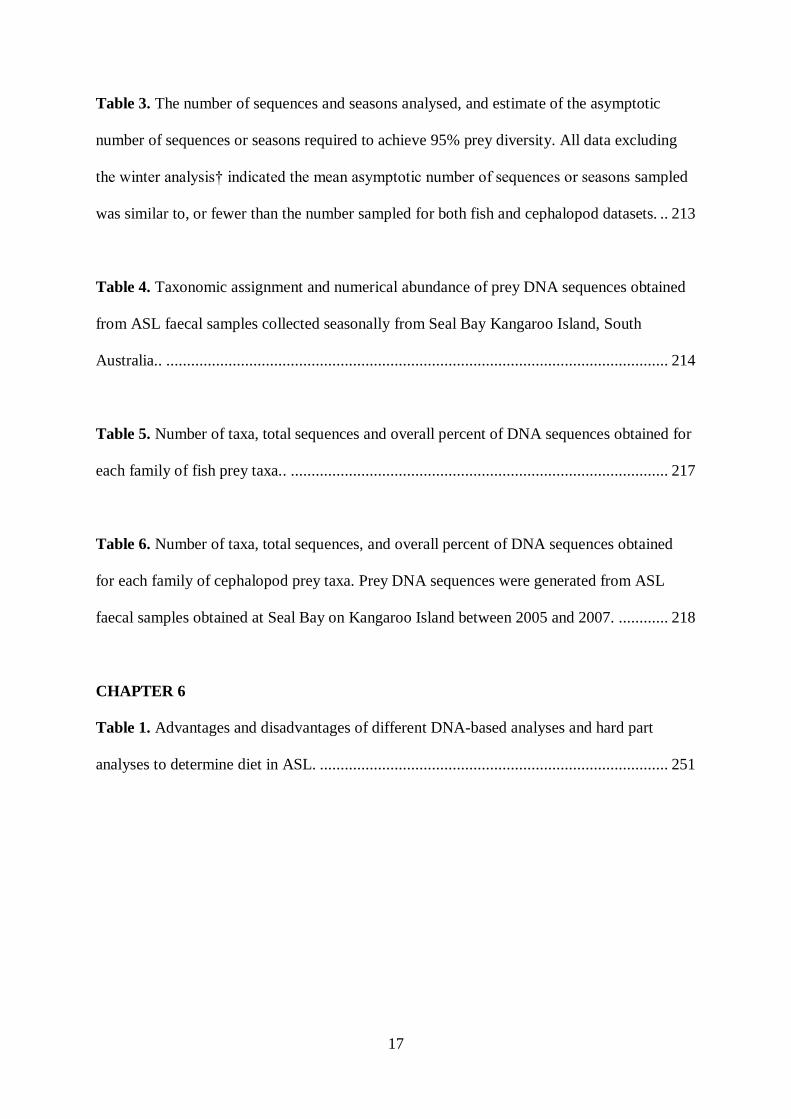
Table 3. The number of sequences and seasons analysed, and estimate of the asymptotic
number of sequences or seasons required to achieve 95% prey diversity. All data excluding
the winter analysis† indicated the mean asymptotic number of sequences or seasons sampled
was similar to, or fewer than the number sampled for both fish and cephalopod datasets. .. 213
Table 4. Taxonomic assignment and numerical abundance of prey DNA sequences obtained
from ASL faecal samples collected seasonally from Seal Bay Kangaroo Island, South
Australia.. ......................................................................................................................... 214
Table 5. Number of taxa, total sequences and overall percent of DNA sequences obtained for
each family of fish prey taxa.. ........................................................................................... 217
Table 6. Number of taxa, total sequences, and overall percent of DNA sequences obtained
for each family of cephalopod prey taxa. Prey DNA sequences were generated from ASL
faecal samples obtained at Seal Bay on Kangaroo Island between 2005 and 2007. ............ 218
CHAPTER 6
Table 1. Advantages and disadvantages of different DNA-based analyses and hard part
analyses to determine diet in ASL. .................................................................................... 251

18
THESIS ABSTRACT
A fundamental prerequisite in the conservation and management of endangered species is
knowledge of diet, because diet provides information on habitat use and resource
requirements. However, understanding diet in marine mammals is difficult because direct
feeding events are rarely observed. To overcome these limitations, many studies use the
identification of skeletal remains (hard parts) recovered from faeces, or regurgitates. Yet, for
the endangered Australian sea lion (Neophoca cinerea) (ASL), one of the rarest pinniped
species in the world, diet remains a key knowledge gap that impedes our understanding of the
species ecology and connectedness to other taxa in the marine ecosystem.
When this thesis commenced, knowledge of ASL diet was based on few hard part studies
comprising small sample sizes, which were limited in temporal and spatial extent. Knowledge
of prey utilised by ASL was poor because prey hard parts are completely digested, or, if
recovered in faeces, heavily eroded. Therefore, traditional methods of dietary analysis are
‘unreliable’ and biased toward robust prey. However, limitations notwithstanding, the
analysis of Australian sea lion diet via traditional methods still provides useful information
on prey species consumed that cannot be readily obtained using other methods. For example,
alternative biochemical methods, such as fatty acid and stable isotope analyses, have
provided important insights into habitat use the broader trophic levels of prey consumed by
ASL; however, they are yet to provide reliable taxonomic information on the diversity of
prey species consumed, at least not without first having a thorough understanding of
Australian sea lion prey.
Given the paucity of information on ASL diet, I initially aimed, as presented in Chapter 2, to
investigate the diet of the ASL at different breeding colonies in South Australia. This initial
study provided insights into some of the prey taxa consumed by ASL, which were
19
subsequently used to develop a range of DNA-based dietary analyses to determine
consumption of different prey.
In order to apply DNA-based dietary analysis methods to wild populations, it was important
to assess the application of different methods in a controlled environment to understand
methodological constraints and refine the methods. In Chapter 3, I present feeding trials on
captive ASL, with the aim to: i) assess end-point PCR and quantitative real-time PCR (qPCR)
DNA-based techniques to determine their suitability to amplify and detect prey in ASL faeces
and, ii) compare the DNA diet results with prey detected and identified using traditional hard-
part methodology.
Having successfully applied faecal DNA-based methods in a controlled feeding experiment
to identify different prey, I applied DNA-based methods to faecal samples collected from two
ASL breeding colonies in South Australia and identified a range of prey. The aims of Chapter
4 were to: (i) determine the diversity of prey taxa by sequencing a large number of clones
from a few individuals, (ii) compare the prey taxa recovered at two study sites, and (iii)
determine whether pooling faecal DNA from multiple individuals provides a useful means to
characterise diet at the colony/population level.
Finally, Chapter 5 utilised and extended the information gained from using the DNA-based
faecal analyses presented in previous chapters, by integrating next-generation sequencing
(NGS). Next-generation sequencing has the capacity to provide a greater depth of DNA
sequencing than the cloning-sequencing approach, with the method potentially improving
prey diversity information for the ASL. The aim of this study was to use DNA-based faecal
analysis and NGS technology at one breeding colony to investigate seasonal and annual
variation in prey consumed by ASL.

20
ACKNOWLEDGMENTS
“The very basic core of a man’s living spirit is his passion for adventure. The joy of life
comes from our encounters with new experiences, and there is no greater joy than having an
endlessly changing horizon”. McCandless
There are few opportunities as an ecologist that you get to spend time exploring the
unknown. This has been particularly true for this project on the Australian sea lion
(Neophoca cinerea); few have visited the island colonies and even fewer have had the
opportunity to co-exist with the inhabitants. My PhD presented an opportune moment akin to
historical exploration; though modern equipment has engaged a more comfortable existence
in times of adversity, there is a certain allure that draws one back to these rugged, windswept,
and captivating islands. Working on a project to assist the future conservation management of
an endemic and endangered species has also been a humbling experience. The behavioural
characteristics among individuals at different colonies presented many challenging moments.
Some could be regarded as “lover’s sunsets”, others not so passionate endeavours to a point
of “you take my DNA and I’ll take some of yours”. Battle scars aside, Australian sea lions
exhibited an unusual tenacious resilient spirit, which deserves full respect and support
through future conservation programs.
Many people need to be thanked for the folds of this PhD. First, I would like to thank
my PhD supervisors Prof Simon Goldsworthy and Dr Kathy Ophelkeller. Simon, we have
spent many years together, catching and tracking sea lions and had some of the most
memorable adventures and encounters. Thank you for your ongoing support and guidance as
program leader of Threatened, Protected, and Endangered Species (TEPS) at South
Australian Research and Development Institute (SARDI). Ultimately, your passion of
Australian sea lions and their conservation is the key reason I have been able to experience

21
this today. Kathy, your support through SARDI Molecular Diagnostics has been instrumental.
From inception, Dr Alan McKay and the team (Dr. Dina, Dr. Nathan Bott, Teresa Mammone
and Ina Dumitrescu) provided an unfathomable level of guidance.
To my lab mates at SARDI and now long-term, yet controversial friends: Dr A.
Baylis, Dr B. Page, Dr J. McKenzie, Dr L. Einoder, Dr R. McIntosh, Dr D. Hamer, Dr A.
Wiebkin, Dr P. Rogers, Dr L. McLeay, Dr C Huveneers, Dr A. Lowther, and Dr H. Ahonen.
You are an intangible force. Your tenacity and knowledge is the life-blood of marine science.
Thank you for reviewing drafts and being supportive shoulders. In particular, Bayleaf and
BP. Your countless fisherman’s tales, assassin bears, red jock moments, shark tears,
McAffers and ginger cats provided the essence of laughter. Beck. Dangerous Reef sea lion
colony is where it all began. You provided some wonderful memory-etched moments. You
have been incredible over the years and I thank you endlessly.
I owe tremendous gratitude to Dr Peter Shaughnessy for the countless reviews of
manuscript drafts. Pete, you are my Jacques Cousteau of pinnipeds. I have no words to
describe what it has meant to have your support over the years.
Numerous volunteers tested their courage and assisted with fieldwork. Chris Fulton,
Clarry Kennedy, Alastair Baylis, Rebecca McIntosh, Eve Ayliffe, Mary-Anne Lea, Robert
Sleep, David Peters, Amandine Emeric, Jonathon and Kylie Bire, Pat and Heidi and Gomez.
You all have incredible enthusiasm and enabled this project to be accomplished.
Thanks also to Dr Simon Jarman and Dr Bruce Deagle of the Australian Antarctic
Division, who both supported this project from day one and provided countless hours of
molecular guidance that has been instrumental to the completion of this project.
There are a host of organisations that I want to thank for the support of this project.
The University of Adelaide was instrumental in securing research scholarship funding and
SARDI with Marine Innovation South Australia provided funding, infrastructure and
22
logistics. I would like to thank the Department of Environment, Water and Natural Resources
(DEWNR) particularly B. Haddrill, B. Dalzel and their staff for permission to conduct
Australian sea lion research in South Australia. The staff at Seal Bay, Kangaroo Island have
always provided support for this project. I wish to thank Zoos South Australia and staff for
use of their facility and sea lions. Particular thanks to Dr. C. West, C. Fulton and J. Hakof for
their in-kind contribution to this project. This project was supported by external funds from
Australian Government National Heritage Trust, Nature Foundation South Australia, the
Wildlife Conservation Fund, and the Australian Marine Mammal Centre. Thank you to
SeaLink and Mountain Designs for their in-kind support.
To my family. I am indebted for all your gracious support during my PhD. You have
always told me anything is possible and that nothing is impossible. Mum, I have been away
for some time now in pursuit of this dream- now I might need some dinner. Dad, thank you
for taking time out of to assist with fieldwork. Your dream of oceanography, world mariners
and marine ecology has finally come together.
Most importantly, to my wonderful partner, Jamie Hicks. Words cannot describe the
level of encouragement and support you have provided over the years. I am blessed you see
the world through the same aqua marine, and that Australian sea lions have captured your
imagination. I am truly fortunate to have such a special person. This is a part of you as much
as it is a part of me.

23
LIST OF PUBLICATIONS
Chapter 2
Peters, K. J., McIntosh, R. R., Shaughnessy, P. D., Baylis, A. M. M. and Goldsworthy S. D.
Diet diversity and estimates of prey size of the endangered Australian sea lion
(Neophoca cinerea) in South Australia. In review.
Chapter 3
Peters, K. J., Ophelkeller, K., Bott, N. J., Herdina, H., and S. D. Goldsworthy. (2014). PCR-
based techniques to determine diet of the endangered Australian sea lion (Neophoca
cinerea): a comparison with morphological analysis. Marine Ecology, 36 (4), 1428 –
1439. doi: 10.1111/maec.12242
Chapter 4
Peters, K. J., Ophelkeller, K., Bott, N. J., Deagle, B. E., Jarman, S. J., and S. D. Goldsworthy
(2014). Fine-scale diet of the Australian sea lion (Neophoca cinerea) using DNA-
based analysis of faeces. Marine Ecology, 36 (3), 1–21. doi: 10.1111/maec.12145.
Chapter 5
Peters, K. J., Ophelkeller, K., Bott, N. J., Deagle, B. E., Jarman, S. J., and S. D. Goldsworthy.
Insights into seasonal prey use by the Australian sea lion (Neophoca cinerea) using
faecal DNA and high-throughput sequencing. In review.

24
Additional publication containing results from thesis
Goldsworthy, S. D., Page, B., Rogers, P. J., Bulmand, C., Wiebkin, A., McLeay, L. J.,
Einoder, L., Baylis, A. M. M., Braley, M., Caines, R., Dalye, K., Huveneers, C.,
Peters, K., Lowther, A. D., Ward, T. M. (2013). Trophodynamics of the eastern Great
Australian Bight ecosystem: Ecological change associated with the growth of
Australia’s largest fishery. Ecological Modelling, 255, 38 –57.

CHAPTER 1: General Introduction
25
CHAPTER 1
General Introduction

CHAPTER 1: General Introduction
26
INTRODUCTION
For animals threatened with extinction, understanding the processes that influence the
distribution and resource use of individuals is important, because it improves the efficacy of
conservation efforts and projections of population change (Caughley and Gunn, 1996).
Understanding diet is particularly important for threatened and endangered species, because
changes in ecosystems can affect the availability of preferred prey and viability of small
populations. The diets of many marine mammals, information that is more readily available
for terrestrial animals, remains poorly understood, because their foraging typically occurs
underwater and a long way from land (e.g. Fristrup and Harbison, 2002; Cherel et al. 2009,
Tollit et al. 2010; Bowen and Iverson, 2013).
Sea lions (Pinnipedia: Otariidae) are of particular conservation concern because five of the
six extant species have not yet recovered from population reductions caused by 18th and 19th
century sealing (e.g. Gerber et al. 2001; Hoffman et al. 2015). The Californian sea lion
(Zalophus californianus) is the only species that has recovered (Caretta et al. 2015). The
Australian (Neophoca cinerea), Galapagos (Zalophus wollebaeki), Steller (Eumetopias
jubatus), South American (Otaria flavescens), and New Zealand sea lion (Phocarctos
hookeri) are classified as either endangered species or species that are Vulnerable to
depletion (International Union for Conservation of Nature (IUCN, 2008-2012), and diet
largely remains poorly understood.
Causes of recent sea lion population declines include fisheries-based mortality and disease
(Goldsworthy et al. 2003; Page et al. 2004; Wilkinson et al. 2006; Castinel et al. 2007;
Chilvers, 2008; Kovacs et al. 2012), predation (Springer et al. 2003), and the availability and
quality of prey (Trites and Donelly, 2003; Estes et al. 2009; Robertson and Chilvers, 2011).
For example, during El Niño years, unseasonal sea surface warming is associated with

CHAPTER 1: General Introduction
27
nutritional stress of Galapagos and Californian sea lions and population declines (Trillmich,
1985; Trillmich and Dellinger, 1991; Alava and Salazar, 2006; Shirasago-German et al.
2015). The western stock of the Steller sea lion has experienced population declines over the
past 30 years, with one of the causes suggested to be the substitution of energy dense prey
with poor quality prey (Schaufler et al. 2006; Trites et al. 2007). Competition with fisheries
for prey may have contributed to the decline of New Zealand sea lions (Robertson and
Chilvers, 2011). Many of these studies indicate improved understanding of the diets of sea
lions would inform the development of conservation policies, and potentially improve the
probability that their populations will recover.
The Australian sea lion (Neophoca cinerea) (ASL) is classified an endangered species of
high conservation priority by IUCN (Goldsworthy, 2015). The population, estimated at
~12,000 individuals comprising 78 fragmented breeding colonies, extends from the
subtropical Houtman Abrolhos in Western Australia (WA) (28º 43’ S, 113º 47’ E) to
temperate Pages Islands in South Australia (SA) (35º 45’ S, 138º 18’ E) (Ling, 1992;
Shaughnessy et al. 2011; Goldsworthy et al. 2015) (Figure 1). The breeding biology of ASL
is unusual among pinnipeds in that females have a non-annual reproductive cycle of 15-18
months, and breeding is temporally asynchronous among colonies (Higgins, 1993; Higgins
and Gass, 1993; Gales et al. 1994). High natal site fidelity and limited dispersal of female
ASL increases the risk that small subpopulations can be threatened with extinction as a result
of either natural or anthropogenic pressures (Goldsworthy and Page, 2007; Campbell et al.
2008; Hamer et al. 2013; Goldsworthy et al. 2015; Ahonen et al. 2016).
Fishery by-catch of ASL off South Australia has slowed the recovery of ASL populations
(Goldsworthy and Page, 2007; Goldsworthy et al. 2010; Hamer et al. 2013). Since 2010,
management actions have attempted to reduce the impact of fishery-bycatch on ASL. This

CHAPTER 1: General Introduction
28
has included expanding area closures supplemented with by-catch trigger limits based on
ASL population sizes where operational interactions occur, and the implementation of
different fishing gear (i.e. long lines/hooks) as a replacement for bottom set nets. These
measures have effectively reduced by-catch of ASL, but ASL populations still are in decline.
The recent population estimate of 42 South Australian breeding colonies indicated ASL
populations have declined 24% between 2007 and 2015, with an average statewide decline of
2.9 % per year (Goldsworthy et al. 2015).
Most research on the foraging ecology of ASL has occurred in South Australia where 86% of
the population resides (Shaughnessy et al. 2011). Tracking of ASL and dive profiles indicate
individuals are benthic foragers and exhibit a high degree of fidelity to foraging locations. In
South Australia, ASL forage across a range of habitats in the coastal and continental shelf
waters (typically < 200 m water depth) of the Great Australian Bight and the adjacent
Spencer Gulf and Gulf St Vincent (Figure 1) (Goldsworthy et al. 2010, 2014). Trophic-level
diet studies using stable isotopes and fatty acids suggest ASL are individual foraging
specialists, with long-term fidelity to either inshore areas (5 to 20m) or offshore areas (about
70 m) and repeatly target the same trophic-level of prey (Costa and Gales, 2003; Baylis et al.
2009; Fowler et al. 2006, 2007; Goldsworthy et al. 2009a, b; Lowther et al. 2011, 2012).
These studies have advanced our understanding of the at-sea movements and dive behaviour
of ASL, but comprehensive knowledge of the prey used by ASL is typically regarded as poor
(Goldsworthy et al. 2009).

CHAPTER 1: General Introduction
29
Figure 1. The distribution of ASL breeding colonies in Western Australia ▲ (A, B) and South Australia ○ (C-F).

CHAPTER 1: General Introduction
30
To study the diet of pinnipeds, researchers have largely relied on methods by which they
recover and identify the remains of prey in faeces and regurgitates. Hard parts that are
relatively resistant to digestion such as cephalopod beaks, fish otoliths, and vertebrae are
often utilised to identify prey, although instances of soft tissue identification have
complemented such analyses (Gales and Pemberton, 1994; Tollit et al. 2006; Casper et al.
2007a; Mèheust et al. 2015). Hard part analyses have well-documented biases. For example,
prey hard-parts are subject to differential and species-specific erosion during digestion and
retention of remains may occur in the stomach (e.g. Pitcher, 1981; Murie and Lavigne, 1986;
Bowen 2000; Staniland, 2002; Tollit et al. 1997, 2007, see Bowen and Iverson, 2013 for
review). In addition, intraspecific differences in transit times of prey hard parts can confound
recovery rates biasing diversity estimates of prey consumed (e.g. Tollit et al. 2007; Casper et
al. 2007b). Despite these limitations, analyses of prey hard parts are thought to provide
reasonable estimates of pinniped prey, as well as estimates of prey mass and size (e.g.
Hyslop, 1980; Tollit et al. 1997; Bowen, 2000; Iverson et al. 2004; Page et al. 2005).
The diet of ASL has been studied using hard part analyses of faeces and regurgitates, the
stomach remains from dead individuals, and direct observations of predation from animal-
borne cameras (Marlow, 1975; Ling, 1992; Richardson and Gales, 1987; Gales and Cheal,
1992; McIntosh et al. 2006; Gibbs, 2008, Fragnito, 2013) (Table 1). Among early studies,
Marlow (1975) identified beaks of squid in the stomachs of deceased ASL, and Ling (1992)
reported benthic and demersal teleost fish including Australian salmon (Arripis trutta),
whiting (Sillaginodes), bottom dwelling triakid shark and squid. Gales and Cheal (1992)
assessed diet of ASL using a small number of faeces and stomach remains collected across
ASLs breeding range. Although their collections were sporadic and small, prey comprised the
eroded remains of benthic dwelling teleost fish, octopus, squid, and shark (Table 1).
McIntosh et al. and Gibbs (2008) conducted independent diet analyses using regurgitate and

CHAPTER 1: General Introduction
31
stomach remains from deceased ASL in South Australia. They noted prey items were highly
digested or eroded, and that diet comprised largely beaks from octopus, giant cuttlefish
(Sepia apama), and ommmastrephid squid, with few teleost fish and eggs of oviparous sharks
(Table 1). One novel approach used animal-borne cameras and tracking equipment to study
prey consumed by female ASL. Fragnito (2013) found different individuals adopted different
foraging strategies in seagrass, sand and reef habitats to acquire a range of teleost fish,
gastropods, crustaceans and rays (Table 1).
These studies indicate that ASL utilise a range of habitats and consume benthic and demersal
fish, cephalopods, crustaceans, molluscs, and cartilaginous prey (Table 1). They have all
noted that estimates of ASL diet are likely to underestimate the diversity of prey because
collections have been limited to a small number of samples or individuals, or individuals that
are deceased, which subsequently may not be representative of the diet of healthy individuals
(e.g. Pierce et al. 2004). Studies based on the recovery and identification of prey remains
have also concluded that few hard parts are present in ASL faeces and that the prey recovered
from ASL stomachs are biased toward cephalopods (Richardson and Gales, 1987; Gales and
Cheal, 1992; McIntosh et al. 2006; Gibbs, 2008; Chapter 2, Chapter 3). For example, Gales
and Cheal (1992) found less than 2% of fish otoliths were recovered from faeces of two
captive fed ASL and variable recovery of cephalopod beaks (9% and 98%) from a trial diet
comprising cephalopod prey.

CHAPTER 1: General Introduction
32
Table 1. ASL prey from colonies in South Australia (SA) and Western Australia (WA). Colony names and areas are: Seal Bay (SB) (Kangaroo
Island), Yorke Peninsula (YP), Lewis Island (LE) (Eyre Peninsula), Dangerous Reef (DR) (Spencer Gulf), Lilliput Island (LI) (N Nuyts
Archipelago) (see Fig. 1). Sample types are regurgitate (R), stomachs from dead ASL (S), faeces (F) and videos attached to ASL (V).
Prey type
Genus or species
(if known)
Number of
records
Sample location
(colony)
Geographic
region
Type of
sample
Size and
biomass
estimates? Author/s
Cephalopoda
Gould’s squid Nototodarus gouldi 1 SB SA RS Y McIntosh et al. (2006)
Ommastrephid squid (other) 1 SB SA R Y McIntosh et al. (2006)
Giant cuttlefish Sepia apama 2 SB SA RSF Y McIntosh et al. (2006), Gales and Cheal (1992)
Cuttlefish Sepia spp. 3 SB, UK1
, YP SA RS Y McIntosh et al. (2006), Gales and Cheal (1992), Gibbs (2008)
Calamari squid Sepioteuthis australis 3 SB, UK1 , YP SA RS Y McIntosh et al. (2006), Gales and Cheal (1992), Gibbs (2008)
unknown squid 1 WA2
WA S N Richardson and Gales (1987), Gales and Cheal (1992)
Octopus Octopus spp. 4 SB, UK1, YP, DR SA RSFV Y McIntosh et al. (2006), Gales and Cheal (1992), Gibbs (2008), Fragnito (2013)
Birds
Little penguin Eudyptula minor 1 SB SA R N McIntosh et al. (2006)
Fish
Leatherjacket Monocanthidae spp. 2 SB, DR SA RS N McIntosh et al. (2006), Fragnito (2013)
Flathead Neoplatycephalus spp. 1 SB SA R N McIntosh et al. (2006)
Swallowtail Centroberyx lineatus 1 SB SA R N McIntosh et al. (2006)
Common bullseye Pempheris multiradiata 1 SB SA R N McIntosh et al. (2006)
Eastern school whiting Sillago flindersi 1 SB SA R N McIntosh et al. (2006)
Yellowtail mackeral Trachurus novaezelandiae 1 SB SA R N McIntosh et al. (2006)
Rock Ling Genypterus tigerinus 1 LE SA V N Fragnito (2013)
Estuary Cobbler Cnidoglanis macrocephalus 1 LE SA V N Fragnito (2013)
Western fox fish Bodianus frenchii 1 LE SA V N Fragnito (2013)
Red velvetfish Gnathanacanthus goetzeei 1 LE SA V N Fragnito (2013)
Tommy ruff Arripis georgianus 1 LE SA V N Fragnito (2013)
Puffer fish Tetraodontidae 2 SB, DR SA SV Y Gales and Cheal (1992), Fragnito (2014)
Crustacea
Southern rock lobster Jasus edwardsii 1 SB SA RS N McIntosh et al. (2006)
Western rock lobster Panulirus cygnus 2 WA2
SA SF N Richardson and Gales (1987), Gales and Cheal (1992)
Sand crab 1 SB SA RS N McIntosh et al. (2006)
Stone crab 1 DR SA
Unknown crab3
(small) 1 UK1
SA F N Gales and Cheal (1992)
Elasmobranch V N Fragnito (2013)
Oviparous shark egg 1 SB, SA R N McIntosh et al. (2006)
Catshark shark egg3
(Scyliorhinidae) 1 SB, UK1
SA RF N Gales and Cheal (1992), McIntosh et al. (2006)
Port Jackson shark Heterodontus portusjacksoni 2 UK1
F Y Gales and Cheal (1992)
Mollusca
Greenlip abalone Haliotus laevigata 1 LI SA V N Fragnito (2013)
Amphipoda
unknown amphipod3
1 UK1
F N Gales and Cheal (1992)
unknown shrimp3
1 UK1
F N Gales and Cheal (1992)1Location not specified and unknown within regional (geographic) context,
2Broad regional context only,
3Possible secondary ingestion
CHAPTER 1: General Introduction
33
To overcome limitations associated with the analyses of prey hard parts several studies have
used biochemical methods including fatty acid signature analyses and stable isotope analyses
to assess the trophic-level of prey used by marine predators (Lea et al. 2002; Bradshaw et al.
2003; Hückstädt et al. 2012; Bowen and Iverson, 2013). Because prey fatty acids accumulate
in the tissues of predators over time (e.g blubber), they are thought to provide information on
prey consumed over several months, rather than days (e.g. Tollit et al. 2006). For marine
predators, this advantage has enabled fatty acids to be applied to understand how different
age/sex groups or species use different prey. For example, fatty acids have been used to
define demographic and ontogenetic prey use by pinniped and seabird predators, whose
cryptic and wide ranging foraging behaviour makes their diet difficult to study (Baylis et al.
2009; Meynier et al. 2008).
Diet studies based on fatty acids have several limitations (for review see Bowen and Iverson,
2013). For example, the identification of prey is dependent on prey species having different
fatty acid signatures, which is not always the case, particularly in closely related taxa. Fatty
acid profile libraries of prey species are also required, and these can vary between locations.
Deposition, mobilisation and selective uptake of prey fatty acids are also known to differ
among long and short chain fatty acid groups (Iverson et al. 2004, 2007; Nordstrom et al.
2008). Experiments on captive-fed predators indicate that the resolution provided by analyses
of fatty acids varies depending on the composition of prey (e.g. Bowen and Iverson, 2013).
These biases limit the conclusions that can be drawn from studies that are based on analyses
of prey fatty acids.
Stable isotope analyses assume that isotopic signatures in a predator’s metabolically active
(e.g. blood, serum) and inert tissues (e.g. hair) are derived from equivalent signatures in their
prey (DeNiro and Epstein, 1978, 1981, Roth and Hobson, 2000; Kelly et al. 2012). Stable

CHAPTER 1: General Introduction
34
isotope ratios of δ15N and δ13C are typically used to assess the diets of predators (Bowen and
Iverson, 2013). Enrichment of nitrogen typically occurs up the food chain, enabling the
trophic position of prey consumed to be determined (Crawford et al. 2008; Ben-David and
Flaherty, 2012). In contrast, δ13C provides information on primary productivity, facilitating
discrimination of the habitat used by primary and tertiary consumers (Post, 2002; Crawford et
al. 2008; Ehrich et al. 2015). In marine systems, δ13C typically decreases with distance from
shore and it differs between benthic and pelagic habitats (Hobson et al. 1996; Miller et
al. 2008). Consequently, δ13C is often used to differentiate marine predators that use inshore
versus offshore foraging areas (e.g. Hobson et al. 1996; Aurioles et al. 2006; Lowther et
al. 2011). Stable isotope analyses have also been used to infer individual and population-level
changes in the diets of marine predators (e.g. seasonal, annual, prey switching) and to
track changes in entire ecosystems (Newsome et al. 2007; Hückstädt et al. 2012; Scherer et
al. 2015). Like fatty acids, stable isotopes provide information on prey that have different
isotopic signatures, which typically limits studies to trophic-level analyses and conclusions
(e.g. Ehrich et al. 2015). Mixing models and trophic enrichment factors have been used to
refine stable isotope analyses, but these models do not provide information on all prey
consumed (Parnell et al. 2010; Kelly et al. 2012; Phillips, 2012).
DNA-based methods are now widely used to identify prey in the diets of many herbivore and
predator species (King et al. 2008; Soininen et al. 2009; Riemann et al. 2010; Willerslev et
al. 2014). The DNA-based approach assumes that DNA fragments of food survive digestion
and can be identified when compared to the DNA from known animal or plant species
(Sydmonson, 2002; Herbert et al. 2003, 2005; Ward et al. 2005, 2008). The polymerase chain
reaction (PCR) (Mullis et al. 1986, 1987) underpins DNA-based diet studies because it can be
used to amplify and produce multiple identical copies of prey DNA even when degraded
and/or in very low concentrations (Deagle et al. 2006; Kohn and Wayne, 1997). This has

CHAPTER 1: General Introduction
35
enabled DNA-based analyses to be widely applied to determine predator-prey interactions,
because food items can be detected and identified irrespective of whether their morphological
counterparts are present (e.g. Casper et al. 2007b; Soininen et al. 2009; Khanam et al. 2016).
One of the earliest studies to apply DNA-based methods determined diet of the European
brown bear (Ursus arctos) from faeces collected in the Brenta region of Italy (Höss 1992).
Using PCR, Höss (1992) amplified the chloroplast rbcL gene revealing that bears consumed
the Christmas berry, Photinia villosa, which is a common summer plant in the region. DNA-
based diet studies have since been conducted on many terrestrial and aquatic vertebrates and
invertebrates (e.g. Asahida et al. 1997; Riemann et al. 2010; Willerslev et al. 2014). These
studies confirm that DNA-based methods can be used to study diets based on analyses of
either stomach contents or faeces (Deagle et al. 2005a,b; Sydmonson, 2002; Kvitrud et al.
2005; Deagle and Tollit, 2007; King et al. 2008; Riemann et al. 2010).
DNA-based methods have been increasingly used in marine systems to determine both simple
and complex diets of marine predators (Tollit et al. 2009; Dunn et al. 2010; Ford et al. 2016).
These studies have used species- and group- specific assays to amplify prey DNA, and in
most instances, have improved information on the consumption of single taxa or the broad
diversity of prey. Like other techniques used to analyse diet, DNA-based methods have
biases. These largely stem from the fact that DNA of prey digest at different rates, which can
vary the success of prey detection (Deagle and Tollit, 2007). Prey identification from
degraded templates such as faeces is therefore highly dependent on the target size of the
amplified gene: which the likelihood of success decreases with an increase in product size
(Kohn and Wayne, 1997; Deagle et al. 2006; Marshall et al. 2010).
Despite such biases, DNA-based methods have greatly improved our understanding of the
diets of marine predators, particularly where prey hard parts are not present or identifiable

CHAPTER 1: General Introduction
36
(e.g. Casper et al. 2007b). In particular, DNA-based methods have been used to identify the
remains of prey in the stomach contents of fish and cephalopods, neither of which typically
contain identifiable prey remains (Rosel and Kocher, 2002; Deagle et al. 2005b; Braley et al.
2009; Dunn et al. 2010). Sousa et al. (2016) for example, used DNA derived from stomach
material to determine the diet of the ocean sunfish, Mola mola, which were thought to be
largely planktivores. DNA analyses revealed however, a diet comprised of crustacean and
fish prey, with low proportions of plankton. That study further revealed diet partitioning
between small and large individuals, whom used different coastal and pelagic prey.
Similarly, faecal DNA-based analyses have been applied to determine the diets of penguins,
seabirds and pinnipeds. These have revealed a wide range of fish, cephalopod, and crustacean
prey (Jarman et al. 2004, 2013; Casper et al. 2007a; Tollit et al. 2009; Deagle et al. 2007,
2010; McInnes et al. 2016). For example, Jarman et al. (2010) assessed the diet of Adelie
penguins (Pygoscelis adeliae) using DNA recovered from faeces, which, like faeces of other
seabirds, typically do not contain the hard parts of of prey (Hartley, 1948; Deagle et al.
2007). By amplifying a short section of mitochondrial DNA, the authors revealed a wide
diversity of krill, fish, crustacean and jellyfish prey. They concluded Adelie penguins would
be useful indicators of community structure of the coastal Southern Ocean. These studies
demonstrate the utility of DNA-based methods, which have greatly improved our
understanding of trophic interactions in marine ecosystems.
Pinnipeds (Phocidae, Otarridae and Odobenidae) are one of the most common marine
predators for which DNA-based diet analyses have been applied. This is because pinnipeds
are large consumers of marine prey resources and an accurate understanding of their use of
prey assists in understanding how such predators function within marine ecosystems.
Furthermore, comprehensive information of diet is an important component to determine the

CHAPTER 1: General Introduction
37
food and habitat requirements for declining species, which includes the potential to assess
competition with fisheries (e.g. Tollit et al. 2009). The tendency of pinnipeds to forage from
a central place, and come ashore to rest, moult, and breed, enables a large number of samples
to be collected. This however is not the case for ice-breeding seals, which subsist on mobile
substrates to breed and haulout on ice. Several pinniped diet studies have compared the
results of DNA-based to the analyses of hard parts, and shown that DNA-based methods
improve prey detection, which can increase the information on frequency and use of
different prey. For example, Purcell et al. (2000) used restriction fragment length
polymorphism analyses (RFLP) to determine predation by Pacific harbour seals (Phoca
vitulina) on salmonids in the Umpqua River, Oregon. In that study, mitochondrial DNA
(mtDNA) from unidentified fish bones recovered from faeces were PCR amplified then
identified. The authors found by using DNA, that harbour seals consumed coho, chinook and
steelhead salmon, but also non-salmonid fish prey. They concluded that DNA was the only
useful method to identify salmon to species, as bones and otoliths were similar in structure or
typically digested. Similar studies using faecal DNA analyses have also been applied to other
pinnipeds including Antarctic fur seals (Arctocephalus gazella) (Casper et al. 2007a),
Australian fur seals (Arctocephalus pusillus) (Deagle et al. 2009) and Steller sea lions (E.
jubatus) (Tollit et al. 2009). Casper et al. (2007a) in particular, improved dietary information
on the frequency and use of squid, myctophid and mackerel ice (Champsocephalus gunnari)
fish prey of the Antarctic fur seal (A. gazella) by combing faecal DNA with hard part
analyses at Heard Island. They found, by amplifying nuclear and mtDNA that prey detection
rates increased by ~30%, and by ~46% if used in combination with hard parts. They
concluded that a combined approach provided better representation of prey consumed by A.
gazella.
CHAPTER 1: General Introduction
38
The study by Marshall et al. (2010) is a unique example where DNA and hard parts have
been used to identify the stomach content of pinnipeds. Although destructive sampling is
rarely used, Marshall et al. (2010) captured harp seals (Pagophilus groenlandicus) and
directly sequenced their stomach DNA. They found DNA-based analyses improved
information on how predation by harp seals effects recovering stocks of Arctic cod
(Boreogadus saida) and Capelin (Mallotus villosus), and concluded that DNA-based methods
present a viable means to improve the detection of different prey.
In this thesis, I investigated the diet of the ASL using traditional analyses of prey hard parts
and three DNA-based methods: 1) PCR amplification followed by DNA cloning and
sequencing, 2) PCR amplification using quantitative (real-time) PCR (qPCR) and 3) PCR
amplification followed by next-generation sequencing (NGS).
The DNA cloning and sequencing method is essentially a barcoding approach that enables
the DNA of different species or taxonomic groups of prey (e.g. fish, cephalopods,
crustaceans) to be PCR amplified and identified by cloning and sequencing PCR amplicons
within a library. The cloning approach has been widely used to assess diet in a range of
marine predators including pinnipeds, as it can provide information of prey diversity without
previous knowledge of diet (e.g. Deagle et al. 2005a; Jarman et al. 2004, Dunshea, 2009).
Quantitative PCR (qPCR) has been used in the assessment of pinniped diets both as a direct
method of detection and as a quantitative tool to assess the amount of prey DNA recovered in
a sample (Deagle et al. 2007; Bowles et al. 2011; Casper et al. 2007a, Matejusovà et al.
2008). Because of its sensitivity and efficacy to visualise low concentrations of DNA, the
qPCR method can improve the frequency of prey detection particularly in pinniped faeces.
For example, Matejusovà et al. (2008) detected the DNA of salmon to concentrations as low
as 0.01% in spiked grey seal (Halichoerus grypus) faeces. This level of accuracy underpins

CHAPTER 1: General Introduction
39
the qPCR approach, resulting in the technique being applied to faeces of captive fed seals in
attempt to estimate the relative proportions of prey ingested (Deagle and Tollit, 2007; Bowles
et al. 2011; Matejusovà et al. 2008). The results of such studies however have indicated
differential prey digestion and copy number variability among tissue DNA affect DNA-based
biomass estimates. Such biases require numerical correction factors to compensate for
differences between tissue ratios of genomic and mitochondrial DNA (Bowles et al. 201;
Hartmann et al. 2011).
Next-generation high throughput DNA sequencing (NGS) has improved the depth of
sequencing information produced for dietary studies. Various sequencing platforms can now
generate unprecedented amounts of taxonomic information from a range of environmental
samples including pinniped faeces (Deagle et al. 2009, 2013; Pompanon et al. 2013;
Quéméré et al. 2013). The ability to amplify then simultaneously characterise the broad
diversity of prey consumed in mixed-species templates can improve the capacity to elucidate
complex food-web interactions. Although early NGS studies were largely qualitative and
based on presence/absence models (e.g. Deagle et al. 2009), more recent platforms (e.g
Illumina, Ion torrent) are now using sequence abundances as a quantitative proxy to estimate
prey biomass (Shokralla et al. 2012; Deagle et al. 2013; Pompanon et al. 2013). For ASL,
DNA-based NGS technology presents a novel opportunity to address some of the knowledge
gaps in diet such as the use of seasonal prey.
Using the range of methods outlined, I aimed to compare different diet methods, and improve
information of diet for ASL.
THESIS ORGANISATION AND STRUCTURE
Chapter 2 reports on my analyses of prey hard parts, in an attempt to document baseline
information on the diet of ASL. Chapter 3 examines the use of conventional and quantitative

CHAPTER 1: General Introduction
40
PCR (qPCR) methods to identify the remains of prey using controlled feeding experiments on
captive ASL. Chapter 4 uses DNA-based cloning and sequencing methods to examine
individual and spatial differences in the diet of wild ASL. Chapter 5 is a pilot study that
assesses the utility of next-generation sequencing (NGS) to estimate prey diversity using ASL
faeces. Chapters 3 and 4 are published manuscripts. The other data chapters (2 and 5) have
been submitted for publication. The citation and co-authorship details for these four chapters
are provided at the end of Chapter 1.
All of the chapters are self-contained, except for the introduction (Chapter 1) and general
discussion (Chapter 6). Because the focus of the thesis was to apply different DNA
techniques to study the diet of ASL, there is repetition in chapters that overlap in content. The
figures and tables refer only to the chapter in which they are contained and as a result, their
numbers begin at one in each chapter.
Chapter 2 assessed the diet of ASL using prey hard parts recovered from faecal and
regurgitate samples collected across the South Australian breeding range of ASL (Figure. 1).
This study determined the diversity and biomass of ASL prey and addressed the following
questions:
Can analyses of prey hard parts found in ASL faeces and regurgitates provide
adequate taxonomic information on the diet of ASL?
Based on these analyses, what are the most important prey, and do they differ among
seasons or colonies?
Do ASL use prey that are commercially fished?

CHAPTER 1: General Introduction
41
The prey taxa identified in this study and previous studies (e.g. Gales and Cheal, 1993;
McIntosh et al. 2006; Gibbs, 2008) provided the baseline data that were used to develop and
test group-specific DNA markers in Chapters 4 and 5.
To validate the use of DNA-based analysis methods for ASL, Chapter 3 explored their
application using captive feeding trials. This follows successful amplification and
identification of prey using DNA-based methods in the study of diet of captive Steller sea
lions (E. jubatus), sub-Antarctic fur seals (Arctocephalus tropicalis) and New Zealand fur
seals (Arctocephalus forsteri) (Deagle et al. 2006; Casper et al. 2007b). I evaluated
conventional PCR and quantitative PCR methods and compared their prey detection limits. I
also compared DNA-based detection to analyses of prey hard parts recovered from faeces.
The feeding trial addressed the following questions:
Are different prey species detectable in ASL faeces using DNA-based methods?
Are there differences between PCR techniques (conventional and quantitative) in their
prey detection limits? How do the results of these DNA-based methods compare to
the results of analyses based on of identification of prey hard parts?
Do quantitative PCR techniques provide reliable estimates of the amount of prey
ingested?
Chapter 4 is the first field-based diet study to apply DNA-based analyses to the faeces of wild
ASL following the successful amplification of prey DNA from faeces collected from captive
fed ASL. In this study, I developed new and used existing mtDNA markers to PCR amplify
prey DNA, and used the cloning and sequencing approach to develop representative prey
libraries. The study established new information of diet for two ASL colonies, and identified
a range undescribed prey of ASL. Specific questions I aimed to address were:

CHAPTER 1: General Introduction
42
Can PCR clone libraries be used to improve our understanding of ASL diet?
Does the diet of ASL differ among individuals from the same colony?
Does the diet of ASL differ among colonies?
Will clone libraries represent the full range of prey identified from individual diets if
DNA of multiple faecal samples is pooled into a metasample?
Does pooling DNA improve the efficacy of PCR sequencing methods?
Chapter 5 explores NGS as a novel sequencing method to assess seasonal variation in the diet
of ASL. Using NGS technology can enable rapid screening of multiple samples and provide a
greater depth of dietary information that would not be logistically affordable using the clone
and sequence method (Chapter 4). This study collected faecal samples in different seasons
from Seal Bay (Kangaroo Island) over a three-year period. Prey DNA was amplified using
previously published PCR markers with PCR amplicons sequenced using the Roche 454 NGS
platform. Although newer platforms are now available and provide even greater depth of
sequencing (e.g. Illumina), at the time of this study, Roche 454 sequencers were amongst the
forefront of NGS technology. Combined with the analyses of prey hard parts, this study
aimed to identify some of the seasonal prey used by ASL. Questions this study aimed to
address were:
Does NGS provide comprehensive information of diet for ASL?
What are important prey?
How do results from conventional hard part analyses compare with NGS?
Are there any seasonal patterns to the prey resources consumed by ASL at Seal Bay?
The thesis concludes with a discussion on the effectiveness of DNA-based methods to study
the diet of ASL (Chapter 6). It includes a summary of the potential for DNA-based methods

CHAPTER 1: General Introduction
43
to improve diet studies. This section highlights the implications and examines future
directions of DNA-based analyses for research into the diet of ASL.
REFERENCES
Alava, J. J., and Salazar, S. (2006). Status and conservation of otariids in Ecuador and the
Galapagos Islands. Pages 495-519 in ‘Sea Lions of the World’ (A. W. Trites, D.
P. Atkinson, D. P. DeMaster, L. W. Fritz, T. S. Gelatt, L. D. Rea and W. M.
Wynne, eds). Alaska Sea Grant, Fairbanks, AK.
Ahonen, H, Lowther, A. D., Harcourt, R. G., Goldsworthy, S. D., Charrier, I, and Stow, A. J.
(2016). The limits of dispersal: Fine scale spatial genetic structure in Australian sea
lions. Frontiers in Marine Science, 3, 65. http://dx.doi.org/10.3389/fmars.2016.00065
Asahida, T., Yamashita, Y., and Kobayashi, T. (1997). Identification of consumed stone flounder,
Kareius bicoloratus (Basilewsky), from the stomach contents of sand shrimp, Crangon
affinis (De Haan) using mitochondrial DNA analysis. Journal of Experimental Marine
Biology and Ecology, 217, 153-163.
Aurioles, D., Koch, P. L., and Le Boeuf, B. J. (2006). Differences in foraging location of
Mexican and California elephant seals: Evidence from stable isotopes in pups. Marine
Mammal Science, 22, 326−338.
Baylis, A. M. M., Hamer, D., Nichols, P. D. (2009). Assessing the use of milk fatty acids to
infer the diet of the Australian sea lion. Wildlife Research, 36, 169 – 176.
Ben-David, M., and Flaherty E. A. (2012). Stable isotopes in mammalian research: a
beginner’s guide. Journal of Mammalogy, 93, 312–28.

CHAPTER 1: General Introduction
44
Bowen, W. D. (2000). Reconstruction of pinniped diets: accounting for complete digestion of
otoliths and cephalopod beaks. Canadian Journal of Fisheries and Aquatic Science
57, 898–905.
Bowen, W. D., and Iverson, S. J. (2013). Methods of estimating marine mammal diets: a
review of validation experiments and sources of bias and uncertainty. Marine
Mammal Science, 29, 719–754.
Bowles, E., Schulte, P.M., Tollit, D.J., Deagle, B.E., and Trites, A.W. (2011). Proportion of
prey consumed can be determined from faecal DNA using real-time PCR. Molecular
Ecology Resources. doi: 10.1111/j.1755-0998.2010.02974.x.
Bradshaw, C. J. A., Hindell, M. A., Best, N. J., Phillips, K. L., Wilson, G., and Nichols, P. D.
(2003). You are what you eat: describing the foraging ecology of southern elephant
seals (Mirounga leonina) using blubber fatty acids. Proceedings. Biological Sciences /
The Royal Society, 270(1521), 1283–92. http://doi.org/10.1098/rspb.2003.2371
Braley, M., Goldsworthy, S. D., Page, B., Steer, M., and Austin, J. J. (2009). Assessing
morphological and DNA-based diet analysis techniques in a generalist predator, the
arrow squid, Nototodarus gouldi. Molecular Ecology Resources, 10, 466–474.
Carretta, J.V., E.M. Oleson, D.W. Weller, A.R. Lang, K.A. Forney, J. Baker, M.M. Muto, B.
Hanson, A.J. Orr, H., Lowry, J. Barlow, Moore, J. E., Lynch, D., Carswell, L., and
Brownell, R.L. Jr. (2015). U.S. Pacific Marine Mammal Stock Assessments: 2014.
U.S. Department of Commerce, NOAA Technical Memorandum, NOAA, TM-
NMFS- SWFSC-549. 414 p.

CHAPTER 1: General Introduction
45
Campbell, R. A., Gales, N. J., Lento, G. M., and Baker, C.S. (2008). Islands in the sea:
extreme female natal site fidelity in the Australian sea lion, Neophoca cinerea.
Biology Letters, 4, 139–142.
Casper, R. M., Jarman, S. N., Gales, N. J., and Hindell, M. A. (2007a). Combining DNA and
morphological analyses of faecal samples improves insight into trophic interactions: a
case study using a generalist predator. Marine Biology, 152, 815–825.
Casper, R. M., Jarman, S. N., Deagle, B. E., Gales, N. J., and Hindell, M.A. (2007b).
Detecting prey from DNA in predator scats: A comparison with morphological
analysis, using Arctocephalus seals fed a known diet. Journal of Experimental Marine
Biology and Ecology, 347, 144–154.
Castinel, A., Duignan, P. J., and Pomroy, W. E. (2007). Neonatal mortality in New Zealand
sea lions (Phocarctos hookeri) at Sandy Bay, Enderby Island, Auckland Islands from
1998 to 2005. Journal of Wildlife Diseases, 43, 461–474.
Caughley, G. and Gunn, A. (1995). Conservation Biology in Theory and Practice (No.
333.9516 C3). Wiley, 459 pp.
Crawford, K., McDonald, R. A., and Bearhop, S. (2008). Applications of stable isotope
techniques to the ecology of mammals. Mammal Review, 38, 87–107.
doi: 10.1111/j.1365-2907.2008.00120.x
Cherel, Y., Kernaléguen, L., Richard, P., and Guinet, C. (2009). Whisker isotopic signature
depicts migration patterns and multi-year intra-and inter-individual foraging strategies
in fur seals. Biology Letters, 5, 830–832.

CHAPTER 1: General Introduction
46
Chilvers, B. L. (2008). New Zealand sea lions Phocarctos hookeri and squid trawl fisheries:
bycatch problems and management options. Endangered Species Research, 5, 193–
204.
Costa D.P. and Gales N. J. (2003). Energetics of a benthic diver: Seasonal foraging ecology
of the Australian sea lion, Neophoca cinerea. Ecological Monographs, 73, 27–43.
Deagle, B. E., Tollit, D. J., Jarman, S. N., Hindell, M.A., Trites, A.W., and Gales, N.J.
(2005a). Molecular scatology as a tool to study diet: analysis of prey DNA in scats
from captive Steller sea lions. Molecular Ecology, 14, 1831–1842.
Deagle, B. E., Jarman S. N., Pemberton, D., and Gales, N. J. (2005b). Genetic screening of
prey in the gut contents from a giant squid (Architeuthis sp). Journal of Heredity, 96,
417–423.
Deagle, B. E., Eveson, J. P., and Jarman, S. N. (2006). Quantification of damage in DNA
recovered from highly degraded samples - a case study on DNA in faeces. Frontiers
in Zoology, 3, 1–10.
Deagle, B. E., Gales, N. J., Evans, K., Jarman, S. N., Robinson, S., Trebilco, R. and Hindell,
M.A. (2007). Studying seabird diet through genetic analysis of faeces: a case study on
macaroni penguins (Eudyptes chrysolophus). PLoS ONE, 2, p.e831.
Deagle, B. E., Kirkwood, R., and Jarman, S. N. (2009). Analysis of Australian fur seal diet by
pyrosequencing prey DNA in faeces. Molecular Ecology, 18, 2022–2038.
Deagle, B. E., Chiaradia, A., McInnes, J., and Jarman, S. N. (2010). Pyrosequencing faecal
DNA to determine diet of little penguins: is what goes in what comes out?
Conservation Genetics, 11, 2039–2048.

CHAPTER 1: General Introduction
47
Deagle, B. E, Thomas, A. C, Shaffer, A. K, Trites, A. W, and Jarman, S. N. (2013).
Quantifying sequence proportions in a DNA-based diet study using Ion Torrent
amplicon sequencing: which counts count? Molecular Ecology Resources, 13, 620–
633.
Deagle, B. E., and Tollit, D. J. (2007). Quantitative analysis of prey DNA in pinniped faeces:
potential to estimate diet composition? Conservation Genetics, 8, 743–747.
DeNiro, M. J. and Epstein, S. (1978). Influence of diet on the distribution of carbon isotopes
in animals. Geochimica et Cosmochimica Acta, 42, 495–506.
DeNiro, M. J. and Epstein, S. (1981). Influence of diet on the distribution of nitrogen isotopes
in animals. Geochimica et Cosmochimica Acta 45, 341–351.
Dunn, M. R., Szabo, A., McVeagh, M. S., and Smith, P. J. (2010). The diet of deepwater
sharks and the benefits of using DNA identification of prey. Deep Sea Research Part
I: Oceanographic Research Papers, 57, 923–930. ISSN 0967
0637,http://dx.doi.org/10.1016/j.dsr.2010.02.006.
Dunshea, G. (2009). DNA-based diet analysis for any predator. PLoS ONE, 4, e5252.
Ehrich, D., Ims, R. A., Yoccoz, N. G., Lecomte, N., Killengreen, S. T., Fuglei, E.,
Rodnikova, A. Y., Ebbinge, B. S., Menyushina, I. E., Nolet, B., Prokovsky, I. G.,
Popov, I. Y, Schmidt, N. M., Sokolov, A, Sokolova, N. A. and Sokolov, V. A. (2015).
What can stable isotope analysis of top predator tissues contribute to monitoring of
tundra ecosystems? Ecosystems, 18, 404–416. 10.1007/s10021-014-9834-9.
Estes, J. A., Doak, D. F., Springer, A. M. and Williams, T. M. (2009). Causes and
consequences of marine mammal population declines in southwest Alaska: a food-

CHAPTER 1: General Introduction
48
web perspective. Philosophical Transactions of the Royal Society of London B:
Biological Sciences, 364, 1647–1658.
Ford, M. J., J. Hempelmann, M. B. Hanson, K. L. Ayres, R. W. Baird, C. K. Emmons, J. I.
Lundin, G. S. Schorr, S. K. Wasser, and Park, L. K. (2016). Estimation of a killer
whale (Orcinus orca) population’s diet using sequencing analysis of DNA from feces.
PLoS ONE, 11, e0144956. doi:10.1371/journal.pone.0144956
Fowler, S. L., Costa, D. P., Arnould, J. P. Y., Gales, N. J., and Kuhn, C. E. (2006). Ontogeny
of diving behavior in the Australian sea lion: Trials of adolescence in a late bloomer.
Journal of Animal Ecology, 72, 358–367.
Fowler, S. L., Costa, D. P., and Arnould, J. P.Y. (2007). Ontogeny of movements and
foraging ranges in the Australian sea lion. Marine Mammal Science, 23, 598–614.
Fragnito, K. (2013). Feeding behaviour and habitat utilisation of adult female Australian sea
lions (Neophoca cinerea) using animal-borne video cameras. BSc Honours thesis, The
University of Adelaide, South Australia.
Fristrup, K. M., and Harbison, G. R. (2002). How do sperm whales catch squids?.Marine
Mammal Science, 18, 42–54.
Gales, N.J., and Cheal, A. J. (1992). Estimating diet composition of the Australian sea lion
(Neophoca cinerea) from scat analysis: an unreliable technique. Wildlife Research.
19, 447–456.
Gales, R. and Pemberton, D. (1994). Diet of the Australian fur seal in Tasmania. Australian
Journal of Marine and Freshwater Research, 45, 653–664.

CHAPTER 1: General Introduction
49
Gales N. J., Shaughnessy P. D., and Dennis, T. E. (1994). Distribution, abundance and
breeding cycle of the Australian sea lion Neophoca cinerea (Mammalia: Pinnipedia).
Journal of Zoology, 234, 353–370.
Gerber, L. R., and Hilborn, R. (2001). Catastrophic events and recovery from low densities in
populations of otariids: implications for risk of extinction. Mammal Review, 31, 131–
150. (doi:10.1046/j.1365-2907. 2001.00081.x)
Goldsworthy, S. D., Hindell, M. A. and Crowley, H. M. (1997). Diet and diving behaviour of
sympatric fur seals Arctocephalus gazella and A. tropicalis at Macquarie Island. In
Marine mammal research in the Southern Hemisphere. Hindell, M. and Kemper, C.
(eds). Surrey Beatty and Sons: Chipping Norton, Sydney, pp.151-163.
Goldsworthy, S. D., McKenzie, J., Shaughnessy, P. D., McIntosh, R. R., Page, B., and
Campbell, R. (2009). An update of the report: understanding the impediments to the
growth of Australian sea lion populations. Report to the Department of the
Environment, Water, Heritage and the Arts. SARDI Aquatic Science Publication No.
F2008/00847-1. SARDI Research Report Series No. 356. South Australian Research
and Development Institute (Aquatic Sciences), Adelaide.
Goldsworthy, S. D., Bulman, C., He, X., Larcombe, J., and Littnan, C. (2003). Trophic
interactions between marine mammals and Australian fisheries: an ecosystem
approach. Pages 65–99 in Gales, N. J., Hindell, M. A., and R. Kirkwood, eds. Marine
Mammals: Fisheries, Tourism and Management Issues. CSIRO Publishing,
Melbourne, Vic.

CHAPTER 1: General Introduction
50
Goldsworthy, S. D., and Page, B. (2007). A risk-assessment approach to evaluating the
significance of seal bycatch in two Australian fisheries. Biological Conservation, 139,
269–285.
Goldsworthy, S. D., Page, B., Shaughnessy, P. D. and Linnane, A. (2010). Mitigating Seal
Interactions in the SRLF and the Gillnet Sector SESSF in South Australia. Report to
the Fisheries Research and Development Institute. South Australian Research and
Development Institute (Aquatic Sciences), Adelaide. SARDI Publication No.
F2009/000613-1. SARDI Research Report Series No. 405.
Goldsworthy, S. D., Ahonen, H., Bailleul, F., and Lowther, A. (2014). Determining spatial
distribution of foraging effort by Australian sea lions in southern Western Australia:
assisting in spatial and temporal management of commercial fisheries. Report to the
Australian Marine Mammal Centre. South Australian Research and Development
Institute (Aquatic Sciences), Adelaide. SARDI Publication Number F2014/000378-1
SARDI Research Report Series No. 784. 21 pp.
Goldsworthy, S. D. (2015). Neophoca cinerea. The IUCN Red List of Threatened Species
2015: e.T14549A45228341. http://dx.doi.org/10.2305/IUCN.UK.2015-
2.RLTS.T14549A45228341.en.
Goldsworthy, S. D., Mackay, A. I., Shaughnessey, P. D., Bailleul, F., and Holman, D. (2015).
Maintaining the monitoring of pup production at key Australian sea lion colonies in
South Australia (2014/2015). Final report to the Australian Marine Mammal Centre.
South Australian Research and Development Institute (Aquatic Sciences), Adelaide.
SARDI Publication Number F2010/00065-5. SARDI Research Report Series No. 871.
73pp.

CHAPTER 1: General Introduction
51
Hamer, D. J., Goldsworthy, S.D., Costa, D. P., Fowler, S. L., Page, B., and Sumner, M. D.
(2013). The endangered Australian sea lion extensively overlaps with and regularly
becomes by-catch in demersal shark gill-nets in South Australian shelf waters.
Biological Conservation 157, 386–400.
Hartley, P. H. T. (1948). The assessment of the food of birds. Ibis, 90 361– 381.
Hartmann, N., Reichwald, K., Wittig, I., Dro, S., Schmeisser, S., Lück, C., Hahn, C., Graf,
M., Gausmann, G., Terzibasi, E., Cellerino, A., Ristow, M., Brandt, U., Platzer, M.,
and Englert, C. (2011). Mitochondrial DNA copy number and function decrease with
age in the short-lived fish Nothobranchius furzeri. Aging Cell, 10, 824–831.
Hebert, P. D. N., A. Cywinska, S. L. Ball, and DeWaard, J. R. (2003). Biological
identifications through DNA barcodes. Proceedings of the Royal Society. B. 270,
313–321.
Hebert, P. D. N., and Gregory, T. R. (2005). The promise of DNA barcoding for taxonomy.
Systematic Biology, 54, 852–859.
Higgins, L.V. (1993) The nonannual, nonseasonal breeding cycle of the Australian sea lion,
Neophoca cinerea. Journal of Mammalogy, 74, 270–274.
Higgins, L.V., and Gass, L. (1993) Birth to weaning: parturition, duration of lactation, and
attendance cycles of Australian sea lions (Neophoca cinerea). Canadian Journal of
Zoology, 71, 2047–2055.
Hobson, K. A., Schell, D., Renouf, D., and Noseworthy, E. (1996). Stable-carbon and
nitrogen isotopic fractionation between diet and tissues of captive seals: implications
CHAPTER 1: General Introduction
52
for dietary reconstructions involving marine mammals. Canadian Journal of Fish and
Aquatic Science, 53, 528−53.
Hoffman, J. I., Kowalski, G. J., Klimova, A., Eberhart-Phillips, L. J., Staniland, I. J. and
Baylis, A. M. M. (2016). Population structure and historical demography of South
American sea lions provide insights into the catastrophic decline of a marine mammal
population. Royal Society Open Science, 1−17. doi: 10.1098/rsos.160291
Höss, M. (2000). Neanderthal population genetics. Nature, 404, 453–454.
Hückstädt, L. A., Koch, P. L., McDonald, B. I., Goebel, M. E., Crocker, D. E., and Costa, D.
P. (2012). Stable isotope analyses reveal individual variability in the trophic ecology
of a top marine predator, the southern elephant seal. Oecologia, 169,, 395–406.
http://doi.org/10.1007/s00442-011-2202-y
Hyslop, E. J. (1980). Stomach contents analysis – a review of methods and their application.
Journal of Fish Biology, 17, 411–429
Iverson, S. J., Field, C., Bowen, W., and Blanchard, W. (2004). Quantitative fatty acid
signature analysis: a new method of estimating predator diets. Ecological
Monographs, 74, 211-235.
Iverson, S. J., Springer, A. M., and Kitaysky, A. S. (2007). Seabirds as indicators of food web
structure and ecosystem variability: qualitative and quantitative diet analyses using
fatty acids. Marine Ecology Progress Series, 352, 235–244.
Jarman, S. N., Deagle, B. E., and Gales, N. J. (2004). Group-specific polymerase chain
reaction for DNA-based analysis of species diversity and identity in dietary samples.
Molecular Ecology, 13, 1313–1322.

CHAPTER 1: General Introduction
53
Jarman, S. N., McInnes, J. C., Faux, C., Polanowski, A. M., Marthick, J., Deagle, B. E.,
Southwell, C. and Emmerson, L. (2013). Adélie penguin population diet monitoring
by analysis of food DNA in scats. PLoS ONE, 8, p.e82227.
Khanam, S., Howitt, R., Mushtaq, M. and Russell, J. C. (2016). Diet analysis of small
mammal pests: A comparison of molecular and microhistological methods.
Integrative Zoology, 11, 98–110. doi: 10.1111/1749-4877.12172
King, R. A., Read, D. S., Traugott, M., and Sydmondson, W. O. C. (2008) Molecular analysis
of predation: a review of best practice for DNA-based approaches. Molecular
Ecology, 17, 947–963.
Kohn, M. H., and Wayne, R. K. (1997). Facts from feces revisited. Trends in Ecology and
Evolution, 12, 223-227.
Kvitrud, M. A., Riemer, S. D., Brown, R.F., Bellinger, M. R., and Banks, M.A. (2005).
Pacific harbor seals (Phoca vitulina) and salmon: genetics presents hard numbers for
elucidating predator-prey dynamics. Marine Biology, 147, 1459–1466.
Kelly, D. J., Robertson, A., Murphy, D., Fitzsimons, T., Costello, E., Gormley, E., Corner, L.
A. L., and Marples, N. M. (2012). Trophic enrichment factors for blood serum in the
European badger (Meles meles). PLoS ONE. 7, 1–5. doi: 10.1371/
journal.pone.0053071.
Kovacs, K. M., Aguilar, A., D. Aurioles, Gamboa, D.,Burkanov,V.,Campagna,C.,Gales,N.,
Gelatt, T., Goldsworthy, S., Goodman, S.J., Hofmeyr, G.J.G., Harkonen, T., Lowry,
L., Lydersen, C., Schipper, J., Sipila, T., Southwell, C., Stuart, S., Thompson, D., and
Trillmich, F. (2012). Global threats to pinnipeds. Marine Mammal Science, 28, 414–436.
doi: 10.1111/j.1748-7692.2011.00479.x

CHAPTER 1: General Introduction
54
Lea, M. A., Cherel, Y., Guinet, C., and Nichols, P. D. (2002). Antarctic fur seals foraging in
the Polar Frontal Zone: inter-annual shifts in diet as shown from fecal and fatty acid
analyses. Marine Ecology Progress Series, 245, 281–297.
Ling, J. K. (1992). Neophoca cinerea. Mammalian Species, 392, 1–7.
Lowther A. D., Harcourt R. G., Hamer, D. J., and Goldsworthy S. D. (2011). Creatures of
habit: foraging habitat fidelity of adult female Australian sea lions. Marine Ecology
Progress Series, 443, 249–263.
Lowther A. D., Harcourt, R. G., Goldsworthy, S. D., Stow, A. (2012). Population structure of
adult female Australian sea lions is driven by fine-scale foraging site fidelity. Animal
Behaviour, 83, 691–701.
Marlow, B. J. (1975). The comparative behaviour of the Australasian sea lions Neophoca
cinerea and Phocarctos hookeri (Pinnipedia: Otariidae). Mammalia, 39, 159–230.
Marshall, H. D., Hart K. A., Yaskowiak, G. B., Stenson, G. B., McKinnon, D., and Perry, E.
A. (2010). Molecular identification of prey in the stomach contents of Harp Seals
(Pagophilus groenlandicus) using species-specific oligonucleotides. Molecular
Ecology Resources, 10, 181–189.
Matejusová, I., Doig, F., Middlemas S. J., S. Mackay, Douglas, A., Armstrong, J.D.,
Cunningham, C.O., and Snow, M. (2008). Using quantitative real-time PCR to detect
salmonid prey in scats of grey Halichoerus grypus and harbour Phoca vitulina seals in
Scotland — an experimental and field study. Journal of Applied Ecology, 45, 632–
640.

CHAPTER 1: General Introduction
55
McIntosh, R. R., Page, B., and Goldsworthy, S. D (2006). Dietary analysis of regurgitates and
stomach samples from free-living Australian sea lions. Wildlife Research, 33, 661–
669.
Méheust, E., Alfonsi, E., Le Ménec, P., Sami Hassani and Jean-Luc Jung (2015). DNA
barcoding for the identification of soft remains of prey in the stomach contents of grey
seals (Halichoerus grypus) and harbour porpoises (Phocoena phocoena). Marine
Biology Research, 11, 385–395, DOI: 10.1080/17451000.2014.943240.
Meynier, L., Morel, P. C. H., Mackenzie, D. D. S., MacGibbon, A., Chilvers, B. L., and
Duignan, P. J. (2008). Proximate composition, energy content, and fatty acid
composition of New Zealand marine species from Campbell Plateau, New Zealand.
New Zealand Journal of Marine and Freshwater Research, 42, 425–437. doi: 0028–
8330/08/4204–0425.
McInnes, J. C., Emmerson, L., Southwell, C., Faux, C., and Jarman, S. N. (2016).
Simultaneous DNA-based diet analysis of breeding, non-breeding and chick Adélie
penguins. Royal Society Open Science, 3, 150443.
Miller, T. W., Brodeur, R. D., and Rau, G. H. (2008). Carbon stable isotopes reveal relative
contribution of shelf-slope production to the northern California Current pelagic
community. Limnology and Oceanography, 53, 1493–1503.
Murie, D. J., and Lavigne D. M. (1986). Interpretation of otoliths in stomach content analyses
of phocid seals: Quantifying fish consumption. Canadian Journal of Zoology, 64,
1152–1157.
CHAPTER 1: General Introduction
56
Mullis, K., Faloona, F., Scharf, S., Saiki, R., Horn, G., and Erlic, H. (1986). Specific
Enzymatic amplification of DNA in vitro: the polymerase chain reaction. Cold Spring
Harbor Symposia on Quantitative Biology, 51, 263–273.
Mullis, K. B., and Faloona, F. A. (1987). Specific synthesis of DNA in vitro via a poly-
merase-catalyzed chain reaction. Methods in Enzymology, 155, 335–350.
Newsome, S. D., Etnier, M. A., Kurle, C. M., Waldbauer, J. R., Chamberlain, C. P., and
Koch, P. L. (2007). Historic decline in primary productivity in western Gulf of Alaska
and eastern Bering Sea: Isotopic analysis of northern fur seal teeth. Marine Ecology
Progress Series, 332, 211–224. http://doi.org/10.3354/meps332211
Nordstrom, C. A., Wilson L. J., Iverson S. J., and Tollit, D. J. (2008). Evaluating quantitative
fatty acid signature analysis (QFASA) using harbour seals Phoca vitulina richardsi in
captive feeding studies. Marine Ecology Progress Series, 360, 245–263.
Page, B., McKenzie, J., McIntosh, R., Baylis, A., Morrissey, A., Calvert, N., Haase, T.,
Berris, M., Dowie, D., Shaughnessy, P. D., and Goldsworthy, S. D. (2004).
Entanglement of Australian sea lions and New Zealand fur seals in lost fishing gear
and other marine debris before and after Government and industry attempts to reduce
the problem. Marine Pollution Bulletin, 49, 33–42.
Page, B., McKenzie, J., and Goldsworthy, S. D. (2005). Dietary resource partitioning among
sympatric New Zealand and Australian fur seals. Marine Ecology Progress Series,
293, 283–302.
Phillips, D. L. (2001). Mixing models in analyses of diet using multiple stable isotopes: a
critique. Oecologia, 127, 166–170.

CHAPTER 1: General Introduction
57
Parnell, A. C., Inger, R., Bearhop, S., and Jackson, A. L. (2010). Source partitioning using
stable isotopes: Coping with too much variation. PLoS ONE, 5. 1–5. e9672.
doi:10.1371/journal.pone.0009672
Pierce, G. J., Santos, M. B., Learmonth, J. A., Mente, E., and Stowasser, G. (2004). Methods
for dietary studies on marine mammals. Investigating the roles of cetaceans in marine
ecosystems. Scientific Exploration of the Mediterranean Sea Workshop Monographs
25. CIESM, Monaco. Pages 29–36.
Pitcher, K. W. (1981). Stomach contents and faeces as indicators of harbor seal, Phoca
vitulina, foods in the Gulf of Alaska. Fishery Bulletin 78, 797–798.
Pompanon, F., Deagle, B. E., Symondson, W. O. C., Brown, D. S., Jarman, S. N., and
Taberlet, P. (2012). Who is eating what: diet assessment using next generation
sequencing. Molecular Ecology, 21, 1931–1950.
Post, D. M. (2002) Using stable isotopes to estimate trophic position: models, methods, and
assumptions. Ecology, 83, 703−718.
Purcell, M., Mackey, G., LaHood, E, Barstrup, G., Huber, H., and Park, L. (2000). Genetic
identification of salmonid bone from harbor seal scat. In: Marine Mammal Protection
Act and Endangered Species Act implementation program 1999 (eds. Lopez A,
DeMaster D), pp. 129-142. U.S. Department of Commerce, Seattle, WA.
Purcell, M., Mackey G., LaHood, E. (2004). Molecular methods for the genetic identification
of salmonid prey from pacific harbor seal (Phoca vitulina richardsi) scat. Fishery
Bulletin, 102, 213–220.

CHAPTER 1: General Introduction
58
Quéméré, E., Hibert, F., C. Miquel, Lhuillier, E., Rasolon-draibe, E., Champeau, J.,
Rabarivola, C., Nusbaumer, L., Chatelain, C., Gautier, L., Ranirison, P., Crouau-Roy,
B.,Taberlet, P. and Chikhi, L. (2013). A DNA Metabarcoding Study of a primate
dietary diversity and plasticity across its entire fragmented range. PLoS ONE, 8,
e58971. doi:10.1371/journal.pone.0058971.
Richardson, K. C., and Gales N. J. (1987). Functional morphology of the alimentary tract of
the Australian sea-lion, Neophoca cinerea. Australian Journal of Zoology, 35, 219–
226. doi:10.1071/ZO9870219.
Riemann, L., Alfredsson, H., Hansen, M. M., Als, T. D., Nielsen, T. G., Munk, P., Aarestrup,
K., Maes, G. E., Sparholt, H., Pedersen, M. I., Bachler, M., and Castonguay, M.
(2010). Qualitative assessment of the diet of European eel larvae in the Sargasso Sea
resolved by DNA barcoding. Biology Letters, 6, 819-822. 10.1098/rsbl.2010.0411.
Robertson, B. C., and Chilvers, B. L. (2011). The population decline of the New Zealand sea
lion Phocarctos hookeri: a review of possible causes. Mammal Review, 41, 253–275.
Rosel P. E. and Kocher T. D (2002). DNA-based identification of larval cod in stomach
contents of predatory fishes. Journal of Experimental Marine Biology and Ecology
267, 75–88.
Roth, J. D. and Hobson, K. A. (2000). Stable carbon and nitrogen isotopic fractionation
between diet and tissue of captive red fox: implications for dietary reconstruction.
Canadian Journal of Zoology, 78, 848–852.
Schaufler, L., Logerwell, E., and Vollenweider, J. (2006). Geographical Variation in Steller
sea lion prey quality in Alaska. Pages 117-129 in ‘Sea Lions of the World’ (A. W.

CHAPTER 1: General Introduction
59
Trites, D. P. Atkinson, D. P. DeMaster, L. W. Fritz, T. S. Gelatt, L. D. Rea and
W. M. Wynne, eds. Alaska Sea Grant, Fairbanks, AK.
Scherer, R. D., Doll, A. C., Rea, L. D., Christ, A. M., Stricker, C. A., Witteveen, B., Kline, T.
C., Kurle, C. M., and Wunder, M. B. (2015). Stable isotope values in pup vibrissae
reveal geographic variation in diets of gestating Steller sea lions Eumetopias jubatus.
Marine Ecology Progress Series, 527, 261–274. http://doi.org/10.3354/meps11255.
Shaughnessy, P. D., Goldsworthy, S. D., Hamer, D., Page, B., and R. R. McIntosh (2011).
Australian sea lions Neophoca cinerea at colonies in South Australia: distribution and
abundance, 2004 to 2008. Endangered Species Research, 13, 87 – 98.
Shirasago-German, B., Perez-Lezama, E. L., Chavez, E. A., and Garcia-Morales, R. (2015).
Influence of El Niño-Southern Oscillation on the population structure of a sea lion
breeding colony in the Gulf of California. Estuarine, Coastal and Shelf Science, 154,
69–76.
Shokralla, S., Spall, J. L., Gibson, J. F., and Hajibabaei, M. (2012). Next-generation
sequencing technologies for environmental DNA research. Molecular Ecology,
21,1794–1805.
Soininen, E. M., Valentini, A., Coissac, E., Miquel, C., Gielly, L., Brochmann, C., and
Taberlet, P. (2009). Analysing diet of small herbivores: the efficiency of DNA
barcoding coupled with high-throughput pyrosequencing for deciphering the
composition of complex plant mixtures. Frontiers in Zoology, 6, 16.
Sousa, L. L., Xaviera, R., Costaa, V, Humphries, N. E., Truemann, C., Rossa, R., Simsa, D.
W., and Queiroz, N. (2016). DNA barcoding identifies a cosmopolitan diet in the
CHAPTER 1: General Introduction
60
ocean sunfish. Scientific Reports 6, Article number: 28762 (2016)
doi:10.1038/srep28762.
Springer, A. M., Estes, J. A., van Vliet, G. B., Williams, T. M., Doak, D. F. , Danner, E.
M., Forney, K. A. and Pfister (2003). Sequential megafaunal collapse in the North
Pacific Ocean: an ongoing legacy of industrial whaling? Proceedings of the National
Academy of Sciences of the United States of America, 100,12223–12228.
Staniland, I. J. (2002). Investigating the biases in the use of hard prey remains to identify diet
composition using Antarctic fur seals (Arctocephalus gazella) in captive feeding
trials. Marine Mammal Science, 18, 223–243.
Sydmonson, W. O. C. (2002). Molecular identification of prey in predator diets. Molecular
Ecology, 11, 627–641.
Tollit, D. J, Steward, M. J, Thompson, P. M, Pierce, G. J., Santos, M. B., and Hughes, S.
(1997). Species and size differences in the digestion of otoliths and beaks:
implications for estimates of pinniped diet composition. Canadian Journal of
Fisheries Aquatic Science, 54, 105–119.
Tollit, D. J, Heaslip, S. G, Deagle, B. E, Iverson, S. J., Joy, R., Rosen, D. A. S., and Trites A.
W. (2006). Estimating diet composition in sea lions: which technique to choose? In
Sea lions of theWorld (A.W. Trites, S. K. Atkinson, D. P. DeMaster, L.W. Fritz, T. S.
Gelatt, L. D. Rea and K M Wynne eds.). Alaska Sea Grant College Program
University of Alaska Fairbanks USA, p 293–307.
Tollit, D. J., Heaslip, S. G., Barrick, R. L., and Trites, A. W. (2007). Impact of diet-index
selection and the digestion of prey hard remains on determining the diet of the Steller
sea lion (Eumetopias jubatus). Canadian Journal of Zoology 85, 1–15.
CHAPTER 1: General Introduction
61
Tollit, D. J., Schulze A.D., Trites, A. W., Olesiuk, P. F., Crockford, S. J., Gelatt, T. S., Ream,
R.R., and Miller, K.M. (2009). Development and application of DNA techniques for
validating and improving pinniped diet estimates. Ecological Applications, 19, 889–
905.
Tollit, D., Pierce, G. J., Hobson, K. A., Bowen, W. D., and Iverson, S. J. (2010). Diet. Pages
165–190 in I. L. Boyd, W. D. Bowen and S. J. Iverson, eds. Marine mammal ecology
and conservation: A handbook of techniques. Oxford University Press., Oxford, U.K.
Trillmich, F. and Limberger, D. (1985) Drastic effects of El Niño on Galapagos pinnipeds.
Oecologia, 67, 19–22.
Trillmich, F. and Dellinger, T. (1991). The effects of El Niño on Galapagos pinnipeds. In:
Pinnipeds and El Niño: Responses to Environmental Stress. Ecological Studies (Ed.
by F. Trillmich and K. A. Ono). Springer-Verlag, Berlin.
Trites, A. W. and Donnelly, C. P. (2003). The decline of Steller sea lions Eumetopias jubatus
in Alaska, a review of the nutritional stress hypothesis. Mammal Review, 33, 3 – 28.
Trites, A. W., Miller, A. J., Maschner, H. D. G., Alexander, M. A., Bograd, S. J., Calder, J.
and Winship, A. J. (2007). Bottom-up forcing and the decline of Steller sea lions
(Eumetopias jubatus) in Alaska: assessing the ocean climate hypothesis. Fisheries
Oceanography, 16, 46–67. http://doi.org/10.1111/j.1365-2419.2006.00408.x
Ward, R. D., Zemlak, T. S., Innes, B. H., Last, P. R., and Hebert, P. D. N. (2005). DNA
barcoding Australia’s fish species. Philosophical Transactions of the Royal Society B.
Biological Sciences, 360, 1847–1857.

CHAPTER 1: General Introduction
62
Ward, R. D., Holmes B. H., White, W. T., and Last, P. R. (2008). DNA barcoding
Australasian chondrichthyans: results and potential uses in conservation. Australian
Journal of Marine and Freshwater Research, 59, 57–71.
Wilkinson, I. S., Duignan, P. J., Grinberg, A., Chilvers B. L., and Robertson, B. C. (2006).
Klebsiella pneumoniae epidemics: possible impact on New Zealand sea lion
recruitment. Pages 455-471 in (A.W. Trites, D. P. DeMaster, L. W. Fritz, L. D. Gelatt,
L. D. Rea, and K. M. Wynne, eds.) Sea lions of the world. Alaska Sea Grant,
Fairbanks, AK.
Willerslev, E., Davison, J., Moora, M., Zobel, M., Coissac, E., Edwards, M.E., Lorenzen, E.
D., Vestergard, M., Gussarova, G., Haile, J., Craine, J., Gielly, L., Boessenkool, S.,
Epp, L. S., Pearman, P. B., Cheddadi, R., Murray, D., Brathen, K.A., Yoccoz, N.,
Binney, H., Cruaud, C., Wincker, P., Goslar, T., Alsos, I. G., Bellemain, E., Brysting,
A.K., Elven, R., Sonstebo, J. H., Murton, J., Sher, A., Rasmussen, M., Ronn, R.,
Mourier, T., Cooper, A., Austin, J., Moller, P., Froese, D., Zazula, G., Pompanon, F.,
Rioux, D., Niderkorn, V., Tikhonov, A., Savvinov, G., Roberts, R.G., MacPhee,
R.D.E., Gilbert, M.T.P., Kjaer, K.H., Orlando, L., Brochmann, C., and Taberlet, P.
(2014). Fifty thousand years of Arctic vegetation and megafaunal diet. Nature, 506,
47e51.

63
CHAPTER 2
Diet of the endangered Australian sea lion (Neophoca
cinerea) in South Australia.

CHAPTER 2: Diet of the endangered Australian sea lion
64
ABSTRACT
Management measures to assist the conservation of threatened and endangered species
typically require knowledge of diet, because diet provides insights into resource and habitat
requirements and threats to population persistence. Yet, for the endangered and endemic
Australian sea lion (Neophoca cinerea) (ASL), diet is little studied and relatively unknown.
To redress this fundamental knowledge gap, ASL diet was investigated using the most
comprehensive dataset to date and provide information on the prey species, size, and biomass
at breeding colonies throughout South Australia (where 86 % of the population breeds). Prey
composition for the sites surveyed consisted of five species of cephalopods, ten teleost fish
and a penaeid prawn; all benthic-demersal taxa that predominantly inhabit coastal and
continental shelf seafloor. Cephalopods were the most frequently encountered and
numerically abundant prey, accounting for ~80% of all dietary items identified. Octopodidae
and Loliginidae squid were the most common prey and contributed the largest biomass,
highlighting their importance as prey. Although fish were poorly represented by hard parts in
the diet, most were medium to larger species (~ 200 mm to > 500 mm), and typically benthic
dwelling. This study highlights the importance of cephalopods in ASL diet and the potential
for competition between ASL and commercial fisheries. Given the continued decline of ASL
in South Australia, resource competition with fisheries merits further investigation.

CHAPTER 2: Diet of the endangered Australian sea lion
65
STATEMENT OF AUTHORSHIP
Title of Paper
Diet diversity and estimates of prey size of the endangered
Australian sea lion (Neophoca cinerea) in South Australia.
Publication Status Published Accepted for Publication
Submitted for PublicationUnpublished and Unsubmitted work written in manuscript style
Publication Details In review
Principal Author
Name of Principal Author (Candidate) Kristian Peters
Contribution to the Paper
Conceived the study, secured funding, undertook fieldwork, performed analysis on all samples,
analysed and interpreted data, performed statistical analysis, wrote manuscript and acted as
corresponding author.
Overall percentage (%) 90%
Certification: This paper reports on original research I conducted during the period of my Higher Degree by
Research candidature and is not subject to any obligations or contractual agreements with a
third party that would constrain its inclusion in this thesis. I am the primary author of this paper.
Signature
Date 28 October 2016
Co-Author Contributions
By signing the Statement of Authorship, each author certifies that:
the candidate’s stated contribution to the publication is accurate (as detailed above);
permission is granted for the candidate in include the publication in the thesis; and
the sum of all co-author contributions is equal to 100% less the candidate’s stated contribution.
Name of Co-Author Rebecca McIntosh
Contribution to the Paper Provided comments to manuscript draft and advice with analysis
Signature
Date 28 October 2016
Name of Co-Author
Peter Shaughnessy

CHAPTER 2: Diet of the endangered Australian sea lion
66
Contribution to the Paper
Contributed to conception of paper, provided comments to manuscript draft and supervision
Signature
Date 28 October 2016
Name of Co-Author Brad Page
Contribution to the Paper Contributed to conception of paper, provided comments to manuscript draft and advice with
analysis
Signature Date 28 October 2016
Name of Co-Author Alastair Baylis
Contribution to the Paper Provided comments to manuscript draft
Signature
Date 28 October 2016
Name of Co-Author Simon Goldsworthy
Contribution to the Paper Conceived the study, secured funding, provided comments to manuscript drafts and
supervision.
Signature
Date 28 October 2016

CHAPTER 2: Diet of the endangered Australian sea lion
67
INTRODUCTION
Harvesting and habitat loss have driven global declines in marine predators, many of which
are now listed as threatened or endangered (Myers and Worm 2003; Myers et al. 2007; Lotze
and Worm 2009). Contemporary conservation measures for threatened and endangered
species typically require knowledge of diet, because diet provides insights into resource and
habitat requirements that ultimately underpin individual fitness and reproductive success.
Accordingly, knowledge of diet provides insights into threats to population persistence, and
assists in disentangling the factors influencing population trends (Goodman-Lowe 1998;
Matejusová et al. 2008; Meynier et al. 2009).
The Australian sea lion (Neophoca cinerea) (ASL) is an endangered species (IUCN,
Goldsworthy, 2015), that is endemic to Australia, with a breeding distribution from the
Houtman Abrolhos Islands, Western Australia (28.67° S, 113.82° E) to the Pages Islands
(35.77° S, 138.29° E), South Australia (Goldsworthy and Gales, 2008; Campbell et al. 2008a;
Goldsworthy et al. 2015). The population has been estimated at 14,780 individuals
(Shaughnessy et al. 2011), but recently has been revised to approximately 12,000, making
ASL one of the least numerous seal species in the world, and one that has shown limited
recovery post 18th and 19th century sealing (Ling 1999; Gales et al. 2000; Kirkwood et al.
2010; Goldsworthy et al. 2015). Several unique life history characteristics have likely
contributed to their protracted recovery. These include an extended gestation and lactation
period (17.5-month) resulting in a low lifetime fecundity (Ling and Walker 1978; Higgins
1993; Higgins and Gass 1993; Gales et al. 1994), and breeding asynchrony with extreme
female natal site philopatry, which limits dispersal among colonies (Gales et al. 1994;
Campbell et al. 2008a; Lowther et al. 2011). In addition, incidental fisheries by-catch and
episodic disease has impeded recovery at a number of breeding sites (Page et al. 2004;

CHAPTER 2: Diet of the endangered Australian sea lion
68
Goldsworthy and Page 2007; Campbell et al. 2008b; Hamer et al. 2013; Goldsworthy et al.
2010; Marcus et al. 2014, 2015), with recent surveys indicating ASL populations are
declining across their range (Goldsworthy et al. 2010, 2015). Their extreme life-history
constraints, combined with stable or declining populations and fisheries induced mortality,
indicates ASL remain at further risk of decline, highlighting the need to improve knowledge
of their key conservation requirements.
ASL employs multiple foraging strategies to exploit a variety of habitats in search of
predominantly demersal and benthic prey (Fowler et al. 2007; Costa and Gales 2003;
Fragnito, 2013). In South Australia, ASL forage in continental shelf waters (typically <200
m) of the eastern Great Australian Bight (GAB) and adjacent Gulf St Vincent and Spencer
Gulf, with recent studies revealing colony-level fidelity to local habitats and individual
foraging specialisation (Goldsworthy et al. 2009; Fowler et al. 2007; Lowther et al. 2011,
2012; Lowther and Goldsworthy 2012). These studies have made considerable advances in
understanding the at-sea movements and dive behaviour of ASL, but our understanding of
ASL diet remains limited.
Information on the diet of otariid seals is typically derived from the identification of hard
prey structures (such as fish otoliths, vertebrae and cephalopod beaks) obtained from faeces
and stomach material. As central place foragers, otariids undertake foraging trips at sea, and
return to haul-outs and breeding colonies that facilitate the collection of samples, which are
typically cost effective to analyse and provide taxonomic prey information (Gales et al. 1993;
Gales and Pemberton 1994; Tollit et al. 2006; Casper et al. 2006, 2007). Compared to
biochemical (e.g. fatty acids, stable isotope) and DNA-based methods, analysis by hard parts
is currently the only method able to accurately reconstruct prey biomass and also provides a

CHAPTER 2: Diet of the endangered Australian sea lion
69
priori knowledge of diet that often underpins models used in the analysis of biochemical data
(e.g. Iverson et al. 2004; Baylis and Nichols 2009; Deagle et al. 2007, 2009).
Based on information derived from limited diet studies, ASL target a range of benthic
cephalopod, teleost fish, crustacean and cartilaginous prey species (Marlow 1975; Walker
and Ling 1981; Richardson and Gales 1987; Gales and Cheal 1992; McIntosh et al. 2006;
Gibbs 2008; Fragnito, 2013). However, little information exists on whether diet or prey size
is consistent between ASL breeding colonies. Because hard prey parts are poorly preserved in
faeces and regurgitates, such studies require large sample sizes, and previous dietary studies
emphasise the limitations of using these samples to resolve ASL diet (Gales and Cheal 1992;
McIntosh et al. 2006). However, given the lack of dietary information on ASL, such an
approach is still important, because it provides a diagnostic method to identify prey taxa.
This study presents the most comprehensive and rigorous study of ASL diet to date across
their South Australian breeding range. Here, hard-part analyses are utilised to examine
whether diagnostic remains recovered from faeces and regurgitate can provide useful dietary
information for ASL. Hard parts are known to digest at different rates, which can result in
biased estimates of prey diversity (Hyslop 1980; Dellinger and Trillmich 1987; Gales and
Pemberton 1994; Tollit et al. 1997, 2003; Bowen 2000; Staniland 2002; Yonezaki et al.
2003). Nevertheless, intact prey items and approximation of their proportional biomass can
provide an alternative measure of relative importance that may differ from results derived
from qualitative occurrence and abundance hard part indices (Tollit et al. 2009, 2015). As
basic dietary information for ASL is limited with prey size estimates restricted to two small
studies (McIntosh et al. 2006; Gibbs, 2008), any additional information on the use of prey
resources will assist in ASL conservation management. The aims of the present study were
to: i) describe the diet of ASL based on the analyses of hard parts from faeces and

CHAPTER 2: Diet of the endangered Australian sea lion
70
regurgitates collected across the ASL South Australian breeding range and ii) using
regression equations, estimate the length and biomass of the prey consumed.
MATERIALS AND METHODS
Sample collection
Faecal (n = 345) and regurgitate (n = 8) samples were collected from nine ASL breeding
colonies in the eastern Great Australian Bight (GAB) in South Australia between 2003 and
2007 (Fig 1. and Table 1). Lounds Island (LoI) (32.27° S, 133.37° E), Breakwater Island
(BwI) (32.32° S, 133.56° E), Lilliput Island (LI) (32.45° S, 133.67° E), Blefuscu Island (BI)
(32.46° S, 133.64° E), and West Island (WI) (32.51° S, 133.25° E) are in the Nuyts
Archipelago. Olive Island (OI) (32.72° S, 133.97° E) and Pearson Island (PI) (33.95° S,
134.26° E) are further south in eastern GAB. Dangerous Reef (DR) (34.82° S, 136.22° E) is
in Spencer Gulf and Seal Bay is on Kangaroo Island (KI) (36.00° S, 137.33° E), which was
the southern-most colony sampled. Seal Bay, DR, and LI colonies were sampled on multiple
occasions, and all other colonies sampled once (Fig. 1, Table 1).

CHAPTER 2: Diet of the endangered Australian sea lion
71
Figure 1. Location of ASL breeding colonies where faecal (n = 345) and regurgitate (n = 8)
samples were collected in South Australia. Bathymetric contours are also shown.

CHAPTER 2: Diet of the endangered Australian sea lion
72
Table 1. The distribution of sampling effort, frequency of occurrence (FO) and numerical
abundance (NA) of diagnostic prey structures (cephalopod beaks, fish otoliths, vertebral
processes and crustacean carapaces) recovered from faeces (n = 345) and regurgitates (n = 8)
from nine breeding colonies of ASL in South Australia between 2003 and 2007. Unidentified
fish otoliths (n = 20) are not included.
Hard part analysis
Hard-parts of prey (fish otoliths, cephalopod beaks, bones, eye lenses, feathers, crustacean
carapaces, and fragments) were isolated from each faecal sample by washing the sample
through 1.0 and 0.5 mm nested sieves. Fish otoliths and cephalopod beaks were photographed
and measured using digital microscopy supported by image analysis software Image Pro
5.1©. In all instances, otolith length (OL), upper and lower rostral length (URL, LRL), and
Sample type and site n Year Season FO NARatio of diagnostic items
(cephalopod:fish:crustacea)
Faeces
Dangerous Reef 26 2003 Spring 6 22 22 : 0 : 0
7 2005 Winter 2 2 2 : 0 : 0
6 2006 Spring 4 6 0 : 6 : 0
Pearson Island 49 2005 Winter 25 54 45 : 9 : 0
Kangaroo Island 38 2005 Spring 6 6 5 : 1 : 0
36 2006 Summer 12 20 20 : 0 : 0
14 2006 Autumn 1 1 0 : 1 : 0
29 2006 Winter 4 3 1 : 2 : 0
11 2007 Summer 1 1 1 : 0 : 0
25 2007 Autumn-Winter 4 4 4 : 0 : 0
23 2007 Spring 7 15 15 : 0 : 0
Olive Island 13 2007 Autumn-Winter 3 3 3 : 0 : 0
Lilliput Island 11 2005 Winter 6 50 49 : 1 : 0
10 2007 Autumn 4 5 5 : 0 : 0
Blefuscu Island 4 2007 Autumn 1 1 1 : 0 : 0
West Island 33 2005 Winter 17 61 37 : 24 : 0
Lounds Island 10 2005 Spring 2 2 2 : 0 : 0
Total 345
Regurgitates
Breakwater Island 1 2007 Winter 1 38 35 : 1 : 2
Kangaroo Island 2 2006 Winter 2 6 6 : 0 : 0
1 2007 Spring 1 3 3 : 0 : 0
Dangerous Reef 1 2005 Summer 1 12 9 : 0 : 3
1 2005 Spring 1 1 1 : 0 : 0
Pearson Island 2 2005 Winter 2 8 7 : 1 : 0
Total 8

CHAPTER 2: Diet of the endangered Australian sea lion
73
upper and lower hood length (UHL, LHL) of well-preserved cephalopod beaks were
measured using digital callipers (0.01 mm) to supplement the microscopy results. Electronic
scales (accuracy 0.0001 g) were used to determine otolith weight (OW). Diagnostic prey
items were identified to the lowest taxon by comparison with reference collections and
atlases (e.g. Lu and Ickeringill, 2002; Furlani et al. 2007). Where fish otoliths and
cephalopod beaks were not differentiated to species level, the next closest taxonomic group
was used (e.g., genus, family). Relative biomass, fish length (Furlani et al. 2007), and
cephalopod mantle length (Lu and Ickeringill 2002) were determined from the fish otoliths
and cephalopod beaks respectively using available regression equations (Lu and Ickeringill
2002; Furlani et al. 2007; McLeay et al. 2009; Wiebkin 2012) (Table 2). Where biomass or
length regression equations were not available for a particular species, I used equations for a
similar species. Otherwise, only counts of abundance were determined. For example, the size
of unidentified octopus (Octopus spp.) was determined using regression equations for two
sympatric species: O. berrima and O. maorum, which are common cephalopod taxa found in
South Australia (Reid, 2016).

CHAPTER 2: Diet of the endangered Australian sea lion
74
Table 2. Regression formulae used to estimate prey mass (g) and length (mm) from fish
otoliths and cephalopod beaks recovered from faeces and regurgitates of ASL. Abbreviations:
Mass (M), (Total Length (TL), Fork Length (FL), Standard Length (SL), Otolith Wei ight
(OW), Otolith Length (OL) (fish only), and Mantle Length (ML), Upper Hood Length
(UHL), Lower Hood Length (LHL), Upper Rostal Length (URL), Lower Rostal Length
(LRL) (cephalopods only). Source of information for regression equations: (A) McLeay et al.
2009; (B) Furlani et al. 2007; (C) Wiebkin, A. (2012), and (D) Lu and Ickeringill, 2002.
Data analysis
Prey composition was assessed using frequency of occurrence (FO) (number of samples
containing a given prey taxa) and numerical abundance (number of prey structures of each
prey taxa), which were also represented as i) percentage of each functional taxonomic group
and ii) percentage of all diagnostic prey items recovered. Mean, median and range estimates
Prey typeSpecies used for
regression equationMass regression equation (g)
Length regression
equation Source
Fish otoliths
Arripis georgianus Same species M = 5e-06
x FL
3.25FL = 25.606 x OL
0.98A
Foetorepus calauropomus Same species M = 4.174 x 10⁻⁵
TL2.65
TL = 258.526 OW0.247
B
Monacanthidae Meuschenia scaber M = 5.114 x 10⁻⁵
TL2.79
TL = 250.385 OW0.084
B
Parapriacanthus elongatus Same species M = 3e-05
x FL2.81
FL = 27.3 OL0.95
A, C
Platycephalidae Platycephalus richardsoni M = 6.144 x 10⁻⁶
TL3.029
TL = 339.339 OW0.084
A
Pseudophycis bachus Same species M = 1.017 x 10⁻⁷
TL3.838
TL = 6.33 x OL1.62
B
Sillago bassensis Same species M = 1.11 x 10⁻⁵
SL3.02
SL = 16.78 OL1.04
B
Triglidae Lepidotrigla modesta M = 1.154 x 10⁻⁴
FL2.576
FL = 208.721 OW0.002
B
Cephalopod beaks
Upper
Octopus berrima Same species M = e0.44 + 3.53 (ln UHL)
ML = -11.58 +15.99 UHL D
Octopus maorum Same species M = e0.73 + 2.64 (ln UHL)
ML = -55.57 + 20.67 UHL D
Octopus sp. O. berrima M = e0.44 + 3.53 (ln UHL)
ML = -11.58 +15.99 UHL D
Nototodarus gouldi Same species M = e0.64 + 2.78 (ln URL)
ML = 57.75 + 29.90 URL D
Sepioteuthis australis Same species M = e2.07 + 2.26 (ln URL)
ML = -21.30 + 63.83 URL D
Sepia apama Same species M = e-5.78 + 3.6 (ln UHL)
ML = -8.4 + 7 UHL D
Sepia sp. 2 Sepia sp. M = e-2.16 + 2.68 (ln UHL)
ML = 13.83 + 6.66 UHL D
Ommastrephidae other N. gouldi M = e0.64 + 2.78 (ln URL)
ML = 57.75 + 29.90 URL D
Lower
Octopus berrima Same species M = e0.75 + 3.23 (ln LHL)
ML = -10.08 + 20.05 LHL D
Octopus maorum Same species M = e2.14 + 2.50 (ln LHL)
ML = -43.69 + 29.18 LHL D
Octopus sp. O. berrima M = e0.75 + 3.23 (ln LHL)
ML = -10.08 + 20.05 LHL D
Nototodarus gouldi Same species M = e0.80 + 2.86 (ln LRL)
ML = 41.88 + 33.99 LRL D
Sepioteuthis australis Same species M = e1.71 + 3.34 (ln LRL)
ML = -20.78 + 67.89 LRL D
Sepia sp. 1 Sepia sp. M = e0.70 + 2.51 (ln LHL)
ML = 18.09 + 16.50 LHL D
Ommastrephidae other N. gouldi M = e0.80 + 2.86 (ln LRL)
ML = 41.88 + 33.99 LRL D

CHAPTER 2: Diet of the endangered Australian sea lion
75
of prey biomass (grams (g) ± standard deviation (sd)) and overall prey size (mm ± sd)
consumed were determined by calculating the minimum number of individuals (MNI) in each
faecal or regurgitate sample, which was estimated from the maximum count of right or left
otoliths, and of lower or upper cephalopod beaks of each taxa. Where remains were
identifiable but not quantifiable using regression equations (e.g. vertebrae of leatherjackets
(Monacanthidae)), only qualitative counts of MNI were determined. For example, multiple
Monacanthidae vertebrae in a sample were counted as one individual if otoliths of this
taxonomic group were absent.
One-way analysis of variance (ANOVA), or the non-parametric equivalent were used to
assess differences in the size of prey recovered between faeces and regurgitates, as well as
any biomass differences between seasons and years. Differences in prey composition were
assessed between locations using non-parametric analysis of similarity (ANOSIM) on a Bray-
Curtis similarity matrix reinforced using the permutation multivariate analysis procedure
(PERMANOVA) in Primer (Primer version 6.0, PRIMER-E Ltd., Plymouth, UK) (P ≤ 0.05).
Similarity or dissimilarity percentages (SIMPER) (Clarke and Warwick 1993) were used to
identify prey responsible for group differences. To make data comparable between locations,
species abundances were initially standardised by dividing the number of prey items of each
species by the overall abundance data. The data for each location was then represented as a
proportion of all species recovered.
RESULTS
Prey hard-parts
In total, 246 (71.3%) faeces contained skeletal structures of prey, as did all eight regurgitates.
Except for cephalopod beaks (n = 273) and intact fish otoliths (n = 46), most prey structures
were highly degraded or damaged. Altogether, 220 (63.8 %), 132 (38.3 %), and 17 (4.9 %)

CHAPTER 2: Diet of the endangered Australian sea lion
76
faecal samples contained the remains of fish, cephalopods and crustaceans, respectively.
Cephalopods were identified in all regurgitates, fish remains in four (50%) and crustaceans
were recovered in two regurgitates (25%). Three-hundred and twenty-four prey items
(cephalopod beaks, fish otoliths, vertebrae and crustacean carapace) recovered from faeces (n
= 255) and regurgitates (n = 69) were identified to family, genus or species. Twenty fish
otoliths were not identified because they were damaged (Table 3).
One-hundred and ten faecal samples (31.9 %) contained diagnostic prey items. Of these, 80
(23 %) contained cephalopod beaks (n = 212) and 23 (6.7 %) contained either fish otoliths (n
= 54) and/or species-specific fish vertebrae (e.g., Monacanthidae) (n = 12). Prey represented
ten families of fish and four families of cephalopod. Six fish and five cephalopod taxa were
identified to species with three cephalopod taxa identified to genus (Table 3). Regurgitates
comprised 61 cephalopod beaks (91 %), five prawn carapaces (7.5 %) and three fish otoliths.
One fish, one crustacean, and four cephalopod taxa were identified to species, and two
cephalopods to genus level.
Diet diversity
Fifteen taxonomic families of prey were identified across all samples collected (Table 3).
Four fish (Platycephalidae, Monacanthidae, Triglidae and Serranidae) and two cephalopod
taxa (Loliginidae and Ommastrephidae) were identified to family level, and two cephalopod
taxa were identified to genus level (Octopus sp. and Sepia sp.) (Table 3). The most abundant
prey identified from hard parts were cephalopods, which comprised 79 % (n = 273) of the
total number of diagnostic items recovered and identified. Numerically, the most common
cephalopod families were Octopodidae (65 %), Loliginidae (squid) (18%) and Sepiidae
(cuttlefish) (8%), which was reflected in the frequencies of occurrence recovered (Table 3). A
large quantity of Octopodidae beaks (n = 131, 48%) were damaged or eroded and could only

CHAPTER 2: Diet of the endangered Australian sea lion
77
be assigned to the genus Octopus sp. The southern-keeled octopus (Octopus berrima) and
Maori octopus (Octopus maorum) comprised 14 % and 3% (respectively) of the remaining
octopus. Sepioteuthis australis (calamari squid) comprised 18% of all cephalopods, and Sepia
apama and Sepia sp. (cuttlefish)), and Ommastrephids (Nototodarus gouldi (arrow squid)),
comprised 8% each of the remaining cephalopods identified. The crustacean species
recovered from two regurgitates was the western king prawn (Melicertus latisulcatus).
Fish and crustaceans
Numerically, the most common families of fish identified from otoliths or species-specific
vertebrae were Platycephalidae (flatheads) (n = 15) and Monacanthidae (leatherjackets) (n =
13), which comprised only 8% of the diagnostic prey items recovered (Table 3). In most
cases, the frequency of fish recovered from either faeces or regurgitates was low (≤ 3%), and
comprised ≤ 1 % of all prey items recovered. Fish ranged in size (6.7 – 595.8 g and 67.1 –
433.3 mm) but were mostly small (mean 229.2 ± 251.5g and 247 ± 144.5 mm), except for
Platycephalidae, which were the largest taxonomic group of fish recovered in terms of
biomass and length (mean 542.4 ± 30.2 g and 419.9 ± 7.6 mm) (Table 4).
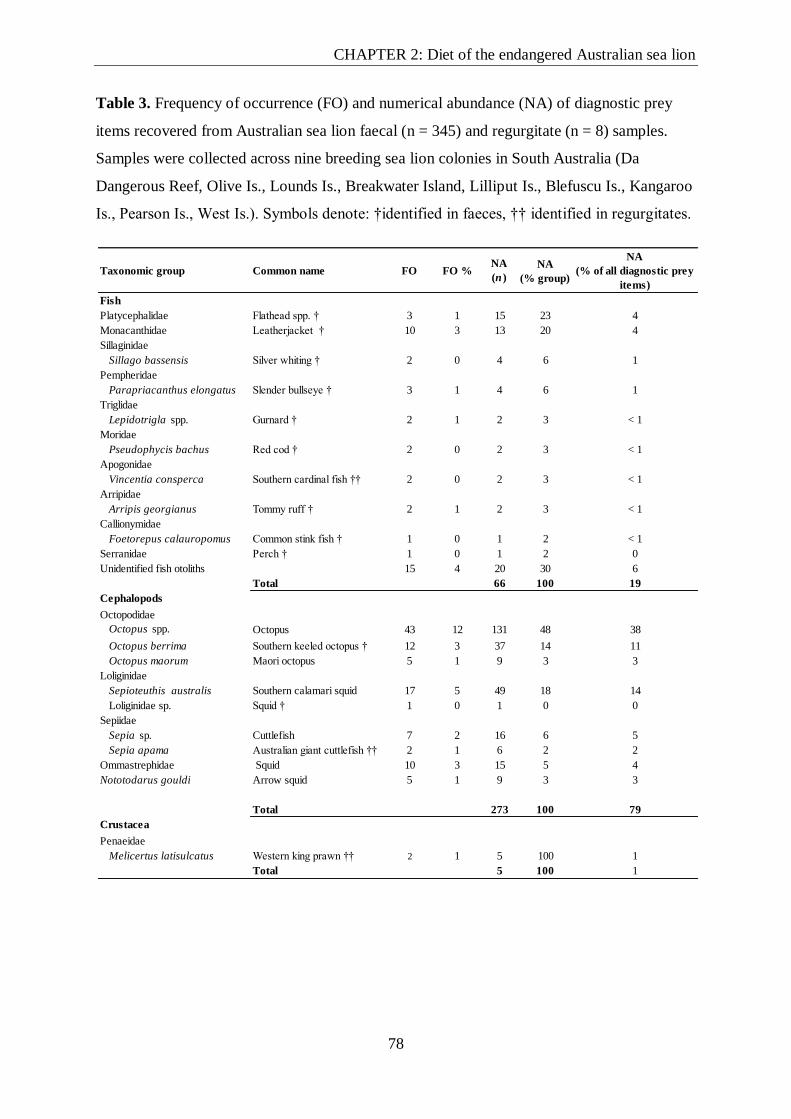
CHAPTER 2: Diet of the endangered Australian sea lion
78
Table 3. Frequency of occurrence (FO) and numerical abundance (NA) of diagnostic prey
items recovered from Australian sea lion faecal (n = 345) and regurgitate (n = 8) samples.
Samples were collected across nine breeding sea lion colonies in South Australia (Da
Dangerous Reef, Olive Is., Lounds Is., Breakwater Island, Lilliput Is., Blefuscu Is., Kangaroo
Is., Pearson Is., West Is.). Symbols denote: †identified in faeces, †† identified in regurgitates.
Taxonomic group Common name FO FO %NA
(n )
NA
(% group)
NA
(% of all diagnostic prey
items)
Fish
Platycephalidae Flathead spp. † 3 1 15 23 4
Monacanthidae Leatherjacket † 10 3 13 20 4
Sillaginidae
Sillago bassensis Silver whiting † 2 0 4 6 1
Pempheridae
Parapriacanthus elongatus Slender bullseye † 3 1 4 6 1
Triglidae
Lepidotrigla spp. Gurnard † 2 1 2 3 < 1
Moridae
Pseudophycis bachus Red cod † 2 0 2 3 < 1
Apogonidae
Vincentia consperca Southern cardinal fish †† 2 0 2 3 < 1
Arripidae
Arripis georgianus Tommy ruff † 2 1 2 3 < 1
Callionymidae
Foetorepus calauropomus Common stink fish † 1 0 1 2 < 1
Serranidae Perch † 1 0 1 2 0
Unidentified fish otoliths 15 4 20 30 6
Total 66 100 19
Cephalopods
Octopodidae
Octopus spp. Octopus 43 12 131 48 38
Octopus berrima Southern keeled octopus † 12 3 37 14 11
Octopus maorum Maori octopus 5 1 9 3 3
Loliginidae
Sepioteuthis australis Southern calamari squid 17 5 49 18 14
Loliginidae sp. Squid † 1 0 1 0 0
Sepiidae
Sepia sp. Cuttlefish 7 2 16 6 5
Sepia apama Australian giant cuttlefish †† 2 1 6 2 2
Ommastrephidae Squid 10 3 15 5 4
Nototodarus gouldi Arrow squid 5 1 9 3 3
Total 273 100 79
Crustacea
Penaeidae
Melicertus latisulcatus Western king prawn †† 2 1 5 100 1
Total 5 100 1

CHAPTER 2: Diet of the endangered Australian sea lion
79
Table 4. Biomass (g) (mean ± SD), median, range, total mass) and length (mm) (mean ± SD), median, range) estimates of fish consumed by
ASL based on prey items in faeces and regurgitates. Estimates are based on data using the minimum number of individuals determined from the
maximum number otoliths recovered from each faecal sample or regurgitate. (See Table 2 for regression equations).
Genus / species Common name
n Mean (± SD) Median Range Total mass Mean (± SD) Median Range
Arripis georgianus Tommy ruff 2 6.8 ± 0.3 - 6.7 - 7.0 13.7 77.1 ± 0.7 - 76.6 - 77.6
Foetorepus calauropomus Common stink fish 1 - - 90.1 90.1 - - 233.0
Meuschenia scaber Leatherjacket 1 - - 35.3 35.3 - - 145.9
Parapriacanthus elongatus Slender bullseye 4 29.9 ± 20.5 30.24 5.6 - 53.5 119.6 155.3 ± 51.3 164.3 86.8 - 205.8
Platycephalus richardsoni Flathead 6 542.4 ± 30.2 528.9 512.4 - 595.8 5965.9 419.9 ± 7.6 416.6 412.8 - 433.3
Pseudophycis bachus Red cod 2 48.4 ± 58.3 - 7.2 - 89.6 96.8 162.6 ± 72.9 - 111.0 - 214.1
Sillago bassensis Silver whiting 4 8.9 ± 5.3 8.1 3.6 - 15.7 35.5 88 ± 18.4 88.2 67.1 - 108.7
Lepidotrigla spp. Gurnard 2 109.7 ± 0.8 - 109.1 - 110.3 219.4 209.3 ± 0.6 - 208.8 - 209.7
Vincentia consperca Southern cardinal fish 2 NA NA
Length (mm)Biomass estimate (g)

CHAPTER 2: Diet of the endangered Australian sea lion
80
Cephalopods
There was high variability in the size of cephalopods consumed (Table 5). All cephalopod
species recovered from regurgitates were significantly larger and estimated heavier than those
in faeces (Mann-Whitney U: Z = - 4.7, P = < 0.001 (mass) and Mann-Whitney U: Z = - 6.24,
P = < 0.001 (mantle length)). Overall, the median biomass of cephalopods was 23.3 g (mean
66.5 ± 152.7 g; range 0.1 – 1237.3 g) with mantle length of 37.9 mm (mean 62.6 ± 64.8 mm,
range 4.1 – 384.7 mm). Ommastrephidae and Loliginidae squids were the largest
cephalopods recovered (mean biomass 169.5 ± 260.3 g and mean mantle length 167.7 ± 75.3
mm, and 138.0 ± 200.1 g and 130 ± 79.1 mm, respectively). In comparison, Octopodidae and
Sepiidae were typically small (mean 32.5 ± 64.3 g and 30.4 ± 14.6 mm, and 74.7 ± 261 g and
64.6 ± 43.9 mm, respectively) (Figs. 2, 3, 4, 5). Based on the MNI, Loliginidae and
Octopodidae comprised the largest percentage biomass contributions of cephalopod
consumed (36.9% and 31.9%, respectively), followed by Ommastrephidae (21.7%) and
Sepiidae (9.5%) (Table 6).
For cephalopod taxa, diversity did not differ significantly between locations (ANOSIM: R = -
0.042, P = 0.85; PERM: pseudo-F = 0.60164, df = 7, P = 0.96) and no seasonal differences
were detected (ANOSIM: R = -0.057, P = 0.93) except for summer, which was weakly
different in composition compared to winter and spring (ANOSIM (winter-summer): R = 0.168, P
= 0.005) (ANOSIM (summer-spring): R = 0.111, P = 0.017). Cephalopod composition also
differed weakly between years 2005 and 2006 (ANOSIM: R = 0.157, P = 0.07; PERM:
pseudo-F = 2.995, df = 3, P = 0.002), and, 2006 and 2007 (ANOSIM: R = 0.223, P = 0.01;
PERM: pseudo-F = 2.995, df = 3, P = 0.002) (41.7% and 40.3% dissimilarity, respectively).

CHAPTER 2: Diet of the endangered Australian sea lion
81
Table 5. Biomass (g) (mean ± SD), median, range, total mass) and mantle length (mm) (mean ± SD), median, range) estimates of all
cephalopods consumed by ASL based on prey items in faeces and regurgitates. Estimates are based on data using the minimum number of
individuals determined from the maximum number of upper or lower beaks recovered from each faecal sample or regurgitate (See Table 2 for
regression equations).
Genus / species
n Mean (± SD) Median Range Total mass Mean (± SD) Median Range
Upper beaks
Nototodarus gouldi 3 642.8 ± 431.0 492.9 306.6 - 1128.7 1928.3 292.7 ± 57.0 278.7 244.0 - 355.4
Octopus berrima 21 34.3 ± 17.9 35.3 3.4 - 71.0 720.0 35.9 ± 8.9 38.1 14.0 - 49.0
Octopus maorum 3 339.5 ± 391.4 155.8 73.7 - 788.9 1018.4 71.5 ± 61./1 49.7 24.3 - 140.6
Octopus spp. 68 23.4 ± 20.6 18.7 1.1 - 143.1 1619.2 29.5 ± 10.8 30.3 6.8 - 62.3
Ommastrephidae (based on N. gouldi ) 6 115.5 ± 171.8 30.8 0.1 - 430.7 692.9 151.6 ± 78.1 132.8 66.7 - 268.2
Sepia apama 6 223.6 ± 496.8 21.4 4.73 - 1237.3 1341.4 98.4 ± 72.6 73.3 45.29 - 243.6
Sepia sp. 6 34.8 ± 49.0 10.2 0.6 - 125.6 208.8 58.7 ± 28.7 49.4 26.4 - 104.4
Sepioteuthis australis 18 68.7 ± 119.6 25.6 2.07 - 518.6 1235.8 109.3 ± 82.1 91.0 14.0 - 384.7
Lower beaks
Nototodarus gouldi 6 72 ± 64.2 57.1 4.9 - 174.9 432.0 145.5 ± 40.8 144.4 86.7 - 198.2
Octopus berrima 14 12.8 ± 14.0 8.0 1.4 - 56.3 179.1 22.0 ± 9.4 20.1 7.6 - 45.3
Octopus maorum 6 59.6 ± 11.7 61.2 44.6 - 76.63 357.6 19.7 ± 5.0 20.6 12.9 - 26.6
Octopus spp. 58 27.7 ± 30.3 18.3 0.7 - 163.3 1604.2 28.8 ± 15.2 29.0 4.1 - 68.5
Ommastrephidae (based on N. gouldi ) 7 96.5 ± 129.1 46.7 3.7 - 372.3 679.0 147.1 ± 56.9 134.3 82.3 - 245.5
Sepia sp. 10 9.2 ± 3.3 9.4 3.7 - 14.42 92.2 47.9 ± 4.6 48.6 39.0 - 54.2
Sepioteuthis australis 28 182.6 ± 229.1 106.7 0.5 - 957.8 5111.8 143.3 ± 70.5 143.8 12.8 - 296.9
Mantle length (mm)Biomass estimate (g)

CHAPTER 2: Diet of the endangered Australian sea lion
82
Table 6. Estimated mass (g) and percent biomass contribution (BM) (%) of cephalopods by taxonomic family consumed by ASL based on prey
items in faeces and regurgitates. Biomass calculations for Octopus spp. are based on regression equations for O. berrima (A) and O. maorum
(B). Cephlaopod biomass was significantly larger using estimate (B) than (A) (P < 0.001).
Family/species Total mass (g) BM (%) Total mass (g) BM (%)
Octopodidae 5498.5 31.9 8113.7 40.9
Octopus spp. 3223.4 18.7 5838.6 29.4
Octopus berrima 899.1 5.2 899.1 4.5
Octopus maorum 1376.0 8.0 1376.0 6.9
Loliginidae 6347.6 36.9 6347.6 32
Sepioteuthis australis 6347.6 36.9 6347.6 32
Ommastrephidae 3732.2 21.7 3732.2 18.8
Nototodarus gouldi 2360.3 13.7 2360.3 11.9
ommastrephid 1371.9 8.0 1371.9 6.9
Sepiidae 1642.3 9.5 1642.3 8.3
Sepia apama 1341.4 7.8 1341.4 6.8
Sepia sp. 300.9 1.7 300.9 1.5
A B

CHAPTER 2: Diet of the endangered Australian sea lion
83
Figure 2. Box plots indicating size ranges of estimated mantle length (mm) and mass (g) of
cephalopods based on regression equations from key families detected in this study
(Ommastrephidae, Loliginidae, Octopodidae and Sepiidae). Estimates are based on the
minimum number of individuals recovered from faeces (n = 345) and regurgitates (n = 8)
collected from nine colonies in South Australia. Plots show the median, mean (open circle),
25th and 75th percentile, and outliers (filled circles).
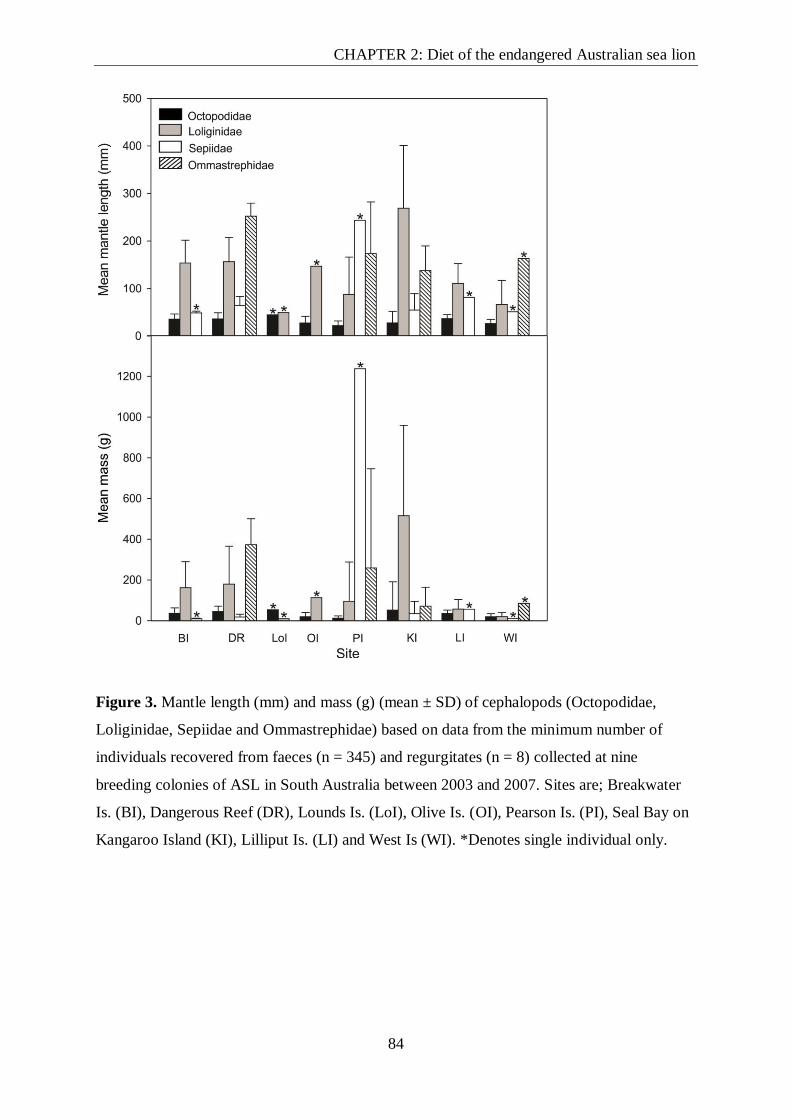
CHAPTER 2: Diet of the endangered Australian sea lion
84
Figure 3. Mantle length (mm) and mass (g) (mean ± SD) of cephalopods (Octopodidae,
Loliginidae, Sepiidae and Ommastrephidae) based on data from the minimum number of
individuals recovered from faeces (n = 345) and regurgitates (n = 8) collected at nine
breeding colonies of ASL in South Australia between 2003 and 2007. Sites are; Breakwater
Is. (BI), Dangerous Reef (DR), Lounds Is. (LoI), Olive Is. (OI), Pearson Is. (PI), Seal Bay on
Kangaroo Island (KI), Lilliput Is. (LI) and West Is (WI). *Denotes single individual only.

CHAPTER 2: Diet of the endangered Australian sea lion
85
Figure 4. Mass (mean ± SD) of cephalopods consumed by ASL by taxonomic family
estimated in the current study and from regurgitates and stomachs derived by McIntosh et al.
(2006) from the Seal Bay colony. Cephalopods were significantly smaller from faeces than
regurgitates and stomachs in both studies. For Sepiidae, Loliginidae and Octopodidae, beaks
derived from regurgitates in the current study where significantly smaller than reported by
McIntosh et al. (2006).

CHAPTER 2: Diet of the endangered Australian sea lion
86
Figure 5 (supplementary). Box plots indicating size ranges estimated from mass (g)
regression equations of key cephalopod families detected in this study (Ommastrephidae,
Loliginidae, Octopodidae and Sepiidae). Estimates are based on data from the minimum
number of individuals recovered from faeces (n = 345) and regurgitates (n = 8) collected
from nine breeding colonies of ASL in South Australia between 2003 and 2007. Plots show
the comparison between overall size range of Octopodidae estimated from mass (g)
regression equations based on O. berrima (Octopodidae 1) and regressions equations based
on O. maorum (Octopodidae 2). Data show the median, mean (open circle), 25th and 75th
percentile, and outliers (filled circles).
DISCUSSION
Diet Diversity
Hard part diet analysis was a reliable method to estimate the size and biomass of a small
range of prey species consumed by ASL that would not have been possible using other diet

CHAPTER 2: Diet of the endangered Australian sea lion
87
methods (e.g., fatty acids and DNA). Consistent with previous diet studies (Gales and Cheal
1992; McIntosh et al. 2006; Gibbs 2008) these findings confirm the ASL are benthic foragers
that consume a range of predominantly demersal teleost fish, crustacean and cephalopod
prey. This is the most geographically comprehensive ASL diet study to date. Given the
paucity of dietary information for ASL, these findings are an important step in gaining a
broader geographic understanding of ASL prey diversity. In particular, the use of
cephalopods, which were the most frequent prey consumed across sites by ASL.
Studies that use hard-parts recovered from faeces and regurgitates have inherent biases
because the resulting data emphasise the remains of taxa with robust hard parts and are less
reliable for identifying highly digestible prey (e.g. Tollit et al. 2006). Similar to previous
studies that used hard parts to determine ASL diet, hard parts from faeces and regurgitates in
this study provided limited information on the range of prey consumed (Gales and Cheal
1992; McIntosh et al. 2006; Gibbs 2008). Species level identifications of fish from otoliths
for example, were constrained by structural damage caused by digestive erosion and many
items remained unidentified in this prey group. In addition, small otoliths are more
susceptible to erosion and complete digestion (Fea and Harcourt 1997), and few small
otoliths were found in the current study. Even though fragments of carapace from what were
probably decapods crustaceans were recovered, the identification of crustaceans was limited
to the penaeid prawn (M. latisulcatus). These two prey groups (fish and crustaceans)
represented less than 4% of the overall abundance of prey items recovered and hard remains
of cartilaginous taxa were absent (Gales and Cheal 1992; McIntosh et al. 2006). In contrast,
cephalopod beaks were structurally well conserved, numerically abundant and frequently
encountered.

CHAPTER 2: Diet of the endangered Australian sea lion
88
Diet diversity comprised 15 families with 11 genera identified. Among these, cephalopods
comprising octopus, loliginid and ommastrephid squids and cuttlefish were the dominant prey
type recovered. Most of the taxa identified typically occur over the continental shelf at depths
from 10 m to 200 m (Edgar et al. 2001; Gomon et al. 2008). This is consistent with the
foraging behaviour reported for ASL, which utilise coastal and on-shelf waters and employ
continuous U-shaped dives characteristic of foraging at, or near to the seabed (Costa and
Gales 2003; Fowler et al. 2007; Goldsworthy et al. 2009; Lowther et al. 2011, Fragnito
2013).
Many of the taxa identified in this study have been reported in previous ASL diet studies
(Gales and Cheal 1992; McIntosh et al. 2006), although the geographic extent of their
distribution has remained poorly studied. Octopodidae, Sepiidae, Ommastrephidae and to a
lesser extent Loliginidae, were common cephalopod prey recorded in stomachs and
regurgitates of ASL at Kangaroo Island (McIntosh et al. 2006). Otoliths from fish families:
Monacanthidae (leatherjackets), Platycephalidae (flathead), Sillaginidae (whiting), and
Pempheridae (bullseyes) were also identified in that study, although the size of specimens
could not be determined. Cephalopods (Octopodidae, Sepiidae and Loliginidae) and
unidentified fish were also typical of remains recovered from a small number of faeces and
stomachs collected across a broad geographic range assessed by Gales and Cheal (1992). The
remains of Triglidae (gurnard), Apogonidae (cardinal fish), Serranidae (perch),
Callionymidae (stink fish), and Penaeidae (king prawn) are novel prey to this study, and
have not been previously recorded in diet of ASL. The collective range of prey identified
across different diet studies suggests individual ASL probably utilise a broad range of
habitats to acquire prey. Given temporal and spatial information on diet is limited in ASL
further studies are needed to ascertain the importance of different prey.

CHAPTER 2: Diet of the endangered Australian sea lion
89
In southern Australia, ASL coexists with two other pinnipeds; the Australian (Arctocephalus
pusillus doriferus) and long-nosed fur seal (A. forsteri). There is a high level of spatial
overlap in the foraging areas used by ASL (Fowler et al. 2007, Lowther et al. 2012) and long-
nosed (adult males and females) and Australian fur seals (Page et al. 2007). The level of
inter-specific dietary competition between ASL and fur seals has not been studied in detail.
Diet studies on long-nosed fur seals indicate that adult females and males have similar diets,
but adult males consume larger prey, including penguins (Page et al. 2005; Reinhold, 2015).
The diets of both adult female and male long-nosed fur seals comprise fish and cephalopods,
including Gould’s squid (N. gouldi), redbait (Emmelichthys nitidus) and southern garfish
(Hyporhamphus melanochir) (Page et al. 2005; Reinhold, 2015) which are all typically found
in the water column. Juvenile long-nosed fur seals preyed on small myctophids
(Symbolophorus sp.), which occur south of the shelf break in pelagic waters (Page et al.
2005), which are not preyed on by ASL. The diet of Australian fur seals includes several
benthic species of rock cod (Pseudophycis spp.), flathead (Platycephalus spp.) and
leatherjacket (Monacanthidae) (Page et al. 2005), which are also used by ASL, but Australian
fur seals also utilise pelagic prey, including redbait. This study supports the findings of Page
et al. (2005), which indicated that despite high degrees of spatial overlap in foraging grounds,
the three pinniped species only share a few common prey.
Insights into habitat use
Recent studies using animal-borne cameras and biotelemetry suggest ASL exploit a range of
habitats in search of prey (Lowther et al. 2012; Fragnito, 2013). Preferential habitat selection
by ASL cannot be confirmed from results of this study, but a number of taxa identified
suggest ASL use a variety of habitats to obtain prey. For example, Pempheridae, Triglidae,
Moridae, Monacanthidae, Apogonidae and Serranidae are closely associated with algal-reef

CHAPTER 2: Diet of the endangered Australian sea lion
90
and rocky reef systems that are widely distributed throughout the GAB, and Platycephalidae,
Sillagindae and Callionymidae tend to inhabit sandy substrates that are common amongst
seagrass and low relief broken bottom, but they also can occupy reefs (Gomon et al. 2008).
Similarly, Sepiidae and Octopodidae are benthic cephalopods that brood and actively forage
on algal-rocky reef systems (Mather et al. 1985). Cryptic octopods such as O. berrima and O.
maorum use soft-sediments between rocky habitats, burying to avoid predation (Anderson
1997, 1999; Stranks and Norman 1992). Biotelemetry studies indicate ASL prospect such
habitats (Lowther et al. 2011, 2012), suggesting they may be important foraging locations for
ASL in South Australia.
As found in the study by McIntosh et al. (2006), the loliginid squid, S. australis, was scarce
at Seal Bay, but these species were well represented in samples from colonies within the
Nuyts Archipelago (94% of all loliginids recovered). Benthic habitats adjacent to the latter
colonies comprise seagrass and low relief shallow algal reef systems (Edyvane 1999), which
provide important breeding and foraging habitat for S. australis (Smith 1983; Triantafillos
2001; Miller et al. 2006; Pecl et al. 2006; Steer et al. 2006). This contrasts with the
heterogeneous rocky and sandy reef complexes utilised by ASL adjacent to the Seal Bay
colony (Fowler et al. 2006, 2007). The variety of prey taxa observed in the diet of ASL
among colonies suggests they use a range of different habitats. This likely reflects the
individual specialisations in foraging areas (e.g., coastal shallow seagrass regions, vs.
offshore rocky reefs) previously described (Baylis et al. 2009; Goldsworthy et al. 2009;
Lowther et al. 2011).
This study indicates that benthic dwelling and demersal cephalopods are important in the diet
of ASL (Ling 1992; Costa and Gales 2003). Results indicated that Octopus and loliginid
squids were the most important cephalopod prey taxa identified, as previously reported in

CHAPTER 2: Diet of the endangered Australian sea lion
91
other studies (Gales and Cheal 1992; McIntosh et al. 2006). Octopus contributed the highest
abundance (~ 65% of all cephalopods) and, despite being one of the smallest cephalopod taxa
recovered, their proportional biomass was greater than loliginid and ommastrephid squid.
Overall, the size of cephalopod prey is smaller than reported in previous studies (McIntosh et
al. 2006; Gibbs, 2008). Faeces are more likely to contain smaller cephalopod beaks than
regurgitates, because large beaks tend to remain in the stomach or be regurgitated rather than
being defecated (Richardson and Gales, 1987; Bowen, 2000; Pitcher, 1980; Childerhouse et
al. 2001).
Potential overlap with fisheries
The relative importance of octopus in the diet of ASL raises interesting questions regarding
resource competition with local GAB fisheries. For example, octopus by-catch in the South
Australian Northern Zone Rock Lobster Fishery (NZRLF) (Linnane et al. 2014) suggests
there may be competition in areas where ASL and the NZRLF overlap. By-catch data
indicate the take of octopus has sharply declined in the NZRLF since 1998 (Brock et al.
2004, Linnane et al. 2012), however current catch remains at ~0.005 octopuses per pot lift
(~2730 octopuses annually) (Linnane et al. 2014, Brock et al. 2004). A reduction in
cephalopod biomass can lead to decreased levels of recruitment (André and Hartmann, 2014).
If octopus is indeed important prey of ASL, it would be useful to understand the level of
interaction with the NZRLF particularly at ASL colonies that are in decline. Such an
approach should use a finer-scale colony-level analysis than that used here, which could
account for regional differences in seasonal abundances of octopus production (Katsanevakis
and Verriopoulos 2006; Steer et al. 2006; Stark et al. 2008).

CHAPTER 2: Diet of the endangered Australian sea lion
92
Conclusions and future directions
This study provides detailed information on the diet of ASL at several breeding colonies in
South Australia. Future diet studies should complement analyses of prey hard parts with
alternative methods, such as faecal DNA-based analyses (Deagle et al. 2005; Casper et al.
2007; Bowles et al. 2013; Peters et al. 2015). Feeding trials using captive otariids and several
studies on the diets of wild otariids have shown DNA-based faecal analyses can improve prey
detection rates compared with other methods (Deagle et al. 2005a; Casper et al. 2007b;
Bowles et al. 2011). Combined with biotelemetry studies, faecal DNA-based analyses may
improve understanding of the habitats used by ASL, as well as interactions with commercial
and recreational fisheries.
Acknowledgements
This study was supported through funding from the Australian Government National
Heritage Trust (NHT) grants scheme, Fisheries Research Development Corporation (FRDC)
Nature Foundation SA, and the Wildlife Conservation Fund of the South Australian
Department of Environment, Water and Natural Resources (DEWNR). I thank B. Haddrill
and B. Dalzel (DEWNR) and their staff for access and permission to conduct Australian sea
lion research at colonies in South Australia. I thank Dr. T. Ward (SARDI) for securing FRDC
funding. Thanks to SeaLink for travel support. I thank the volunteers who assisted with
fieldwork: D. Peters, C. Fulton, C. Kennedy, B. Page, D. Hamer, M. A. Lea, R. Sleep and J.
and K. Bire. This project was funded by grant proposals prepared and submitted by K. Peters
and S. Goldsworthy. K. Peters was the recipient of an Adelaide University postgraduate
award. This research project was conducted under the DEWNR ethics permit A246846 and
Adelaide University animal ethics permit S80-2004. SDG was supported by Marine
Innovation South Australia (MISA), an initiative of the South Australian Government.

CHAPTER 2: Diet of the endangered Australian sea lion
93
REFERENCES
Anderson, T. J. (1997). Habitat selection and shelter use by Octopus tetricus. Marine Ecology
Progress Series, 150, 137–148.
Anderson, T. J. (1999). Morphology and biology of Octopus maorum (Hutton 1880) in
northern New Zealand. Bulletin of Marine Science, 65, 657–676.
André, J., and Hartmann, K. (2014). Tasmanian Octopus Fishery Assessment 2012/2013.
Institute for Marine and Antarctic Studies University of Tasmania Hobart, p 1-26.
Baum J K, Worm B (2009) Cascading top-down effects of changing oceanic predator
abundances. Journal of Animal Ecology 74: 699–714
Baylis, A. M. M., Hamer, D. J., and Nichols, P. D. (2009). Assessing the use of milk fatty
acids to infer the diet of the Australian sea lion (Neophoca cinerea). Wildlife
Research, 36, 169–176.
Baylis, A. M. M., and Nichols, P. D. (2009). Milk fatty acids predict the foraging locations of
the New Zealand fur seal: continental shelf versus oceanic waters. Marine Ecology
Progress Series, 380, 271–286 .
Baylis, A. M. M., Page, B., McKenzie, J., and Goldsworthy, S. D. (2012). Individual foraging
site fidelity in lactating New Zealand fur seals: Continental shelf vs oceanic habitats.
Marine Mammal Science, 28, 276–294.
Bool, N. M., Page, B., and Goldsworthy, S. D. (2007). What is causing the decline of little
penguins (Eudyptula minor) on Granite Island South Australia? Report to the South
Australian Department for Environment and Heritage, Wildlife Conservation Fund
and the Nature Foundation. South Australian Research and Development Institute

CHAPTER 2: Diet of the endangered Australian sea lion
94
(Aquatic Sciences), Adelaide. SARDI Aquatic Sciences Publication Number
F2007/000288-1. SARDI Research Report Series No. 21 p 1-55.
Bowen, W. D. (2000). Reconstruction of pinniped diets: accounting for complete digestion of
otoliths and cephalopod beaks. Canadian Journal of Fisheries and Aquatic Science,
57, 898–905.
Bowles, E., and Trites, A. W. (2013). Faecal DNA amplification in Pacific walruses
(Odobenus rosmarus divergens). Polar Biology, 36, 755–759. doi:101007/s00300-
013-1296-6.
Brock, D. J., and Ward, T. M. (2004). Maori octopus (Octopus maorum) bycatch and
southern rock lobster (Jasus edwardsii) mortality in the South Australian rock lobster
fishery. Fisheries Bulletin, 102, 430–440.
Campbell, R. A., Gales, N. J., Lento, G. M., and Baker, C. S. (2008a). Islands in the sea:
extreme female natal site fidelity in the Australian sea lion Neophoca cinerea. Biology
Letters, 4, 139–142.
Campbell, R. A, Holley, D., Christianopoulos, Z., Caputi, N., and Gales, N. J. (2008b).
Mitigation of incidental mortality of Australian sea lions in the west coast rock lobster
fishery. Endangered Species Research, 5, 345–358.
Casper, R. M., Jarman, S. N., Deagle, B. E., Gales, N. J., Hindell, M. A. (2007). Detecting
prey from DNA in predator scats: A comparison with morphological analysis using
Arctocephalus seals fed a known diet. Journal of Experimental Marine Biology and
Ecology, 347, 144–154.

CHAPTER 2: Diet of the endangered Australian sea lion
95
Casper, R. M., Gales, N. J., Hindell, M. A., Robinson, S. M. (2006). Diet estimation based on
an integrated mixed prey feeding experiment using Arctocephalus seals. Journal of
Experimental Marine Biology and Ecology, 328, 228–239.
Chiaradia, A., Forero, M. G., Hobson, K. A., and Cullen, J. M. (2010). Changes in diet and
trophic position of a top predator 10 years after a mass mortality of a key prey. ICES
Journal of Marine Science, 67, 1710–1720.
Childerhouse, S., Dix, B., and Gales, N. (2001). Diet of New Zealand sea lions (Phocarctos
hookeri) at the Auckland Islands. Wildlife Research, 28, 291–298.
Clarke, K. R., Warwick, R. M. (1993). Change in marine communities; an approach to
statistical analysis and interpretation 2nd edition PRIMER-E Plymouth UK.
Costa, D. P., and Gales, N. J. (2003). Energetics of a benthic diver: Seasonal foraging
ecology of the Australian sea lion Neophoca cinerea. Ecological Monographs, 73,
27–43.
Deagle, B. E., Tollit, D. J., Jarman, S. N., Hindell, M. A., Trites, A. W., and Gales, N. J.
(2005). Molecular scatology as a tool to study diet: analysis of prey DNA in scats
from captive Steller sea lions. Molecular Ecology, 14, 1831–1842.
Deagle, B. E., and Tollit, D. J. (2007). Quantitative analysis of prey DNA in pinniped faeces:
potential to estimate diet composition? Conservation Genetics, 8, 743–747.
Deagle, B. E., Kirkwood, R., and Jarman, S. N. (2009). Analysis of Australian fur seal diet by
pyrosequencing prey DNA in faeces. Molecular Ecology, 18, 2022–2038.
Dellinger, T., and Trillmich, F. (1987). Estimating diet composition from scat analysis in
otariid seals (Otariidae): is it reliable? Canadian Journal of Zoology, 66, 1865–1870.

CHAPTER 2: Diet of the endangered Australian sea lion
96
Edgar, G. J. (2001). Australian Marine Life: The plants and animals of temperate waters.
Reed New Holland, Sydney, Australia.
Edyvane, K. S. (1999). Conserving biodiversity in South Australia II Identification of areas of
high conservation value in South Australia In: SARDI (ed) Book 39 Department of
Primary Industries South Australia, Adelaide, Australia.
Fowler, S. L., Costa, D. P., Arnould, J. P. Y., Gales, N. J., and Kuhn, C. E. (2006). Ontogeny
of diving behaviour in the Australian sea lion: Trials of adolescence in a late bloomer.
Journal of Animal Ecology, 72, 358–367.
Fowler, S. L., Costa, D. P., and Arnould, J. P. Y. (2007). Ontogeny of movements and
foraging ranges in the Australian sea lion. Marine Mammal Science, 23, 598–614.
Fragnito, K (2013). Feeding behaviour and habitat utilisation of adult female Australian sea
lions (Neophoca cinerea) using animal-borne video cameras. BSc Honours thesis, The
University of Adelaide, South Australia
Furlani, D., Gales, R., and Pemberton, D. (2007). Otoliths of common Australian temperate
fish: a photographic guide. CSIRO Publishing, Collingwood Victoria, Australia.
Gales, N. J., and Cheal, A. J. (1992). Estimating diet composition of the Australian sea lion
(Neophoca cinerea) from scat analysis: an unreliable technique. Wildlife Research,
19, 447–456.
Gales, N. J., Shaughnessy, P. D., and Dennis, T. E. (1994). Distribution abundance and
breeding cycle of the Australian sea lion Neophoca cinerea (Mammalia: Pinnipedia).
Journal of Zoology, 234, 353–370.

CHAPTER 2: Diet of the endangered Australian sea lion
97
Gales, R., and Pemberton, D. (1994). Diet of the Australian fur seal in Tasmania. Australian
Journal of Marine and Freshwater Research, 45, 653–664.
Gales, R., Pemberton, D., Lu, C. C., and Clarke, M. R. (1993). Cephalopod diet of the
Australian fur seal: variation due to location season and sample type. Australian
Journal of Marine and Freshwater Research, 44, 657–671.
Gibbs, S. E. (2008). Retention and condition of cephalopod beaks in the stomach of an
Australian sea lion (Neophoca cinerea). Australian Mammalogy, 29, 241–244.
Goldsworthy, S. D., and Page, B. (2007). A risk-assessment approach to evaluating the
significance of seal bycatch in two Australian fisheries. Biological Conservation 139:
269–285.
Goldsworthy, S. D., Page, B., Shaughnessy, P. D., Hamer, D., Peters, K. J., McIntosh, R. R.,
Baylis, A. M. M, and McKenzie, J. (2009). Innovative solutions for aquaculture
planning and management: addressing seal interactions in the finfish aquaculture
industry. South Australian Research and Development Institute (Aquatic Sciences),
Adelaide. SARDI Aquatic Sciences Publication Number F2008/000222–1 SARDI
Research Report Series Number 288.
Goldsworthy, S.D., Page, B., Shaughnessy, P. D., and Linnane, A. (2010). Mitigating Seal
Interactions in the SRLF and the Gillnet Sector SESSF in South Australia. Report to
the Fisheries Research and Development Institute. South Australian Research and
Development Institute (Aquatic Sciences), Adelaide. SARDI Publication No.
F2009/000613-1 SARDI Research Report Series No 405.
Goldsworthy, S. D., Mackay, A. I., Shaughnessy, P. D., Bailleul, F., and Holman, D. (2015).
Maintaining the monitoring of pup production at key Australian sea lion colonies in

CHAPTER 2: Diet of the endangered Australian sea lion
98
South Australia (2014/15). Final Report to the Australian Marine Mammal Centre.
South Australian Research and Development Institute (Aquatic Sciences), Adelaide.
SARDI Publication No F2010/000665-5 SARDI Research Report Series No 871.
Goldsworthy, S. D. (2015). Neophoca cinerea The IUCN Red List of Threatened Species
2015: eT14549A45228341 http://dxdoiorg/102305/IUCNUK2015-
2RLTST14549A45228341en.
Gomon, M. F., Bray, D. J., Kuiter, R. H. (2008). Fishes of Australia’s Southern Coast.
Reed New Holland, Sydney, Australia.
Goodman-Lowe, G. D. (1998). Diet of the Hawaiian monk seal (Monachus schauinslandi)
from the North Western Hawaiian islands during 1991 to 1994. Marine Biology, 132,
535–546.
Hamer, D. J., Goldsworthy, S. D., Costa, D. P., Fowler, S. L., Page, B., and Sumner, M. D.
(2013) The endangered Australian sea lion extensively overlaps with and regularly
becomes by-catch in demersal shark gill-nets in South Australian shelf waters.
Biological Conservation, 157, 386–400.
Higgins, L.V. (1993). The nonannual, nonseasonal breeding cycle of the Australian sea lion
Neophoca cinerea. Journal of Mammalogy, 74, 270–274.
Higgins, L. V., and Gass, L. (1993). Birth to weaning: parturition duration of lactation and
attendance cycles of Australian sea lions (Neophoca cinerea). Canadian Journal of
Zoology, 71, 2047–2055.
Hyslop, E. J. (1980). Stomach contents analysis – a review of methods and their application.
Journal of Fish Biology, 17, 411–429.

CHAPTER 2: Diet of the endangered Australian sea lion
99
Iverson, S. J., Field, C., Bowen, W. D., and Blanchard, W. (2004). Quantitative fatty acid
signature analysis: a new method of estimating predator diets. Ecological
Monographs, 74, 211–235.
Katsanevakis, S., and Verriopoulos, G. (2006). Modelling the effect of temperature on
hatching and settlement patterns of mesoplanktonic organisms: the case of the
octopus. Scientia Marina, 70, 699–708.
Kirkwood, R., Pemberton, D., Gales, R., Hoskins, A. J., Mitchell, T., Shaughnessy, P. D., and
Arnould, J. P. (2010). Continued population recovery by Australian fur seals. Marine
and Freshwater Research, 61, 695–701.
Kirkwood, R., Hume, F., and Hindell, M. (2008). Sea temperature variations mediate annual
changes in the diet of Australian fur seals in Bass Strait. Marine Ecology Progress
Series, 369, 297–309.
Linnane, A., McGarvey, R., Feenstra, J., and Hoare, M. (2012). Northern Zone Rock Lobster
(Jasus edwardsii) Fishery 2011/12 Status Report to PIRSA Fisheries and Aquaculture
South Australian Research and Development Institute (Aquatic Sciences) Adelaide
SARDI Publication No F2007/000714-6 SARDI Research Report Series No 678.
Linnane, A., McGarvey, R., Feenstra, J., and Hoare, M. (2014) Northern Zone Rock Lobster
(2012/13) Fishery Fishery Assessment Report to PIRSA Fisheries and Aquaculture
South Australian Research and Development Institute (Aquatic Sciences) Adelaide
SARDI Publication No F2007/000320-8 SARDI Research Report Series No 797.
Ling, J. K. (1992). Neophoca cinerea. Mammalian Species, 392, 1–7.

CHAPTER 2: Diet of the endangered Australian sea lion
100
Ling, J. K. (1999). Exploitation of fur seals and sea lions from Australian New Zealand and
adjacent subantarctic islands during the eighteenth nineteenth and twentieth centuries.
Australian Zoologist, 31, 323–350.
Ling, J. K., and Walker, G. E. (1978). An 18-month breeding cycle in the Australian sea lion?
Search, 9, 464–465.
Lowther, A. D., and Goldsworthy, S. D. (2010). Detecting alternate foraging ecotypes in
Australian sea lion (Neophoca cinerea) colonies using stable isotope analysis. Marine
Mammal Science, 27, 567–586 doi: 101111/j1748-7692201000425x.
Lowther, A. D., and Goldsworthy, S. D. (2012). Head start: Australian sea lion pups gain
experience of adult foraging grounds before weaning. Marine Biology, 159, 2687–
2696.
Lowther, A. D., Harcourt, R. G., Hamer, D. J., and Goldsworthy, S. D. (2011). Creatures of
habit: foraging habitat fidelity of adult female Australian sea lions. Marine Ecology
Progress Series, 443, 249–263.
Lowther, A. D., Harcourt, R. G., Goldsworthy, S. D., and Stow, A. (2012). Population
structure of adult female Australian sea lions is driven by fine-scale foraging site
fidelity. Animal Behaviour, 83, 691–701.
Lotze, H. K., and Worm, B. (2009). Historical baselines for large marine animals. Trends in
Ecology and Evolution, 24, 254–62.
Lu, C. C., and Ickeringill, R. (2002). Cephalopod beak identification and biomass estimation
techniques: tools for dietary studies of southern Australian finfishes. Museum Victoria
Science Reports 5, Museum Victoria, Melbourne, Australia.

CHAPTER 2: Diet of the endangered Australian sea lion
101
Marcus, A., Higgins, D., and Gray, R. (2014). Epidemiology of hookworm (Uncinaria
sanguinis) infection in free-ranging Australian sea lion (Neophoca cinerea) pups.
Parasitology Research, 113, 3341–3353.
Marcus. A., Higgins, D. P., and Gray, R. (2015). Health assessment of free-ranging
endangered Australian sea lion (Neophoca cinerea) pups: Effect of haematophagous
parasites on haematological parameters. Comparative Biochemistry and Physiology
Part A: Molecular and Integrative Physiology, 184, 132–143.
Marlow, B. J. (1975). The comparative behaviour of the Australasian sea lions Neophoca
cinerea and Phocarctos hookeri (Pinnipedia: Otariidae). Mammalia, 39, 159–230.
Matejusová, I., Doig, F., Middlemas, S. J., Mackay, S., Douglas, A., Armstrong, J. D.,
Cunningham, C. O., and Snow, M. (2008). Using quantitative real-time PCR to detect
salmonid prey in scats of grey Halichoerus grypus and harbor Phoca vitulina seals in
Scotland — an experimental and field study. Journal of Applied Ecology, 45, 632–
640.
Mather, J. A., Resler, S., and Cosgrove, J. (1985). Activity and movement patterns of
Octopus dofleini. Marine Behaviour and Physiology, 11, 301−314.
McIntosh, R. R., Page, B., and Goldsworthy, S. D. (2006). Dietary analysis of regurgitates
and stomach samples from free-living Australian sea lions. Wildlife Research, 33,
661–669.
McLeay, L. J., Page, B., Goldsworthy, S. D., Ward, T. M., and Paton, D. C. (2009). Size
matters: variation in the diet of chick and adult crested terns. Marine Biology, 156,
1765–1780.

CHAPTER 2: Diet of the endangered Australian sea lion
102
Meynier, L., Duncan, D. S., Mackenzie, D. D. S., Duignan, P. J., Chilvers, B. L., and Morel,
P. C. H. (2009). Variability in the diet of New Zealand sea lion (Phocarctos hookeri)
at the Auckland Islands New Zealand. Marine Mammal Science, 25, 302–326.
Myers, R. A., and Worm, B. (2003). Rapid worldwide depletion of predatory fish
communities. Nature, 423, 280–283.
Myers, R. A., Baum, J. K., Shepherd, T. D., Powers, S. P., and Peterson, C. H. (2007).
Cascading effects of the loss of apex predatory sharks from a coastal ocean. Science,
315, 1846–1850.
Norman, M., and Reid, A. (2000). A guide to Squid Cuttlefish and Octopuses of Australasia.
CSIRO publishing, Collingwood, Victoria, Australia.
Page, B., McKenzie, J., McIntosh, R., Baylis, A., Morrisey, A., Calvert, N., Haase, T., Berris,
M., Dowie, D., Shaughnessy, P. D., and Goldsworthy, S. D (2004). Entanglement of
Australian sea lions and New Zealand fur seals in lost fishing gear and other marine
debris before and after Government and industry attempts to reduce the problem.
Marine Pollution Bulletin, 49, 33–42.
Page, B., McKenzie, J., and Goldsworthy, S. D. (2005). Dietary resource partitioning among
sympatric New Zealand and Australian fur seals. Marine Ecology Progress Series,
293, 283–302.
Pecl, G. T., Tracey, S. R., Semmens, J. M., and Jackson, J. D. (2006). Use of acoustic
telemetry for spatial management of southern calamary Sepioteuthis australis a highly
mobile inshore squid species. Marine Ecology Progress Series, 328, 1–15.

CHAPTER 2: Diet of the endangered Australian sea lion
103
Peters, K. J., Ophelkeller, K., Bott, N. J., Deagle, B. E., Jarman, S.N., and Goldsworthy, S. D.
(2015). Fine-scale diet of the Australian sea lion (Neophoca cinerea) using DNA-
based analysis of faeces. Marine Ecology, 36, 347–367. doi: 10.1111/maec.12145.
Pitcher, K.W. (1980). Stomach contents and faeces as indicators of harbor seal Phoca vitulina
foods in the Gulf of Alaska. Fisheries Bulletin, 78, 544–549.
Reid, A. (2016). Cephalopods of Australia and Sub-Antarctic Territories. CSIRO Publishing.
Richardson, K. C., and Gales, N. J. (1987). Functional morphology of the alimentary tract of
the Australian sea-lion Neophoca cinerea. Australian Journal of Zoology, 35, 219–
226.
Rosen, D. A. S., and Trites, A.W. (2000a). Pollock and the decline of Steller sea lions: testing
the junk-food hypothesis. Canadian Journal of Zoology, 78, 1243–1250.
Rosen, D. A., and Trites, A. W. (2000b). Digestive efficiency and dry-matter digestibility in
Steller sea lions fed herring, Pollock, squid, and salmon. Canadian Journal of
Zoology, 78, 234–239.
Shaughnessy, P. D., Goldsworthy, S. D., and Mackay, A. I. (2015). The long-nosed fur seal
(Arctocephalus forsteri) in South Australia in 2013-14: abundance status and trends.
Australian Journal of Zoology, 63, 101–110.
Shaughnessy, P. D., McKenzie, J., Lancaster, M. L., Goldsworthy, S. D., and Dennis, T. E.
(2010). Australian fur seals establish haulout sites and a breeding colony in South
Australia. Australian Journal of Zoology, 58, 94–103.

CHAPTER 2: Diet of the endangered Australian sea lion
104
Shaughnessy, P. D., Goldsworthy. S. D., Hamer, D. J., Page, B., and McIntosh, R. R. (2011).
Australian sea lions Neophoca cinerea at colonies in South Australia: distribution and
abundance 2004 to 2008. Endangered Species Research, 13, 87–98.
Shaughnessy, P. D., and Goldsworthy, S. D. (2015). Long-nosed fur seal: A new vernacular
name for the fur seal Arctocephalus forsteri in Australia. Marine Mammal Science,
31, 830–832.
Smith, H. K. (1983). The development potential of the southern calamary South Australia.
Department of Fisheries, Adelaide, Australia.
Staniland, I. (2002). Investigating the biases in the use of hard prey remains to identify diet
composition using Antarctic fur seals (Arctocephalus gazella) in captive feeding
trials. Marine Mammal Science, 18, 223–243.
Stark, E. K. (2008). Ecology of the Arrow Squid (Nototodarus gouldi) in Southeastern
Australian Waters, PhD Thesis, University of Tasmania, Australia.
Steer, M. A., Lloyd, M. T., and Jackson, W. B. (2006). Southern Calamary (Sepioteuthis
australis) Fishery. Fishery Assessment Report to PIRSA South Australian Research
and Development Institute (Aquatic Sciences) Adelaide RD 05/0006–2.
Stranks, T. N., and Norman, M. D. (1992). Review of the Octopus australis complex from
Australia and New Zealand with description of a new species (Mollusca:
Cephalopoda). Memoirs of the Museum of Victoria, 53, 345–373.
Tollit, D. J., Steward, M. J., Thompson, P. M., Pierce, G. J., Santos, M. B., and Hughes, S.
(1997). Species and size differences in the digestion of otoliths and beaks:

CHAPTER 2: Diet of the endangered Australian sea lion
105
implications for estimates of pinniped diet composition. Canadian Journal of
Fisheries Aquatic Science, 54, 105–119.
Tollit, D. J., Wong, M., Winship, A. J., Rosen, D. A., and Trites, A. W. (2003). Quantifying
errors associated with using prey skeletal structures from fecal samples to determine
the diet of Steller's sea lion (Eumetopias jubatus). Marine Mammal Science, 19, 724–
744.
Tollit, D. J., Heaslip, S. G., Deagle, B. E., Iverson, S. J., Joy, R., Rosen, D. A. S, and Trites,
A. W. (2006). Estimating diet composition in sea lions: which technique to choose? In
Sea lions of theWorld (Eds AW Trites S K Atkinson D P DeMaster LW Fritz T S
Gelatt L D Rea and K M Wynne). Alaska Sea Grant College Program University of
Alaska Fairbanks USA, p 293–307.
Tollit, D. J., Schulze, A. D., Trites, A. W., Olesiuk, P. F., Crockford, S. J., Gelatt, T. S.,
Ream, R. R., and Miller, K. M. (2009). Development and application of DNA
techniques for validating and improving pinniped diet estimates. Ecological
Applications, 19, 889–905.
Tollit, D. J., Wong, M. A., and Trites, A. W. (2015). Diet composition of Steller sea lions
(Eumetopias jubatus) in Frederick Sound Southeast Alaska: a comparison of
quantification methods using scats to describe temporal and spatial variability.
Canadian Journal of Zoology, 93, 361–376. 101139/cjz-2014-0292.
Triantafillos, L. (2001) Population biology of southern calamary Sepioteuthis australis in
Gulf St Vincent South Australia PhD Dissertation Northern Territory University,
Australia.

CHAPTER 2: Diet of the endangered Australian sea lion
106
Wiebkin, A. (2012). Feeding and breeding ecology of the little penguin (Eudyptula minor) in
the eastern Great Australian Bight. PhD thesis, University of Adelaide, South
Australia, Australia
Walker, G. E., Ling, J. K. (1981). Australian sea lion Neophoca cinerea (Péron 1816) In
Handbook of Marine Mammals; Volume 1: The Walrus Sea Lions Fur Seals and Sea
Otter (Eds Ridgway S H and Harrison R J) Academic Press, London, p 99–118.
Yonezaki, S., Kiyota, M., Baba, N., Koido, T., and Takemura, A.(2003). Size distribution of
the hard remains of prey in the digestive tract of northern fur seal (Callorhinus
ursinus) and related biases in diet estimation by scat analysis. Mammal Study, 28, 97–
102.

107
CHAPTER 3
PCR-based techniques to determine diet of the endangered
Australian sea lion (Neophoca cinerea): a comparison with
morphological analysis
CHAPTER 3: PCR-based techniques to determine diet of the Australian sea lion
108
ABSTRACT
Comprehensive dietary information for the endangered Australian sea lion (Neophoca
cinerea) is currently limited by the deficiency and poor quality of identifiable prey remains
recovered from regurgitate and faeces and the difficulty of observing feeding in the wild. In
this study, DNA-based prey detection methods were assessed using conventional (end-point)
and quantitative real-time PCR (qPCR) on faeces collected from two captive Australian sea
lions fed experimental diets of whole teleost fish, squid and shark tissue. PCR prey detection
methods using the mitochondrial cytochrome oxidase subunit I (COI) and 16S genes
combined with clone sequencing were compared with prey identified using traditional hard
part analysis. The molecular results indicated that prey DNA was degraded. However, prey
amplification was successful by targeting short (71 bp) DNA fragments. Both conventional
PCR and qPCR techniques significantly increased prey detection compared with analysis of
hard parts. For both sea lions, the hard part analysis was constrained by sporadic
and extremely low recovery of fish otoliths (<2%), and cephalopod beaks were not recovered
from the 116 squid fed. Comparisons between PCR techniques indicated comparable prey
detection frequencies for all species tested; however, the sensitivity and greater resolution of
qPCR improved prey detection by ~25% in one sea lion fed the experimental squid and
perch. The detection of squid DNA ≤ 6 day post-ingestion by qPCR further exhibits the
ability and potential of this method to detect low concentrations of infrequent or pulse prey.
This study highlights the use of DNA-based analysis to detect prey taxa in the absence of
identifiable hard prey remains.
CHAPTER 3: PCR-based techniques to determine diet of the Australian sea lion
109
STATEMENT OF AUTHORSHIP
Title of Paper PCR-based techniques to determine diet of the endangered
Australian sea lion (Neophoca cinerea): a comparison with
morphological analysis.
Publication Status Published Accepted for Publication
Submitted for PublicationUnpublished and Unsubmitted work written in manuscript style
Publication Details Marine Ecology, 36 (4), 1428 – 1439. doi: 10.1111/maec.12242
Principal Author
Name of Principal Author (Candidate) Kristian Peters
Contribution to the Paper
Conceived the study, secured funding, undertook fieldwork, performed analysis on all samples,
analysed and interpreted data, performed statistical analysis, wrote manuscript and acted as
corresponding author.
Overall percentage (%) 90%
Certification: This paper reports on original research I conducted during the period of my Higher Degree by
Research candidature and is not subject to any obligations or contractual agreements with a
third party that would constrain its inclusion in this thesis. I am the primary author of this paper.
Signature
Date 28 October 2016
Co-Author Contributions
By signing the Statement of Authorship, each author certifies that:
the candidate’s stated contribution to the publication is accurate (as detailed above);
permission is granted for the candidate in include the publication in the thesis; and
the sum of all co-author contributions is equal to 100% less the candidate’s stated contribution.
Name of Co-Author Kathy Ophelkeller
Contribution to the Paper Contributed to conception of paper, provided comments and supervision
Signature
Date 28 October 2016
CHAPTER 3: PCR-based techniques to determine diet of the Australian sea lion
110
Name of Co-Author Nathan Bott
Contribution to the Paper Guidance with laboratory analysis
Signature
Date 28 October 2016
Name of Co-Author Herdina, H
Contribution to the Paper Guidance with laboratory analysis
Signature
Date 28 October 2016
Name of Co-Author Simon Goldsworthy
Contribution to the Paper Conceived the study, secured funding, provided comments to manuscript drafts and
supervision.
Signature
Date 28 October 2016

CHAPTER 3: PCR-based techniques to determine diet of the Australian sea lion
111
INTRODUCTION
Obtaining comprehensive knowledge of diet in high trophic level marine predators is often
difficult because direct feeding events are rarely observed. For marine mammals such as
pinnipeds, identification of prey skeletal remains recovered from faeces, stomach or
regurgitate offer a reasonable and relatively non-invasive substitute, providing valuable
information on foraging habits, the distribution and abundance of prey, and their relative
biomass consumed (Fea et al. 1999; Childerhouse et al. 2001; McIntosh et al. 2006; Casper et
al. 2007a; Longenecker 2010).
Dietary analyses based on the acquisition of prey hard parts are subject to well-documented
biases (Boyle et al. 1991; Gales and Pemberton 1994; Bowen 2000; Staniland 2002). These
largely stem from differences in digestive tolerance between diagnostic structures that may
remain within the gastrointestinal tract, and remains that may be egested, fragmented and
passed in faeces (Harvey 1989; Needham 1997; Tollit et al. 2003; Page et al. 2005; McIntosh
et al. 2006). Marine predators may also consume only fleshy components or soft-bodied prey
devoid of hard bony structures (i.e. cartilaginous fish). As a result, dietary analysis using
these methods is challenged by the potential to under- or over-estimate the importance of the
prey taxa consumed, leaving estimates of diet often incomplete (Dellinger and Trillmich
1987; Tollit et al. 1997; Kvitrud et al. 2005; Casper et al. 2006; Baylis and Nichols 2009a).
The Australian sea lion (Neophoca cinerea) is a top-level marine predator endemic to
Australia and globally considered one of the rarest otariids. The endangered population
(Goldsworthy and Gales, 2008; Goldsworthy et al. 2015), currently estimated at ~14,780
individuals (Shaughnessy et al. 2011), is distributed amongst 76 breeding colonies extending
from subtropical Houtman-Abrolhos (113°47’E, 28°43’S), Western Australia, to the cool
CHAPTER 3: PCR-based techniques to determine diet of the Australian sea lion
112
temperate Pages Islands (35°45’S, 138°18’E), South Australia (McKenzie et al. 2005;
Shaughnessy et al. 2011). The unusual life history of the Australian sea lion (characterised by
protracted 17–18 month reproductive cycles, breeding asynchrony among colonies and
extreme female natal site fidelity), and a population in recovery from historical sealing has
effectively shaped a genetically autonomous substructure across most of their range
(Campbell et al. 2008; Lowther et al. 2011). As a result, intrinsically slow population growth,
low abundances and recorded subpopulation declines (Goldsworthy et al. 2009) have been
met with considerable concern. Understanding the factors that sustain population viability
will therefore probably be key to the conservation of the species.
One of the fundamental gaps in Australian sea lion biology and a critical step for their future
management rests in understanding their trophic habits and defining key prey. Diet is not well
understood, predominantly as a result of the deficiency and poor quality of prey remains
recovered from regurgitate and faeces. Dietary analyses based on hard parts have indicated
that Australian sea lions exploit a range of benthic species including cephalopods, fish,
crustaceans and occasional elasmobranchs, but few remains survive digestion and, of those
which do, are rarely defined to species (Walker and Ling 1981; Richardson and Gales 1987;
Gales and Cheal 1992; Ling 1992; McIntosh et al. 2006; Gibbs 2008). Other non-destructive
dietary methods such as fatty acid and stable isotope analysis have offered broader trophic-
level insights into prey utilisation and habitat use, but owing to broad similarities in chemical
signals amongst prey, these have provided little fine-scale taxonomic information on the
species consumed (Baylis and Nichols 2009a; Baylis et al. 2009b; Lowther and Goldsworthy
2010; Lowther et al. 2012).

CHAPTER 3: PCR-based techniques to determine diet of the Australian sea lion
113
DNA-based dietary analysis through sequence analysis of prey DNA resolved from faecal
and stomach remains has provided a reliable and non-invasive approach to evaluate prey
consumed by a range of marine predators including seals (Purcell et al. 2004; Casper et al.
2007b; Deagle and Tollit 2007; Braley et al. 2009; Dunn et al. 2010; Marshall et al. 2010).
Identification of prey using this method relies on the assumption that remnant fragments of
DNA from food consumed survive the digestive process, and are identified through
amplification of conserved sequences using PCR. Although reliability of DNA identification
can depend upon the comparability and quantity of sequence information in the gene region
of interest (e.g. Ward et al. 2005, 2008), the extent of DNA prey detection as a
complementary method or alternative to traditional dietary analysis methods has rapidly
grown (Sydmonson 2002; King et al. 2008).
In this study, feeding trials on captive Australian sea lions were used to explore the potential
for DNA-based faecal analysis to provide preliminary assessments of prey consumption.
Feeding trials on captive species can facilitate a progressive means to investigate new dietary
techniques in a controlled environment. By removing some of the methodological constraints
imposed by traditional diet analysis, captive-based assessments using molecular diet analyses
can potentially pilot a step to quantifying trophic interactions in species and wild populations
that lack dietary information (Tollit et al. 2009; Bowles and Trites 2013). The aims of this
study were to (i) assess end-point PCR and quantitative real-time PCR (qPCR) DNA-based
techniques to determine their suitability to amplify and detect fish, shark and cephalopod prey
DNA recovered from Australian sea lion faeces, and (ii) compare the DNA diet results with
prey detected and identified using traditional hard-part (HPA) methodology.

CHAPTER 3: PCR-based techniques to determine diet of the Australian sea lion
114
MATERIALS AND METHODS
Trial animals
At the time of the study, few Australian sea lions were available in captivity. I conducted the
feeding experiment on one adult male and an adult female Australian sea lion held at the
Adelaide Zoological Gardens, South Australia, during January and February 2006. Each sea
lion was housed in a separate main enclosure during daylight hours (~8-10 h) and overnight
(~14 h) housed separately in an evening pen. Evening pens contained a shallow pool and
sprinkler system to limit heat stress to each animal. Each pool was fitted with a 100µm outlet
filter.
Daily Feeding and experimental diet
The feeding trial was conducted over 48 days. Meals weighing 6 kg were fed by hand in two
allocations per day to each sea lion (0.3 kg morning; 5.7 kg evening). For each sea lion, diets
contained at least one prey taxon fed at 60% (3.6 kg), 50% (3.0 kg), 40% (2.4 kg), 30% (1.8
kg) or 10% (0.6 kg) (Table 1). The range of prey taxa fed was fresh whole calamary squid
(Sepioteuthis australis), fresh gummy shark (Mustelus antarcticus) boneless fillets and two
frozen fish: tommy rough (Arripis georgianus) and striped perch (Pelates octolineatus).

CHAPTER 3: PCR-based techniques to determine diet of the Australian sea lion
115
Table 1. Contribution of diet, prey species, number of days fed, and number of scats
collected for hard-part and DNA-based diet analyses for the adult male and female Australian
sea lion experimental trial. Prey taxa are: striped perch (Pelates octolineatus) (SP), tommy
rough (Arripis georgianus) (TR), gummy shark (Mustelus antarcticus) (GS) and squid
(Sepioteuthis australis) (SQ).
Male and female diets
Two different diets were fed to the male and female. The female was fed a single diet
containing an equal mass of the two fish taxa (3:3 kg, 50%) for the duration of the trial. Four
different experimental diets (A, B, C, D) were fed to the male (Table 1). Diet A (60% squid,
30% tommy rough, 10% striped perch) and diet B (10% squid, 60% tommy rough, 30%
striped perch) were fed for 7 days. Diet C (10% squid, 60% tommy rough, 30% shark) and
diet D (30% squid, 40% tommy rough, 30% shark) were fed for 5 and 9 days, respectively. A
diet containing an equal mass of the two fish taxa (3:3 kg, 50%) was fed for 5 days (diet C1)
and 14 days (diet C2) prior to and after experimental diets, respectively. This facilitated
initial and final detection times of experimental prey. The boneless shark fillets fed to the
male sea lion (diets C and D) were used to assess the accuracy of DNA-based prey detection
in the absence of skeletal remains.
Sex Diet Prey species fedProportion (%) of
prey / 6 kg daily diet No. days fed
No. scats
collected
Male C1 SP, TR 50-50 5 2
A SP, TR, SQ 10-30-60 7 3
B SP, TR, SQ 30-60-10 7 4
C TR, GS, SQ 60-30-10 5 0
D TR, GS, SQ 40-30-30 9 9
C2 SP, TR 50-50 14 10
Female C1 SP, TR 50-50 47 30

CHAPTER 3: PCR-based techniques to determine diet of the Australian sea lion
116
Faecal collection and preparation
Faecal samples were collected for a total of 48 days. Each morning, the evening enclosures
were checked for faeces, and the pools were drained and hosed clean. Day enclosures were
checked hourly for faeces between 07:00 and 12:00 h and then every 2 h until animals were
returned to the evening holding enclosures. Collected faeces were stored in sterile bags
containing 95% ethanol, homogenised and then stored at -20 °C.
DNA preparation and extraction
Prior to DNA extraction, faecal-ethanol mixtures were re-homogenised and a subsample
taken. The ethanol supernatant was removed from each subsample and the faecal slurry was
freeze-dried and finely macerated. DNA was then isolated from 200 mg of each faecal
subsample using a QIAamp DNA Stool Mini Kit (QIAGEN, Venlo, Netherlands). DNA yield
was initially quantified using PicoGreen™ dsDNA Quantitation reagent (Molecular
Probes™, Invitrogen, Mulgrave, Victoria, Australia) on a Wallac1420 multilabel fluorometer.
Prior to PCR, DNA extractions were diluted to 3000 pg·µ-1. Genomic DNA for the PCR
controls was extracted from 10 mg of prey muscle tissue using QIAGEN DNeasy Tissue kits
(QIAGEN). A DNA extraction blank (containing no faeces) was included in each batch of
extractions (n = 12) to monitor sample contamination.
Morphological analysis preparation
Prey hard parts were isolated from the remaining ethanol/ faecal mixtures by washing
through 1.0- and 0.5-mm nested sieves. Fish otoliths were photographed using digital
microscopy supported by the image analysis software IMAGE PRO 5.1® (Media Cybernetics
Inc, Rockville, MD, USA). Where possible, fish otoliths were identified to species by
comparison with a reference collection of otoliths obtained from freshly dissected specimens.
CHAPTER 3: PCR-based techniques to determine diet of the Australian sea lion
117
For each fresh specimen, otolith size (mm), mass (mg) and robustness (otolith mass/otolith
length) was calculated (Tollit et al. 1997). Remains identified to species were presented as
numerical abundance (NA; percentage of total prey items made up by each prey taxon) and
frequency of occurrence (FOO; percentage of samples containing a given prey taxa).
Primer design
I conducted preliminary PCR analyses testing a range of 100-250 base-pair (bp) target
fragments but these did not amplify prey DNA. Three primer sets (gummy shark, striped
perch and squid) were then designed to target a short fragment for each species tested. The
gummy shark and squid primer sets target a 71-bp region of the mitochondrial cytochrome
oxidase subunit I (COI) gene (Table 2). The striped perch primer set amplifies a 71-bp region
of the 16S mitochondrial DNA gene (Table 2). Each primer set was constructed using ABI
(Applied Biosystems, Waltham, MA, USA) PRIMER EXPRESS v 2.0® software
(Warrington, UK) from published sequences and genomic DNA of prey species sequenced at
the Australian Genomic Research Facility (AGRF) Brisbane, Australia (GenBank accession
nos: AF075401, AF075386, DQ108315, DQ108311, GU205407). Optimal primers were re-
assessed by eye and tested against an alignment of sequence profiles from the experimental
species, species of taxonomic similarity, Australian sea lion and other marine taxonomic
groups using DNAMAN v. 6.0© (Lynnon Corporation, Point Claire, Quebec, 2005). Each
primer set was screened using BLASTn in GenBank to determine primer specificity (Altschul
et al. 1990).

CHAPTER 3: PCR-based techniques to determine diet of the Australian sea lion
118
Table 2. Primer sequences used to amplify prey DNA from ASL faeces in this study.
Conventional PCR
For shark and striped perch, PCR amplifications (25 µl) contained 2 µl template DNA (3 ng),
2.0 mM MgCl2, 1 x QIAGEN PCR buffer, 1 x bovine serum albumin (0.01%), 10 µM 9
deoxyribonucleotide triphosphates (DNTP), 10 µM primers and 1 x 0.625 unit·µl-1 HotStar
Taq DNA polymerase (QIAGEN). Reagents for squid PCR amplification were similar to this,
except that 1.5 mM MgCl2 was used. Thermal cycling conditions for shark amplifications
were: 95 °C for 15 min, 94 °C for 2 min, followed by 32 cycles of: 94 °C for 10 s, 64.1 °C for
30 s and 72 °C for 30 s. Thermal cycling conditions for squid and striped perch
amplifications were similar to the shark amplification conditions except for the annealing
temperature being 60 °C. A final extension step of 72 °C for 10 min was included in all assay
runs. PCR amplifications were detected by gel electrophoresis on 1.5% agarose gel stained
with Gelred™ (Biotium, Hayward, ward, California, USA) and visualised using Gel-DOC
UV illuminator (Bio-Rad©, Hercules, California, USA) supported by QUANTITY ONE
software (Bio-Rad®). Replicate PCRs were performed to confirm results from the first PCR
attempt. Positive PCR reactions were quantified using PicoGreen™ dsDNA Quantitation
reagent (Molecular Probes™ Invitrogen) on a Wallac 1420 multi-label fluorometer. PCRs
included negative controls to check for contamination. All PCR preparations used UV-
sterilised aerosol-resistant filter tips, consumables and equipment. PCR’s were prepared in
DNA-free laminar flow UV sterilisation hoods.
Primer name Target taxon Target species Gene region Primer sequence (5' - 3')Product
size
SPerch16sF Fish striped perch mtDNA 16s GGCACTCCCCTATCACCAAG 71bp
SPerch16sR Fish striped perch " GGCTATGCCGGATCTGTTTG
SepioCO171F Cephalopod calamary squid mtDNA (COI) CCCCTTTATCAAGTAACCTCTCACA 71bp
SepioCO171R Cephalopod calamary squid " AGCTAAGTGGAGGGAAAAAATGG
GummyCO171F Shark gummy shark " TTGGTGCATGAGCAGGCATA 71bp
GummyCO171R Shark gummy shark " TCCTGGTTGTCCCAGTTCG

CHAPTER 3: PCR-based techniques to determine diet of the Australian sea lion
119
Sequencing
Positive PCRs were purified using Nucleospin™ (Machery-Nagel, Bethlehem, PA, USA)
Extract II PCR cleanup gel extraction kits (Macherey-Nagel, Easton, PA, USA), cloned using
pGEM™-T easy cloning vector (Promega, Madison, WI, USA) and grown overnight on 5-
Bromo- 4-chloro-3-indolyl β-D-galactopyranoside (X-gal) media. Transformed colonies
(white colonies) were selected and PCR amplified using vector primers Sp6/T7. Clones that
yielded PCR product were purified using NucleoSpin™ Plasmid DNA purification kits
(Machery-Nagel) and sequenced at AGRF. Sequences were identified using BLASTn in
GenBank and compared by alignment with reference sequences of the experimental species
(GenBank accession nos. GU216244-GU216246, GU216247-GU2 16251, GU216252-
GU216254).
Real-time quantitative PCR (qPCR)
To estimate mtDNA content of each prey species in seal faecal samples, a DNA standard
curve was created for each qPCR assay. Firstly, DNA was extracted from each prey species.
DNA concentration was then estimated using a known amount of Lambda DNA (Promega™,
Lambda DNA/HindIII markers) and Quant-iT™ PicoGreen™ (Invitrogen). DNA
concentration of each target DNA was adjusted to 200 ng·µl-1 and eightfold dilution series
(200–0 ng·µl-1) were prepared and used as a reference standard on each PCR run. The
mtDNA content of each faecal sample was then interpolated from the standard curve.
qPCR amplifications (total of 20 µl) contained 0.4 µM primers, 1 x Power SYBRTM Green
master mix (Applied BioSystems) and 4 µl template DNA (12 ng). Reactions were performed
in triplicate on an ABI prism™ Real-time 7900HT sequence detection system (Applied
BioSystems) with the fractional cycle (Ct) set to 10 deviations above mean fluorescence

CHAPTER 3: PCR-based techniques to determine diet of the Australian sea lion
120
threshold (0.1). Thermal cycling conditions for each PCR reaction were: 95 °C for 10 min,
followed by 32 cycles of 95 °C for 15 s, 60 °C for 60 s. A dissociation stage of 95 °C for 15
s, 60 °C for 15 s and 95 °C for 15 s was included in all assay runs. Melt curves for each
sample reaction were assessed and compared against the inflection point (Tm)/melt curves for
each species standard curve. Samples were not included in the analysis if melt curves
deviated from the amplicon peak.
Data analysis
Prey detection for each dietary method was compared using FOO. For qPCR, estimates for
each amplified sample were expressed as fg·µl-1 mtDNA represented as mean ± SD. Owing
to the small experimental sample size (n = 1 in most cases) and limited comparative data,
differences amongst diet treatments (male only) were compared using paired t-tests providing
that data assumptions of normality and variance were met (SPSS v. 19, 2010) (IBM Australia
Ltd, St Leonards, NSW, Australia). Data were otherwise transformed or the non-parametric
equivalent performed. Comparisons of qPCR estimates between the male and female sea
lions were only performed for striped perch (50% diet) using the Mann-Whitney U-test.
RESULTS
Sample collection
Thirty faecal samples were collected from the female sea lion. Twenty-eight faecal samples
were collected from the male (Table 1). Ninety-seven per cent of faeces were collected from
the evening enclosures. For the male, 2/10 (43%), 3 (11%), 4 (14%) and 9 (32%) faeces were
collected from diets C1/C2, A, B and D, respectively (Table 1). Faeces were not collected
during diet C. Multiple faecal samples were collected on three consecutive days during diet D
(day 29 (n = 3), day 30 (n = 2), day 33 (n = 2)).

CHAPTER 3: PCR-based techniques to determine diet of the Australian sea lion
121
Prey hard-parts
Prey hard parts were recovered from 23 (82%) faeces collected from the male and 30 (100%)
faeces from the female sea lion. Fish otoliths were the only remains recovered that were
identifiable to species or genus. Only one striped perch otolith was recovered from 6674
otoliths (3337 fish) fed to the female. Seventeen faecal samples produced by the male
contained fish otoliths but only 15 faeces contained otoliths that were identified to species.
Otolith recovery was sporadic (1–22 per faecal sample). In total, 110 (~2%) otoliths were
recovered (Table 3). The percentage of otoliths recovered for each fish species fed ranged
between 0.7 and 6.5% per diet (Table 3). Of these, tommy rough (n = 70) were detected in 13
faeces and striped perch (n = 13) in five faeces. Highly eroded otoliths (n = 27) were
recovered from 10 faecal samples but not assigned a species (Table 3 and Table 4). The
larger size, mass, robustness (r) and number of tommy rough fed compared with striped perch
(6.59 ± 0.44 and 5.93 ± 0.14 mm; Kruskal-Wallis test: χ2= 22.4, df = 86, P = <0.01; 25.5 ±
0.48 and 20.2 ± 1.9 mg; Kruskal-Wallis test: χ 2 = 16.01, df = 86, P = <0.01; 3.85 ± 0.05mm
and 3.47 ± 0.25mg; Kruskal-Wallis test: χ 2 = 12.52, df = 86, P = <0.01; feed ratio ~3:1;
Wilcoxon test, Z = -5.039, P = <0.05; respectively) probably contributed to the greater
number of tommy rough otoliths recovered. Cephalopod beaks were not recovered from the
116 squid consumed by the male.
PCR optimisation
PCR primers showed high specificity in amplifying target DNA of the three taxa tested.
Assays did not amplify sea lion DNA. For qPCR, all assay standard curves showed linearity,
with r2 values ≥0.984 and slopes (Δs) between -3.26 and -3.38. The linear range for each prey
standard was 0.2–20 fg·µl-1 (squid), 0.2–2.0 fg·µl-1 (shark) and 0.2–20 fg·µl-1 (striped perch).
Melt curve profiles complemented standard curves for each species tested (77.5 ± 0.2 and
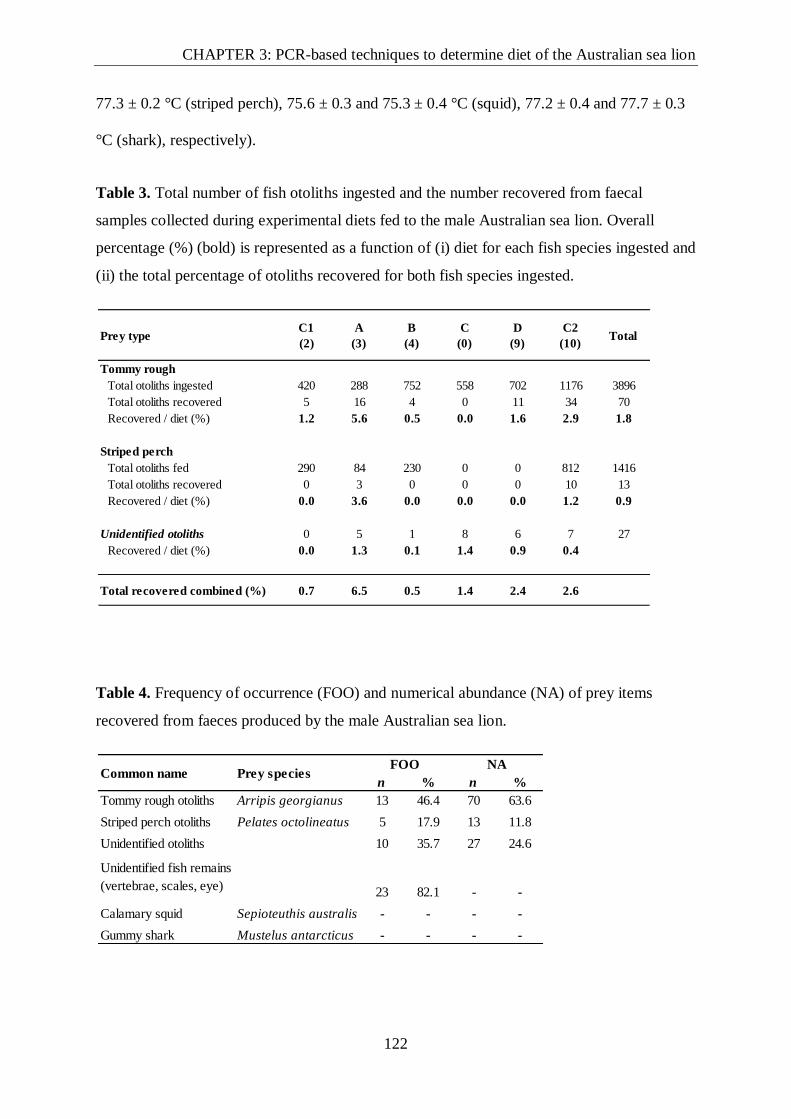
CHAPTER 3: PCR-based techniques to determine diet of the Australian sea lion
122
77.3 ± 0.2 °C (striped perch), 75.6 ± 0.3 and 75.3 ± 0.4 °C (squid), 77.2 ± 0.4 and 77.7 ± 0.3
°C (shark), respectively).
Table 3. Total number of fish otoliths ingested and the number recovered from faecal
samples collected during experimental diets fed to the male Australian sea lion. Overall
percentage (%) (bold) is represented as a function of (i) diet for each fish species ingested and
(ii) the total percentage of otoliths recovered for both fish species ingested.
Table 4. Frequency of occurrence (FOO) and numerical abundance (NA) of prey items
recovered from faeces produced by the male Australian sea lion.
Prey type C1
(2)
A
(3)
B
(4)
C
(0)
D
(9)
C2
(10)Total
Tommy rough
Total otoliths ingested 420 288 752 558 702 1176 3896
Total otoliths recovered 5 16 4 0 11 34 70
Recovered / diet (%) 1.2 5.6 0.5 0.0 1.6 2.9 1.8
Striped perch
Total otoliths fed 290 84 230 0 0 812 1416
Total otoliths recovered 0 3 0 0 0 10 13
Recovered / diet (%) 0.0 3.6 0.0 0.0 0.0 1.2 0.9
Unidentified otoliths 0 5 1 8 6 7 27
Recovered / diet (%) 0.0 1.3 0.1 1.4 0.9 0.4
Total recovered combined (%) 0.7 6.5 0.5 1.4 2.4 2.6
n % n %
Tommy rough otoliths Arripis georgianus 13 46.4 70 63.6
Striped perch otoliths Pelates octolineatus 5 17.9 13 11.8
Unidentified otoliths 10 35.7 27 24.6
Unidentified fish remains
(vertebrae, scales, eye) 23 82.1 - -
Calamary squid Sepioteuthis australis - - - -
Gummy shark Mustelus antarcticus - - - -
Prey speciesCommon nameFOO NA

CHAPTER 3: PCR-based techniques to determine diet of the Australian sea lion
123
Prey detection by PCR and comparison to hard parts
Conventional PCR and qPCR assays equally amplified target DNA for each of the prey
species tested at the percentages fed (10%, 30%, 50% and 60%). In total, striped perch DNA
was detected and identified in 86% (n = 24) of faecal samples, squid in 71% (n = 20) and
shark in 32% (n = 9) of faecal samples produced by the male sea lion (Table 5). Striped perch
DNA was equally detected in all faeces (n = 30) produced by the female using either PCR
technique. For all test species, the frequency of detection using PCR was significantly greater
than detection and identification by prey hard parts (all species and PCR tests: P = <0.001
male and female).
Comparison of prey detection between PCR techniques
Detection of striped perch and squid by qPCR provided better detection frequencies than
conventional PCR in faeces collected from the male. Compared with conventional PCR,
detection of DNA by qPCR increased by 25% (n = 24 faeces versus n = 17 faeces) for striped
perch and 21% (n = 20 faeces versus n = 14 faeces) for squid (Table 5). For both taxa, higher
qPCR FOO resulted from low qPCR estimates for each target species (56.5 ± 44.7 and 50.7 ±
30.0 fg·µl-1, respectively). For striped perch, additional qPCR detections occurred at the
lowest percentage fed (10%) and from four consecutive faecal samples recovered 6 days after
its final ingestion at the conclusion of diet B. For squid, additional qPCR detection occurred
at the lowest percentage fed (10%, diet B, n = 3), and from three faecal samples collected 9
days after the final ingestion of squid. Six faeces collected prior to these did not test positive
for squid DNA.

CHAPTER 3: PCR-based techniques to determine diet of the Australian sea lion
124
qPCR prey comparisons
The qPCR estimates were highly variable amongst faeces of each test species for the
percentages fed in both the male and female sea lion (Figures 1 and 2). For the male,
comparison between striped perch qPCR estimates decreased significantly with a decrease in
percentage fed (mean 2071.3 ± 1468.3 fg·µl-1 (50%), 226.6 ± 146.5 g·µl-1 (30%), 34.51 ±
51.8 fg·µl-1 (10%); all comparisons P = ≤ 0.006). For squid, qPCR estimates were only
significant for higher dietary percentages (60% and 30%) compared with low percentages fed
(10%) (Z = -1.99, P = 0.04, and Z = -2.201, P = 0.027, respectively) but qPCR estimates were
similar at the highest percentages fed (60% and 30%; Z = -0.314, P = 0.75). Faeces collected
from the female sea lion exhibited significantly higher qPCR estimates than the male when
dietary percentages containing 50% striped perch were fed (female: median 10596 fg·µl-1,
mean 9518.2 ± 6633.2 fg·µl-1; male: median 1384 fg·µl-1, mean 2071.3 ± 1468.3 fg·µl-1;
Mann-Whitney U:Z = -5.380, P = <0.001; Fig. 2).

CHAPTER 3: PCR-based techniques to determine diet of the Australian sea lion
125
Table 5. Diet assessment methods used to detect prey (presence / absence) in faeces collected
from the adult male Australian sea lion. Samples (1 - 28) correspond to faeces collected
during the experimental diet periods (see text). Prey contributions for each diet were: tommy
rough (TR), striped perch (SP), squid (SQ), and gummy shark (GS). Detection methods used
for the analysis were: Conventional PCR (PCR), quantitative PCR (qPCR), and hard part
analysis (HPA). * Species not tested.
PCR qPCR HPA PCR qPCR HPA PCR qPCR HPA PCR qPCR HPA
C1 TR : SP 1 * * + + + - - - - - - -
C1 TR : SP 2 * * - + + - - - - - - -
A SQ : TR : SP 3 * * + + + - + + - - - -
A SQ : TR : SP 4 * * + - + + + + - - - -
A SQ : TR : SP 5 * * + - + - + + - - - -
B SQ : TR : SP 6 * * + - + - + + - - - -
B SQ : TR : SP 7 * * - + + - - + - - - -
B SQ : TR : SP 8 * * - + + - + + - - - -
B SQ : TR : SP 9 * * - + + - - + - - - -
D SQ : TR : GS 10 * * + + + - + + - - - -
D SQ : TR : GS 11 * * - - + - + + - + + -
D SQ : TR : GS 12 * * + + + - + + - + + -
D SQ : TR : GS 13 * * + + + - + + - + + -
D SQ : TR : GS 14 * * - - + - + + - + + -
D SQ : TR : GS 15 * * - - - - + + - + + -
D SQ : TR : GS 16 * * + - + - + + - + + -
D SQ : TR : GS 17 * * - - - - + + - + + -
D SQ : TR : GS 18 * * - - - - + + - + + -
C2 TR : SP 19 * * - - - - - + - + + -
C2 TR : SP 20 * * + - + + - - - - - -
C2 TR : SP 21 * * - + + - - - - - - -
C2 TR : SP 22 * * + + + - - - - - - -
C2 TR : SP 23 * * + + + + - - - - - -
C2 TR : SP 24 * * + + + + - - - - - -
C2 TR : SP 25 * * - + + - - - - - - -
C2 TR : SP 26 * * - + + + - + - - - -
C2 TR : SP 27 * * - + + - - + - - - -
C2 TR : SP 28 * * - + + - - + - - - -
Total - - 13 17 24 5 14 20 0 9 9 0
Gummy shark (GS)Squid (SQ)Diet
composition
Scat
sample
Experimental
diet fed
Tommy rough (TR) Striped perch (SP)

CHAPTER 3: PCR-based techniques to determine diet of the Australian sea lion
126
Figure 1. Striped perch, squid and shark qPCR estimates from faeces collected from the
male. Quantitative estimates were compared for faeces collected during the dietary
proportions fed (60%, 50%, 30% and 10%).

CHAPTER 3: PCR-based techniques to determine diet of the Australian sea lion
127
Figure 2. Comparison of striped perch qPCR estimates from faeces collected from the male
and female Australian sea lion when daily dietary proportions contained 50% (3 kg) striped
perch.
DISCUSSION
Similar to DNA-based diet studies on other captive marine predators such as penguins, and
otariid and phocid seals (Deagle et al. 2005; Deagle and Tollit 2007; Matejusová et al. 2008;
Bowles et al. 2011), PCR-based diet analyses were successfully applied in this study to
faeces collected from two captive Australian sea lions fed mixed diets comprising fish, shark
and squid. The use of taxon-specific PCR greatly improved detection rates of all prey taxa
tested, providing a more reliable technique to determine prey ingestion than prey detection by
traditional hard-part analysis. Here, shark, squid and striped perch DNA were respectively
amplified and identified in 32%, 71% and 86% of faeces collected from the male and striped
perch was detected in all faeces collected from the female. In comparison, prey identification
by hard remains such as otoliths or squid beaks was poor, limiting faecal detection to <2% for
both fish taxa in the male, and <1% in the female. Shark and squid were not identified by

CHAPTER 3: PCR-based techniques to determine diet of the Australian sea lion
128
hard parts, further highlighting the advantage of DNA-based techniques to detect and identify
prey that may be retained in the gut or that have soft bodies or fragile digestible remains.
Hard part analysis
The low recovery of prey hard parts from my analyses is consistent with Gales and Cheal
(1992), who documented limited recovery of fish otoliths (<2%) and cephalopod beaks from
captive Australian sea lions fed a range of fish prey and squid. Expansion of their diet study
to faecal analysis of free-living Australian sea lions further emphasised severe constraints in
otolith recovery and condition, favouring a dietary bias toward the most highly robust
remains. In this study, shark was the only taxon not anticipated to produce hard part results.
However, the disparity illustrated between the recovery of fish otoliths and complete loss of
cephalopod remains highlights several biases associated with (i) prey-specific and (ii) animal-
specific digestion.
First, the absence of squid beaks recovered from the male sea lion confirms that amongst
skeletal remains, cephalopods containing large beaks such as Sepioteuthis australis may be
retained within the stomach for prolonged periods. In the present study, cephalopods were
consumed for 28 consecutive days with no evidence of expulsion through regurgitation or
faeces until the experimental trial ended (42 days). Although retention of cephalopod
mouthparts is reasonably common in wild and captive otariid seals (Richardson and Gales
1987; Gales and Cheal 1992; Casper et al. 2006; McIntosh et al. 2006), their recovery was
unreliable using the faeces collected here, imposing severe constraints for diet estimation and
overall underestimating their importance in the diet. If traditional methods are solely used to
infer prey ingestion in free-living seals, such biases could be partly improved if large sample
sizes and complementary sampling of faeces and regurgitate are used (e.g. Page et al. 2005).

CHAPTER 3: PCR-based techniques to determine diet of the Australian sea lion
129
Second, although consumption of both fish species was significantly underestimated, the
discrepancy between the ratio of tommy rough to striped perch ingested by the male (~3:1,
respectively) compared with the overall recovery ratio of each species’ otoliths (~ 5:1,
respectively) suggests that there are differences in otolith digestion between the two fish
species (Table 1). Variability in otolith digestion is common amongst fish species fed to
captive seals (Tollit et al. 1997; Marshall et al. 2010); in particular, Arripidae (tommy rough)
are known to survive digestion well (Casper et al. 2006). The dissection of fresh otoliths
confirm this finding, indicating that tommy rough contained significantly larger, more robust
otoliths than striped perch.
Lastly, despite being fed 20% more fish than the male sea lion, the disparity in otolith
recovery between the female compared with the male sea lion possibly highlights
intraspecific differences associated with digestion or sex differences between the individuals
studied. In this case, the near-complete digestion of both striped perch and tommy rough
otoliths by the female could have resulted from increased gut retention and assimilation of
prey induced by the female’s lengthy periods of inactivity compared with elevated activity
(and greater otolith recovery) in the male. In other captive pinnipeds, such as Californian sea
lions (Zalophus californianus), Steller’s sea lion (Eumetopias jubatus) and South American
fur seals (Arctocephalus australis), activity level has been demonstrated to be implicated in
the recovery of fish remains, biasing diet estimates (Dellinger and Trillmich 1987; Bowen
2000; Orr and Harvey 2001; Tollit et al. 2003). Intra-specific differences amongst individual
captive seals also appear to have some influence on digestive behaviour (Helm 1984; Casper
et al. 2006). The low recovery of remains seem reasonably concordant with results reported
by Gales and Cheal (1992) for other captive Australian sea lions; however, because otoliths
were virtually absent in the female’s faeces, this may indicate the level of digestion is unique

CHAPTER 3: PCR-based techniques to determine diet of the Australian sea lion
130
to the animal studied or an artefact of inactivity in the species per se. Further captive feeding
studies on Australian sea lions would benefit our understanding of digestive physiology in
this species.
Limitations of DNA-based study
Although the primary goal was to test the capability of prey detection using DNA-based
analysis, clear technical and methodological biases inherent in DNA-based feeding trial
studies must be acknowledged here. At the time of the study, few Australian sea lions were
available for captive feeding experiments, which constrained the experimental sample size
and restricted the ability to perform replicate trials. As a result, the small sample size (n = 1 in
most cases) limited the qPCR dietary comparisons, and the irregularity and timing of faeces
produced by the male possibly resulted in the large variation of prey DNA recovered amongst
faeces. As a consequence and unlike other captive DNA-based seal diet studies (e.g. Deagle
and Tollit 2007; Bowles et al. 2011), qualitative data was used omitting development of the
primers for tommy rough although this would have probably provided better comparable data
for the prey species ingested. Furthermore, digestive degradation of DNA can vary
intrinsically amongst species (Deagle and Tollit 2007). It is unclear the level of digestive
variability amongst the prey taxa tested in this study; however, frozen- then-thawed fish fed
to each animal may have differences in cellular breakdown and some effect on DNA quality
of these species prior to PCR amplification. Nonetheless, despite these reservations, short 71-
bp amplicons of each prey tested were still achievable and provided reasonable information
of prey ingestion.
PCR techniques
One objective for this study was to assess conventional and qPCR techniques in order to
evaluate their success in detecting target DNA from faeces primarily devoid of identifiable

CHAPTER 3: PCR-based techniques to determine diet of the Australian sea lion
131
prey remains. Qualitatively, both PCR techniques demonstrated similar capabilities to detect
prey DNA from faeces collected across the range of prey percentages fed (10%, 30%, 50%
and 60%; Table 5). However, the sensitivity of qPCR (~≤0.2 x 10⁻⁵ ng·species-1) supported
by the sample melt curve analyses provided a higher detection frequency than conventional
PCR for striped perch and squid in faeces collected from the male. In each case, the observed
differences (n = 7 and n = 6 faeces, respectively) resulted from low qPCR estimates of target
DNA, with most detections occurring after the prolonged absence of each prey in the diet
(~6-9 days). The propensity of qPCR to detect such low concentrations of target DNA from
faeces of other pinnipeds (e.g. Steller sea lions (5.2 x 10⁻⁴ ng·species-1), grey
seals (0.01%, salmonids) (Matejusová et al. 2008; Bowles et al. 2011), suggests these prey
detections probably resulted from amplification of remnant DNA from tissue remaining in the
gut. Furthermore, as faecal DNA for both conventional and qPCR tests were derived from the
same samples, the discrepancy observed between the two PCR techniques therefore probably
reflects a limitation in end-product resolution (gel-visualisation) of conventional PCR (e.g.
Marshall et al. 2010; Bowles and Trites 2013).
Despite the accuracy of the qPCR standard curves, the limitation of small sample sizes
affected the qPCR results, providing little quantitative information for the diets tested.
Although targeted amplicons of the same size were used to partly control for differential
digestion, the faecal qPCR estimates for each species tested varied widely (Figs 1 and 2)
bearing little congruence with the different percentages of prey fed. The only meaningful
comparison amongst diets (male only) indicated larger prey percentages (i.e. 60%, 50% and
30%) produced higher qPCR estimates compared with small dietary percentages (e.g. 10%);
however, differences between higher prey percentages (60% versus 30% striped perch, 50%
versus 30%, squid) were negligible, with each exhibiting extensive overlap.

CHAPTER 3: PCR-based techniques to determine diet of the Australian sea lion
132
Interestingly, there was a marked increase in qPCR estimate between the male and female
when fed 50% striped perch (Fig. 2). This result was surprising, as it was expected the
female’s qPCR estimates to be lower than that of the male given the animal’s inactivity and
the limited recovery of prey hard parts. One possible explanation could be physiological
digestive differences between each animal studied; however, one would expect DNA
degradation to be somewhat consistent with the high level of digestion of prey remains.
Alternatively, this result may indicate some methodological bias, possibly related to greater
binding efficiency of striped perch that occurred during PCR amplification. It is difficult to
draw inference from this limited data; thus, future attempts at quantifying the diet of captive
sea lions using this method should where possible, focus efforts to include additional
individuals and either longer feeding periods or a greater number of replicates of each diet.
Amplifying a small 71-bp fragment of mtDNA using prey-specific primers clearly provided a
reliable method to elucidate prey ingestion in this study. However, the relative ease of
designing short-fragment species-specific PCR tests compared with amplifying broader
taxonomic groups using a group-specific PCR approach (e.g. Jarman et al. 2004, 2006) may
impose some challenges for faecal- based analysis of Australian sea lions where DNA is
likely to be degraded (Kohn et al. 1995; Kohn and Wayne 1997; Deagle et al. 2006; Casper
et al. 2007a). The likelihood of detecting prey DNA recovered from faeces has been shown to
increase with a decrease in target amplicon size (Deagle et al. 2006); thus, targeting larger
homologous binding regions that amplify across multiple species (i.e. fish) may miss prey
DNA in template that is highly fragmented. Conversely, targeting smaller prey fragments
may be taxonomically less informative, limiting the ability to distinguish amongst closely
related prey. The unsuccessful attempts to amplify 100-250-bp prey amplicons tend to

CHAPTER 3: PCR-based techniques to determine diet of the Australian sea lion
133
suggest a degraded starting template, although whether this also applies to other individuals
or samples collected from the wild is yet to be determined. Upcoming dietary analysis of the
Australian sea lion will invariably consider genetic-based faecal techniques following the fine
taxonomic scale of dietary information obtained for other pinniped species (Deagle et al.
2005; Casper et al. 2007a). However, the resolution of prey diversity may depend on the PCR
product size obtainable.
Conclusion and future directions
The consideration of dietary techniques to determine prey consumption in free-living marine
predators often depends on the accessibility and availability of individuals to acquire
samples. In active mobile foragers such as seals, traditional faecal analysis has provided a
reliable, non-invasive source of dietary information to ascertain predator–prey relationships
and emphasise interactions with fisheries (Gales and Pemberton 1994; Kirkwood et al.2008;
Marshall et al. 2010). DNA-based diet assessments are now routinely adapted to seal faecal
analysis, and although not free of bias, are providing highly resolved information of specific
prey groups and targeted taxa (Parsons et al. 2005; Casper et al. 2007a,b; Tollit et al.2009).
More informative, next-generation high-through put sequencing is further contributing
substantial trophic information enabling greater inference at broader ecological scales
(Deagle et al. 2009, 2010; Soininen et al. 2010).
Prey differentiation utilising genetic information obtained from either faecal or stomach
contents presents a number of unique challenges because intrinsic biases resulting from
differences in tissue digestibility and the susceptibility of DNA to degradation can be
influenced by the behavioural and physiological characteristics of the consumer. The three
techniques explored here exhibited notable differences; however, the consistent DNA signals
and resolution obtained by PCR compared with limited detection by hard-part analysis clearly

CHAPTER 3: PCR-based techniques to determine diet of the Australian sea lion
134
highlight its suitability as a method to successfully detect and identify prey. In light of these
results, future studies utilising PCR-based analysis that incorporate broader taxonomic groups
and/or next-generation sequencing will provide valuable information of prey consumed by
Australian sea lions.
ACKNOWLEDGEMENTS
This study was supported through the Australian Government National Heritage Trust (NHT)
grants scheme, Nature Foundation SA, and the Wildlife Conservation Fund. I thank the South
Australian Research and Development Institute (SARDI) Molecular Diagnostics group for
laboratory support in particular, Dr A. McKay, T. Mammone, Ina Dumitrescu and staff. I
thank the Zoos South Australia particularly Adelaide Zoological Gardens and staff for the use
of their sea lion facility and animals to conduct these trials. Particular thanks to Dr. C. West,
C. Fulton and J. Hakof for their in kind contribution to this project. S. Jarman, and B. Deagle
of the Australian Antarctic Division provided invaluable support for this project. The Fish
Factory supplied the feed stock for the project. Thanks to R. McIntosh, B. Page, J. McKenzie,
P. Shaughnessy, A. Baylis, L. Einoder and J. Hicks for providing useful comments on this
manuscript. I thank T. Ward, A. McKay and SARDI for logistical support. This project was
funded by grants prepared and submitted by K. Peters and S. Goldsworthy. Kristian Peters
was the recipient of an Adelaide University postgraduate award. This research project was
conducted under the Department for Environment and Heritage (DEH) ethics permit A24684
6 and Adelaide University ethics permit S80-2004. S.D.G and N.J.B. were supported by
Marine Innovation South Australia (MISA), an initiative of the South Australian
Government.

CHAPTER 3: PCR-based techniques to determine diet of the Australian sea lion
135
REFERENCES
Altschul, S. F., Gish, W., Miller, W., Myers, E.W., and Lipman, D. J. (1990). Basic local
alignment search tool. Journal of Molecular Biology, 215, 403–410.
Baylis, A. M. M. and Nichols, P. D. (2009a). Milk fatty acids predict the foraging locations
of the New Zealand fur seal: continental shelf versus oceanic waters. Marine Ecology
Progress Series, 380, 271–286.
Baylis, A. M. M., D. J., Hamer, D., and Nichols, P. D. (2009b). Assessing the use of milk
fatty acids to infer the diet of the Australian sea lion (Neophoca cinerea). Wildlife
Research, 36, 169–176.
Bowen, W. D. (2000). Reconstruction of pinniped diets: accounting for complete digestion of
otoliths and cephalopod beaks. Canadian Journal of Fisheries and Aquatic Sciences.
57, 898–905.
Bowles, E., Schulte, P. M., Tollit, D. J., Deagle, B. E., and Trites, A.W. (2011). Proportion of
prey consumed can be determined from faecal DNA using real-time PCR. Molecular
Ecology Resources, doi: 10.1111/j.1755-0998.2010.02974.x.
Bowles, E., and Trites, A.W. (2013). Faecal DNA amplification in Pacific walruses
(Odobenus rosmarus divergens). Polar Biology, 36, 755–759. doi 10.1007/s00300-
013-1296-6.
Boyle, P. R., Pierce, G. J., and Diack, J. S.W. (1991). Sources of evidence for salmon in the
diets of seals. Fisheries Research, 10, 137–150.
Braley, M., Goldsworthy, S. D., Page, B., Steer, M., and Austin, J. J. (2009). Assessing
morphological and DNA-based diet analysis techniques in a generalist predator, the
arrow squid, Nototodarus gouldi. Molecular Ecology Resources, 10, 466–474.

CHAPTER 3: PCR-based techniques to determine diet of the Australian sea lion
136
Campbell, R. A., Gales, N. J., Lento, G. M., Baker, C. S. (2008). Islands in the sea: extreme
female natal site fidelity in the Australian sea lion, Neophoca cinerea. Biology Letters,
4, 139–142.
Casper, R. M., Gales, N. J., Hindell, M. A., and Robinson, S.M. (2006). Diet estimation
based on an integrated mixed prey feeding experiment using Arctocephalus seals.
Journal of Experimental Marine Biology and Ecology, 328, 228–239.
Casper, R. M., Jarman, S. N., Gales, N. J., and Hindell, M. A. (2007a). Combining DNA and
morphological analyses of faecal samples improves insight into trophic interactions: a
case study using a generalist predator. Marine Biology, 152, 815–825.
Casper, R. M., Jarman, S. N., Deagle, B. E., Gales, N. J., and Hindell, M. A. (2007b).
Detecting prey from DNA in predator scats: A comparison with morphological
analysis, using Arctocephalus seals fed a known diet. Journal of Experimental Marine
Biology and Ecology, 347, 144–154.
Childerhouse, S., Dix, B., and Gales, N. (2001). Diet of New Zealand sea lions (Phocarctos
hookeri) at the Auckland Islands. Wildlife Research, 28, 291–298.
Deagle, B. E., Tollit D. J., Jarman S. N., Hindell, M. A., Trites, A. W., and Gales, N.J.
(2005a). Molecular scatology as a tool to study diet: analysis of prey DNA in scats
from captive Steller sea lions. Molecular Ecology, 14, 1831–1842.
Deagle, B. E., Jarman, S. N., Pemberton, D., and Gales, N. J. (2005b). Genetic screening of
prey in the gut contents from a giant squid (Architeuthis sp). Journal of Heredity, 96,
417–423.
Deagle, B. E., Eveson, J. P., and Jarman, S.N. (2006). Quantification of damage in DNA
recovered from highly degraded samples- a case study on DNA in faeces. Frontiers in
Zoology, 3, 1–10.

CHAPTER 3: PCR-based techniques to determine diet of the Australian sea lion
137
Deagle, B. E., and Tollit, D. J. (2007). Quantitative analysis of prey DNA in pinniped faeces:
potential to estimate diet composition? Conservation Genetics, 8, 743–747.
Deagle, B. E., Kirkwood, R., and Jarman, S. N. (2009). Analysis of Australian fur seal diet by
pyrosequencing prey DNA in faeces. Molecular Ecology, 18, 2022–2038.
Deagle, B. E., Chiaradia, A., McInnes, J., Jarman, S. N. (2010). Pyrosequencing faecal DNA
to determine diet of little penguins: is what goes in what comes out? Conservation
Genetics, 11, 2039–2048.
Dellinger, T., and Trillmich, F. (1987). Estimating diet composition from scat analysis in
otariid seals (Otariidae): is it reliable? Canadian Journal of Zoology, 66, 1865–1870.
Dunn, M. R., Szabo, A., McVeagh, M. S., and Smith, P. J. (2010). The diet of deepwater
sharks and the benefits of using DNA identification of prey. Deep Sea Research Part
I: Oceanographic Research Papers, 57, 923–930. ISSN 0967-0637.
http://dx.doi.org/10.1016/j.dsr.2010.02.006.
Fea, N. I., Harcourt, R., and Lalas, C. (1999). Seasonal variation in the diet of New Zealand
fur seals (Arctocephalus forsteri) at Otago Peninsula, New Zealand. Wildlife Research
26, 147–160.
Gales, N. J., and Cheal, A. J. (1992). Estimating diet composition of the Australian sea lion
(Neophoca cinerea) from scat analysis: an unreliable technique. Wildlife Research,
19, 447–456.
Gales, R., and Pemberton, D. (1994). Diet of Australian fur seals. Australian Journal of
Marine and Freshwater Research, 45, 653–664.
Gibbs, S. E. (2008). Retention and condition of cephalopod beaks in the stomach of an
Australian sea lion (Neophoca cinerea). Australian Mammalogy, 29, 241–244.

CHAPTER 3: PCR-based techniques to determine diet of the Australian sea lion
138
Goldsworthy, S. D., Page, B., Shaughnessy, P. D., Hamer, D., Peters, K. J., McIntosh, R. R.,
Baylis, A. M. M., and McKenzie, J. (2009). Innovative solutions for aquaculture
planning and management: addressing seal interactions in the finfish aquaculture
industry. South Australian Research and Development Institute (Aquatic Sciences),
Adelaide. SARDI Aquatic Sciences Publication Number F2008/000222–1. SARDI
Research Report Series Number 288, pp 1–174.
Harvey, J. T. (1989). Assessment of errors associated with harbor seals (Phoca vitulina)
faecal sampling. Journal of Zoology (London), 247, 177–181.
Helm, R. C. (1984). Rate of digestion in three species of pinnipeds. Canadian Journal of
Zoology, 62, 1751–1756.
Jarman, S. N., Deagle, B. E., and Gales, N. J. (2004). Group-specific polymerase chain
reaction for DNA-based analysis of species diversity and identity in dietary samples.
Molecular Ecology, 13, 1313–1322.
Jarman, S. N., Redd, K., and Gales, N. J. (2006). Group specific primers for amplifying DNA
sequences that identify Amphipoda, Cephalopoda, Echinodermata, Gastropoda,
Isopoda, Ostracoda and Thoracia. Molecular Ecology, 6, 268–271.
King, R. A., Read, D. S., Traugott, M., and Sydmondson, W.O.C. (2008). Molecular analysis
of predation: a review of best practice for DNA-based approaches. Molecular
Ecology, 17, 947–963.
Kvitrud, M. A., Reimer, S. D., Brown, R. F., Bellinger, M. R., and Banks, M.A. (2005).
Pacific harbor seals (Phoca vitulina) and salmon: genetics presents hard numbers for
elucidating predator prey dynamics. Marine Biology, 147, 1459–1466.
Kohn, M., Knauer, F., Stofella, A., Schroder, W., Paabo, S. (1995). Conservation genetics of
the European brown bear- a study using excremental PCR of nuclear and
mitochondrial sequences. Molecular Ecology 4, 95–103.

CHAPTER 3: PCR-based techniques to determine diet of the Australian sea lion
139
Kohn, M. H., and Wayne, R. K. (1997). Facts from feces revisited. Trends in Ecology and
Evolution, 12, 223–227.
Ling, J. K. (1992). Neophoca cinerea. Mammalian Species, 392, 1–7.
Longenecker, K. (2010). Fishes in the Hawaiian monk seal diet, based on regurgitate samples
collected in the Northwestern Hawaiian Islands. Marine Mammal Science, 26, 420–
429.
Lowther, A., and Goldsworthy, S. D. (2010). Detecting alternate foraging ecotypes in
Australian sea lion (Neophoca cinerea) colonies using stable isotope analysis. Marine
Mammal Science, 27, 567–586.
Lowther A. D., Harcourt, R. G., Hamer, D. J., and Goldsworthy, S. D. (2011). Creatures of
habit: foraging habitat fidelity of adult female Australian sea lions. Marine Ecology
Progress Series, 443, 249–263.
Lowther A. D., Harcourt, R. G., Goldsworthy, S. D., and Stow, A. (2012). Population
structure of adult female Australian sea lions is driven by fine-scale foraging site
fidelity. Animal Behaviour, 83, 691–701.
Marshall, H. D., Hart, K. A., Yaskowiak, G. B., Stenson, G. B., McKinnon, D., and Perry, E.
A. (2010). Molecular identification of prey in the stomach contents of Harp Seals
(Pagophilus groenlandicus) using species-specific oligonucleotides. Molecular
Ecology Resources, 10, 181–189.
Matejusová, I., Doig, F., Middlemas S. J., S. Mackay, Douglas, A., Armstrong, J. D.,
Cunningham, C. O., and Snow, M. (2008). Using quantitative real-time PCR to detect
salmonid prey in scats of grey Halichoerus grypus and harbour Phoca vitulina seals in
Scotland — an experimental and field study. Journal of Applied Ecology, 45, 632–
640.

CHAPTER 3: PCR-based techniques to determine diet of the Australian sea lion
140
McIntosh, R., Page, B., and Goldsworthy, S.D. (2006). Dietary analysis of regurgitates and
stomach samples from free-living Australian sea lions. Wildlife Research, 33, 661–
669.
McKenzie, J., Goldsworthy, S. D., Shaughnessy, P. D., and McIntosh, R. (2005).
Understanding the impediments to the growth of Australian sea lion populations.
South Australian Research and Development Institute (Aquatic Sciences), Adelaide,
107 pp. SARDI Aquatic Sciences Publication Number, RD01/0171.
Needham, D. J. (1997). The role of stones in the sea lion stomach: Investigations using
contrast radiography and fluoroscopy. In: Hindell, M.A., Kemper, C. (Ed.). Marine
Mammal Research in the Southern Hemisphere. Chipping Norton, Surrey Beatty &
Sons Pty. Ltd., Australia, Vol. 1: Status, Ecology and Medicine, pp 164 –169.
Orr, A. J., and Harvey, J. T. (2001). Quantifying errors associated with using faecal samples
to determine the diet of the Californian sea lion (Zaloplus californianus). Canadian
Journal of Zoology, 79, 1080–1087.
Page, B., McKenzie, J., and Goldsworthy, S. D. (2005). Dietary resource partitioning among
sympatric New Zealand and Australian fur seals. Marine Ecology Progress Series,
293, 283–302.
Parsons, K. M., Piertney, S. B., Middlemas, S. J., Hammond, P. S., and Armstrong,
J.D. (2005) DNA-based identification of salmonid prey species in seal faeces. Journal
of Zoology, 266, 275–281.
Purcell, M., Mackey, G., and LaHood, E. (2004). Molecular methods for the genetic
identification of salmonid prey from pacific harbor seal (Phoca vitulina) scat.
Fisheries Bulletin, 102, 213–220.
Richardson, K. C., and Gales, N. J. (1987). Functional morphology of the alimentary tract of
the Australian sea-lion, Neophoca cinerea. Australian Journal of Zoology, 35, 219–
226. doi:10.1071/ZO9870219
CHAPTER 3: PCR-based techniques to determine diet of the Australian sea lion
141
Shaughnessy, P. D., Goldsworthy, S. D., Hamer, D., Page, B., and McIntosh, R. R. (2011).
Australian sea lions Neophoca cinerea at colonies in South Australia: distribution and
abundance, 2004 to 2008. Endangered Species Research, 13, 87–98.
Soininen, E. M., Valentini, A., Coissac, E., Miquel, C., Gielly, L., Brochmann, C., Brysting,
A. K., Sønstebø, J. H., Ims, R. A., Yoccoz, N. G., and Taberlet, P. (2010). Analysing
diet of small herbivores: the efficiency of DNA barcoding coupled with high-
throughput pyrosequencing for deciphering the composition of complex plant
mixtures. Frontiers in Zoology, 6, 16.
Staniland, I. J. (2002). Investigating the biases in the use of hard prey remains to identify diet
composition using Antarctic fur seals (Arctocephalus gazella) in captive feeding trials.
Marine Mammal Science, 18, 223–243.
Sydmonson, W. O. C. (2002). Molecular identification of prey in predator diets. Molecular
Ecology, 11, 627–641.
Tollit, D. J., Steward, M. J., Thompson, P. M., Pierce, G. J., Santos, M. B., and Hughes, S.
(1997). Species and size differences in the digestion of otoliths and beaks:
implications for estimates of pinniped diet composition. Canadian Journal of
Fisheries and Aquatic Science, 54, 105–119.
Tollit, D. J., Wong, M., Winship, A. J., Rosen, D. A., and Trites, A.W. (2003). Quantifying
errors associated with using prey skeletal structures from fecal samples to determine
the diet of Steller's sea lion (Eumetopias jubatus). Marine Mammal Science, 19, 724–
744.
Tollit, D. J., Schulze, A. D., Trites, A. W., Olesiuk, P. F., Crockford, S. J., Gelatt, T. S.,
Ream, R. R.,and Miller, K. M. (2009). Development and application of DNA
techniques for validating and improving pinniped diet estimates. Ecological
Applications, 19, 889–905.
CHAPTER 3: PCR-based techniques to determine diet of the Australian sea lion
142
Walker, G. E., and Ling, J. K. (1981). Australian sea lion Neophoca cinerea (Péron, 1816).
In: Ridgway, S.H., Harrison R.J. (Eds). Handbook of Marine Mammals; the Walrus,
Sea Lions, Fur Seals and Sea Otter. Academic Press, London, Volume 1, pp 99–118.
Ward, R. D., Zemlak, T. S., Innes, B. H., Last, P. R., and Hebert, P. D. N. (2005). DNA
barcoding Australia’s fish species. Philosophical Transactions of the Royal Society B.
Biological Sciences, 360, 1847–1857.
Ward, R. D., Holmes, B. H., White, W. T., and Last P. R. (2008). DNA barcoding
Australasian chondrichthyans: results and potential uses in conservation. Australian
Journal of Marine Freshwater Research, 59, 57–71.

143
CHAPTER 4
Fine-scale diet of the Australian sea lion (Neophoca
cinerea) using DNA-based analysis of faeces
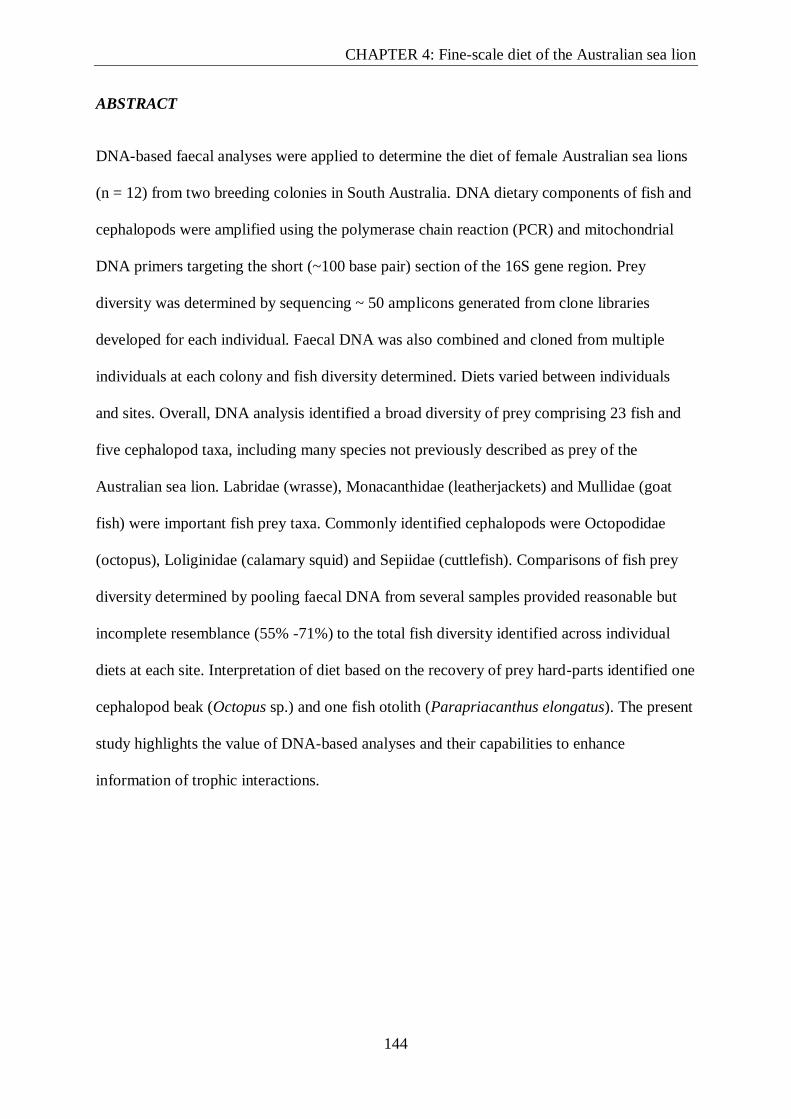
CHAPTER 4: Fine-scale diet of the Australian sea lion
144
ABSTRACT
DNA-based faecal analyses were applied to determine the diet of female Australian sea lions
(n = 12) from two breeding colonies in South Australia. DNA dietary components of fish and
cephalopods were amplified using the polymerase chain reaction (PCR) and mitochondrial
DNA primers targeting the short (~100 base pair) section of the 16S gene region. Prey
diversity was determined by sequencing ~ 50 amplicons generated from clone libraries
developed for each individual. Faecal DNA was also combined and cloned from multiple
individuals at each colony and fish diversity determined. Diets varied between individuals
and sites. Overall, DNA analysis identified a broad diversity of prey comprising 23 fish and
five cephalopod taxa, including many species not previously described as prey of the
Australian sea lion. Labridae (wrasse), Monacanthidae (leatherjackets) and Mullidae (goat
fish) were important fish prey taxa. Commonly identified cephalopods were Octopodidae
(octopus), Loliginidae (calamary squid) and Sepiidae (cuttlefish). Comparisons of fish prey
diversity determined by pooling faecal DNA from several samples provided reasonable but
incomplete resemblance (55% -71%) to the total fish diversity identified across individual
diets at each site. Interpretation of diet based on the recovery of prey hard-parts identified one
cephalopod beak (Octopus sp.) and one fish otolith (Parapriacanthus elongatus). The present
study highlights the value of DNA-based analyses and their capabilities to enhance
information of trophic interactions.

CHAPTER 4: Fine-scale diet of the Australian sea lion
145
STATEMENT OF AUTHORSHIP
Title of Paper
Fine-scale diet of the Australian sea lion (Neophoca cinerea) using
DNA-based analysis of faeces
Publication Status Published Accepted for Publication
Submitted for PublicationUnpublished and Unsubmitted work written in manuscript style
Publication Details Marine Ecology, 36 (3), 1–21. doi: 10.1111/maec.12145
Principal Author
Name of Principal Author (Candidate) Kristian Peters
Contribution to the Paper
Conceived the study, secured funding, undertook fieldwork, performed analysis on all samples,
analysed and interpreted data, performed statistical analysis, wrote manuscript and acted as
corresponding author.
Overall percentage (%) 90%
Certification: This paper reports on original research I conducted during the period of my Higher Degree by
Research candidature and is not subject to any obligations or contractual agreements with a
third party that would constrain its inclusion in this thesis. I am the primary author of this paper.
Signature
Date 28 October 2016
Co-Author Contributions
By signing the Statement of Authorship, each author certifies that:
the candidate’s stated contribution to the publication is accurate (as detailed above);
permission is granted for the candidate in include the publication in the thesis; and
the sum of all co-author contributions is equal to 100% less the candidate’s stated contribution.
Name of Co-Author Kathy Ophelkeller
Contribution to the Paper Contributed to conception of paper, provided comments and supervision
Signature
Date 28 October 2016

CHAPTER 4: Fine-scale diet of the Australian sea lion
146
Name of Co-Author Nathan Bott
Contribution to the Paper Guidance with laboratory analysis, provided comments on manuscript draft
Signature
Date 28 October 2016
Name of Co-Author Bruce Deagle
Contribution to the Paper Guidance with laboratory analysis, provided comments on manuscript draft
Signature
Date 28 October 2016
Name of Co-Author Simon Jarman
Contribution to the Paper Guidance with laboratory analysis, provided comments on manuscript draft
Signature
Date 28 October 2016
Name of Co-Author Simon Goldsworthy
Contribution to the Paper Conceived the study, secured funding, provided comments to manuscript drafts and
supervision.
Signature
Date 28 October 2016
CHAPTER 4: Fine-scale diet of the Australian sea lion
147
INTRODUCTION
Understanding feeding preferences is often the focus of ecological studies (Myers et al. 2007;
Chiaradia et al. 2010). For high-order marine predators, information of diet is pivotal in the
development of management strategies, as diet provides an insight into mitigating
interactions between fisheries and elucidates important foraging habitat (Tollit et al. 1998;
McConnell et al. 1999; Childerhouse et al. 2001).
Pinniped dietary information has been derived from analyses of prey hard-parts recovered
from regurgitates, faeces or stomach contents and from predator tissues containing dietary
fatty acids (FAs) or stable isotopes (SIA). Analysis of digesta for hard-parts is mostly non-
invasive and can provide species-level taxonomic identification from undigested prey
remains, and composition ratios of FAs and SIAs incorporated into a predator’s tissues can be
used to distinguish prey consumed over time, but these methods have well understood
problems (Childerhouse et al. 2001; Iverson et al. 2004; Meynier et al. 2008, 2009; Baylis
and Nichols 2009a; Baylis et al. 2009b). For example, the remains of prey hard-parts are
subject to species-specific erosion and digestive retention, which can bias results (Tollit et al.
1997, 2003). Further, for consumers with broad dietary habits, FAs and SIAs are of limited
use because they have low taxonomic and temporal resolution (Tollit et al. 1997; Dalsgaard
et al. 2003; Baylis et al. 2009b; Meynier et al. 2009).
Polymerase chain reaction (PCR)-based DNA approaches, which aim to characterise the
composition of prey DNA recovered from stomach and faecal remains, have become widely
used for studying trophic interactions in marine environments (see Deagle et al. 2005b; King
et al. 2008; Nejstgaard et al. 2008; Barnett et al. 2010; Marshall et al. 2010). DNA-based
methods also have problems; for instance, prey identification is dependent on the survival of
DNA during the digestive process, which may vary between species and quantity or tissue

CHAPTER 4: Fine-scale diet of the Australian sea lion
148
type consumed (Deagle and Tollit 2007; Hartmann et al. 2011) and limit resolution to the
most recent meals ingested (Deagle et al. 2005a; Casper et al. 2007b). Nevertheless, these
methods are well suited to studying the diet of species where few prey remains can be
recovered. For otariids such as fur seals and sea lions, DNA-based diet studies provide both
complementary and alternative approaches to conventional hard-part analysis (Casper et al.
2007b; Deagle et al. 2009; Tollit et al. 2009).
Australian sea lions (Neophoca cinerea) are one of the rarest otariid seals in the world. The
current population estimate of ~14,780 individuals (Shaughnessy et al. 2005, 2011) is
distributed among 76 breeding colonies extending from Houtman-Abrolhos, Western
Australia (113°47′ E, 28°43′ S) to the Pages Islands (35°45′ S, 138°18′ E), South Australia
(McKenzie et al. 2005; Campbell et al. 2008; Shaughnessy et al. 2011; Lowther et al. 2012).
Females exhibit an atypical, non-annual (~17.5 months) reproductive cycle coupled with high
maternal site fidelity and low dispersal between breeding colonies (Higgins 1993; Higgins
and Gass 1993; Gales et al. 1994; Campbell et al. 2008). This reproductive strategy may
reflect reduced dependency on seasonal productivity typical of many annual breeding otariids
(Lea et al. 2002; Baylis et al. 2008; Lowther et al. 2012), a theory supported by recent studies
highlighting temporal resource stability and habitat specialisation (Lowther et al. 2011).
The diet of the Australian sea lion is poorly understood. Previous studies indicate Australian
sea lions consume a range of benthic prey comprising teleost fish, crustaceans and
cephalopods, but few identifiable remains have been recovered (Richardson and Gales 1987;
Gales and Cheal 1992; McIntosh et al. 2006; Gibbs 2008; Baylis et al. 2009b; Lowther and
Goldsworthy 2010). Feeding trials of captive sea lions indicate that less than 2% of otoliths
are recovered and that larger prey items such as cephalopod beaks are often retained within

CHAPTER 4: Fine-scale diet of the Australian sea lion
149
the digestive tract (Gales and Cheal 1992; McIntosh et al. 2006; Gibbs 2008; K.J. Peters,
unpublished data).
In this study, faecal samples were collected from two Australian sea lion colonies in the Great
Australian Bight (GAB) South Australia, and identify prey taxa from both hard-parts and
prey DNA. The DNA of prey was PCR amplified using ‘group-specific’ genetic markers for
fish and cephalopods, which are common prey (Gales and Cheal 1992; McIntosh et al. 2006).
My aims were to: (i) determine the diversity of prey taxa by sequencing a large number of
clones from a few individuals, (ii) compare the prey taxa recovered at two study sites, and
(iii) determine whether pooling faecal DNA from multiple individuals provides a useful
means to characterise diet at the colony/population level.
MATERIALS AND METHODS
Sample collection
Faecal samples were collected from female Australian sea lions during July-August 2006 at
two breeding colonies in South Australia, Lilliput Island (LI), Nuyt’s Archipelago (32° 26'
4.44" S, 133° 41' 34.79" E) and Seal Bay, Kangaroo Island (KI) (35º 59' 49'' S, 137º 18' 21''
E) (Fig. 1). For KI, fresh samples (soft and collected within ~12 hours of deposition) were
collected whole. Samples from LI were collected via passive enema from individuals that had
been recaptured to remove satellite tracking equipment. These individuals were caught by
hoop net and anaesthetised using Isoflurane® (Veterinary Companies of Australia, Artarmon,
New South Wales) administered via Cyprane Tec III gas-anaesthetic vaporiser (Advanced
Anaesthetic Specialists, Melbourne). Enemas used distilled water and the faecal matter was
stored in sterile jars. When samples settled, the water was removed. For both KI and LI,
faecal samples were homogenised in sterile bags (Nasco-Whirl-Pak®;Nasco, Fort Atkinson,
WI, USA) containing 95% ethanol and stored at -20oC. Prior to DNA extraction, prey hard-

CHAPTER 4: Fine-scale diet of the Australian sea lion
150
parts were isolated from ethanol/scat mixtures by washing through 1.0 and 0.5 mm nested
sieves. Fish otoliths and cephalopod beaks were photographed using digital microscopy
supported by image analysis software Image Pro 5.1©. All prey items were identified to the
lowest taxonomic level by comparison with reference collections and atlases (Lu and
Ickeringill 2002; Furlani et al. 2007).
To assess the number of prey taxa identified from individual samples, I utilised faecal DNA
from 6 individuals per site (total 12 individuals for analysis) (Fig. 2). I also compared
individual data to a pooled dietary approach for the fish component of the diet. In the pooled
approach, extracted DNA samples were pooled at each site before analysis.
Molecular analysis
For DNA extraction, ethanol / faecal mixtures were re-suspended within each bag and a sub-
sample taken. The ethanol supernatant was removed from the soft- matrix and the remaining
faecal material was freeze-dried. Samples were macerated with sterile mortar and pestle,
homogenised, and a 200-mg sample of dry faecal material was removed for DNA extraction.
DNA was extracted using the QIAamp DNA Stool Mini Kit (QIAGEN, Venlo, the
Netherlands) and eluted in 100 µl buffer. DNA yield was initially quantified on a Wallac1420
multi-label fluorometer using PicoGreen® dsDNA Quantitation reagent (Molecular Probes-
Invitrogen®; Invitrogen, Mulgrave, Vic, Australia). DNA was diluted to 3000 pg·µl-1 (~1:5)
in distilled water prior to PCR. Extraction blanks were used to monitor DNA extraction
contamination for each batch of 12 extractions.
Extracted DNA from each sample was re-homogenised and a 25-µl sub-sample was removed.
Each DNA sub-sample was then divided into two equal 12.5-µl volumes with one volume
used for the individual diet PCR- sequence analysis and the other one was combined (i.e.
pooled) with the five remaining DNA sub-samples from the same site to form a single DNA

CHAPTER 4: Fine-scale diet of the Australian sea lion
151
meta-sample. This ensured that clone sequence library results from each individual and
pooled diet analysis were drawn from the same volume of DNA.
16S Fish primer set
The fish primer set (PCR A) amplifies ~100 bp fragment of the 16S mtDNA of chordates
(Table 1). This primer set was designed for the DNA-based study by Deagle et al. (2009) to
describe prey in the diet of the Australian fur seal (Arctocephalus pusillus doriferus). These
primers were chosen for their potential to identify a large diversity of fish prey species, their
short target amplicon size, and the large range of 16S prey sequence information available in
GenBank. The specificity of the primer set was tested using amplification of genomic DNA
extracted from a range of fishes, elasmobranchs, crustaceans and cephalopods obtained from
benthic trawl experiments in the GAB conducted by the South Australian Research and
Development Institute (SARDI). These were also used as positive controls during PCR
(Table 1). This primer set also amplifies DNA of other chordates including the Australian sea
lion. As faeces contain host DNA from epithelial cells (Albaugh et. al. 1992; Kohn and
Wayne, 1997), the addition of a mitochondrial blocking primer was used to reduce binding
and preferential amplification of sea lion DNA over prey DNA (Vestheim and Jarman, 2008).
The blocking primer was added at 10 times the concentration of the fish primer set for PCR
amplification (see Vestheim et al. 2011) (Table 2).
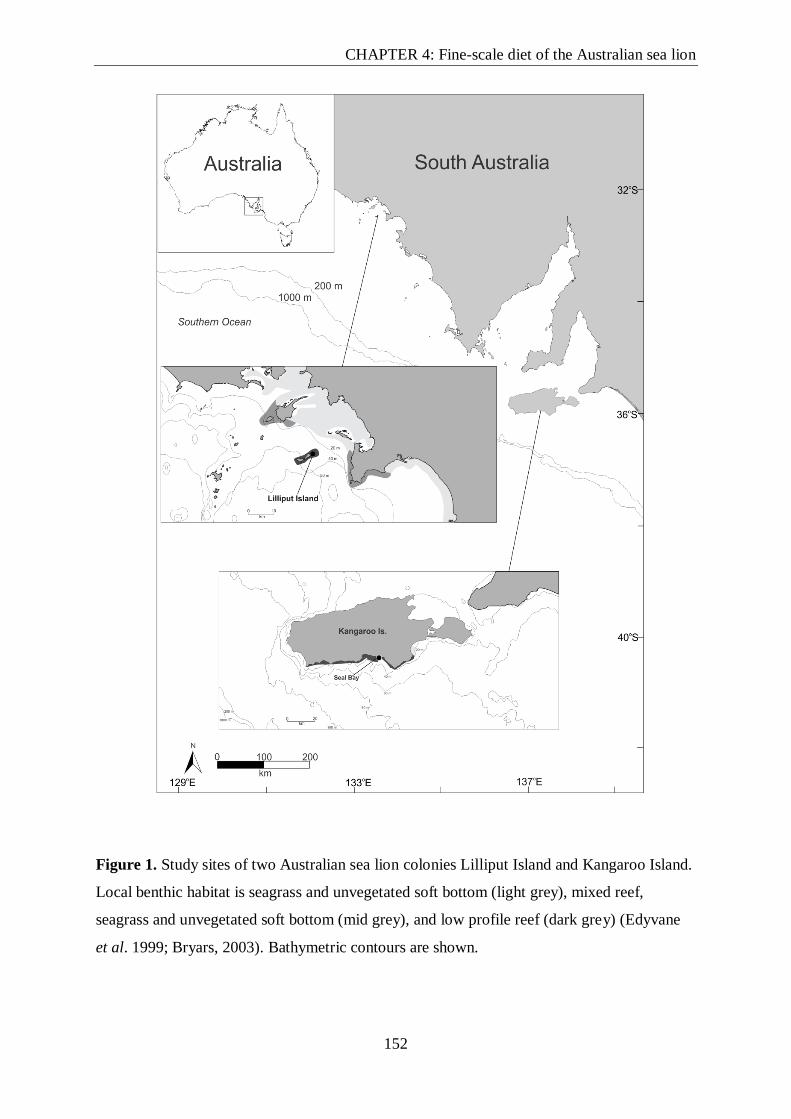
CHAPTER 4: Fine-scale diet of the Australian sea lion
152
Figure 1. Study sites of two Australian sea lion colonies Lilliput Island and Kangaroo Island.
Local benthic habitat is seagrass and unvegetated soft bottom (light grey), mixed reef,
seagrass and unvegetated soft bottom (mid grey), and low profile reef (dark grey) (Edyvane
et al. 1999; Bryars, 2003). Bathymetric contours are shown.

CHAPTER 4: Fine-scale diet of the Australian sea lion
153
Figure 2. Outline of experimental procedure used to generate prey sequence data from
Australian sea lion faeces collected from Kangaroo and Lilliput Island, South Australia.
Prey sequence identification
(GenBank)
PCR products cloned and
sequenced
Sequence sorting
Individual DNA Pooled DNA
Prey hard-part analysis
Sub-sample for genetics
PCR A Fish and shark 16s
PCR B Cephalopoda 16s
Kangaroo Island (on-ground samples)
Lilliput Island (enema samples)

CHAPTER 4: Fine-scale diet of the Australian sea lion
154
Table 1. DNA extracted from fish, crustacean and cephalopod species used as positive
controls to test the suitability of the mitochondrial 16S fish and cephalopod and primer sets.
Common name / Scientific name
Osteichthyes (Bony fish)
Jack mackerel (Trachurus declivis )
Silver trevally (Pseudocaranx dentex )
Sand flathead (Platycephalus bassensis )
Toothy flathead (Neoplatycephalus aurimaculatus )
Long head flathead (Leviprora inops )
Southern bluespotted flathead (Platycephalus speculator )
Common gurnard perch (Neosebastes scorpaenoides )
Silverbelly (Parequula melbournensis )
Southern school whiting (Sillago bassensis )
King George whiting (Sillaginodes punctatus )
Swallowtail (Centroberyx lineatus )
Horse-shoe leatherjacket (Meuschenia hippocrepis )
Spotted stink fish (Repomucenus calcaratus )
Blue-throated wrasse (Notolabrus tetricus )
Bulldog stargazer (Xenocephalus armatus )
Common bullseye (Pempheris multiradiata )
Rock Ling (Genypterus tigerinus )
Striped Perch (Pelates octolineatus )
Chondrichthyes (Cartilaginous fish)
Elephant shark (Callorhinchus milii )
Ornate wobbegong (Orectolobus ornatus )
Rusty catshark (Parascyllium ferrugineum)
Banded stingaree (Urolophus cruciatus )
Australian Angel shark (Squatina australis )
Crustacea
Mantis shrimp (Erugosquilla grahami )
Southern rock lobster (Jasus edwardsii )
Balmain bug (Ibacus alticrenatus )
Western King Prawn (Penaeus laticulcatus )
Cephalopoda
Southern calamary squid (Sepioteuthis australis )
Southern keeled octopus (Octopus berrima )
Hammer octopus (Octopus australis )
Southern dumpling squid (Euprymna tasmanica )
Striped pyjama squid (Sepioloidea lineolata )
Giant cuttlefish (Sepia apama )
Arrow squid (Nototodarus gouldi )

CHAPTER 4: Fine-scale diet of the Australian sea lion
155
Table 2. Primer sequences (5' - 3') used to amplify fish and cephalopod prey DNA from Australian sea lion faecal samples. A blocking primer
was used to reduce the amplification of sea lion DNA relative to prey DNA (Deagle et al. 2009). Shaded area indicates overlap region of 3’-end
of forward fish primer and 5’-end of blocking primer.
Primer name Target taxon Target species Gene region Primer sequence (5' - 3')
Approximate
product size
(bp)
Fish and shark (F) Fish + Chordates Bony fish + shark + ray mtDNA 16s CGAGAAGACCCTRTGGAGCT ~100
Fish and shark (R) " " " CCTNGGTCGCCCCAAC
Chordata blocking primer Otariidae Australian sea lion ATGGAGCTTCAATTAACTTACCCAATCAGAACC
S_Cephalopoda (F) Cephalopoda Squid + Octopus + Cuttlefish mtDNA 16s GCTRGAATGAATGGTTTGAC ~112
S_Cephalopoda (R) " " " GGACGAGAAGACCCTAWTGA

CHAPTER 4: Fine-scale diet of the Australian sea lion
156
16S Cephalopod primer set
A minimally degenerate cephalopod group-specific primer set was designed for this study
(Table 2). The primer set amplifies a ~112 bp region of the 16S mitochondrial DNA gene of
cephalopods that are found in southern Australia. The primer set was designed on alignment
using a range of 16S mtDNA of cephalopods sequenced for this study at the Australian
Genomic Research Facility (AGRF). Primer specificity was tested using sequences of fish,
elasmobranch, crustacea and otariid taxon groups obtained from genomic DNA from
specimens collected and sequenced at AGRF, other studies (Deagle et al. 2009; Braley et al.
2010) and sequences available in GenBank. Sequences were aligned using DNAMAN
version 6.0© (Lynnon Corporation 2005, Pointe-Claire, QC, CAnada) and Clustal X©
(Thompson et al. 1997). The primer set was screened using BLASTn in GenBank to
determine target group specificity (Altschul et al. 1990). Initial PCR assays were conducted
to assess the specificity of the primer set using genomic DNA of southern calamary squid
(Sepioteuthis australis), southern keeled octopus (Octopus berrima), hammer octopus
(Octopus australis), southern dumpling squid (Euprymna tasmanica), striped pyjama squid
(Sepioloidea lineolata), Australian giant cuttlefish (Sepia apama) and arrow squid
(Nototodarus gouldi).
PCR reactions
PCR amplifications (10μl) contained 2μl template DNA, 2.0 mM MgCl2, 10 x QIAGEN PCR
buffer, 1 x BSA, 10 µM DNTP, 10 µM primers, 100 µM blocking primer (if present) and 1 x
0.625 units HotStar Taq DNA polymerase (QIAGEN). Thermal cycling conditions for fish
amplifications were 95 oC for 15 min, followed by 32 cycles of: 94 oC for 15s, 57 oC for 90s,
and 72 oC for 30 s. Thermal cycling conditions for cephalopod amplifications were: 95 oC for
15 min, 94 oC for 2 min, followed by 32 cycles of: 94 oC for 10 s, 62.0 oC for 35 s and 72 oC

CHAPTER 4: Fine-scale diet of the Australian sea lion
157
for 30 s. A final extension step of 72 oC, 10 min was included in all assay runs. PCR
amplifications were detected by gel electrophoresis on 1.5% agarose gel stained with
Gelred™ and visualised using Gel-DOC UV illuminator (Bio-Rad®, Hercules, CA, USA)
supported by QUANTITY ONE QUANTITATION analysis software (Bio-Rad®). Replicate
PCRs were performed to confirm positive results from the first PCR attempt. Positive PCR
reactions were quantified using PicoGreen® dsDNA Quantitation reagent (Molecular Probes
®) on a Wallac1420 multilabel fluorometer. PCRs included negative controls to check for
contamination. All PCR preparations used UV sterilised aerosol resistant filter tips,
consumables and equipment, and were prepared in DNA free laminar flow UV sterilisation
hoods.
Clone sequencing
Amplicons from positive PCRs were purified using a Nucleospin® Extract II PCR cleanup gel
extraction kits (Macherey-Nagel, Easton, PA, USA), cloned into the TOPO TA cloning
vector then transformed into TOP10 chemically competent Escherichia coli cells and grown
overnight on X-gal media. Positive DNA inserts (white colonies) were selected and PCR
amplified using vector primers M13 F/R primers. Positive clone PCR inserts were purified
and sequenced using ABI PRISM® BigDyeTM Terminator Cycle Sequencing Kits on a ABI
PRISM® 3730XL Analyzer (96 capillary type) by Macrogen Inc. (South Korea). For
individual diets, a total of 53 positive clones were selected for sequencing from both fish and
cephalopod primer sets (n = 106 per individual). For the pooled diet analysis (fish only), 100
clones were chosen for sequencing.
Sequence screening
Sequences obtained from each clone library were sorted initially by sequence read length.
Sequences that showed read lengths significantly longer or shorter than the expected

CHAPTER 4: Fine-scale diet of the Australian sea lion
158
sequence read length encompassed by each primer set were excluded. Sequences were then
clustered by similarity using the neighbour-joining Kimura 2-parameter correction method
(Kimura, 1980) incorporated in the program DNAman version 6.0©. Gap opening and
extension parameters were set to 10 and 5 respectively with sequence alignments
bootstrapped for 10,000 iterations. Sequences within each homologous cluster were then
aligned to determine nucleotide polymorphisms. Representative sequences of each cluster
were then assigned to GenBank and identified using the BLAST program (Altschul et al.
1990). Sequences that showed nucleotide divergences from within each aligned cluster were
identified in GenBank. As a precautionary step, a conservative approach was used and
restricted the final sequence identification to mostly high similarity (≥ 97%) matches in
GenBank. Discarding potential prey sequences with lower alignment scores may
underestimate prey diversity, but higher stringency means that identification of prey is less
ambiguous. If a common recurrent sequence was identified in a clone library but not found in
the GenBank database, identification was restricted to either the lowest taxonomic group or
the sequence was listed as unknown. Sequence clusters were then compared by similarity.
Where BLAST returned multiple sequence matches of closely related species, the geographic
distribution and depth preference of each species was considered prior to the final sequence
identification (see Deagle et al. 2009).
Data analysis
Sequences were represented as percent numerical abundance (NA %) (% prey sequences of
each prey taxa per individual). Variation in dietary composition between sites was tested for
significance with non-parametric analysis of similarity (ANOSIM) on a Bray-Curtis
similarity matrix in Primer version 6.0 (Clarke and Warwick, 2001). A similarity percentage
analysis (SIMPER) was used to identify prey that were responsible for the significant
CHAPTER 4: Fine-scale diet of the Australian sea lion
159
differences. The RANOSIM statistic provides a relative measure of separation between groups
with R values of zero (0) supporting the null hypothesis, and a value of one (1) indicating
samples within defined groups are more similar to one other than samples from other groups.
For comparisons of diets between sites, individual prey items (sequence data) were
standardised as a proportion of the prey identified (sequences recovered) by different
individuals. The data were then standardised as a proportion of prey identified across all
individuals from different sites. Comparisons between the data from pooled and individual
samples were also standardised using these methods. Data were transformed where necessary
prior to analyses. For the multivariate analysis, a hierarchical similarity cluster analysis based
on multidimensional scaling plot (MDS) was performed to exhibit the relationship between
sites and individuals. Stress values were calculated in two- and three- dimensions to
determine how well the data were representative for the ordination. Stress values of < 0.1
provided interpretable information of the separation between groupings (Schiffman et al.
1981; Page et al. 2005).
To evaluate if each clone library provided representative coverage of the potential number of
prey species identified, power analyses were performed in R (version 2.12, R Development
Core Team, R Foundation for Statistical Computing, Vienna, Austria). Sequence clusters
within each library were selected at random and the total number of unique clones
represented across the sequence library was calculated. A second cluster was chosen at
random from the sequence library, calculating the total number of clones that it represented
within the sequence library. The procedure was replicated until all unique prey taxa,
represented by their respective sequences had been selected and the cumulative number of
prey species was calculated. Mean number of clones and their standard deviation was
estimated for each sequence cluster by Monte Carlo bootstrapping the data 10,000 iterations

CHAPTER 4: Fine-scale diet of the Australian sea lion
160
and for each prey species, a calculation of the cumulative number of prey species represented
by j clones ± standard deviation (
ˆ boot):
ˆ boot
n 1
n
1
n(n 1)(xi x j )
2
i1
n
where n is the number of iterations, x is the mean number of prey species identified by jth
clones at iteration i (Chernick, 2007).
The resulting data (mean number of prey species identified by each clone library) was plotted
using CURVE EXPERT (Curve Expert v 1.4) (Hyams, 1995-2009, www.curveexpert.net).
The Gompertz function (y=a*exp(-exp(b-cx)) was applied to calculate the asymptotic number
of prey species identified in each library interpreted as the maximum number of prey species
identified by j clones. I then calculated the number of clones required to be sequenced to
achieve 95% coverage of the prey species used by sea lions from each site.
RESULTS
Prey hard-parts
All samples from KI and one sample from LI contained skeletal remains of fish but these
could not be identified. A single otolith from the slender bullseye (Parapriacanthus
elongatus) was recovered from individual 1 at KI. Two cephalopod beaks were recovered
from individual 3 at KI (Octopus berrima) and individual 6 at LI (Octopus spp.). Cephalopod
beak fragments recovered from individuals 2 and 3 from LI and individual 3 from KI could
not be identified.
CHAPTER 4: Fine-scale diet of the Australian sea lion
161
Clone library overview
PCR amplicons of fish were generated from all individuals from KI, but only from five
individuals at LI (Table 3). The cephalopod primer set produced PCR amplicons from all
individuals at both sites (n = 12). In total, 1329 sequences (638 from LI and 691 from KI)
were generated from the individual and pooled DNA clone libraries (Table 3). After removal
of truncated sequences, 1171 potential prey sequences (88%) were used for the data analyses.
The final datasets for individual diets comprised 280 and 202 fish sequences from KI and LI,
respectively. The cephalopod primer set recovered 238 (83%) and 262 (91%) sequences from
KI and LI, respectively. In total, 97 (LI) and 92 (KI) sequences were obtained from the
pooled DNA amplified with the fish primers. Sequence data file:
doi:10.5061/dryad.d417q (201300401) (http://datadryad.org/).
Inter-colony and individual diet comparisons
16S Fish primer set
Overall, 23 species of fish across three genera were identified (Table 3). Of the 19 families
identified, Labridae (wrasse) and Monacanthidae (leatherjackets) were the most commonly
encountered fish prey taxa recovered from 10 individuals. Mullidae (goatfish) were recovered
from seven individuals and Platycephalidae (flatheads), Serranidae (ocean perch) and an
unknown teleost (Unknown Teleostei A) in five samples.

CHAPTER 4: Fine-scale diet of the Australian sea lion
162
Table 3. Taxonomic assignment and numerical abundance of prey sequences obtained from Australian sea lion faeces collected from KI and LI,
South Australia. Numbers 1-6 represent individuals sampled per site. Sequences obtained by combining DNA from individuals 1- 6 are
represented as pooled DNA (fish primer only).
Prey taxa Common name count % count % count % count % count % count % % count % count % count % count % count % count %
Osteichthyes
Arripidae Arripis geogianus tommy rough 0 0 0 0 2 4.0 0 0 0 0 0 0 2 2 2.1 0 0 0 0 0 0 0 0 0 0 - - 0 0 0
Berycidae Centroberyx australis yellow-eyed nannygai 0 0 0 0 0 0 19 51.4 0 0 12 23.5 31 0 0 0 0 0 0 0 0 0 0 0 0 - - 0 0 0
Carangidae Pseudocaranx wrighti skipjack trevally 0 0 0 0 0 0 0 0 0 0 0 0 0 0 0 0 0 0 0 0 0 15.0 44 0 0 - - 15 0 0
Carangidae Trachurus declivis jack mackerel 0 0 0 0 0 0 0 0 0 0 0 0 0 0 0 0 0 0 0 0 0 1.0 2.9 0 0 - - 1 2 2
Cheilodactylidae Nemadactylus macropterus jackass morwong 0 0 0 0 0 0 0 0 0 0 1 2.0 1 0 0 0 0 0 0 0 0 0 0 0 0 - - 0 0 0
Clupeidae Sardinops sagax Australian sardine 0 0 0 0 0 0 0 0 0 0 0 0 0 0 0 0 0 0 0 0 0 2.0 5.9 0 0 - - 2 0 0
Gempylidae Thyrsites atun barracouta 0 0 1 2.1 0 0 0 0 0 0 0 0 1 0 0 0 0 0 0 0 0 0 0 0 0 - - 0 0 0
Gerreidae Parequula melbournesis silver belly 0 0 0 0 0 0 0 0 0 0 0 0 0 0 0 0 0 31 66 0 0 0 0 0 0 - - 31 15 16
Labridae Notolabrus tetricus blue throated wrasse 0 0 0 0 46 92.0 0 0 0 0 0 0 46 70 72.2 1 2.8 5 11 12 28 8.0 24 3 7 - - 29 9 10
Pictilabrus laticlavius senator wrasse 0 0 0 0 0 0 0 0 0 0 0 0 0 1 1.0 0 0 3 6.4 8 19 0 0 0 0 - - 11 6 7
Pseudolabrus sp. wrasse 0 0 3 6.4 2 4.0 0 0 0 0 0 0 5 0 0 0 0 0 0 0 0 0 0 0 0 - - 0 0 0
Monacanthidae Acanthaluteres brownii spiny-tailed leatherjacket 0 0 0 0 0 0 0 0 0 0 0 0 0 0 0 0 0 0 0 5 12 0 0 0 0 - - 5 0 0
Meuschenia scaber velvet leatherjacket 13 31.0 1 2.1 0 0 2 5.4 42 79.2 1 2.0 59 5 5.2 10 28 0 0 0 0 1.0 2.9 3 7 - - 14 0 0
Scobinichthys granulatus rough leatherjacket 0 0 0 0 0 0 0 0 0 0 0 0 0 0 0 2 5.6 0 0 0 0 0 0 0 0 - - 2 1 1
Moridae Lotella rhacina bearded rock cod 11 26.2 0 0 0 0 0 0 0 0 0 0 11 2 2.1 0 0 0 0 0 0 0 0 0 0 - - 0 0 0
Pseudophycis barbata southern bastard codling 0 0 0 0 0 0 2 5.4 0 0 0 0 2 1 1.0 0 0 0 0 0 0 0 0 0 0 - - 0 0 0
Mullidae Upeneichthys vlamingii red mullet 1 2.4 4 8.5 0 0 0 0 9 17.0 1 2.0 15 2 2.1 4 11 8 17 0 0 2.0 5.9 0 0 - - 14 0 0
Upeneichthys sp. 0 0 0 0 0 0 0 0 0 0 0 0 0 0 0 0 0 0 0 0 0 0 0 0 0 - - 0 4 4
Platycephalidae Neoplatycephalus richardsoni tiger flathead 0 0 10 21.3 0 0 0 0 0 0 0 0 10 2 2.1 2 5.6 0 0 2 5 0 0 36 86 - - 40 36 39
Platycephalus sp. flathead 0 0 0 0 0 0 0 0 0 0 0 0 0 0 0 4 11 0 0 0 0 0 0 0 0 - - 4 0 0
Rhinobatidae Trygonorrhina guanerius southern fiddler ray 0 0 0 0 0 0 0 0 0 0 0 0 0 0 0 0 0 0 0 1 2 0 0 0 0 - - 1 0 0
Sebastidae Helicolenus sp. ocean perch 0 0 0 0 0 0 0 0 0 0 34 66.7 34 5 5.2 0 0 0 0 1 2 3.0 8.8 0 0 - - 4 3 3
Serranidae Caesioperca lepidoptera butterfly perch 0 0 9 19.1 0 0 10 27.0 2 3.8 2 3.9 23 1 1.0 0 0 0 0 5 12 0 0 0 0 - - 5 0 0
Sillaginidae Sillaginodes punctatus king george whiting 0 0 0 0 0 0 0 0 0 0 0 0 0 0 0 0 0 0 0 0 0 2 5.9 0 0 - - 2 1 1
Sillago bassensis silver whiting 0 0 0 0 0 0 0 0 0 0 0 0 0 0 0 7 19 0 0 0 0 0 0 0 0 - - 7 6 7
Soleidae Fam. Soleoidei flounder 0 0 0 0 0 0 0 0 0 0 0 0 0 0 0 5 14 0 0 0 0 0 0 0 0 - - 5 0 0
Tetrarogidae Gymnapistes marmoratus South Australian cobbler 0 0 0 0 0 0 0 0 0 0 0 0 0 0 0 0 0 0 0 2 4.7 0 0 0 0 - - 2 0 0
Unknown Teleostei A 17 40.5 19 40.4 0 0 4 10.8 0 0 0 0 40 6 6.2 1 2.8 0 0 7 16 0 0 0 0 - - 8 9 10
Total 42 100 47 100 50 100 37 100 53 100 51 100 280 97 100 36 100 47 100 43 100 34 100 42 100 - - 202 92 100
Cephalopoda
Octopodidae Octopus berrima southern keeled octopus 6 14.0 0 0 3 7.1 0 0 2 11.1 0 0 11 - - 43 94 0 0 28 72 1 2.4 0 0 36 84 108 - -
Octopus maorum maori octopus 4 9.3 0 0 35 83.3 1 2.3 8 44.4 0 0 48 - - 0 0 0 0 4 10 12 29 0 0 0 0 16 - -
Octopus kaurna southern sand octopus 0 0 0 0 0 0 0 0 0 0 0 0 0 - - 0 0 0 0 1 2.6 0 0 0 0 1 2.3 2 - -
Loliginidae Sepioteuthis australis southern calamary squid 2 4.7 48 100 2 4.8 13 30.2 0 0 8 18.2 73 - - 3 6.5 47 100 4 10 28 67 1 2 0 0 83 - -
Sepiidae Sepia apama giant cuttlefish 28 65.1 0 0 2 4.8 29 67.4 8 44.4 36 81.8 103 - - 0 0 0 0 0 0 0 0 44 98 0 0 44 - -
Sepiolidae Euprymna tasmanica southern dumpling squid 3 7.0 0 0 0 0 0 0 0 0 0 0 3 - - 0 0 0 0 2 5.1 1 2.4 0 0 6 14 9 - -
Total 43 100 48 100 42 100 43 100 18 100 44 100 238 - - 46 100 47 100 39 100 42 100 45 100 43 100 262 - -
Lilliput Island
5 6Total
count
Pooled
DNA %
1 2 3 4
Kangaroo Island
651 2 3 4Pooled
DNA
Total
count

CHAPTER 4: Fine-scale diet of the Australian sea lion
163
Composition of the sequence clusters obtained at both sites showed a high level of variation
in fish prey taxa between individuals (Table 3). A total of 14 sequence clusters were
identified from KI. Eleven (79%) of these were identified to species, two (14%) to genus and
one cluster remained unidentified. The median number of fish taxa detected per individual at
KI was 4.5 (mean 4.7 ± 1.6; range 4 - 7). The most common species identified was the velvet
leatherjacket (Meuschenia scaber), detected from five individuals. Red mullet (Upeniechthys
vlamingii) and butterfly perch (Caesioperca lepidoptera) were both detected in samples, and
the unknown teleost (Unknown Teleostei A) was detected in three samples. The results from
SIMPER analyses agreed with these findings, with M. scaber, U. vlamingii, and C.
lepidoptera contributing ~ 40% of overall similarity between KI individuals (17.7%, 11.1%
and 10.6%, respectively). Ten of the prey species were either specific to single individuals or
were detected in only two individuals: yellow-eyed nannygai (Centroberyx australis) and
wrasse (Pseudolabrus sp.). Clone libraries contained sequences of two or three fish taxa with
the exception of individual 3, for which a single species (flathead) comprised 92 % of the
clone library. Two prey species, barracouta (Thyrsites atun) and jackass morwong
(Nemadactylus macropertus), were represented by a single sequence.
Twenty fish sequence clusters were identified from the six individuals at LI. The median
number of fish taxa detected at LI was 8.0 (mean 6.6 ± 2.9; range 0 - 9). Sixteen fish taxa,
represented by 12 families, were identified to species (Table 2). One sequence cluster was
identified only to genus (Helicolenus sp.), one to family (Soleoidei) and one cluster remained
an unidentified teleost (Unknown Teleostei A). A single sequence of the southern fiddler ray
(Trygonorrhina guanerius) was detected in one individual. Blue throated wrasse (N. tetricus)
was the most common species with results from the SIMPER analysis confirming ~ 25 % of

CHAPTER 4: Fine-scale diet of the Australian sea lion
164
the similarity between individuals resulted from consumption of this species. Velvet
leatherjacket, tiger flathead (Platycephalus richardsoni) and red mullet were detected in three
individuals but each contributed only small percentage (~ 7 %). Thirteen (65%) of the prey
taxa identified were specific to single individuals. Of these, six sequence clusters were
represented with less than two sequences: Australian pilchard (Sardinops sagax), rough
leatherjacket (Scobinichthys granulatus), King George whiting (Sillaginodes punctatus), jack
mackerel (Trachurus declivis), southern fiddler ray (T. Guanerius) and South Australian
cobbler (Gymnapistes marmoratus).
16S Cephalopod primer set
Sequences recovered from cephalopods showed reasonable variation (≤14 bp) to differentiate
between species. Cephalopod diversity was low and consisted six sequence clusters identified
across four families (Table 3). Of these, Octopodidae was the most commonly identified
cephalopod family, followed by Loliginidae (calamary squid), Sepiidae (cuttlefish) and
Sepiolidae (dumpling squid).
The cephalopod primer set showed differences in prey taxa between females and sites (Table
3). The number of cephalopod taxa was similar at both sites (KI: median 3.0, mean 3.0 ± 0.6,
range 1 to 5, LI: median 2.5, mean 2.8 ± 0.6, range 1 to 5). Cephalopod prey were
represented by three species of octopus: southern keeled octopus (Octopus berrima), Maori
octopus (Octopus maorum) and Southern sand octopus (Octopus kaurna), two squid species:
Southern calamary squid (Sepioteuthis australis) and Southern dumpling squid (Euprymna
tasmanica), and the giant cuttlefish (Sepia apama). Octopus berrima, O. maorum, S. apama
and S. australis were detected at both sites but O. kaurna was only detected in two samples
from LI. Sepioteuthis australis was the most common cephalopod, detected in five
individuals from each site. For KI, S. apama was equally important in diets of individuals (n
CHAPTER 4: Fine-scale diet of the Australian sea lion
165
= 5), but not at LI where it was detected in the diet of only 1 individual. Octopods O. berrima
and O. maorum were important in diets of KI individuals (n = 4) but O. maorum was not as
common in diets from LI (n = 2). A difference in the composition of cephalopods between
sites was also reflected in SIMPER. The data indicated S. australis, S. apama and O. maorum
contributed 46.4 % to overall similarity between individuals at KI (18.1%, 17.4% and 10.9%,
respectively) but differed from LI where S. australis and O. berrima contributed 38.1%
(24.7% and 13.4%, respectively) to overall site similarity. E. tasmanica and O. kaurna were
less common at both sites.
Dietary comparison between sites
The prey taxa differed significantly between sites (global RANOSIM = 0.30, P = < 0.05).
Hierarchical similarity cluster analysis separated individuals into 2 distinct groups (KI and
LI) with the exception of 1 individual from LI (individual 5), which was grouped with KI
(Fig. 3) (3D stress = 0.05). Two dimensional stress was also determined for the same dataset
and produced similar groupings but with slightly higher values (stress = 0.09). SIMPER
analyses indicated a dissimilarity of 74% between locations with the main differences
resulting from giant cuttlefish (S. apama), dumpling squid (E. tasmanica), and blue throat
wrasse (N. tetricus).

CHAPTER 4: Fine-scale diet of the Australian sea lion
166
Figure 3. Hierarchical similarity cluster analysis of fish and cephalopod prey sequences
obtained from Australian sea lions at Kangaroo Island (KI ▼) and Lilliput Island (LI ○).
Comparisons between individual and pooled DNA data sets
Ten prey taxa from KI (71%) and 11 (55%) from LI were represented in the pooled datasets.
These were not significantly different from the combined total number of prey species
identified from individuals at each site (χ2 = 0.36, d.f. = 24, P = ≥ 0.05 (KI), χ2 = 2.61, d.f. =
30, P = ≥ 0.05 (LI)) with the ANOSIM ranked data indicating negligible differences between
pooled and individual prey datasets (KI global RANOSIM = 0.33, P = 0.3, LI global RANOSIM = -
0.6, P = ≥ 0.1). However, the pooled datasets showed differences in prey composition
compared to the total prey taxa identified from individuals. Four prey taxa (21%) identified
across individual diets from KI, and nine species from LI (45%) were absent from pooled
datasets. There was no apparent pattern to these omissions; for example, rarer taxon
sequences (≤ 5 sequences) such as King George whiting detected in one individual from LI

CHAPTER 4: Fine-scale diet of the Australian sea lion
167
was represented in the pooled dataset, whereas velvet leatherjacket, which was abundant
across individual samples from LI, was not. Conversely, velvet leatherjacket, which was
relatively abundant across five individuals at KI, and also detected in the pooled datasets.
Yellow-eyed nannygai (Centroberyx australis), was abundant in two individuals but was not
in pooled samples. A single sequence of senator wrasse (Pictilabrus laticlavius) was detected
in the pooled DNA dataset from KI but was not detected across the individual diets. Seven
prey sequence clusters containing relatively low abundance sequences (≤ 5) from individuals
at LI were absent from the pooled data.
Assessment of prey diversity from individual and pooled datasets
In most cases, identifying 95% of an individual’s prey diversity required fewer clones than
the total number sequenced (n = 53). The data demonstrated the typical shape of a sigmoidal
curve and the Gompertz function fitted the data well in most cases (r2= 0.961 - 0.999) (Table
4, Figs. 4 and 5) with exception of two datasets that exhibited linear curves (KI (individual 6,
fish) and LI (individual 5, cephalopod) (Table 4). The sequence libraries in these individuals
indicated they used a single prey species and contained a small number of single sequence
taxa. Based on the asymptotes, the number of clones to be sequenced did not differ
significantly between individuals at KI and LI (fish; 35.8 ± 20.8 and 24.1 ± 5.2, respectively;
one-way analysis of variance (ANOVA): F = 1.48, d.f. = 9, P = 0.25), cephalopods (28.6 ±
12.88 and 37.0 ± 13.02, respectively, ANOVA: F = 0.93, d.f. = 7, P = 0.37), nor overall
(ANOVA: F = 1.33, d.f. = 17, P = 0.27). The pooled fish data also exhibited sigmoidal
curves (r2 = 0.997 and 0.990) with 95% prey diversity reached with fewer clones for KI (n =
88.1) and LI (n = 51.4) than the total number sequenced (n = 103) (Table 4, Fig. 6).

CHAPTER 4: Fine-scale diet of the Australian sea lion
168
Table 4. Estimated number of clone sequences required to achieve 95 % coverage of the
asymptotic prey diversity for each clone library. The number of clones sequenced was higher
than the asymptotic number of clones required except animal 6 (KI) and animal 5 (LI).
Individual (~ n = 53 clones) and combined (pooled DNA) for 6 individuals per site (~ n =
110) are shown. Pooled estimates are for fish taxa.
Effectiveness of sample size (number of individuals) and prey diversity
Estimated asymptotes of the total number of prey used at each site indicated more samples
were needed to obtain 95% of the overall prey diversity (Table 5, Fig. 7). At KI, 92% of the
asymptotic prey diversity required 7.4 individuals and 1.7 prey taxa to be sampled, at LI,
88% required 8.3 individuals and 3.5 prey taxa; for combined fish prey datasets 93.8%
required 14.2 individuals.
Region / Animal Prey Species
(n )
Asymptote
(a)r
2 No. clones
required
Prey Species
(n )
Asymptote
(a )r
2 No. clones
required
Kangaroo Island (KI)
1 5 4.74 0.997 24.5 4 3.54 0.961 15.3
2 1 - - - 7 6.40 0.988 30.6
3 4 3.94 0.999 35.4 3 3.03 0.999 49.2
4 3 2.79 0.962 33.5 5 4.71 0.993 21.4
5 3 2.80 0.993 8.3 3 2.82 0.992 27.1
6 2 1.90 0.997 41.5 6 6.34 0.994 71.2
DNA combined - - - - 11 10.57 0.997 88.1
Lilliput Island (LI)
1 2 1.93 0.999 27.6 9 8.34 0.994 25.2
2 1 - - - 4 3.78 0.996 19.0
3 5 4.74 0.997 30.2 9 8.28 0.992 18.9
4 4 4.09 0.984 56.1 8 7.72 0.996 31.1
5 2 3.65 0.999 206.5 3 2.89 0.998 26.3
6 3 2.81 0.991 34.2 0 - - -
DNA combined - - - - 11 10.06 0.990 51.4
FishCephalopods

CHAPTER 4: Fine-scale diet of the Australian sea lion
169
Figure 4. Asymptotic curves of prey sequence diversity obtained for fish (○) and
cephalopods (●) from individual clone libraries. Individuals 1- 5 were representative of the
asymptotic (a) number of clones required to sample 95 % of the potential prey identified per
individual. Fish prey of animal 6 were 87.8% of the asymptotic number of clones required to
sample 95% of fish prey identified (refer to Table 3). Curves were not estimated where < 2
prey species were identified (Individual 2). Values are mean ± SD. Data are for Kangaroo
Island (KI).

CHAPTER 4: Fine-scale diet of the Australian sea lion
170
Figure 5. Asymptotic curves of prey sequence diversity obtained for fish (○) and cephalopods
(●) from individual clone libraries. The asymptotic number of clones (a) required to sample
95 % of the potential prey diversity was representative for each individual. Curves were not
estimated where only one prey species was identified (Individual 2) (refer to Table 4.4).
Values are mean ± SD. Data are for Lilliput Island (LI).

CHAPTER 4: Fine-scale diet of the Australian sea lion
171
Table 5. Total number of prey identified per site and estimate of the number individuals
required to be sampled per site and combined sites to achieve 95 % coverage of the
asymptotic number of prey taxa. Data indicate more individuals were required to be sample
sampled to achieve 95 % of the asymptotic number of prey.
Figure 6. Asymptotic curves of fish prey sequence diversity obtained for combined (pooled)
DNA from 6 individuals at KI (o) and LI (▲). The number of clones sampled was
representative of the asymptotic (a) number of clones required to sample 95 % of potential
prey identified per site (refer to Table 4). Values are mean ± SD.
SitePrey species
(n )
Asymptote
(a )r
2 Prey coverage (%)No. Individuals
required (α = 95 %)
Kangaroo Island 19 20.7 0.998 91.8 7.4
Lilliput Island 26 29.5 0.999 87.9 8.3
Combined sites 33 35.2 0.996 93.8 14.2

CHAPTER 4: Fine-scale diet of the Australian sea lion
172
Figure 7. The relationship between the number of prey taxa identified from cloning PCR
products and the number of individuals sampled. For KI, LI and combined datasets the
asymptotic number of individuals required to be sampled to represent 95% of the asymptotic
number of individuals required to be sampled to represent 95% of the asymptotic prey
diversity was greater than the number sampled in the study (92 %, 88 %, and 94%,
respectively; Table 5).
DISCUSSION
Amplification of prey DNA from scats using short sequence fish and cephalopod group-
specific primers generated comprehensive detail of these two important dietary components
of a threatened species, the Australian sea lion. Previous studies utilising hard-part analyses
of faeces and regurgitates have indicated Australian sea lions consume a range of cephalopod,
fish and crustacean prey, but to date only nine species of fish and five cephalopods have been
described owing to the poor quality and limited number of prey remains recovered (Walker
and Ling, 1981; Gales and Cheal, 1992; Ling 1992; McIntosh et al. 2006; Gibbs et al. 2008).

CHAPTER 4: Fine-scale diet of the Australian sea lion
173
By applying the DNA-based cloning-sequencing approach, a diverse range of prey species
were identified, many of which have not been previously described in diet of the Australian
sea lion. As a result of this study, the sea lion prey spectrum has been extended by ~30
species. The majority of species identified here are benthopelagic or inhabit the sea floor,
confirming the predominant benthic mode of foraging of the Australian sea lion (Costa and
Gales, 2003; Fowler et al. 2006, 2007; Goldsworthy et al. 2009; Lowther et al. 2011).
Limitations
While the DNA analysis provided good taxonomic resolution, identifying prey by extracting
DNA from faeces is subject to some of the inherent biases that accompany diet studies that
utilise traditional hard-part methodology (Tollit et al. 1997; Staniland, 2002). For example,
similar to the identification of prey-parts, the digestion of prey DNA is variable between
species and, as a result, this study may only reflect prey whose DNA remained sufficiently
intact after digestion to be amplified. In addition, even though the faeces from KI were fresh
(collected within ~12h) DNA continues to degrade after deposition affecting DNA quality
and quantity (e.g. Deagle et al. 2005a). This may have limited the detection of certain prey
species from KI compared to those identified from direct enema samples collected from LI.
The species identified here are also representative of only one single winter foraging event
and can only imply recent prey ingestion that may not reflect feeding behaviour at other times
of the year. Clear discrepancies in tissue mtDNA content can further equate to downstream
differences in prey amplification rates (Soininen et al. 2010; Hartman et al. 2011). The
strength of this statement is tempered by the fact that seals, like other large marine predators
may not ingest whole specimens but parts of prey that contain tissues rich or poor in DNA
content (i.e. liver versus pectoral fins) (Hartman et al. 2011; Dalziel et al. 2004). This factor
alone could significantly influence interpretation of dietary data using these methods.

CHAPTER 4: Fine-scale diet of the Australian sea lion
174
Prey diversity
Based on the DNA analysis, 23 fish and five cephalopod prey taxa were identified, some of
which appeared specific to individual diets, but many species were consumed among
individuals, within and between sites. This result suggests a large proportion of the species
consumed were relatively abundant prey with either wide spatial distributions or were
common to areas where females forage. Fish were dominated by six main groups; leather
jacket (Monacanthidae), flathead (Platycephalidae), scorpion fish (Sebastidae), butterfly
perch (Serranidae), red mullet (Mullidae) and wrasse (Labridae). The last four groups have
not previously been reported as prey of the Australian sea lion.
Cephalopods have previously been described as important prey of the Australian sea lion
(Walker and Ling 1981, Richardson and Gales 1987, Gales and Cheal 1992, Ling 1992,
McIntosh et al. 2006; Gibbs, 2008). The results from this study support this, indicating that
octopus, calamary squid (Loliginidae) and giant cuttlefish (Sepiidae) are common cephalopod
prey. This study reports O. kaurna and E. tasmanicus as two new cephalopod prey of the
Australian sea lion. The low number of sequences and low frequency with which each
species was detected could reflect their relative abundance within the regions studied, low
electivity, or that foraging areas where cephalopods were consumed were discrete and
spatially limited.
The absence of arrow squid DNA in this study surprisingly contrasts results by McIntosh et
al. (2006), where it was a relatively common prey item in the diets of sea lions at Seal Bay.
Given this result, the molecular assay was tested by spiking a faecal sample with arrow squid
DNA, which confirmed detection of arrow squid in the sample. I therefore suspect this result
highlights the limitation of sampling a small number of individuals, or alternatively indicates

CHAPTER 4: Fine-scale diet of the Australian sea lion
175
some seasonal prey variation that possibly coincides with the winter dispersal of arrow squid
to deeper oceanic habitats where they mature (Triantifillos et al. 2004; Stark et al. 2008;
Steer et al. 2006). Further work is required employing larger sample sizes over greater spatial
and temporal scales to evaluate any seasonal variations in diet.
One of the advantages of DNA-based analysis is its ability to provide taxonomic resolution to
prey that may be consumed but not defined using hard-part morphological analysis. The hard-
part analysis indicated cephalopods such as octopus could not be taxonomically defined to
species from beaks or beak fragments recovered in this study. McIntosh et al. (2006) and
Gibbs (2008) also found reduced morphological integrity a constraint in assessing fish and
cephalopod dietary components from the stomachs of deceased Australian sea lions.
Furthermore, it was apparent from the lack of cephalopod and fish remains recovered in this
study, that many prey items are either retained within the gut and digested or evacuated over
time. Small species such as the Southern keeled octopus (O. berrima) are rarely recovered
from digesta of Australian sea lions probably because they are small (≤ 40 mm mantle length)
and solitary, with a rostrum that is unlikely to survive digestion intact (Carter et al. 2009;
Peters unpub. data). Morphological similarity and damage incurred to beaks during digestion
also makes differentiation between octopus species problematic (Roper, 1983; Stranks and
Norman, 1992; Gibbs, 2008).
On the contrary, the DNA sequence data provided taxonomic separation between cephalopod
species suggesting closely related species such as O. berrima and O. maorum were consumed
by sea lions at each site. The higher prevalence of O. maorum at KI and of O. berrima at LI
possibly reflects each species’ preference for particular habitat types. Substrates of mud and
sand for example, are preferred habitats of O. berrima and are consistent with the

CHAPTER 4: Fine-scale diet of the Australian sea lion
176
predominant substrate near the LI colony. Conversely, O. maorum tend to inhabit soft
sediment rocky reefs, which are widespread across foraging grounds utilised by sea lions at
Seal Bay (Stranks and Norman, 1992; Anderson, 1999; Edyvane, 1999; Bryars, 2003; Fowler
et al. 2007).
The sequence diversity curves indicated the clone-library approach provided adequate
coverage of diet item diversity in the clone libraries. In most cases, 95% of the estimated
diversity of fish and cephalopod prey consumed by individual animals and across the pooled
DNA datasets was achieved. This relationship was slightly weaker (< 95%) when broad-scale
diversity was considered (site and combined sites) (Table 4), indicating my study may have
underestimated the potential range of fish and cephalopod prey taxa available; a bias
potentially induced by the low sample size and small number of clones sequenced per library.
The diversity curves indicated more comprehensive dietary information could have been
achieved by sequencing ~150 clones per library and assessing ~30 samples per site. However,
the cost of sequencing larger clone libraries limits such studies, and is the primary reason
why only two key prey components were targeted here. Australian sea lions also consume
crustaceans (McIntosh et al. 2006) that are notably absent from this study. While the benefits
of employing the clone-sequencing approach to generate fine-scale dietary data is apparent in
the diversity of prey identified, denaturing grade gel electrophoresis (DGGE), single strand
chain polymorphism (SSCP) or high throughput sequencing technologies may be more
appropriate where predators may consume a broad range of prey or where qualitative data is
required (see Hiss et al. 2007; Tollit et al. 2009; Deagle et al. 2009).

CHAPTER 4: Fine-scale diet of the Australian sea lion
177
Pooled and individual clone library datasets
The results from pooling DNA from multiple individuals at each site did not provide an
accurate representation of the total number of fish prey identified. At each site, ten fish
species were concurrently detected in the individual and pooled datasets, however a third of
the species from KI (29%, n = 4) and almost half of the species from the LI pooled datasets
(45%, n = 11) were missing. Neither the abundance of sequences represented within
individual clone libraries, nor the frequency each species was detected could clearly explain
these omissions, as species with high sequence counts (e.g. yellow-eyed nannygai) and those
with few sequences (e.g. barracouta, jackass morwong) were absent (i.e. KI).Furthermore,
while the most common fish sequences from the pooled datasets coincided with those
accumulated across individual diets, each clone library was skewed by a small number of
species with high sequence counts, an artefact also observed among individual clone libraries.
While factors such as DNA degradation and copy number bias can influence outcomes of
clone sequence analysis (Deagle et al. 2005a; Passmore et al. 2006), these results possibly
highlight strong PCR amplification biases toward dominant intact prey DNA (e.g. blue-
throated wrasse (KI)), or the methodological approach of standardising the quantity of faecal
DNA prior to PCR possibly biased the clone libraries. Given prey DNA is a small and
inconsistent component of faeces that comprise predominantly host and bacterial cells (Kohn
and Wayne, 1997), standardising by pooling DNA post PCR would have eliminated the non-
target DNA components and provided more equal representation in the final sequence
libraries.
The single otolith of P. elongatus recovered in the hard-part analysis yet not detected by the
PCR tests may reflect a limitation of the DNA analysis. For example, feeding trials on
captive otariids indicate prey detection by PCR is limited to within ~48 hrs of prey ingestion

CHAPTER 4: Fine-scale diet of the Australian sea lion
178
(Deagle et al. 2006; Casper et al. 2007b; Peters et al. 2013, unpublished data). This
highlights the advantage of utilising a combined methodological approach for dietary analysis
particularly morphological analysis of prey consumed beyond 2 d. Furthermore, for marine
predators such as seals and sharks that consume large portions of their prey, combining
dietary techniques can increase the frequency of prey detection (Casper et al. 2007a; Barnett
et al. 2010; Marshall et al. 2010). The reason for the discrepancy in this study is uncertain,
however otoliths of ‘bullseyes’ such as P. elongatus are robust and having previously been
recovered intact from the stomachs of Australian sea lions (McIntosh et al. 2006; Peters
unpub. data), may suggest the species was consumed prior to sample collection.
Alternatively, this result may expose the shortcomings of sequencing small clone libraries or
indicates a constraint related to the quantity or quality of P. elongatus DNA. Future
application emphasises the importance of cross-validation using multiple but targeted primer
sets or, as is now practical, generating a greater depth of dietary sequencing by using ‘next
generation’ parallel sequencing technology (Deagle et al. 2009; Soininen et al. 2009;
Valentini et al. , 2009).
Ecological implications
The array of fish and cephalopod prey identified from the individuals in this study indicates
Australian sea lions are generalist predators that consume a wide range of demersal prey
types. This strategy possibly accommodates their extreme foraging patch and natal site
fidelity (Goldsworthy et al. 2009; Lowther et al. 2011). Unlike the seasonal cues that are
implicit as breeding regulates in other otariid species, targeting a wide range of prey in this
manner could reduce the dependency on single prey types facilitating their protracted 17.5 mo
breeding and extended gestational period.

CHAPTER 4: Fine-scale diet of the Australian sea lion
179
The range of species identified in this study are similar to the demersal and some pelagic prey
consumed by the Australian fur seal (Arctocephalus pusillus doriferous) and New Zealand fur
seal (Arctocephalus forsteri) that sympatrically breed and forage over parts of the Australian
sea lion range (Page et al. 2005; Shaughnessy, 2010). In particular, the recent discovery of a
breeding colony of A. pusillus doriferous at North Casuarina Island adjacent to Kangaroo
Island could pose significant competition for the Australian sea lion at Seal Bay (this study),
as both species are predominantly benthic foragers and target similar prey resources (Page et
al 2005; Deagle et al. 2009). Studies investigating dietary overlap between these species will
be important in advising future conservation management of otariids within this region.
Finally, Australian sea lions inhabit a broad range of habitats from cool temperate to the
warm near sub-tropics of Houtman-Abrolhos (Goldsworthy et al. 2009b; Shaughnessy et al.
2011). Whilst a range of prey taxa were identified here, these results reflect diet from
individual foraging behaviour at two colonies. Habitat heterogeneity and localised influences
from regional boundary current systems in structuring biodiversity will likely imply spatial
differences in the diet of the Australian sea lion (Bryars, 2003; Muhling and Beckley, 2007;
Beckley et al. 2009).
Conclusions and future directions
This study confirms the value of DNA-based analysis to reveal fine-scale dietary information
from faecal remains of the Australian sea lion that were undetectable using traditional hard-
part methodology. While only two key prey components are represented here, the sequence
data has provided new insights into the broader diet of the Australian sea lion that would not
have been possible using other current dietary techniques (Costa and Gales, 2003; Fowler et
al. 2006; Goldsworthy et al. 2009). Further application of the DNA-based methodology will

CHAPTER 4: Fine-scale diet of the Australian sea lion
180
be central in developing a better understanding of their key prey components. Future studies
should utilise greater sample sizes over broader temporal and spatial scales to minimise some
of the limitations of the methods identified in this study.
ACKNOWLEDGEMENTS
This study was supported through the Australian Government National Heritage Trust (NHT)
grants scheme, Nature Foundation SA, and the Wildlife Conservation Fund. I thank the South
Australian Research and Development Institute (SARDI) Molecular Diagnostics group for
laboratory support, in particular to Dr. A. McKay, T. Mammone, Dr. Herdina, Jan Gooden,
Ina Dumitrescu and all staff. I would like to thank the Department of Environment, Water
and Natural Resources (DEWNR) particularly Dr. B. Page, B. Haddrill, B. Dalzel and their
staff for access and permission to conduct Australian sea lion research at colonies in South
Australia. I thank Dr. T. Ward (SARDI) for securing FRDC funding. Thanks to SeaLink and
Mountain Designs for their logistal support. I thank Dr. P. Shaughnessy, Dr. A. Baylis, Dr. J.
McKenzie, and Dr. B. Page for comments on this manuscript. I thank the volunteers who
assisted with fieldwork: C. Fulton, C. Kennedy, Dr. A. Baylis, Dr. R. McIntosh, E. Ayliffe,
Dr. M.A. Lea, and R. Sleep. This project was funded by grants prepared and submitted by K.
Peters and S. Goldsworthy. K. Peters was the recipient of an Adelaide University
postgraduate award. This research project was conducted under the DEWNR ethics permit
A246846 and Adelaide University animal ethics permit S80-2004. SDG was supported by
Marine Innovation South Australia (MISA), an initiative of the South Australian
Government.

CHAPTER 4: Fine-scale diet of the Australian sea lion
181
REFERENCES
Albaugh, G. P., Lyengar, V., Lohani, A., Malayeri, M., Bala, S., and Nair, P. P. (1992).
Isoloation of exfoliated colonic epithelial cells, a novel non-invasive approach to the
study of cellular markers. International Journal of Cancer, 52, 347–350.
Altschul, S. F., Gish, W., Miller, W., Myers E.W., and Lipman D. J (1990). Basic local
alignment search tool. Journal of Molecular Biology, 215, 403–410.
Anderson, T. J. (1999). Morphology and biology of Octopus Maorum Hutton 1880 in
Northern New Zealand. Bulletin of Marine Science, 65, 657–676.
Barnett, A., Redd, K. S., Frusher, S. D., Stevens, J. D., and Semmens, J. M. (2010) Non-
lethal method to obtain stomach samples from a large marine predator and the use of
DNA analysis to improve dietary information. Journal of Experimental Marine
Biology and Ecology, 393, 188–192.
Baylis, A. M. M., Page, B., and Goldsworthy, S. D. (2008). Colony-specific foraging areas of
lactating New Zealand fur seals. Marine Ecology Progress Series, 361, 279–290.
Baylis, A. M. M., and Nichols, P. D. (2009a). Milk fatty acids predict the foraging locations
of the New Zealand fur seal: continental shelf versus oceanic waters. Marine Ecology
Progress Series, 380, 271–286.
Beckley, L. E., Muhling, B. A., and Gaughan, D. J. (2009) Larval fishes off Western
Australia: influence of the Leeuwin Current. Journal of the Royal Society of Western
Australia, 92, 101–109.

CHAPTER 4: Fine-scale diet of the Australian sea lion
182
Baylis, A. M. M., Hamer, D. J., and Nichols, P. D. (2009b). Assessing the use of milk fatty
acids to infer the diet of the Australian sea lion (Neophoca cinerea). Wildlife
Research, 36, 169–176.
Blankenship, L. E., and Yayanos, A. A. (2005). Universal primers and PCR of gut contents to
study marine invertebrate diets. Molecular Ecology, 14, 891–899.
Braley, M., Goldsworthy, S. D., Page, B., Steer, M., and Austin, J. J. (2009). Assessing
morphological and DNA-based diet analysis techniques in a generalist predator, the
arrow squid, Nototodarus gouldi. Molecular Ecology Resources, 10, 466–474.
Bryars, S. (2003). An Inventory of Important Coastal Fisheries Habitats in South Australia.
Fish Habitat Program. Primary Industries and Resources South Australia.
Campbell, R. A., Gales, N. J., Lento, G. M., and Baker, C. S. (2008). Islands in the sea:
extreme female natal site fidelity in the Australian sea lion, Neophoca cinerea.
Biology Letters, 4, 139–142.
Carter, C. G., Lynch, K. A., and Moltschaniwskyj, N.A. (2009). Protein synthesis in a solitary
benthic cephalopod, the Southern dumpling squid (Euprymna tasmanica).
Comparative Biochemistry and Physiology, Part A, 153, 185–190.
Casper, R. M., Jarman, S. N., Gales, N. J., and Hindell, M. A. (2007a). Combining DNA and
morphological analyses of faecal samples improves insight into trophic interactions: a
case study using a generalist predator. Marine Biology, 152, 815–825.
Casper, R. M., Jarman, S. N., Deagle, B. E., Gales, N. J., and Hindell, M. A. (2007b).
Detecting prey from DNA in predator scats: A comparison with morphological

CHAPTER 4: Fine-scale diet of the Australian sea lion
183
analysis, using Arctocephalus seals fed a known diet. Journal of Experimental Marine
Biology and Ecology, 347, 144–154.
Chernick, M. R. (2007). Boootstrap methods: A practioner’s guide. John Wiley and Sons
Inc., New York: New York: 1–400.
Chiaradia, A., Forero, M. G., Hobson, K. A., and Cullen, J. M. (2010). Changes in diet and
trophic position of a top predator 10 years after a mass mortality of a key prey. ICES
Journal of Marine Science, 67, 1710–1720.
Childerhouse, S., Dix, B., and Gales, N. (2001). Diet of New Zealand sea lions (Phocarctos
hookeri) at the Auckland Islands. Wildlife Research, 28, 291–298.
Clarke, K. R., and Warwick, R. M. (2001). Change in marine communities; an approach to
statistical analysis and interpretation. 2nd edition. PRIMER-E, Plymouth. 1–174.
Costa, D. P., and Gales, N. J. (2003). Energetics of a benthic diver: Seasonal foraging
ecology of the Australian sea lion, Neophoca cinerea. Ecological Monographs, 73,
27–43.
Dalsgaard, J., St. John, M., Kattner, G., Müller-Navarra, D., and Hagen, W. (2003). Fatty
acid trophic markers in the pelagic marine environment. Advances in Marine Biology,
46, 225–340.
Dalziel, A. C., Moore, S. E., and Moves, C. D. (2005). Mitochondrial enzyme content in the
muscles of high-performance fish: evolution and variation among fiber types.
American Journal of Physiology, 288, 163–172.
Deagle, B. E., Tollit, D. J., Jarman, S. N., Hindell, M. A., Trites, A. W., and Gales, N. J.
(2005a). Molecular scatology as a tool to study diet: analysis of prey DNA in scats
from captive Steller sea lions. Molecular Ecology, 14, 1831–1842.

CHAPTER 4: Fine-scale diet of the Australian sea lion
184
Deagle, B. E., Jarman, S. N., Pemberton, D., and Gales, N. J. (2005b). Genetic screening of
prey in the gut contents from a giant squid (Architeuthis sp). Journal of Heredity, 96,
417–423.
Deagle, B. E., Eveson, J. P., and Jarman, S. N. (2006). Quantification of damage in DNA
recovered from highly degraded samples- a case study on DNA in faeces. Frontiers in
Zoology, 3, 1–10.
Deagle, B. E., and Tollit, D. J. (2007). Quantitative analysis of prey DNA in pinniped faeces:
potential to estimate diet composition? Conservation Genetics, 8, 743–747.
Deagle, B. E., Kirkwood, R., and Jarman, S. N. (2009). Analysis of Australian fur seal diet by
pyrosequencing prey DNA in faeces. Molecular Ecology, 18, 2022–2038.
Edyvane, K. S. (1999). Conserving biodiversity in South Australia II. Identification of areas
of high conservation value in South Australia. In: SARDI (ed) Book 39. Department
of Primary Industries South Australia, Adelaide.
Fowler, S. L., Costa, D. P., Arnould, J. P. Y., Gales, N. J., and Kuhn, C. E. (2006). Ontogeny
of diving behavior in the Australian sea lion: Trials of adolescence in a late bloomer.
Journal of Animal Ecology, 72, 358–367.
Fowler, S. L., Costa, D. P., and Arnould, J. P. Y. (2007). Ontogeny of movements and
foraging ranges in the Australian sea lion. Marine Mammal Science, 23, 598–614.
Furlani, D., Gales, R., and Pemberton, D. (2007). Otoliths of common Australian temperate
fish: a photographic guide. CSIRO Publishing. Collingwood, Victoria. Australia. pp
1–208.

CHAPTER 4: Fine-scale diet of the Australian sea lion
185
Gales, N. J., and Cheal, A. J. (1992). Estimating diet composition of the Australian sea lion
(Neophoca cinerea) from scat analysis: an unreliable technique. Wildlife Research,
19, 447–456.
Gales, N. J., Shaughnessy, P. D., and Dennis, T. E. (1994). Distribution, abundance and
breeding cycle of the Australian sea lion Neophoca cinerea (Mammalia: Pinnipedia).
Journal of Zoology, 234, 353–370.
Gibbs, S. E. (2008). Retention and condition of cephalopod beaks in the stomach of an
Australian sea lion (Neophoca cinerea). Australian Mammalogy, 29, 241-244.
Goldsworthy, S. D., and Page, B. (2007). A risk-assessment approach to evaluating the
significance of seal bycatch in two Australian fisheries. Biological Conservation, 139,
269–285.
Goldsworthy, S. D., Page, B., Shaughnessy, P. D., Hamer, D., Peters, K. J., McIntosh, R. R.,
Baylis, A. M. M., and McKenzie, J. (2009). Innovative solutions for aquaculture
planning and management: addressing seal interactions in the finfish aquaculture
industry. South Australian Research and Development Institute (Aquatic Sciences),
Adelaide. SARDI Aquatic Sciences Publication Number F2008/000222–1. SARDI
Research Report Series Number 288.
Goldsworthy, S. D., McKenzie, J., Shaughnessy, P. D., McIntosh, R. R., Page, B., and
Campbell, R. (2009b). An update of the report: understanding the impediments to the
growth of Australian sea lion populations. Report to the Department of the
Environment, Water, Heritage and the Arts. SARDI Aquat. Sci. Publ. No.
F2008/00847-1. SARDI Res Rep Ser No. 356. South Australian Research and
Development Institute (Aquatic Sciences), Adelaide

CHAPTER 4: Fine-scale diet of the Australian sea lion
186
Hartmann, N., Reichwald, K., Wittig, I., Dro, S., Schmeisser, S., Lück, C., Hahn, C., Graf,
M., Gausmann, G.,Terzibasi, E., Cellerino, A., Ristow, M., Brandt, U., Platzer, M.,
Englert, C. (2011). Mitochondrial DNA copy number and function decrease with age
in the short-lived fish Nothobranchius furzeri. Aging Cell, 10, 824–831.
Higgins, L.V. (1993). The nonannual, nonseasonal breeding cycle of the Australian sea lion,
Neophoca cinerea. Journal of Mammalogy, 74, 270–274.
Higgins, L.V., and Gass, L. (1993). Birth to weaning: parturition, duration of lactation, and
attendance cycles of Australian sea lions (Neophoca cinerea). Canadian Journal of
Zoology, 71, 2047–2055.
Hiss, R. H., Norris, D. E., Dietrich, C. H., Whitcomb, R. F., West, D. F., Bosio, C. F.,
Kambhampati, S., Piesman, J., Antolin, M. F., and Black, IV W. C. (2007). Molecular
taxonomy using single-strand conformation polymorphism (SSCP) analysis of
mitochondrial ribosomal DNA genes. Insect Molecular Biology, 3, 1365–2583.
doi: 10.1111/j.1365-2583.1994.tb00164.x.
Hyams, D. G. (2010). CurveExpert software.
Iverson, S. J., Field, C., Bowen, W. D., and Blanchard, W. (2004). Quantitative fatty acid
signature analysis: a new method of estimating predator diets. Ecological
Monographs, 74, 211–235. doi: 10.1890/02-4105.
Kimura, M. (1980). A simple method for estimating evolutionary rates of base substitutions
through comparative studies of nucleic sequences. Molecular Ecology, 16, 111–120.
King, R. A., Read, D. S., Traugott, M., and Sydmondson, W. O. C. (2008). Molecular
analysis of predation: a review of best practice for DNA-based approaches. Molecular
Ecology, 17, 947–963.
CHAPTER 4: Fine-scale diet of the Australian sea lion
187
Kohn, M. H., and Wayne, R. K. (1997). Facts from feces revisted. Trends in Ecology and
Evolution, 12, 223–227.
Lea, M. A., Cherel, I., Guinet, C., and Nichols, P. D. (2002). Antarctic fur seals foraging in
the Polar Frontal Zone: inter-annual shifts in diet as shown from fecal and fatty acid
analyses. Marine Ecology Progress Series, 245, 281–297.
Ling, J. K. (1992). Neophoca cinerea. Mammalian Species, 392, 1–7.
Lowther, A. D., and Goldsworthy, S. D. (2010). Detecting alternate foraging ecotypes in
Australian sea lion (Neophoca cinerea) colonies using stable isotope analysis. Marine
Mammal Science, 27, 567–586. doi: 10.1111/j.1748-7692.2010.00425.x.
Lowther, A. D., Harcourt, R. G., Hamer, D. J., and Goldsworthy, S. D. (2011). Creatures of
habit: foraging habitat fidelity of adult female Australian sea lions. Marine Ecology
Progress Series, 443, 249–263.
Lowther, A. D., Harcourt, R. G., Goldsworthy, S. D., and Stow, A. (2012). Population
structure of adult female Australian sea lions is driven by fine-scale foraging site
fidelity. Animal Behaviour, 83, 691–701.
Lu, C. C., and Ickeringill, R. (2002). Cephalopod beak identification and biomass estimation
techniques: tools for dietary studies of southern Australian finfishes. Museum Victoria
Science Reports 5. Museum Victoria, Melbourne.
Marshall, H. D., Hart, K. A., Yaskowiak, G. B., Stenson, G. B., McKinnon, D., and Perry, E.
A. (2010). Molecular identification of prey in the stomach contents of Harp Seals
(Pagophilus groenlandicus) using species-specific oligonucleotides. Molecular
Ecology Resources, 10, 181–189.

CHAPTER 4: Fine-scale diet of the Australian sea lion
188
McConnell, B. J., Fedak, M. A., Lovell, P., and Hammond, P.S. (1999). The movements and
foraging behaviour of grey seals. Journal of Applied Ecology, 36, 573–590.
McIntosh, R. R., Page, B., and Goldsworthy, S. D. (2006). Dietary analysis of regurgitates
and stomach samples from free-living Australian sea lions. Wildlife Research, 33,
661–669.
Meynier, L., Morel, P. C. H., Mackenzie, D. D. S., MacGibbon, A., Chilvers, B. L., and
Duignan, P. J. (2008). Proximate and fatty acid compositions of New Zealand marine
species. New Zealand Journal of Marine and Freshwater Research, 42, 425–437. doi:
0028–8330/08/4204–0425.
Meynier, L., Duncan, D. S., Mackenzie, D. D. S., Duignan, P. J., Chilvers, B. L., and Morel,
P. C. H. (2009). Variability in the diet of New Zealand sea lion (Phocarctos hookeri)
at the Auckland Islands, New Zealand. Marine Mammal Science, 25, 302–326.
doi: 10.1111/j.1748-7692.2008.00252.x.
Muhling, B. A. and Beckley, L. E. (2007). Seasonal variation in horizontal and vertical
structure of larval fish assemblages off south-western Australia, with implications for
larval transport. Journal of Plankton Research, 29, 967–983.
Myers, R. A., Baum, J. K., Shepherd, T. D., Powers, S. P., Peterson, C. H. (2007). Cascading
effects of the loss of apex predatory sharks from a coastal ocean. Science, 315, 1846–
1850.
Nejstgaard, J. C., Frischer, M. E., Simonelli, P., Troedsson, C., Brakel, M., and Adiyaman, F.
(2008). Quantitative PCR to estimate copepod feeding. Marine Biology (Berl), 153,
565–577.

CHAPTER 4: Fine-scale diet of the Australian sea lion
189
Page, B., McKenzie, J., and Goldsworthy, S. D. (2005). Dietary resource partitioning among
sympatric New Zealand and Australian fur seals. Marine Ecology Progress Series,
293, 283–302.
Passmore, A., Jarman, S., Swadling, K., Kawaguchi, S., McMinn, A., and Nicol, S. (2006).
DNA as a dietary biomarker in Antarctic krill, Euphausia superba. Marine
Biotechnology, 8, 686–696.
Peters, K. J., Ophelkeller, K., Bott, N. J., Herdina, H., and Goldsworthy, S. D. ( 2014b). PCR-
based techniques to determine diet of the endangered Australian sea lion (Neophoca
cinerea): a comparison with morphological analysis. Marine Ecology, 36, 1428–1439.
doi: 10.1111/maec.12242
Richardson, K. C., and Gales, N. J. (1987). Functional morphology of the alimentary tract of
the Australian sea-lion, Neophoca cinerea. Australian Journal of Zoology, 35, 219–
226. doi:10.1071/ZO9870219
Roper, C. F. E. (1983). An overview of cephalopod systematics: status, problems and
recommendation. Memoirs of the National Museum of Victoria, 44, 13–27.
Schiffman, S., Reynolds, M. L., and Young, F. W. (1981). Introduction to multidimensional
scaling. Academic Press, New York.
Shaughnessy, P. D., Dennis, T. E., and Seager, P. G. (2005). Status of Australian sea lions,
Neophoca cinerea, and New Zealand fur seals, Arctocephalus forsteri, on Eyre
Peninsula and the far west coast of South Australia. Wildlife Research, 32, 85–101.

CHAPTER 4: Fine-scale diet of the Australian sea lion
190
Shaughnessy, P. D., McKenzie, J., Lancaster, M. L., Goldsworthy, S. D., and Dennis T. E.
(2010) Australian fur seals establish haul out sites and a breeding colony in South
Australia. Australian Journal of Zoology, 58, 94–103.
Shaughnessy, P. D., Goldsworthy, S. D., Hamer, D., Page, B., and McIntosh, R.R. (2011).
Australian sea lions Neophoca cinerea at colonies in South Australia: distribution and
abundance, 2004 to 2008. Endangered Species Research, 13, 87–98.
Soininen, E. M., Valentini, A., Coissac, E., Miquel, C., Gielly, L., Brochmann, C., Brysting,
A. K., Sønstebø, J. H., Ims, R. A., Yoccoz, N. G., and Taberlet, P. (2010) Analysing
diet of small herbivores: the efficiency of DNA barcoding coupled with high-
throughput pyrosequencing for deciphering the composition of complex plant
mixtures. Frontiers in Zoology, 6, 16.
Staniland, I. (2002). Investigating the biases in the use of hard prey remains to identify diet
composition using Antarctic fur seals (Arctocephalus gazella) in captive feeding
trials. Marine Mammal Science, 18, 223–243.
Stark, E. K. (2008). Ecology of the Arrow Squid (Nototodarus gouldi) in Southeastern
Australian Waters. PhD Thesis. University of Tasmania. 1–145.
Steer, M. A., Lloyd, M. T., and Jackson, W. B. (2006). Southern Calamary (Sepioteuthis
australis) Fishery. Fishery Assessment Report to PIRSA. South Australian Research
and Development Institute (Aquatic Sciences), Adelaide, RD 05/0006–2.
Stranks, T. N., Norman, M. D. (1992). Review of the Octopus australis complex from
Australia and New Zealand, with description of a new species (Mollusca:
Cephalopoda). Memoirs of the Museum of Victoria, 53, 345–373.

CHAPTER 4: Fine-scale diet of the Australian sea lion
191
Tollit, D. J., Steward, M. J., Thompson, P. M., Pierce, G. J., Santos, M. B., and Hughes, S.
(1997). Species and size differences in the digestion of otoliths and beaks:
implications for estimates of pinniped diet composition. Canadian Journal of
Fisheries Aquatic Science, 54, 105–119.
Tollit, D. J., Black, A. D., Thompson, P. M., Mackay, A., Corpe, H. M., Wilson, B., Van
Parijs, S. M., Grellier, K., and Parlane, S. (1998). Variations in harbour seal Phoca
vitulina diet and dive-depths in relation to foraging habitat. Journal of Zoology, 244,
209 –222.
Tollit, D. J., Wong, M., Winship, A. J., Rosen, D. A., and Trites, A.W. (2003). Quantifying
errors associated with using prey skeletal structures from fecal samples to determine
the diet of Steller's sea lion (Eumetopias jubatus). Marine Mammal Science, 19, 724–
744.
Tollit, D. J., Heaslip, S. G., Barrick, R. L., and Trites A.W. (2007). Impact of diet-index
selection and the digestion of prey hard remains on determining the diet of the Steller
sea lion (Eumetopias jubatus). Canadian Journal of Zoology, 85, 1–15.
Tollit, D. J., Schulze, A. D., Trites, A. W., Olesiuk, P. F., Crockford, S. J., Gelatt, T. S.,
Ream, R. R., and Miller, K. M. (2009). Development and application of DNA
techniques for validating and improving pinniped diet estimates. Ecological
Applications, 19, 889–905.
Thompson, J. D., Gibson,T. J., Plewniak, F., Jeanmougin, F., and Higgins, D. G. (1997). The
ClustalX windows interface: flexible strategies for multiple sequence alignment aided
by quality analysis tools. Nucleic Acids Research, 25, 4876–4882.

CHAPTER 4: Fine-scale diet of the Australian sea lion
192
Triantifillos, L., Jackson, G. D., Adams, M., and McGrath-Steer, B. L. (2004). An allozome
investigation of species boundaries and stock structure in Australian populations of
the arrow squid Nototodarus gouldi (Cephalopoda: Ommastrephidae). In ‘FRDC
Final Report. Arrow squid in Southern Australian Waters – Supplying Management
Needs Through Biological Investigations’. (Eds G. D. Jackson and B. McGrath-
Steer.) pp. 18–24. (Fisheries Research and Development Corporation and South
Australian Research and Development Institute: Adelaide.)
Valentini, A., Miquel, C., Nawaz, M. A., Bellemain, E., Coissac, E., Pompanon, F., Gielly,
L., Cruaud, C., Nascetti, G., Wincker, P., Swenson, J. E., and Taberlet, P. (2009).
New perspectives in diet analysis based on DNA barcoding and parallel
pyrosequencing: the trnL approach. Molecular Ecology Resources, 24, 110–117.
Vestheim, H., and Jarman, S. N. (2008). Blocking primers to enhance PCR amplification of
rare sequences in mixed samples — a case study on prey DNA in Antarctic krill
stomachs. Frontiers in Zoology, 5, 12.
Vestheim, H., Deagle, B. E., and Jarman, S. N. (2011). Application of blocking
oligonucleotides to improve signal-to-noise ratio in a PCR. Methods in Molecular
Biology (Clifton, NJ), 687, 265–274.
Walker, G. E., and Ling, J. K. (1981). Australian sea lion Neophoca cinerea (Péron, 1816).
In: Ridgway, S. H., Harrison R. J. (Eds). Handbook of Marine Mammals; the Walrus,
Sea Lions, Fur Seals and Sea Otter. Academic Press, London, Volume 1, pp 99–118.

193
CHAPTER 5
Insights into seasonal prey use of the Australian sea lion
(Neophoca cinerea) using faecal DNA and high-throughput
sequencing

CHAPTER 5: Insights into seasonal prey use of the Australian sea lion
194
ABSTRACT
The endangered Australian sea lion (Neophoca cinerea) (ASL) has a small, fragmented
population (~12,000 individuals) that is widely distributed, extending from Houtman
Albrolhos, Western Australia, to the Pages Islands, South Australia. Recent declines at
breeding colonies across their range, has prompted a range of conservation initiatives to
address knowledge gaps in the species’ biology. Biologging studies indicate that ASL utilise
various benthic habitats to acquire prey. However, information on diet and the spatial and
temporal use of prey resources remains poor. In this study, prey hard parts and DNA-based
next-generation sequencing (NGS) analyses were used to determine seasonal diversity of fish
and cephalopod prey of ASL. Faecal samples were collected from the Seal Bay colony (n =
176), on Kangaroo Island South Australia across seasons. PCR amplification using short
(~100 bp) 16S mtDNA PCR primers and NGS sequencing of 110 samples revealed 65 unique
sequence clusters that comprised a wide range of benthic and demersal bony fish,
cartilaginous fish, and cephalopod prey. Combined with prey identified by hard parts (2 fish
and 5 cephalopod prey species), these findings indicate that ASL use similar resources
throughout the year. These results highlight the value of DNA-based faecal analysis and NGS
in identifying ASL prey.
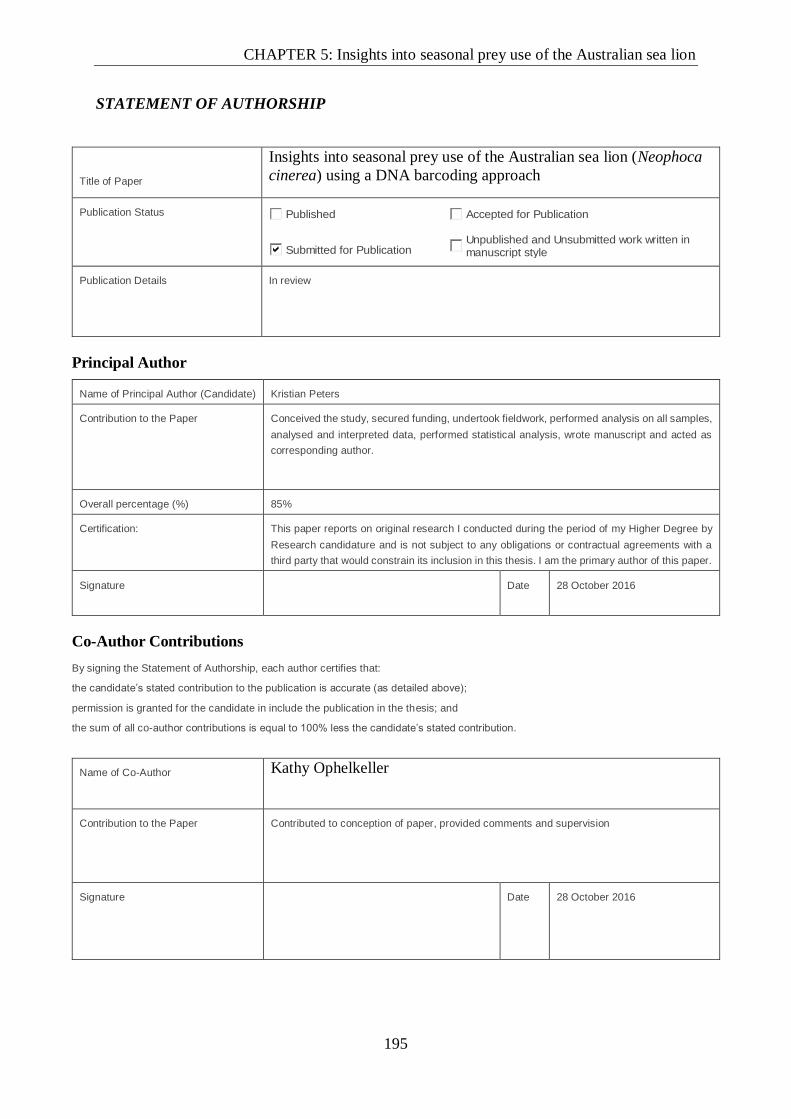
CHAPTER 5: Insights into seasonal prey use of the Australian sea lion
195
STATEMENT OF AUTHORSHIP
Title of Paper
Insights into seasonal prey use of the Australian sea lion (Neophoca
cinerea) using a DNA barcoding approach
Publication Status Published Accepted for Publication
Submitted for PublicationUnpublished and Unsubmitted work written in manuscript style
Publication Details In review
Principal Author
Name of Principal Author (Candidate) Kristian Peters
Contribution to the Paper
Conceived the study, secured funding, undertook fieldwork, performed analysis on all samples,
analysed and interpreted data, performed statistical analysis, wrote manuscript and acted as
corresponding author.
Overall percentage (%) 85%
Certification: This paper reports on original research I conducted during the period of my Higher Degree by
Research candidature and is not subject to any obligations or contractual agreements with a
third party that would constrain its inclusion in this thesis. I am the primary author of this paper.
Signature
Date 28 October 2016
Co-Author Contributions
By signing the Statement of Authorship, each author certifies that:
the candidate’s stated contribution to the publication is accurate (as detailed above);
permission is granted for the candidate in include the publication in the thesis; and
the sum of all co-author contributions is equal to 100% less the candidate’s stated contribution.
Name of Co-Author Kathy Ophelkeller
Contribution to the Paper Contributed to conception of paper, provided comments and supervision
Signature
Date 28 October 2016

CHAPTER 5: Insights into seasonal prey use of the Australian sea lion
196
Name of Co-Author Nathan Bott
Contribution to the Paper
Guidance with laboratory analysis, provided comments on manuscript draft
Signature
Date 28 October 2016
Name of Co-Author Bruce Deagle
Contribution to the Paper Guidance with laboratory analysis, provided comments on manuscript draft
Signature
Date 28 October 2016
Name of Co-Author Simon Jarman
Contribution to the Paper Guidance with laboratory analysis, provided comments on manuscript draft
Signature
Date 28 October 2016
Name of Co-Author Simon Goldsworthy
Contribution to the Paper Conceived the study, secured funding, provided comments to manuscript drafts and
supervision.
Signature
Date 28 October 2016

CHAPTER 5: Insights into seasonal prey use of the Australian sea lion
197
INTRODUCTION
Marine mammals often perform fundamental roles within marine ecosystems, from
influencing the abundance and distribution of other species, to recycling of nutrients that are
invaluable for ecological processes (Trites et al. 1997). With the increasing human demand
for marine food resources, identification of key trophic interactions in marine ecosystems,
including interactions with high trophic-level species, is important to ensure their
management is sustainable (Block et al. 2011; Goldsworthy et al. 2011, 2013). Where species
are of high conservation concern, identifying population processes that underpin distribution
and abundance such as identifying important habitat or prey resources is particularly
important because even small changes can result in population declines or instability (Boyd et
al. 1995; Goodman-Lowe, 1998; Farrell et al. 2000; Lee et al. 2013; Quéméré et al. 2013).
Hence, dietary information can assist in understanding threatening processes, and informing
the development of appropriate conservation, mitigation and management strategies.
Among pinnipeds, sea lions are of particular conservation concern because five of the six
extant species have not recovered from the population reductions caused by sealing in the
18th and 19th centuries (e.g. Gerber et al. 2001; Hoffman et al. 2015). The Californian sea lion
(Zalophus californianus) is the only species that has recovered (Caretta et al. 2015). The
Australian (Neophoca cinerea), Galapagos (Zalophus wollebaeki), Steller (Eumetopias
jubatus), South American (Otaria flavescens), and New Zealand sea lion (Phocarctos
hookeri) are classified as either Endangered or Vulnerable (International Union for
Conservation of Nature, 2008-2012).
Causes of recent sea lion population declines may include fisheries-based mortality and
disease (Goldsworthy et al. 2003; Page et al. 2004; Wilkinson et al. 2006; Castinel et al.

CHAPTER 5: Insights into seasonal prey use of the Australian sea lion
198
2007; Chilvers, 2008; Kovacs et al. 2012), predation (Springer et al. 2003), and the
availability and quality of prey (Trites and Donelly, 2003; Estes et al. 2009; Robertson and
Chilvers, 2011). For example, during El Niño years, unseasonal sea surface warming is
associated with nutritional stress of Galapagos and Californian sea lions and population
declines (Trillmich, 1985; Trillmich and Dellinger, 1991; Alava and Salazar, 2006;
Shirasago-German et al. 2015). Similarly, the western stock of the Steller sea lion has
experienced population declines over the past 30 years, with one of the causes suggested to
be the replacement of energy rich prey with poor quality prey (Schaufler et al. 2006; Trites et
al. 2007). Competition with fisheries for prey may have also contributed to the decline of
New Zealand sea lions (Robertson and Chilvers, 2011). Given that abundant and available
trophic resources are essential to sustain marine predator populations (Boyd et al. 2000;
Bluhm and Gradinger, 2008), understanding of diet, especially for threatened or endangered
species, is central to improving conservation and management strategies to facilitate species
recovery.
The Australian sea lion (Neophoca cinerea) (ASL) is an endemic species and one of the
rarest otariids in the world. The population comprises ~12,000 individuals (Shaughnessy et
al. 2011; Goldsworthy, 2015) and extends from Western Australia (Houtman Albrohos, 113º
47’ E, 28º 43’ S) to South Australia (Pages Islands, 35º 45’ S, 138º 18’ E) (Ling, 1992;
Shaughnessy et al. 2011). The breeding biology of ASL is unusual among pinnipeds in that
females have a non-annual reproductive cycle of 15-18 months, and breeding is temporally
asynchronous among colonies (Higgins, 1993; Higgins and Gass, 1993; Gales et al. 1994).
Females typically return to breed at the colony where they were born, increasing the risk that
small subpopulations will become extinct as a result of either natural and anthropogenic
pressures (Goldsworthy and Page, 2007; Campbell et al. 2008; Goldsworthy et al. 2009a;

CHAPTER 5: Insights into seasonal prey use of the Australian sea lion
199
Shaughnessy et al. 2011; Lowther et al. 2012; Hamer et al. 2013; Goldsworthy et al. 2015;
Ahonen et al. 2016).
While tracking and biochemical diet analyses suggest ASL are individual specialists with
high fidelity to foraging areas and prey (Costa and Gales, 2003; Fowler et al. 2006, 2007;
Baylis et al. 2009; Goldsworthy et al. 2009a, b; Lowther et al. 2011, 2012), little taxonomic
information exists on the geographic or temporal variation in diet across their range. Hard-
part diet analyses indicate that ASL consume cephalopods, teleost fish, cartilaginous and
crustacean prey (Richardson and Gales, 1987; Gales and Cheal, 1992; McIntosh et al. 2006;
Gibbs, 2008; Baylis et al. 2009; Peters et al. 2014a). However, the results of such studies
overestimate the importance of cephalopods because biases associated with hard-part analysis
of ASL faeces mean that few other prey remains are able to be identified (Gales and Cheal,
1992; Childerhouse et al. 2001; Tollit et al. 2003; McIntosh et al. 2006; Gibbs, 2008). Recent
studies have also used faecal DNA-based methods to assess ASL diet and highlight the
promise of DNA-based methods to more accurately represent ASL diet, and improve
information on the temporal-spatial use of resources. This information is currently limited in
ASL to trophic-level inference of prey (Baylis et al. 2009; Lowther et al. 2012, Peters et al.
2014a, b).
In this study, I expand on previous work to explore the use of DNA-based faecal analyses as
an alternative approach to determine diet in ASL. Amplification of prey DNA using the
polymerase chain reaction (PCR) has become a useful method to elucidate prey from faeces
that often contain ambiguous or unidentifiable remains (Casper et al. 2007a; Deagle and
Tollit, 2007; Bowles et al. 2011). Although prey resolution using DNA-based methods is
dependent on DNA surviving digestion (Sydmonson, 2002; 2006; King et al. 2008; Hartmann
et al. 2011), the ability to identify ingested taxa with or without hard parts has broadened

CHAPTER 5: Insights into seasonal prey use of the Australian sea lion
200
information of diet in many species (Blankenship and Yayanos, 2005; Passmore et al. 2006;
King et al. 2008; Deagle et al. 2007). More recently, the increased depth of sequencing
offered by ‘next generation’ DNA sequencing (NGS) technology has improved the capacity
for researchers to identify a broader range of species in the diets of predators and herbivorous
grazers (Rongahi 2001; Buee et al. 2009; Pompanon et al. 2012; Shokralla et al. 2012; Rayé
et al. 2011; Brown et al. 2012; Willerslev et al. 2014). Because NGS can simultaneously
identify thousands of sequences per PCR-DNA sample, this approach is now commonly
adapted to characterise faecal and stomach remains of marine mammal predators such as
seals and seabirds, which are traditionally used to study diet (Deagle et al.2009, 2010; Jarman
et al. 2013; McInnes et al. 2016). For ASL, applying NGS to faeces collected over a wide
temporal scale may provide greater understanding of their long-term use of resources,
enhancing knowledge of prey distributions and composition; information that is currently
lacking for ASL.
Seal Bay on Kangaroo Island, South Australia (Fig. 1) is the third largest breeding site for the
ASL with accessibility that is well suited to monitoring temporal variation in diet. This study
aimed to apply novel NGS and hard part prey analyses to i) determine seasonal variation and
prey diversity of ASL at Seal Bay and, ii) determine their broad use of prey.
MATERIALS AND METHODS
Sample collection
Fresh faecal samples (collected within ~12 hours of deposition) were collected over seven
seasons (summer, autumn, winter, spring) from the Seal Bay sea lion colony, Kangaroo
Island, South Australia (35º 59' 49'' S, 137º 18' 21'' E) (Fig. 1) between September 2005 and
September 2007. Whole samples were collected; each was stored in a sterile bag (Nasco-
Whirl-Pak®) containing 95% ethanol and homogenised prior to storage at -20oC.
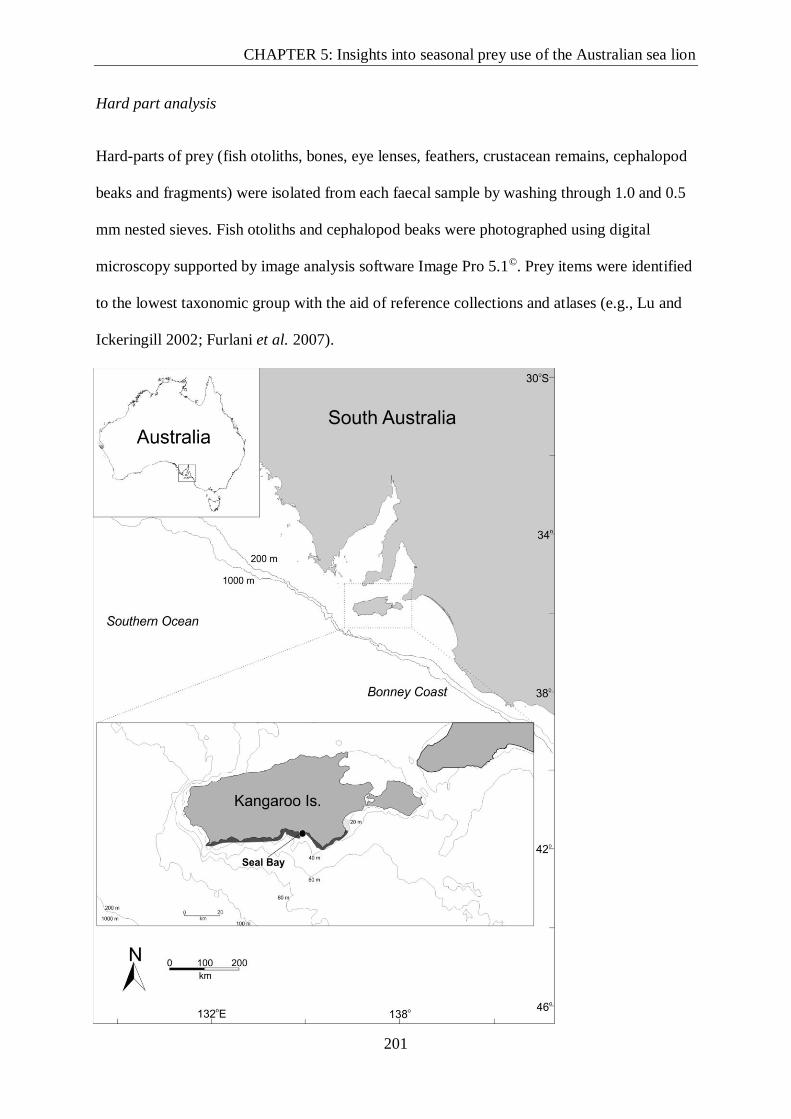
CHAPTER 5: Insights into seasonal prey use of the Australian sea lion
201
Hard part analysis
Hard-parts of prey (fish otoliths, bones, eye lenses, feathers, crustacean remains, cephalopod
beaks and fragments) were isolated from each faecal sample by washing through 1.0 and 0.5
mm nested sieves. Fish otoliths and cephalopod beaks were photographed using digital
microscopy supported by image analysis software Image Pro 5.1©. Prey items were identified
to the lowest taxonomic group with the aid of reference collections and atlases (e.g., Lu and
Ickeringill 2002; Furlani et al. 2007).

CHAPTER 5: Insights into seasonal prey use of the Australian sea lion
202
Figure 1. Location of study site, Seal Bay on Kangaroo Island. Local benthic habitat is
indicated low profile reef (dark grey) and sea grass meadow with unvegetated soft bottom
(light grey) (Edyvane et al. 1999; Bryars, 2003). Bathymetric contours are shown.
DNA extraction
DNA was extracted from a subset of the faecal samples (n = 110) prior to removal of prey
hard parts. For the extraction process, ethanol-faecal mixtures were re-suspended in each bag
and a 200 mg sub-sample taken. The remaining faecal material was used for the hard-part
analysis. For each sub-sample the ethanol supernatant was removed from the soft-matrix and
DNA extracted using the QIAamp DNA Stool Mini Kit (QIAGEN). DNA yield was
quantified on a Wallac1420 multi-label fluorometer using PicoGreen® dsDNA Quantitation
reagent (Molecular Probes-Invitrogen®). DNA was diluted to 3000 pg / µl (~1:5) in distilled
water prior to PCR. Extraction blanks were used to monitor DNA extraction contamination
for each batch of 12 extractions.
Primer sets
Two primer sets were used to amplify prey DNA in the study. The universal fish primer set
(Univ Fish) is well conserved among marine fish and amplifies a ~100 bp fragment of the
16S mtDNA of fish and elasmobranchs. This primer set has been used previously to amplify
fish prey from faecal DNA (Table 1) (Deagle et al. 2009; Peters et al. 2014a). The addition of
a pinniped blocking primer to each PCR reaction reduced amplification of sea lion DNA and
increased amplification of prey (Vestheim and Jarman, 2008, Vestheim et al. 2011). The
blocking primer was added at 10 times the concentration of the primer set for PCR
amplification (see Deagle et al. 2009) (Table 1).
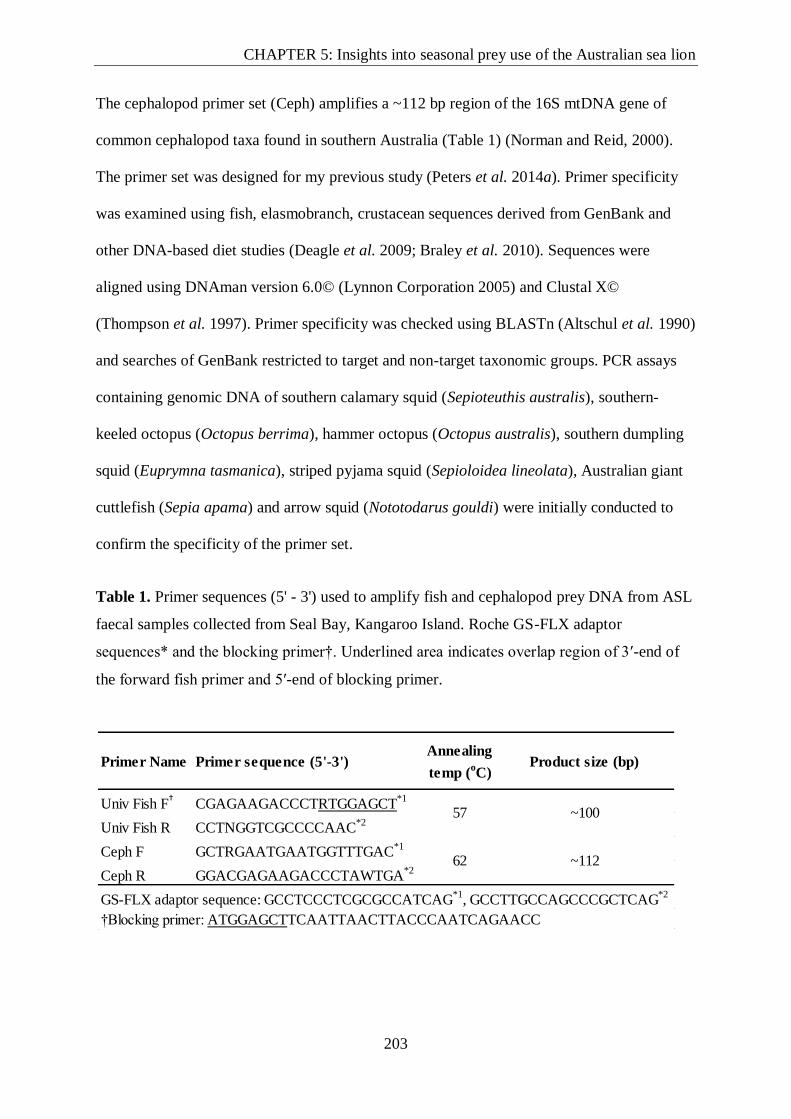
CHAPTER 5: Insights into seasonal prey use of the Australian sea lion
203
The cephalopod primer set (Ceph) amplifies a ~112 bp region of the 16S mtDNA gene of
common cephalopod taxa found in southern Australia (Table 1) (Norman and Reid, 2000).
The primer set was designed for my previous study (Peters et al. 2014a). Primer specificity
was examined using fish, elasmobranch, crustacean sequences derived from GenBank and
other DNA-based diet studies (Deagle et al. 2009; Braley et al. 2010). Sequences were
aligned using DNAman version 6.0© (Lynnon Corporation 2005) and Clustal X©
(Thompson et al. 1997). Primer specificity was checked using BLASTn (Altschul et al. 1990)
and searches of GenBank restricted to target and non-target taxonomic groups. PCR assays
containing genomic DNA of southern calamary squid (Sepioteuthis australis), southern-
keeled octopus (Octopus berrima), hammer octopus (Octopus australis), southern dumpling
squid (Euprymna tasmanica), striped pyjama squid (Sepioloidea lineolata), Australian giant
cuttlefish (Sepia apama) and arrow squid (Nototodarus gouldi) were initially conducted to
confirm the specificity of the primer set.
Table 1. Primer sequences (5' - 3') used to amplify fish and cephalopod prey DNA from ASL
faecal samples collected from Seal Bay, Kangaroo Island. Roche GS-FLX adaptor
sequences* and the blocking primer†. Underlined area indicates overlap region of 3′-end of
the forward fish primer and 5′-end of blocking primer.
Primer Name Primer sequence (5'-3')Annealing
temp (oC)
Product size (bp)
Univ Fish F†
CGAGAAGACCCTRTGGAGCT*1
Univ Fish R CCTNGGTCGCCCCAAC*2
Ceph F GCTRGAATGAATGGTTTGAC*1
Ceph R GGACGAGAAGACCCTAWTGA*2
GS-FLX adaptor sequence: GCCTCCCTCGCGCCATCAG*1
, GCCTTGCCAGCCCGCTCAG*2
†Blocking primer: ATGGAGCTTCAATTAACTTACCCAATCAGAACC
~100
62 ~112
57

CHAPTER 5: Insights into seasonal prey use of the Australian sea lion
204
Primer adjustments for GS-FLX sequencing
To differentiate prey sequences generated for each season by the GS-FLX 454 sequencer,
barcode sequence tags were added to the 5’-end of the forward and reverse primer of each
primer pair. Adaptor sequences were added to the 5’-end of each primer pair to facilitate the
GS-FLX sequencing process (Table 1).
PCR reactions
PCR amplifications (10μL) contained 2μL DNA, 2.0 mM MgCl2, 10 x QIAGEN PCR buffer,
1 x BSA, 10 µM DNTP, 10 µM HPLC purified amplification primers, 100 µM blocking
primer and 1 x 0.625 units HotStar Taq DNA polymerase (QIAGEN). Thermal cycling
conditions for fish amplifications were 95 oC for 15 min, followed by 32 cycles of: 94 oC for
15s, 57 oC for 90s, and 72oC for 30 s. Thermal cycling conditions for cephalopod
amplifications were: 95 oC for 15 min, 94 oC for 2 min, followed by 32 cycles of: 94 oC for
10 s, 62.0 oC for 35s and 72 oC for 30 s. A final extension step of 72 oC for 10 min was
included in all assays. PCR amplifications were detected by gel electrophoresis on 1.5%
agarose gel stained with Gelred™ and visualised using Gel-DOC UV illuminator (Bio-Rad®)
supported by Quantity One Quantitation analysis software (Bio-Rad®). Positive PCR
reactions were quantified using PicoGreen® dsDNA Quantitation reagent (Molecular Probes-
Invitrogen®) on a Wallac1420 multilabel fluorometer. PCRs included negative controls to
check for contamination. All PCR preparations used UV sterilised aerosol resistant filter tips,
consumables and equipment, and were prepared in DNA free laminar flow UV sterilisation
hoods.

CHAPTER 5: Insights into seasonal prey use of the Australian sea lion
205
Roche GS-FLX sequencing and analysis
Prior to GS-FLX sequencing, equimolar quantities of all amplicons for each seasonal set of
samples generated were pooled to form a single metasample. Seven seasonal metasamples for
each primer set were then sequenced at the Australian Genome Research Facility (AGRF)
using the Roche GS-FLX (454) platform sequencer. Sequencing data for each season were
obtained using a PicoTitre Plate separated by gaskets. All reads started from GS-FLX adapter
primer A (Table 1).
Sequences were initially sorted by read length following Deagle et al. (2009). Sequences
longer or shorter than the expected read length encompassed by each primer set were
excluded from the analysis. Sequences were then sorted by the 5’ end tag of the forward
sequence followed by the reverse 5’ tag sequence for each primer pair to differentiate
sequences between seasons and years.
Clusters of similar sequences were identified following the method used by Deagle et al.
(2009). Briefly, pairwise similarity was determined among all sequences using Kimura 2-
parameter distance measures and clusters of similar sequences identified. Sequences within
each cluster were then taxonomically identified by searches of GenBank using BLASTn. A
high stringency was applied to the GenBank searches, using ≥ 97% matches and discarded
sequences with lower alignment scores. Where recurrent sequences appeared common in the
dataset but could not be clearly identified in GenBank, these were assigned to either the
nearest lower taxonomic group or the sequences remained unidentified. In each pooled meta-
sample the number of sequences per cluster was used as a proxy for species abundance
(Deagle et al. 2009; Jarman et al. 2013; Willerslev et al. 2014).

CHAPTER 5: Insights into seasonal prey use of the Australian sea lion
206
Data analysis
Prey composition for each season and year were represented as percent numerical abundance
(NA %) (proportion of total prey sequences of each prey taxa per season). Differences in
dietary composition among seasons and years were assessed using non-parametric analysis of
similarity (ANOSIM) on a Bray-Curtis similarity matrix with results reinforced using the
permutation multivariate analysis procedure (PERMANOVA) in Primer (Primer version 6.0,
PRIMER-E Ltd., Plymouth, UK). Similarity percentages (SIMPER) (Clarke, 1993) were used
to identify prey responsible for group differences. The RANOSIM statistic provides a relative
measure of separation between groups with R values of zero (0) supporting the null
hypothesis, and a value of one (1) indicating samples within defined groups that are more
similar to one other than samples from other groups. To make data comparable between
seasons, sequence clusters for each prey taxa were standardised across all taxa by dividing
the number of sequences of each prey item recovered by the total number of sequences
recovered for that season. The data for each season was then represented as a proportion of
all sequence data recovered. Yearly comparisons were also standardised using this method.
Data were bootstrapped (Monte Carlo) 10,000 iterations and where necessary, transformed
prior to analyses. For the multivariate analysis, a hierarchical similarity cluster analysis based
on multidimensional scaling plot (MDS) was performed to exhibit the relationship between
seasons or years. Stress values were calculated in three dimensions to determine how well the
data were representative for the ordination. Stress values of < 0.1 provided interpretable
information of the separation between groupings (Schiffman et al. 1981; Page et al. 2005).
Species diversity was further calculated for each season and taxonomic group using
Shannon’s diversity index (H’).

CHAPTER 5: Insights into seasonal prey use of the Australian sea lion
207
Assessment of sampling effort
To assess if the sequence data provided an effective representation of potential prey diversity,
prey accumulation analyses were performed in R (Foundation for Statistical Computing,
version 2.12, R Development Core Team, 2010) to determine the asymptotic prey diversity
for overall seasonal and total prey taxa identified for each taxonomic group (fish and
cephalopods). For each dataset, unique sequence clusters within each library were
randomised and the total number of unique sequences represented across the sequence library
was calculated. A second cluster was chosen at random, calculating the total number of
sequences that it represented within the sequence library. The procedure was replicated until
all unique prey taxa, represented by their respective sequences had been selected and the
cumulative number of prey species calculated. The mean number ± standard deviation (SD)
of prey sequences per season was calculated for each sequence cluster. The data was
bootstrapped (Monte Carlo) 10,000 iterations and for each prey species, I then calculated the
cumulative number of prey species represented by j sequences / season ± standard deviation (
ˆ boot):
ˆ boot
n 1
n
1
n(n 1)(xi x j )
2
i1
n
where n is the number of iterations, x is the mean number of prey species identified by the jth
sequence or season at iteration i (Chernick,1999).
The mean number of prey species identified in each library was then plotted using Curve
Expert (v 1.4) (Hyams, 2009). The accumulation curves were fitted using the Gompertz
function to calculate the asymptotic number of prey species identified in each library
interpreted as the maximum number of prey species identified by j sequences per season.

CHAPTER 5: Insights into seasonal prey use of the Australian sea lion
208
From the model, I then calculated the number of sequences and seasons required to represent
95% of the asymptotic prey diversity.
RESULTS
Prey hard parts
One-hundred and seventy-six faecal samples were collected for the diet analysis. Of these, a
random subset comprising 110 faecal samples were selected for the DNA and hard-part
analysis. Of the 110 samples, only 19 samples (17%) contained the remains of prey that were
identifiable to a lower taxonomic level (genus and species) (Table 2). Ninety-one samples
(83%) contained no remains, or prey remains were severely digested and damaged. To
increase information on diet across seasons, 66 additional faecal samples were assessed for
hard-parts. Of the 176 samples, prey hard-parts were absent in 72 (40.9 %) samples. In total,
174 prey items were recovered from 103 (58.5%) samples. Most prey items were highly
eroded and only identified to phyla. In all, 72 (40.9 %) samples contained fish remains, 27
(15.3 %) cephalopods, and 4 (2.3 %) samples contained remains of small decapod
crustaceans (~10 mm in length). Thirty-three samples (18.7 %) contained 56 diagnostic
structures that were identified to genus or species. Two fish and four cephalopod taxa were
identified to species, two cephalopods to genus, and prey items of one fish and one
cephalopod to family (Table 2). Six eroded fish otoliths were recovered but these could not
be identified to a lower taxonomic level.
DNA analysis overview
In all, 20,961 sequence reads were generated from the 110 faecal samples comprising 9,577
and 11,384 sequence reads from the universal fish and cephalopod datasets, respectively. For
fish, the mean number of sequence reads generated per season was 1,368.1 ± 1,265.8 (median

CHAPTER 5: Insights into seasonal prey use of the Australian sea lion
209
1,294 sequences, range 10 to 3,806) and for the cephalopod dataset it was 1,626.1 ± 2,550.1
(median 239, range 10 ‒ 5,651). For each dataset, the cumulative model for the number of
sequences produced per taxonomic group exhibited a sigmoidal curve that reached an
asymptote (Fig. 2). The corresponding r2 values for each model (0.971 ‒ 0.999) indicated
sampling effort was sufficient to represent a minimum of 95% of the asymptotic diversity of
potential population prey likely to have been encountered over all seasons (Table 3).
Fish primer set and prey composition
In total, 99 (90%) samples produced PCR amplicons of fish species. Four summer and seven
spring samples did not produce PCR amplicons. Of the 9,577 sequences generated from GS-
FLX sequencing, 6,356 (66.3%) sequence reads failed initial screening (truncated or long
sequence reads) and were eliminated from the analysis. Post screening, 3,072 unique fish
sequences remained in the dataset. With the exception of the winter season, the total number
of fish sequences recovered ranged from 36 to 1, 415 per season (Table 4). Winter produced
only one fish sequence even though all samples from this season produced PCR amplicons.
This anomaly was attributed to sequencing error and the single sequence removed from the
analysis. Overall, 61 unique sequence clusters were obtained and 59 of these were considered
potential prey items (Table 4). Sequences in this dataset comprised predominantly bony fish
(86.4%) with the remainder of sequences (13.6%) obtained from eight cartilaginous taxa.
Forty-four clusters were identified to species, 11 to genus, and 1 cluster to family
(Trachichthyidae). In the last two cases, sequence clusters could not be assigned to a lower
taxonomic level because these groups matched multiple species within the same genera. For
example, within the sampling region, sequences assigned to Platycephalus sp. (flatheads)
correspond to barcodes of four potential flathead species. Three clusters remained

CHAPTER 5: Insights into seasonal prey use of the Australian sea lion
210
unidentified (unknown teleosteii), as clear sequence matches could not be obtained from
GenBank.
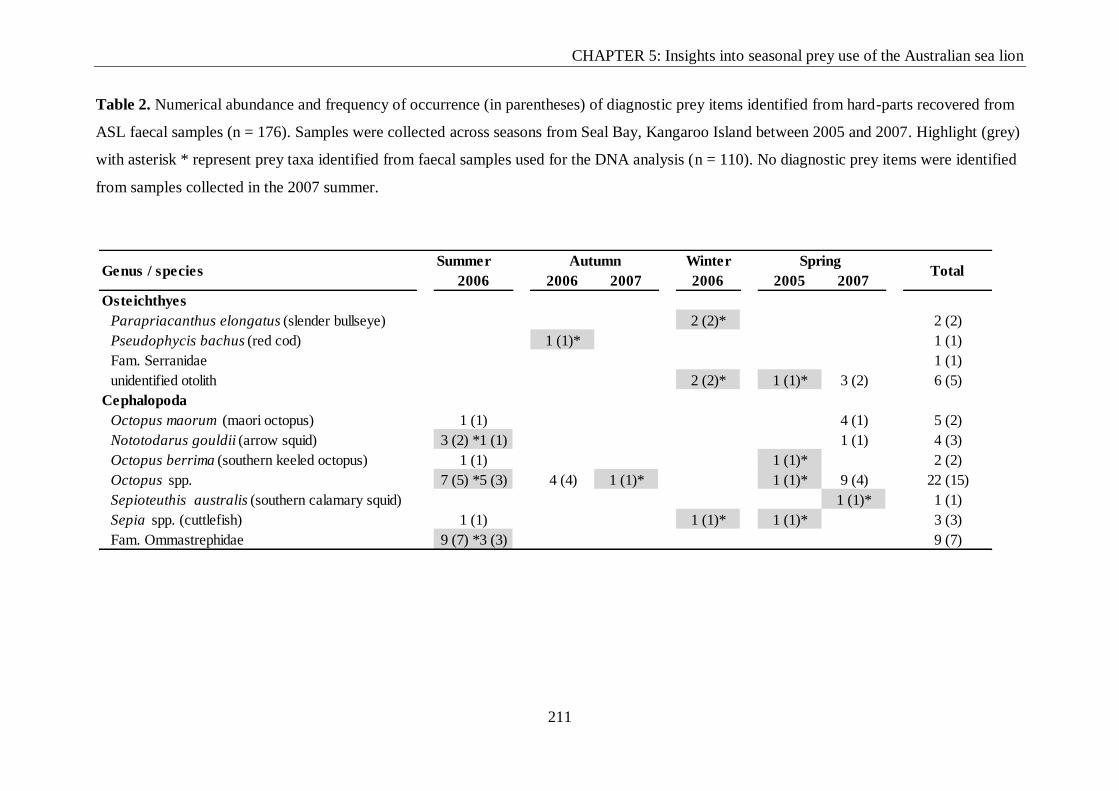
CHAPTER 5: Insights into seasonal prey use of the Australian sea lion
211
Table 2. Numerical abundance and frequency of occurrence (in parentheses) of diagnostic prey items identified from hard-parts recovered from
ASL faecal samples (n = 176). Samples were collected across seasons from Seal Bay, Kangaroo Island between 2005 and 2007. Highlight (grey)
with asterisk * represent prey taxa identified from faecal samples used for the DNA analysis (n = 110). No diagnostic prey items were identified
from samples collected in the 2007 summer.
Summer Winter
2006 2006 2007 2006 2005 2007
Osteichthyes
Parapriacanthus elongatus (slender bullseye) 2 (2)* 2 (2)
Pseudophycis bachus (red cod) 1 (1)* 1 (1)
Fam. Serranidae 1 (1)
unidentified otolith 2 (2)* 1 (1)* 3 (2) 6 (5)
Cephalopoda
Octopus maorum (maori octopus) 1 (1) 4 (1) 5 (2)
Nototodarus gouldii (arrow squid) 3 (2) *1 (1) 1 (1) 4 (3)
Octopus berrima (southern keeled octopus) 1 (1) 1 (1)* 2 (2)
Octopus spp. 7 (5) *5 (3) 4 (4) 1 (1)* 1 (1)* 9 (4) 22 (15)
Sepioteuthis australis (southern calamary squid) 1 (1)* 1 (1)
Sepia spp. (cuttlefish) 1 (1) 1 (1)* 1 (1)* 3 (3)
Fam. Ommastrephidae 9 (7) *3 (3) 9 (7)
Genus / speciesAutumn Spring
Total

CHAPTER 5: Insights into seasonal prey use of the Australian sea lion
212
Figure 2. Asymptotic curves of prey sequence diversity obtained using next-generation
sequencing for fishes (top left) and cephalopods (bottom right) from ASL faecal DNA.
Asymptotes were calculated as a function of (A) total number of sequences and (B) the
number of seasons sampled. Values are mean (solid line) ± SD (dotted line). In brackets are
the number of sequences or seasons estimated to achieve 95% asymptotic prey diversity (see
Table 3). The seasonal fish curve (B) is shown for 7 seasons (data for six seasons is presented
in Table 3). Prey DNA sequences were generated from ASL faecal samples obtained at Seal
Bay, Kangaroo Island between 2005 and 2007.

CHAPTER 5: Insights into seasonal prey use of the Australian sea lion
213
Table 3. The number of sequences and seasons analysed, and estimate of the asymptotic
number of sequences or seasons required to achieve 95% prey diversity. All data excluding
the winter analysis† indicated the mean asymptotic number of sequences or seasons sampled
was similar to, or fewer than the number sampled for both fish and cephalopod datasets. Prey
DNA sequences were generated from ASL faecal samples obtained at Seal Bay, Kangaroo
Island between 2005 and 2007.
Prey typeSequences or
seasons sampled
(n ) r2
Asymptote
(a )
Asymptotic number (95%)
sequences or seasons
required
Fish
Total prey sequences 3072 0.971 57.01 3045
Season 7 0.998 61.3 6.97
Season excl. winter†
6 0.999 61.7 6.12
Cephalopods
Total prey sequences 7019 0.991 5.98 2393
Season 7 0.998 6.07 5.38

CHAPTER 5: Insights into seasonal prey use of the Australian sea lion
214
Table 4. Taxonomic assignment and numerical abundance of prey DNA sequences obtained
from ASL faecal samples collected seasonally from Seal Bay Kangaroo Island, South
Australia. Combined seasonal data are the percentage of sequences for broad taxonomic
group (Osteichthyes and Chondrichthyes). Numbers in parentheses are samples used for
NGS. †Denotes prey taxa not previously identified in ASL diet. Winter data (n =1) not
shown.
2006
( 17)
2007
(9)
2006
(13)
2007
(16)
2005
(16)
2007
(16)
Osteichthyes
Total
Count
% Taxa
Group
Pseudophycis barbata bearded rock cod 1 0 259 3 52 58 373 12.1
Platycephalus richardsoni tiger flathead 18 14 107 2 93 27 261 8.5
Centroberyx australis † yellow-eyed nannygai 0 0 201 1 0 18 220 7.2
Notolabrus tetricus blue-throated wrasse 0 2 166 3 29 0 200 6.5
Genypterus blacodes † pink ling 12 0 171 1 6 3 193 6.3
Lepidotrigla papilio † Australian spiney gurnard 88 8 49 4 10 25 184 6.0
Thyrsites atun barracouta 9 25 95 1 5 2 137 4.5
Kathetostoma spp. † stargazer 7 101 0 0 0 4 112 3.6
Eubalichthys mosaicus † mosiac leatherjacket 16 0 63 0 0 2 81 2.6
Dinolestes lewini † long-finned pike 0 0 10 1 0 60 71 2.3
Platycephalus spp. flathead 0 1 25 0 35 0 61 2.0
Arripis georgianus tommy ruff 0 0 53 0 0 0 53 1.7
Nemadactylus macropterus jackass morwong 0 0 20 0 32 0 52 1.7
Emmelichthys nitidus nitidus † red bait 1 34 0 0 14 0 49 1.6
Parapriacanthus elongatus † slender bullseye 0 0 44 0 0 0 44 1.4
Pictilabrus laticlavius † senator wrasse 0 2 0 0 40 1 43 1.4
Polyprion oxygeneios † hapuku 0 0 0 0 38 4 42 1.4
Lepidotrigla grandis † supreme gurnard 14 26 0 0 0 0 40 1.3
Lotella rhacina bearded rock cod 1 1 19 0 0 16 37 1.2
Allomycterus pilatus † Australian burrfish 0 0 9 0 0 24 33 1.1
Gnathanacanthus goetzeei † red velvet fish 0 3 12 0 16 0 31 1.0
Caesioperca lepidoptera butterfly perch 0 0 13 0 1 11 25 0.8
Scobinichthys granulatus † rough leatherjacket 0 22 0 1 0 2 25 0.8
Aulopus purpurissatus † sargeant baker 0 0 18 6 0 0 24 0.8
Helicolenus spp. ocean perch 5 0 16 0 1 1 23 0.7
Olisthops cyanomelas † herring cale 0 0 11 0 9 1 21 0.7
Upeneichthys vlamingii red mullet 1 0 17 2 0 0 20 0.7
Arripis trutta † australian salmon 2 16 0 0 0 0 18 0.6
Mueschenia scaber velvet leatherjacket 0 0 0 0 16 0 16 0.5
Pseudophycis bachus † red cod 0 1 14 0 1 0 16 0.5
Threpterius maculosus † silver spot 0 0 0 0 15 1 16 0.5
Conger spp. † eastern conger eel 0 0 1 1 12 0 14 0.5
Upeneichthys spp. goat fish 0 2 0 0 11 0 13 0.4
Trachichthyidae 0 0 7 0 0 3 10 0.3
Neosebastes pandus † big head gurnard perch 0 8 0 0 0 2 10 0.3
Heteroscarus acroptilus † rainbow cale 2 0 1 0 6 0 9 0.3
Meuschenia hippocrepis † leatherjacket 0 0 0 0 0 9 9 0.3
Parequula melbournensis † silver belly 6 0 1 1 0 0 8 0.3
Trachurus declivis † jack mackeral 2 6 0 0 0 0 8 0.3
Scorpis lineolata † silver sweep 2 3 0 0 0 0 5 0.2
Chironemus georgianus † tassled kelp fish 0 0 0 4 0 0 4 0.1
Acanthaluteres brownii † spiney-tailed leatherjacket 0 0 0 3 0 0 3 0.1
Girella spp. † zebra fish 0 1 0 0 0 0 1 < 0.1
Cyttus australis † sun dory 0 0 1 0 0 0 1 < 0.1
Gnathophis spp. † conger eel 0 0 1 0 0 0 1 < 0.1
Maxillicosta spp. † gurnard perch 2 0 1 0 0 0 0 1 < 0.1
Parapercis allporti † barred grubfish 0 0 0 1 0 0 1 < 0.1
Pseudolabrus spp. wrasse 0 0 0 1 0 0 1 < 0.1
Sardinops sagax † Australian sardine 0 1 0 0 0 0 1 < 0.1
Unknown teleostii 1 0 0 8 0 0 0 8 0.3
Unknown teleostii 2 0 0 3 0 0 0 3 0.1
Unknown teleostii 3 0 0 0 0 22 0 22 0.7
Chondrichthyes
Myliobatis sp.† eagle ray 125 0 0 1 17 68 211 6.9
Urolophus cruciatus † banded stingaree 30 0 86 0 0 11 127 4.1
Pristiophorus nudipinnis † southern saw shark 0 0 0 2 0 34 36 1.2
Asymbolus spp. † cat shark 2 0 7 0 12 3 24 0.8
Squatina australis † Australian angel shark 10 0 0 0 0 0 10 0.3
Mustelus antarcticus † gummy shark 9 0 0 0 0 0 9 0.3
Trygonorrhina guanerius † southern fiddler ray 0 0 0 1 0 0 1 <0.1
Total 363 278 1508 40 493 390 3072 100
Count Count Count
Genus / species Common name
Summer Autumn Spring
Seasons combined

CHAPTER 5: Insights into seasonal prey use of the Australian sea lion
215
Table 4. Continued.
The most common sequences of fish species recovered in terms of sequence abundance were
bearded rock cod (Pseudophycis barbata) (Moridae) (12.1%), tiger flat head (Platycephalus
richardsoni) (Playcephalidae) (8.5%), yellow-eyed nannygai (Berycidae) (Centroberyx
australis) (7.2%), blue-throated wrasse (Notolabrus tetricus) (Labridae) (6.5%), pink ling
(Genypterus blacodes) (Ophidiidae) (6.3%), Australian spiney gurnard (Lepidotrigla papilio)
(Triglidae) (6.0%), barracouta (Thyrsites atun) (Gempylidae) (4.5%), and stargazer
(Kathetostoma sp.) (Uranscopidae) (3.6%). Sequences of the eagle ray Myliobatus sp.
(Myliobatidae) and banded stingaree (Urolophus cruciatus) (Urolophidae) were the most
common cartilaginous taxa detected (6.9% and 4.1%, respectively). Combined data from
these 10 taxa comprised 65.7% of the total fish sequences obtained. When sequence
abundances were combined and represented at taxonomic family, ten of the 39 families
obtained appeared important: Moridae (cod), Platycephalidae (flathead), Labridae (wrasse),
Triglidae (gurnard), Berycidae (red snapper), Myliobatidae (ray), Ophidiidae (ling),
Gempylidae (barracouta), Monacanthidae (leatherjacket), and Urolophidae (stingaree)
representing 74.6 % of the overall sequences obtained (Table 5). One contaminating sequence
of human DNA (Homo sapiens) and 148 sequences of ASL were recovered indicating the
blocking primer was not completely efficient at prohibiting amplification of non-target DNA.
Winter
2006
( 17)
2007
(9)
2006
(13)
2007
(16)
2006
(23)
2005
(16)
2007
(16)
Octopus maorum maori octopus 18 5 2878 106 65 7 3631 6710 95.6
Nototodarus gouldi † arrow squid 0 0 25 8 0 0 204 237 3.4
Sepia apama Australian giant cuttlefish 4 0 15 7 23 1 3 53 0.8
Sepioteuthis australis southern calamary squid 1 1 0 0 2 0 3 7 0.1
Euprymna tasmanica southern dumpling squid 0 0 0 0 0 0 5 5 0.1
Octopus berrima southern keeled octopus 1 0 1 1 0 0 0 3 < 0.1
Octopus spp. octopus 0 0 0 3 1 0 0 4 < 0.1
Total 24 6 2919 125 91 8 3846 7019 100
Genus / species Common name
Summer Autumn Spring
Seasons combined

CHAPTER 5: Insights into seasonal prey use of the Australian sea lion
216
Cephalopod primer set and prey composition
PCR amplicons of cephalopods were detected across all seasons and recovered in 92 (84%)
of samples. Of the 11,384 sequences generated 4,365 (38.3%) were truncated or contained
errors. Post screening 7,019 (61.7%) cephalopod sequences remained in the dataset (Table 4).
The cephalopod dataset comprised six sequence clusters with five taxa identified to species
and one to genus. The most common sequences comprised Maori octopus (Octopus maorum),
which contributed overall 95.6% (n = 6710 sequences) of all but seven of the cephalopod
sequences recovered (Table 4 and Table 6).The largest contributions to this sequence cluster
were predominantly obtained in spring 2005 and autumn 2006 (42% and 53% of sequences,
respectively). The number of sequences recovered for other cephalopod taxa identified was
small: arrow squid (Nototodarus gouldi) (n = 237, 3.4%) and Australian giant cuttlefish
(Sepia apama) (n = 53, 0.8%), with 4 other sequences from Octopus spp. Three were
considered rare taxa, contributing < 0.1% to the cephalopod dataset: calamary squid (S.
australis) (n = 7), southern dumpling squid (E. tasmanica) (n =5) and southern keeled
octopus (O. berrima) (n = 3).
Seasonal and yearly comparisons
For each taxonomic data set, the seasonal cumulative models indicated that the number of
sequences and the number of seasons sampled was adequate to represent at least 95% of the
potential asymptotic prey diversity (Fig. 2, Table 3). The seasonal asymptote for fish was
estimated with winter also excluded due to paucity of sequence data obtained. The resulting
model indicated greater seasonal sampling effort would have provided more information of
dietary diversity (6.12 asymptotic seasons vs. 6 seasons (actual)) (Table 3).
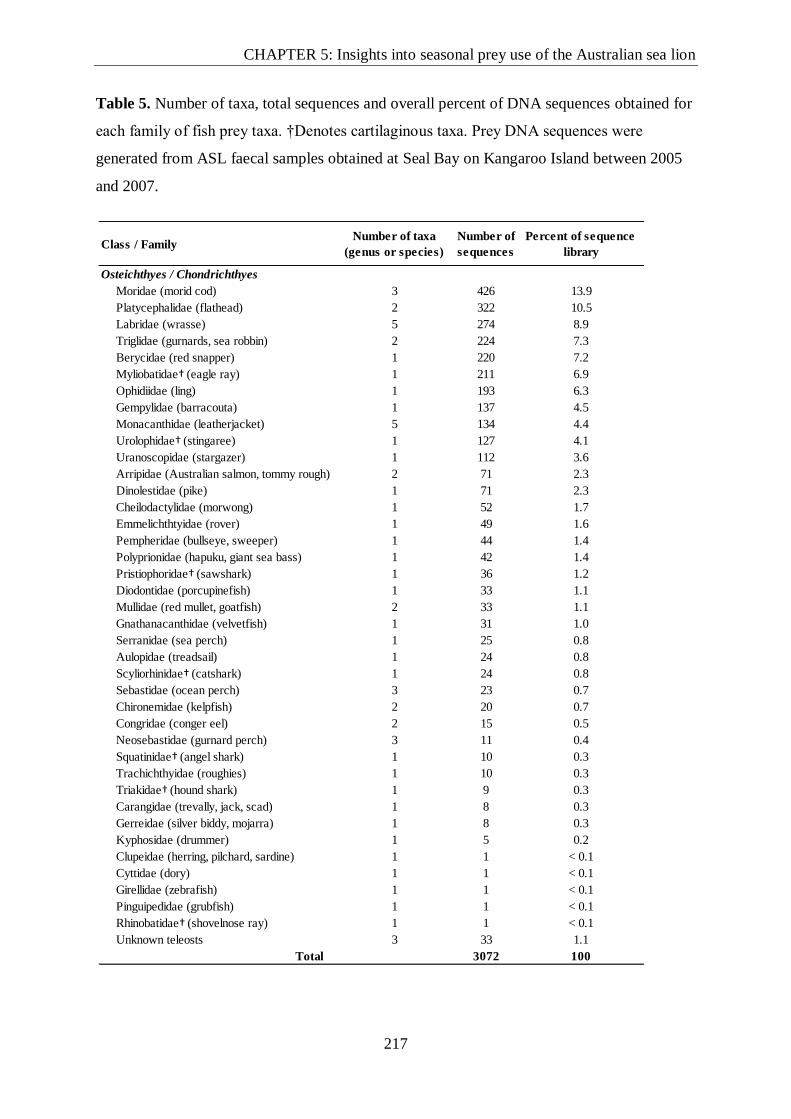
CHAPTER 5: Insights into seasonal prey use of the Australian sea lion
217
Table 5. Number of taxa, total sequences and overall percent of DNA sequences obtained for
each family of fish prey taxa. †Denotes cartilaginous taxa. Prey DNA sequences were
generated from ASL faecal samples obtained at Seal Bay on Kangaroo Island between 2005
and 2007.
Class / FamilyNumber of taxa
(genus or species)
Number of
sequences
Percent of sequence
library
Osteichthyes / Chondrichthyes
Moridae (morid cod) 3 426 13.9
Platycephalidae (flathead) 2 322 10.5
Labridae (wrasse) 5 274 8.9
Triglidae (gurnards, sea robbin) 2 224 7.3
Berycidae (red snapper) 1 220 7.2
Myliobatidae† (eagle ray) 1 211 6.9
Ophidiidae (ling) 1 193 6.3
Gempylidae (barracouta) 1 137 4.5
Monacanthidae (leatherjacket) 5 134 4.4
Urolophidae† (stingaree) 1 127 4.1
Uranoscopidae (stargazer) 1 112 3.6
Arripidae (Australian salmon, tommy rough) 2 71 2.3
Dinolestidae (pike) 1 71 2.3
Cheilodactylidae (morwong) 1 52 1.7
Emmelichthtyidae (rover) 1 49 1.6
Pempheridae (bullseye, sweeper) 1 44 1.4
Polyprionidae (hapuku, giant sea bass) 1 42 1.4
Pristiophoridae† (sawshark) 1 36 1.2
Diodontidae (porcupinefish) 1 33 1.1
Mullidae (red mullet, goatfish) 2 33 1.1
Gnathanacanthidae (velvetfish) 1 31 1.0
Serranidae (sea perch) 1 25 0.8
Aulopidae (treadsail) 1 24 0.8
Scyliorhinidae† (catshark) 1 24 0.8
Sebastidae (ocean perch) 3 23 0.7
Chironemidae (kelpfish) 2 20 0.7
Congridae (conger eel) 2 15 0.5
Neosebastidae (gurnard perch) 3 11 0.4
Squatinidae† (angel shark) 1 10 0.3
Trachichthyidae (roughies) 1 10 0.3
Triakidae† (hound shark) 1 9 0.3
Carangidae (trevally, jack, scad) 1 8 0.3
Gerreidae (silver biddy, mojarra) 1 8 0.3
Kyphosidae (drummer) 1 5 0.2
Clupeidae (herring, pilchard, sardine) 1 1 < 0.1
Cyttidae (dory) 1 1 < 0.1
Girellidae (zebrafish) 1 1 < 0.1
Pinguipedidae (grubfish) 1 1 < 0.1
Rhinobatidae† (shovelnose ray) 1 1 < 0.1
Unknown teleosts 3 33 1.1
Total 3072 100
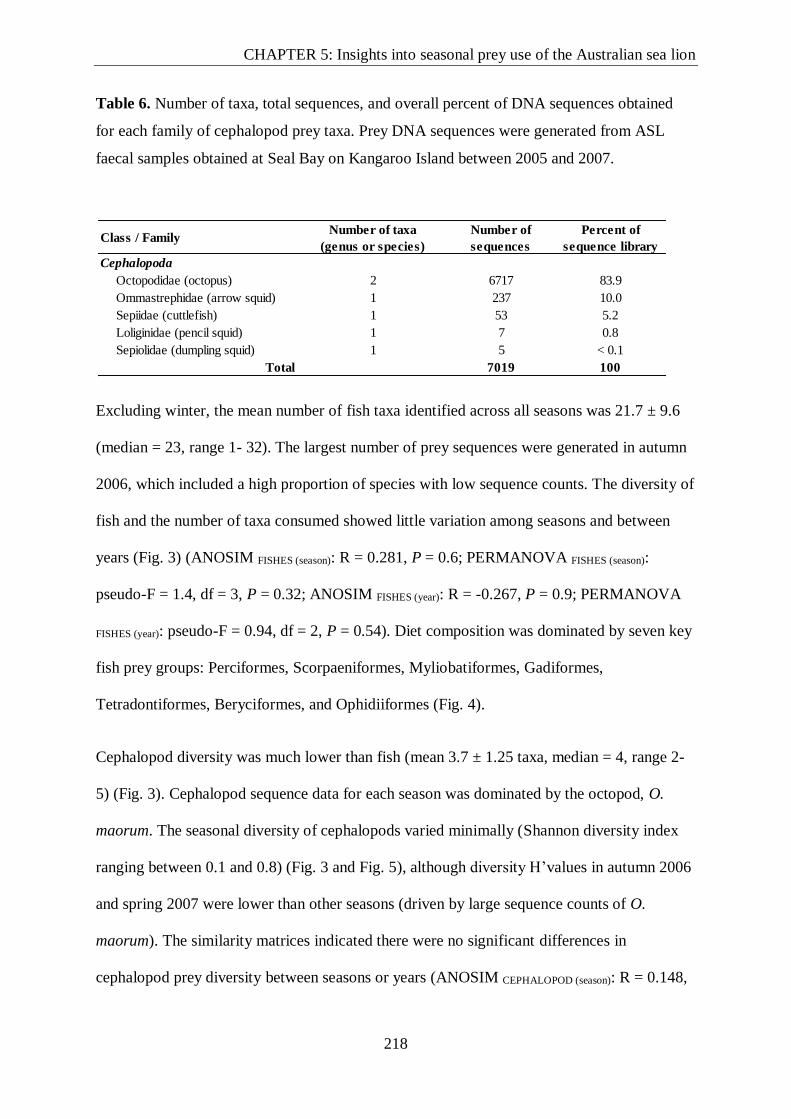
CHAPTER 5: Insights into seasonal prey use of the Australian sea lion
218
Table 6. Number of taxa, total sequences, and overall percent of DNA sequences obtained
for each family of cephalopod prey taxa. Prey DNA sequences were generated from ASL
faecal samples obtained at Seal Bay on Kangaroo Island between 2005 and 2007.
Excluding winter, the mean number of fish taxa identified across all seasons was 21.7 ± 9.6
(median = 23, range 1- 32). The largest number of prey sequences were generated in autumn
2006, which included a high proportion of species with low sequence counts. The diversity of
fish and the number of taxa consumed showed little variation among seasons and between
years (Fig. 3) (ANOSIM FISHES (season): R = 0.281, P = 0.6; PERMANOVA FISHES (season):
pseudo-F = 1.4, df = 3, P = 0.32; ANOSIM FISHES (year): R = -0.267, P = 0.9; PERMANOVA
FISHES (year): pseudo-F = 0.94, df = 2, P = 0.54). Diet composition was dominated by seven key
fish prey groups: Perciformes, Scorpaeniformes, Myliobatiformes, Gadiformes,
Tetradontiformes, Beryciformes, and Ophidiiformes (Fig. 4).
Cephalopod diversity was much lower than fish (mean 3.7 ± 1.25 taxa, median = 4, range 2-
5) (Fig. 3). Cephalopod sequence data for each season was dominated by the octopod, O.
maorum. The seasonal diversity of cephalopods varied minimally (Shannon diversity index
ranging between 0.1 and 0.8) (Fig. 3 and Fig. 5), although diversity H’values in autumn 2006
and spring 2007 were lower than other seasons (driven by large sequence counts of O.
maorum). The similarity matrices indicated there were no significant differences in
cephalopod prey diversity between seasons or years (ANOSIM CEPHALOPOD (season): R = 0.148,
Class / FamilyNumber of taxa
(genus or species)
Number of
sequences
Percent of
sequence library
Cephalopoda
Octopodidae (octopus) 2 6717 83.9
Ommastrephidae (arrow squid) 1 237 10.0
Sepiidae (cuttlefish) 1 53 5.2
Loliginidae (pencil squid) 1 7 0.8
Sepiolidae (dumpling squid) 1 5 < 0.1
Total 7019 100

CHAPTER 5: Insights into seasonal prey use of the Australian sea lion
219
P = 0.33; PERMANOVA CEPHALOPOD (season): pseudo-F = 0.746, df = 3, P = 0.68; ANOSIM
CEPHALOPOD (year): R = 0.01, P = 0.47; PERMANOVA CEPHALOPOD (year): pseudo-F = 0.388, df =
2, P = 0.80).
Figure 3. Number of taxa (upper) and Shannon diversity index (lower) of fish and
cephalopod prey identified from DNA sequences and hard parts recovered from ASL faeces
collected across seasons at Seal Bay, Kangaroo Island between 2005 and 2007. Error bars are
95% confidence intervals.

CHAPTER 5: Insights into seasonal prey use of the Australian sea lion
220
Figure 4. Cumulative percent (%) of bony fish and cartilaginous fish prey sequences by
taxonomic order for each season, and for the total number of sequences recovered (combined
seasons). Data were standardised within seasons and across seasons and years. * Winter data
excluded from the analysis. Prey DNA sequences were generated using ASL faecal samples
obtained at Seal Bay, Kangaroo Island between 2005 and 2007.

CHAPTER 5: Insights into seasonal prey use of the Australian sea lion
221
Figure 5. Cumulative percent (%) of cephalopod prey sequences by taxonomic order for each
season, and for the total number of sequences recovered (combined seasons). Data were
standardised within seasons and across seasons and years. Prey DNA sequences were
generated from ASL faecal samples obtained at Seal Bay, Kangaroo Island between 2005 and
2007.
DISCUSSION
The analysis of faecal DNA is now widely used to determine diet across a range of terrestrial
and marine organisms. More recently, next-generation high-throughput DNA sequencers
have improved the depth of sequence production, providing greater resolution to individual
samples and better information on system dynamics (reviewed in Shokralla et al. 2012). In
particular, NGS technology is well suited to study the diets of seals because, as high trophic-
level predators, their diets often comprise a wide range of species that can be readily

CHAPTER 5: Insights into seasonal prey use of the Australian sea lion
222
identified by amplifying and sequencing the breadth of available DNA (Deagle et al. 2009;
Jarman et al. 2013).
In the present study, PCR amplification followed by NGS enabled greater depth of
information on the prey consumed by ASL at one of the key breeding sites, Seal Bay than in
previous studies. Sequence and hard part data indicated sea lions at Seal Bay fed on a broad
range of benthic and demersal fish and cephalopod taxa, which over seasons appeared to
show limited variation in prey diversity. Over the study period, 55 different fish and six
cephalopod taxa were identified. When differentiated by taxonomic family, they revealed a
wide diversity of prey that comprised 32 teleosts, six cartilaginous taxa, and five families of
cephalopod. Similar to previous diet studies, hard parts of unidentified crustaceans were
detected in this study (McIntosh et al. 2006; Fragnito, 2013; Chapter 2) but were not assessed
using the DNA-PCR based method. Because ASL is a benthic forager (Costa and Gales 2003;
Fowler et al. 2006, 2007; McIntosh et al. 2006; Goldsworthy et al. 2009a, b; Fragnito, 2013),
benthic crustaceans (e.g. crabs, crayfish and prawns) are likely to be an important component
of their diet and should be included in future DNA-based diet studies. Nevertheless, this
study contributes 37 new taxa to the overall range of prey identified for ASL, of which 33 are
novel to Seal Bay (Walker and Ling 1981; Gales and Cheal 1992; Ling, 1992; McIntosh et al.
2006; Gibbs, 2008; Peters et al. 2014a).
Study limitations
Reconstructing diet using amplified faecal DNA presents inherent biases that can limit prey
identification and estimates of diversity. Similar to hard parts, DNA of different species
degrades differentially which affects the likelihood of prey detection for different taxa.
Detection is also dependent on the type or quality of prey tissue consumed (Dalziel et al.
2005; Prokopowich et al. 2011). Furthermore, because faeces consist largely of degraded

CHAPTER 5: Insights into seasonal prey use of the Australian sea lion
223
template DNA (Kohn and Wayne, 1997), sources of bias can stem from type II errors (failing
to detect prey DNA), particularly if the predicted size of the target amplicon exceeds that of
the available template (Deagle et al. 2006; Marshall et al. 2010). This is an important
consideration for faecal-based DNA diet studies because DNA of taxa that is damaged and
fragmented may go undetected and bias importance indices toward those species with intact
DNA (Tollit et al. 1997; Casper et al. 2007b; Dunn et al. 2010). Degradation of faecal DNA
also increases post evacuation (e.g. Deagle et al. 2005a), which, even with samples
considered fresh (collected within ~12 hours of deposition), DNA quality and quantity may
be compromised limiting detection of some prey. In this study, conserved PCR primers with
short variable target regions (~100 bp) were used to amplify prey and improve prey detection
if the sample DNA was degraded. Previous DNA-based diet studies on ASL, Australian fur
seals (Arctocephalus pusillus doriferus) and the New Zealand fur seal (Arctocephalus
forsteri) indicate short markers are effective in amplifying a range of taxa from degraded
faecal template DNA and span a wide enough region to differentiate species-level prey
(Deagle et al. 2009; Casper et al. 2007a, b; Peters et al. 2014a, b).
Pooling PCR amplicons from multiple samples prior to NGS did not allow sequencing of
individual PCR products and improved the capacity to sample over a greater temporal scale.
However, this approach has the potential to omit a range of rarer taxa that could be
components of individual ASL diets. To reduce this source of sequencing error, all PCR
products were standardised by molarity prior to amplicon pooling to reduce the potential of
amplicon swamping. This method can eliminate contributions of non-target DNA (e.g.,
Deagle et al. 2010), but cannot account for variability in copy number among species and
therefore does not ensure amplicons of all prey will be equally presented in the final sequence
library (e.g. Pochon et al. 2013). Given these limitations, the results likely portray a
representation of a range of prey taxa consumed by ASL at Seal Bay; however, as some taxa

CHAPTER 5: Insights into seasonal prey use of the Australian sea lion
224
may have gone undetected, future studies should consider sequencing individual samples to
improve the potential to increase information on diet diversity.
DNA analysis
Using PCR followed by NGS improved the potential to increase the information on the range
of prey taxa consumed that may not have been achievable using the clone-sequencing
approach trialled in the only other DNA diet study on ASL (Peters et al. 2014a). Although
comparisons between these two studies indicated a greater diversity of prey was achieved
using NGS, a number of species that were detected by previous hard part studies at Seal Bay
were absent from both, implying there are a number of biases that may limit the detection of
prey by either DNA method. Early NGS platforms, such as the Roche 454, have higher
sequence error rates than more recent Illumina platforms (e.g., Luo et al. 2012). The present
study used the Roche platform, which may have resulted in the disparity in sequences
produced between seasons and limited the calculation of asymptotic diversity to analyses
with overall seasonal prey. Sequence counts are commonly used as a proxy for species
abundance (e.g. Willerslev et al. 2014). It is unclear when sampling wild populations,
whether these sequence counts represent single or multiple individuals, or taxa with more
intact DNA. Furthermore, a number of studies have found multiple sources of sequencing
bias using NGS that can influence prey sequence counts (Deagle et al. 2013; Thomas et al.
2014). Using recent NGS platforms will likely improve information on diet of ASL; however,
the costs to sample multiple sites at greater temporal scales may limit its usefulness.
Prey diversity at Seal Bay
Strong foraging site fidelity revealed by satellite tracking and isotopic data suggest ASL
exploit familiar habitats in search of local prey (Costa and Gales 2003; McIntosh et al. 2006;
Fowler et al. 2006, 2007; Goldsworthy et al. 2009a,b; Lowther et al. 2011, 2013). At Seal

CHAPTER 5: Insights into seasonal prey use of the Australian sea lion
225
Bay, foraging by adults, juveniles and older pups (~14 mo) is concentrated in coastal and on-
shelf waters adjacent to the colony, where individuals dive to depths of ~ 40 – 80 m (Costa
and Gales, 2003; Fowler et al. 2006, 2007; Lowther et al. 2013). Benthic habitats in the Seal
Bay region comprise a heterogeneous mix of rocky reef and sandy substrate (Edyvane, 1999;
Bryars, 2003), thus, colony-level diet should reflect those species found within the adjoining
foraging region. Our results are consistent with benthic foraging, as the majority of taxa
identified were demersal species that are commonly associated with macro-algae reef and
sand complexes that intermittently occur from the intertidal zone to the shelf slope (Shepherd
and Edgar, 2013). Many of the taxa identified are located at a range of depths on the shelf out
to the shelf slope, which likely reflects different sex and age groups (and depth profiles) of
the individual samples collected, although these were not identified here. Interestingly,
hapuku (Polyprion oxygeneios), yellow-eyed nannygai (C. australis) and ling (G. blacodes)
are deepwater species (~90-556 m) that are commonly found closer to the shelf break
(Gomon et al. 2008). For ASL to obtain prey in deeper water requires increased physiological
capabilities such as increased body mass and oxygen storage, which nominally improve in
pinnipeds with age (Costa, 1993). These taxa (e.g. P. oxygeneios and C. australis) are
therefore, more likely preyed on by adult males or females, which can attain greater foraging
depths than juveniles and pups (Fowler et al. 2006, 2007; Lowther et al. 2013). In the benthic
foraging New Zealand sea lion (P. hookeri), foraging is partitioned by dive ability (e.g. depth,
duration, bottom time), whereby bottom depth and habitat accessibility increases with size
and age (Leung et al. 2014). Young, small male juveniles (2-3 years) for example, are
restricted to foraging in the shallow benthic interface ≤100 m deep until the age of five, after
which adult dive depths ≥ 250 m and access to deeper foraging grounds is achieved.
Ontogenetic differences in diving ability and diet have also been reported in other pinniped
species (e.g. elephant seal, Antarctic fur seal, and Galápagos fur seal) (Horning and
CHAPTER 5: Insights into seasonal prey use of the Australian sea lion
226
Trillmich, 1997; Le Bouf et al. 1996; McCafferty et al. 1998). Although individual diet and
foraging behaviours were not examined here, the prey items identified tend to support the
extent of foraging and dive depths observed in ASL for Seal Bay and broader southern
Kangaroo Island region (Costa and Gales, 2003; Fowler et al. 2006, 2007; Lowther et al.
2013).
The fact that reef habitats are important aggregation sites for demersal and early life stages of
some pelagic species could explain why the diet of ASL at Seal Bay comprised a consistent
and higher proportion of reef species throughout the year. Overall, reef fish belonging to
Perciformes (sea perch), Scorpaeniformes (scorpion fish), Gadiformes (cods),
Myliobatiformes (rays), Tetradontiformes (leatherjackets), Ophiidiformes (ling),
Beryciformes (snappers) accounted for ~75% of fish sequences recovered, and similarly, O.
maorum, a common benthic reef octopus, appeared the key cephalopod prey. Aspects of reef
topography, namely the density of refuges (e.g. crevices, overhangs and holes) and relief are
common features of reef patches found on the shelf (Shepherd and Edgar, 2013), which are
known to support a high density and abundance of species (Fréon and Dagorn, 2000). Some
of the more common fish taxa identified, such as wrasse, gurnards, scorpion fish and
leatherjackets, also exhibit strong site-attached fidelity to reef patches and have small home
ranges (Barnett, 1995; Shepherd and Edgar, 2013; Baker et al. 2007, 2011). Some species
including leatherjacket and wrasse, which were reasonably common prey groups, also
reproduce at localised scales with some laying demersal eggs (Barnett, 1995; Baker et al.
2008). Such life history characteristics may increase the vulnerability of such taxa to
continual predation by ASL.
This study further revealed a small, and perhaps an important range of cartilaginous taxa that
have been rarely characterised as dietary components of ASL (McIntosh et al. 2006; Gales
CHAPTER 5: Insights into seasonal prey use of the Australian sea lion
227
and Cheal, 1992; Baylis et al. 2009; Peters et al. 2014a). Among these, the eagle ray
(Myliobatis sp.) and banded stingaree (U. cruciatus), and to a lesser extent southern sawshark
(Pristiophorus nudipinnis) emerged as potentially important prey. These taxa often feed in
sandy substrate among low profile rocky reefs, implying ASL probably utilise such habitats
to acquire these prey. Given very little is known of the cartilaginous diet of ASL, it is unclear
if individuals specifically target these cartilaginous fish, or whether these species are
common to the habitats where sea lions forage at Seal Bay. Rays such as M. australis are also
benthic prey of the Australian fur seal (A. doriferus) (Deagle et al. 2009) and are reasonably
common in temperate waters of South Australia (Gomon et al. 2008; Last and Stevens,
2009). Such taxa are largely suctorial bottom feeders that grow to 120cm with a short dorsal
tail barb (Parry et al. 1995; Last and Stevens, 2009), which may increase its susceptibility to
predation by benthic feeders such as ASL.
Finally, the benthic prey resources used by ASL at Seal Bay typically comprised low-energy
taxa (Eder and Lewis, 2005) that appeared consistently available year-round. Occurrences of
higher-energy bentho-pelagic species, such as redbait (Emmelichthys nitidus) and barracouta
(T. atun) occurred in the diet possibly implying they are opportunistic prey obtained during
the ascent or descent phases of diving. Redbait and barracouta are important seasonal prey of
the Australian (A. doriferus) and the long-nosed fur seal (A. forsteri) that also forage in the
shelf waters near Seal Bay (Page et al. 2005). Although it is not possible to determine fish
size or number consumed by ASL, the low abundance of red bait and barracouta sequences
relative to other taxa in the current study could suggest some partitioning of resources among
these predators. ASL may have also developed a foraging strategy that favours long-term
resource reliability over high energetic return. Long-term benthic foraging on familiar, lower-
quality prey may confer the ecological benefit of lowering nutritional risk (Bradshaw et al.
2004; Lowther et al. 2011). For lactating ASL, such as strategy could be associated with the

CHAPTER 5: Insights into seasonal prey use of the Australian sea lion
228
prolonged gestation and investment into emergent and developing offspring. This contrasts
with the reproductive strategy employed by the long-nosed and Australian fur seal, which
reproduce during seasonally productive periods (e.g. coastal upwelling) that coincide with
predictable and abundant, energy-rich prey (Baylis et al. 2008a, b; Gales et al.1994; Page et
al. 2005; Deagle et al. 2009).
Conclusion and future directions
Determining the range of prey utilised by large marine predators is challenging because many
forage in cryptic environments and target elusive prey. For pinnipeds, analyses using prey
hard-parts and DNA have provided a valuable non-invasive means to obtain dietary
information from faeces and regurgitates. NGS technology has greatly improved the capacity
to differentiate a wider range of prey than previous methods, which has broadened
information on how prey resources are utilised by predators in marine ecosystems.
In the current study, the amplification of prey DNA followed by NGS provided a new method
to elucidate prey consumed by ASL at Seal Bay throughout the year. The colony-level results
indicated a diet comprising mostly benthic species which, given the wide, yet repeated range
of prey detected over seasons, could imply a localised dependence on these prey taxa. The
high natal and foraging site fidelity of ASL, and that of some of the prey identified here,
suggests conservation management should focus on strategies that protect local foraging
habitats, particularly those adjacent to ASL colonies where many individuals forage. Future
studies of ASL diet should aim to improve the spatial and temporal information of diet at
different colonies, as individuals are likely to consume a range of prey that differs from Seal
Bay. This could entail a similar DNA-based approach, and should include an assessment of
crustaceans, to determine the full complement of prey used by ASL.

CHAPTER 5: Insights into seasonal prey use of the Australian sea lion
229
ACKNOWLEDGEMENTS
This study was supported through the Australian Government National Heritage Trust (NHT)
grants scheme, Nature Foundation SA, and the Wildlife Conservation Fund. I thank the South
Australian Research and Development Institute (SARDI) Molecular Diagnostics group for
laboratory support, in particular Dr. A. McKay, T. Mammone, Dr. Herdina, Ina Dumitrescu
and all staff. I would like to thank Australian Antarctic Division for their assistance with this
project. I thank the South Australian Department of Environment, Water and Natural
Resources (DEWNR), particularly B. Haddrill and staff for access and permission to conduct
ASL research at Seal Bay. Thanks to SeaLink and Mountain Designs for their logistical
support. I thank Dr. P. Shaughnessy, Dr. A. Baylis, Dr. J. McKenzie and Dr. B. Page for
comments on this manuscript. I thank the volunteers who assisted with fieldwork: C. Fulton,
C. Kennedy, D. Peters, A. Emeric and R. McIntosh. This project was funded by grants
prepared and submitted by K. Peters and S. Goldsworthy. K. Peters was the recipient of an
Adelaide University postgraduate award. This research project was conducted under the
DEWNR ethics permit A24684 6 and Adelaide University animal ethics permit S80-2004.
SDG was supported by Marine Innovation South Australia (MISA), an initiative of the South
Australian Government.
REFERENCES
Alava, J. J., and Salazar, S. (2006). Status and conservation of otariids in Ecuador and the
Galapagos Islands. Pages 495-519 in ‘Sea Lions of the World’ (A. W. Trites, D.
P. Atkinson, D. P. DeMaster, L. W. Fritz, T. S. Gelatt, L. D. Rea and W. M.
Wynne, eds). Alaska Sea Grant, Fairbanks, AK.
Altschul, S. F., Gish, W., Miller,W., Myers, E. W., and Lipman, D. J. (1990). Basic local
alignment search tool. Journal of Molecular Biology, 215, 403–410.

CHAPTER 5: Insights into seasonal prey use of the Australian sea lion
230
Baker, J. (2007). Marine and estuarine fishes of conservation concern in the Adelaide and
Mount Lofty Ranges Natural Resources Management region. Prepared by Janine L.
Baker for the Adelaide and Mount Lofty Ranges Natural Resources Management
Board, South Australia.
Baker, J. L. (2011) Reef Fishes of Conservation Concern in South Australia -
A Field Guide. Booklet produced with support from the Adelaide and Mt Lofty
Ranges Natural Resources Management Board, South Australia.
Barnett, N. S. (1995). Short- and long-term movement patterns of six temperate reef fishes
(Families Labridae and Monacanthidae). Marine and Freshwater Research, 46, 853–
60.
Baylis, A. M. M., Page B., and Goldsworthy, S. D. (2008a). Colony-specific foraging areas
of lactating New Zealand fur seals. Marine Ecology Progress Series, 361, 279–290.
Baylis, A. M. M., Page, B., and Goldsworthy, S. D. (2008b). Effect of seasonal changes in
upwelling activity on the foraging locations of a wide-ranging central-place forager,
the New Zealand fur seal. Canadian Journal of Zoology, 86, 774–789.
Baylis, A. M. M., Hamer, D. J., and Nichols, P. D. (2009). Assessing the use of milk fatty
acids to infer the diet of the Australian sea lion (Neophoca cinerea). Wildlife Research
36, 169–176.
Blankenship, L. E., and Yayanos, A. A. (2005). Universal primers and PCR of gut contents to
study marine invertebrate diets. Molecular Ecology, 14, 891–899.
Block, B. A., Jonsen, I. D., Jorgensen, S. J., Winship, A. J., Shaffer, S. A., Bograd, S. J.,
Hazen, E. L., Foley, D. G., Breed, G. A., Harrison, A. L., Ganong, J. E., Swithen-

CHAPTER 5: Insights into seasonal prey use of the Australian sea lion
231
bank, A., Castleton, M., Dewar, H., Mate, B. R., Shillinger, G. L., Schaefer, K. M.
Benson, S. R., Weise, M. J., Henry, R. W. and Costa, D. P. (2011). Tracking apex
marine predator movements in a dynamic ocean. Nature, 475, 86–90.
Bluhm, B. A., and Gradinger, R. (2008). Regional variability in food availability for arctic
marine mammals. Ecological Applications, 18, 77–96.
Bowles, E., Schulte, P. M., Tollit, D. J., Deagle, B. E., and Trites, A.W. (2011). Proportion of
prey consumed can be determined from faecal DNA using real-time PCR. Molecular
Ecology Resources, 11, 530–540.
Boyd, I. L. (2000). State-dependent fertility in pinnipeds: contrasting capital and income
breeders. Functional Ecology, 14, 623–630.
Boyd, I. L., Croxall, J. P., Lunn, N. J., and Reid, K. (1995). Population demography of
Antarctic fur seals: the costs of reproduction and implications for life-histories.
Journal of Animal Ecology, 64, 505–518.
Bradshaw, C. J. A., Hindell, M. A., Sumner, M. D., and Michael, K.J. (2004). Loyalty pays:
life-history consequences of fidelity to marine foraging regions by elephant seals.
Animal Behaviour, 68, 1349 – 1360.
Braley, M., Goldsworthy, S. D., Page, B., Steer, M., and Austin, J. J. (2009). Assessing
morphological and DNA-based diet analysis techniques in a generalist predator, the
arrow squid, Nototodarus gouldi. Molecular Ecology Resources, 10, 466–474.
Brown, D. S., Jarman, S. N., and Symondson, W. O. C. (2012). Pyrosequencing of prey DNA
in reptile faeces: analysis of earthworm consumption by slow worms. Molecular
Ecology Resources, 12, 259–266.

CHAPTER 5: Insights into seasonal prey use of the Australian sea lion
232
Bryars, S. (2003). An Inventory of Important Coastal Fisheries Habitats in South Australia.
Fish Habitat Program. Primary Industries and Resources South Australia.
Buee, M., Reich, M., Murat, C., Morin, E., Nilsson, R.H., Uroz, S., and Martin, F. (2009).
454 pyrosequencing analyses of forest soils reveal an unexpectedly high fungal
diversity. New Phytologist, 184, 449–456. doi: 10.1111/ j.1469-8137.2009.03003.x
Campbell, R. A., Gales, N. J., Lento, G. M., and Baker, C. S. (2008). Islands in the sea:
extreme female natal site fidelity in the Australian sea lion, Neophoca cinerea.
Biology Letters, 4, 139–142.
Casper, R. M., Jarman, S. N., Gales, N. J., and Hindell, M. A. (2007a). Combining DNA and
morphological analyses of faecal samples improves insight into trophic interactions: a
case study using a generalist predator. Marine Biology, 152, 815–825.
Casper, R. M., Jarman, S. N., Deagle, B. E., Gales, N. J., and Hindell, M. A. (2007b).
Detecting prey from DNA in predator scats: A comparison with morphological
analysis, using Arctocephalus seals fed a known diet. Journal of Experimental Marine
Biology and Ecology, 347, 144–154.
Castinel, A., Duignan, P. J., and Pomroy, W. E. (2007). Neonatal mortality in New Zealand
sea lions (Phocarctos hookeri) at Sandy Bay, Enderby Island, Auckland Islands from
1998 to 2005. Journal of Wildlife Diseases 43, 461–474.
Chernick, M. R. (1999). Boootstrap methods: A practioner’s guide. John Wiley and Sons
Inc., New York, NY.
Childerhouse, S., Dix, B., and Gales, N. (2001). Diet of New Zealand sea lions (Phocarctos
hookeri) at the Auckland Islands. Wildlife Research, 28, 291–298.

CHAPTER 5: Insights into seasonal prey use of the Australian sea lion
233
Chilvers, B. L. (2008). New Zealand sea lions Phocarctos hookeri and squid trawl fisheries:
bycatch problems and management options. Endangered Species Research, 5, 193–
204.
Clarke, K. R., and Warwick, R. M. (1993). Change in marine communities; an approach to
statistical analysis and interpretation. 2nd Edition. PRIMER-E: Plymouth, UK.
Costa, D. P. (1993). The relationship between reproductive and foraging energetics and the
evolution of the Pinnipedia. Pages 293–314 in I. L. Boyd, ed. Marine mammals:
Advances in behavioural and population biology. Volume 66. Symposium of the
Zoological Society of London. Oxford University Press, Oxford, UK.
Costa, D. P., and Gales, N. J. (2003). Energetics of a benthic diver: Seasonal foraging
ecology of the Australian sea lion, Neophoca cinerea. Ecological Monographs, 73,
27–43.
Dalziel, A. C., Moore, S. E., and Moves, C. D. (2005). Mitochondrial enzyme content in the
muscles of high-performance fish: evolution and variation among fiber types.
American Journal of Physiology, 288, 163–172.
Deagle, B. E., Jarman, S. N., Pemberton, D., and Gales, N. J. (2005a). Genetic screening of
prey in the gut contents from a giant squid (Architeuthis sp). Journal of Heredity, 96,
417–423.
Deagle, B. E., Tollit, D. J., Jarman, S. N., Hindell, M. A., Trites, A. W., and Gales, N. J.
(2005b). Molecular scatology as a tool to study diet: analysis of prey DNA in scats
from captive Steller sea lions. Molecular Ecology, 14, 1831–1842.

CHAPTER 5: Insights into seasonal prey use of the Australian sea lion
234
Deagle, B. E., Eveson, J. P., and Jarman, S. N. (2006). Quantification of damage in DNA
recovered from highly degraded samples - a case study on DNA in faeces. Frontiers
in Zoology, 3, 1–10.
Deagle, B. E., and Tollit, D. J. (2007). Quantitative analysis of prey DNA in pinniped faeces:
potential to estimate diet composition? Conservation Genetics, 8, 743–747.
Deagle, B. E., Kirkwood, R., and Jarman, S. N. (2009). Analysis of Australian fur seal diet by
pyrosequencing prey DNA in faeces. Molecular Ecology, 18, 2022–2038.
Deagle, B. E., Chiaradia, A., McInnes, J., and Jarman, S. N. (2010). Pyrosequencing faecal
DNA to determine diet of little penguins: is what goes in what comes out?
Conservation Genetics, 11, 2039–2048.
Deagle, B. E., Thomas, A. C., Shaffer, A. K., Trites, A.W., and Jarman, S. N. (2013).
Quantifying sequence proportions in a DNA-based diet study using Ion Torrent
amplicon sequencing: which counts count? Molecular Ecology Resources, 13,620–
633.
Dunn, M. R., Szabo, A., McVeagh, M. S., and Smith, P. J. (2010). The diet of deepwater
sharks and the benefits of using DNA identification of prey. Deep Sea Research Part
I: Oceanographic Research Papers, 57, 923–930.
Eder, E. B., and Lewis, M. N. (2005). Proximate composition and energetic value of demersal
and pelagic prey species from the SW Atlantic Ocean. Marine Ecology Progress
Series, 291, 43–52.
Edgar, G. J. (2001). Australian marine life: The plants and animals of temperate waters. Reed
New Holland Pty. Ltd., Sydney, Australia.

CHAPTER 5: Insights into seasonal prey use of the Australian sea lion
235
Edyvane, K. S. (1999). Conserving biodiversity in South Australia II. Identification of areas
of high conservation value in South Australia. SARDI (ed) Book 39. Department of
Primary Industries, Adelaide, South Australia.
Estes, J. A., Doak, D. F., Springer, A. M. and Williams, T. M. (2009). Causes and
consequences of marine mammal population declines in southwest Alaska: a food-
web perspective. Philosophical Transactions of the Royal Society of London B:
Biological Sciences, 364, 1647–1658.
Farrell, L. E., Roman, J., and Sunquist, M. E. (2000). Dietary separation of sympatric
carnivores identified by molecular analysis of scats. Molecular Ecology, 9, 1583–
1590.
Fea, N. I., Harcourt, R., and Lalas, C. (1999). Seasonal variation in the diet of New Zealand
fur seals (Arctocephalus forsteri) at Otago Peninsula, New Zealand. Wildlife
Research, 26, 147–160.
Fowler, S. L., Costa, D. P., Arnould, J. P. Y., Gales, N. J., and Kuhn, C. E. (2006). Ontogeny
of diving behavior in the Australian sea lion: Trials of adolescence in a late bloomer.
Journal of Animal Ecology, 72, 358–367.
Fowler, S. L., Costa, D. P., and Arnould, J. P. Y. (2007). Ontogeny of movements and
foraging ranges in the Australian sea lion. Marine Mammal Science, 23, 598–614.
Fragnito, K. (2013). Feeding behaviour and habitat utilisation of adult female Australian sea
lions (Neophoca cinerea) using animal-borne video cameras. BSc Honours thesis, The
University of Adelaide, South Australia.
Fréon, P., and Dagorn, L. (2000). Review of fish associative behaviour: toward a

CHAPTER 5: Insights into seasonal prey use of the Australian sea lion
236
generalisation of the meeting point hypothesis. Reviews in Fish Biology and Fisheries,
10, 183–207.
Furlani, D., Gales, R., and Pemberton, D. (2007). Otoliths of common Australian temperate
fish: a photographic guide. CSIRO Publishing, Collingwood, Vic.
Gales, N. J., and Cheal, A. J. (1992). Estimating diet composition of the Australian sea lion
(Neophoca cinerea) from scat analysis: an unreliable technique. Wildlife Research,
19, 447–456.
Gales, R., and Pemberton, D. (1994). Diet of the Australian fur seal in Tasmania. Journal of
Marine and Freshwater Research, 45, 653–664.
Gales, N. J., Shaughnessy, P. D., and Dennis, T. E. (1994). Distribution, abundance, and
breeding cycle of the Australian sea lion Neophoca cinerea (Mammalia: Pinnipedia).
Journal of Zoology, 234, 353–370.
Gibbs, S. E. (2008). Retention and condition of cephalopod beaks in the stomach of an
Australian sea lion (Neophoca cinerea). Australian Mammalogy, 29, 241–244.
Goldsworthy, S. D., Bulman, C., He, X., Larcombe, J., and Littnan, C. (2003). Trophic
interactions between marine mammals and Australian fisheries: an ecosystem
approach. Pages 65–99 in Gales, N. J., Hindell, M. A., and R. Kirkwood, eds. Marine
Mammals: Fisheries, Tourism and Management Issues. CSIRO Publishing,
Melbourne, Vic.
Goldsworthy, S. D., McKenzie, J., Shaughnessy, P. D., McIntosh, R. R., Page, B., and
Campbell, R. (2009a). An update of the report: understanding the impediments to the
growth of Australian sea lion populations. Report to the Department of the

CHAPTER 5: Insights into seasonal prey use of the Australian sea lion
237
Environment, Water, Heritage and the Arts. SARDI Aquatic Science Publication
Number F2008/00847-1. SARDI Research Report Series Number 356. 175 pp.
Available from South Australian Research and Development Institute (Aquatic
Sciences), Adelaide, SA.
Goldsworthy, S. D., Page, B., P. D. Shaughnessy, Hamer, D., Peters, K. J., McIntosh, R. R.,
Baylis, A. M. M, and McKenzie, J. (2009b). Innovative solutions for aquaculture
planning and management: addressing seal interactions in the finfish aquaculture
industry. SARDI Aquatic Sciences Publication Number F2008/000222–1. SARDI
Research Report Series Number 288. 174 pp. South Australian Research and
Development Institute (Aquatic Sciences), Adelaide, SA.
Goldsworthy, S. D., Page, B., Rogers, P., and Ward, T. (2011). Establishing ecosystem-based
management for the South Australian Sardine Fishery: developing ecological
performance indicators and reference points to assess the need for ecological
allocations. Final report to the Fisheries Research and Development Corporation.
SARDI Publication No. F2010/000863-1. SARDI Research Report Series No. 529.
173 pp. South Australian Research and Development Institute (Aquatic Sciences),
Adelaide, SA.
Goldsworthy, S. D., Page, B., Rogers, P. J., Bulmand, C., Wiebkin, A., McLeay, L. J.,
Einoder, L., Baylis, A. M. M., Braley, M., Caines, R., Dalye, K., Huveneers, C.,
Peters, K., Lowther, A. D., and Ward, T. M. (2013). Trophodynamics of the eastern
Great Australian Bight ecosystem: Ecological change associated with the growth of
Australia’s largest fishery. Ecological Modelling, 255, 38 –57.
Gomon, M. F, Bray, D. J., and Kuiter, R. H. (2008). Fishes of Australia’s Southern
Coast. Reed New Holland Pty. Ltd., Sydney, Australia.

CHAPTER 5: Insights into seasonal prey use of the Australian sea lion
238
Goodman-Lowe, G. E. (1998). Diet of the Hawaiian monk seal (Monachus schauinslandii)
from the North Western Hawaiian islands during 1991-1994. Marine Biology, 132,
535–546.
Harcourt, R. G., Bradshaw, C. J. A., Dickson, K., and Davis, L. S. (2002). Foraging ecology
of a generalist predator, the female New Zealand fur seal. Marine Ecology Progress
Series, 227, 11–24.
Hartmann, N., Reichwald, K., Wittig, I., Dro, S., Schmeisser, S., Lück, C., Hahn, C., Graf,
M., Gausmann, G., Terzibasi, E., Cellerino, A., Ristow, M., Brandt, U., Platzer, M.,
and Englert, C. (2011). Mitochondrial DNA copy number and function decrease with
age in the short-lived fish Nothobranchius furzeri. Aging Cell, 10, 824–831.
Higgins, L. V. (1993). The nonannual, non-seasonal breeding cycle of the Australian sea lion,
Neophoca cinerea. Journal of Mammalogy, 74, 270–274.
Higgins, L.V., and Gass, L. (1993). Birth to weaning: parturition, duration of lactation, and
attendance cycles of Australian sea lions (Neophoca cinerea). Canadian Journal of
Zoology, 71, 2047–2055.
Horning, M., and Trillmich, F. (1997). Ontogeny of diving behaviour in the Galapagos fur
seal. Behaviour, 134, 1211–1257
Hyams, D. G. (2010). CurveExpert software.
Jarman, S. N., McInnes, J. C., Faux, C., Polanowski, A. M., Marthick, J., Deagle, B. E.,
Southwell, C., and Emmerson, L. (2013). Adélie penguin population diet monitoring
by analysis of food DNA in scats. PLoS ONE, 8, p.e82227.

CHAPTER 5: Insights into seasonal prey use of the Australian sea lion
239
King, R. A., Read, D. S., Traugott, M., and Sydmondson, W. O. C. (2008). Molecular
analysis of predation: a review of best practice for DNA-based approaches. Molecular
Ecology, 17, 947–963.
Kohn, M. H., and Wayne, R. K. (1997). Facts from feces revisited. Trends in Ecology and
Evolution, 12, 223–227.
Kovacs, K. M., Aguilar, A., D. Aurioles, sGamboa, D.,Burkanov,V.,Campagna,C.,Gales,N.,
Gelatt, T., Goldsworthy, S., Goodman, S.J., Hofmeyr, G.J.G., Harkonen, T., Lowry,
L., Lydersen, C., Schipper, J., Sipila, T., Southwell, C., Stuart, S., Thompson, D., and
Trillmich, F. (2012). Global threats to pinnipeds. Marine Mammal Science, 28, 414–
436. doi: 10.1111/j.1748-7692.2011.00479.x
Last, P. R., and Stevens, J. D. (2009). Sharks and Rays of Australia, 2nd Edn. CSIRO
publishing, Collingwood, Australia.
Le Boeuf, B. J., Morris, P. A., Blackwell, S. B., Crocker, D. E., and Costa, D. P. (1996).
Diving behaviour of juvenile northern elephant seals. Canadian Journal of Zoology,
74, 1632–1644.
Lee, O., Lee, S., Nam, D-H., and Lee, H. Y. (2013). Molecular analysis for investigating
dietary habits: genetic screening of prey items in scat and stomach contents of leopard
cats Prionailurus bengalensis euptilurus. Zoological Studies, 52, 1–6.
Leung, E. S., Chilvers, B. L., Nakagawa, S., and Robertson, B. (2014). Size and experience
matter: diving behaviour of juvenile New Zealand sea lions (Phocarctos hookeri)
Polar Biology, 37, 15. doi:10.1007/s00300-013-1405-6.
Ling, J. K. 1992. Neophoca cinerea. Mammalian Species 392:1–7.

CHAPTER 5: Insights into seasonal prey use of the Australian sea lion
240
Lowther, A. D., Harcourt, R. G., Hamer, D. J., and Goldsworthy, S. D. (2011). Creatures of
habit: foraging habitat fidelity of adult female Australian sea lions. Marine Ecology
Progress Series, 443, 249–263.
Lowther, A. D., Harcourt, R. G., Goldsworthy, S. D., and Stow, A. (2012). Population
structure of adult female Australian sea lions is driven by fine-scale foraging site
fidelity. Animal Behaviour, 83, 691–701.
Lowther, A. D., Harcourt, R. G., Page, B., and Goldsworthy, S. D. (2013). Steady as he goes:
Steady as He Goes: At-Sea Movement of Adult Male Australian Sea Lions in a
Dynamic Marine Environment. PLoS ONE, 8, e74348 doi: 10.1371 /
journal.pone.0074348
Lu, C. C., and Ickeringill, R. (2002). Cephalopod beak identification and biomass estimation
techniques: tools for dietary studies of southern Australian finfishes. Museum
Victoria Science Report 5. Museum Victoria, Melbourne, Vic.
Luo, C., Tsementzi, D., Kyrpides, N., Read, T. and Konstantinidis, K.T. (2012). Direct
comparisons of Illumina vs. Roche 454 sequencing technologies on the same
microbial community DNA sample. PLoS ONE, 7, p.e30087.
Marshall, H. D., Hart, K. A., Yaskowiak, G. B., Stenson, G. B., McKinnon, D., and Perry, E.
A. (2010). Molecular identification of prey in the stomach contents of Harp Seals
(Pagophilus groenlandicus) using species-specific oligonucleotides. Molecular
Ecology Resources, 10, 181–189.
McCafferty, D. J., Boyd, I. L., Walker, T. R., and Taylor, R. I. (1998). Foraging responses of
Antarctic fur seals to changes in the marine environment. Marine Ecology Progress
Series, 166, 285–299.

CHAPTER 5: Insights into seasonal prey use of the Australian sea lion
241
McInnes, J. C., Emmerson, L., Southwell, C., Faux, C., and Jarman, S. N. (2016).
Simultaneous DNA-based diet analysis of breeding, non-breeding and chick Adélie
penguins. Royal Society Open Science, 3, 150443.
McIntosh, R. R., Page, B., and Goldsworthy, S. D. (2006). Dietary analysis of regurgitates
and stomach samples from free-living Australian sea lions. Wildlife Research, 33,
661–669.
Middleton, J. F., and Bye, J. A. T. (2007). A review of the shelf-slope circulation along
Australia’s southern shelves: Cape Leeuwin to Portland. Progress in Oceanography
75, 1–41.
Norman, M. and Reid, A. (2000). A guide to Squid, Cuttlefish, and Octopuses of Australasia.
CSIRO 667 publishing. Oxford Street, Collingwood, Victoria. 96pp.
Page, B., McKenzie, J., R. McIntosh, Baylis, A., Morrissey, A., Clavert, N., Haase, T.,
Berris, M., Dowie, D., Shaughnessy, P. D., and Goldsworthy, S.D. (2004).
Entanglement of Australia sea lions and New Zealand fur seals in lost fishing gear and
other marine debris before and after government and industry attempts to reduce the
problem. Marine Pollution Bulletin, 49, 33–42.
Page B., McKenzie J., and Goldsworthy, S. D. (2005). Dietary resource partitioning among
sympatric New Zealand and Australian fur seals. Marine Ecology Progress Series,
293, 283–302.
Parry, G. D., Hobday, D. K., Currie, D. R., Officer, R. A., and Gason, A. S. (1995). The
distribution, abundance and diets of demersal fish in Port Phillip Bay. CSIRO INRE
Port Phillip Bay Environmental Study. Victorian Risheries Research Institute,
Queenscliff, Australia. Technical Report 21.

CHAPTER 5: Insights into seasonal prey use of the Australian sea lion
242
Passmore, A., Jarman S., Swadling, K., Kawaguchi, S., McMinn, A., and Nicol, S. (2006).
DNA as a dietary biomarker in Antarctic krill, Euphausia superba. Marine
Biotechnology, 8, 686–696.
Peters, K. J., Ophelkeller, K., Bott, N. J., Deagle, B. E., Jarman, S. J., and Goldsworthy, S. D.
(2014a). Fine-scale diet of the Australian sea lion (Neophoca cinerea) using DNA-
based analysis of faeces. Marine Ecology, 36, 347–367. doi: 10.1111/maec.12145.
Peters, K. J., Ophelkeller, K., Bott, N. J., Herdina, H., and Goldsworthy, S. D. (2014b). PCR-
based techniques to determine diet of the endangered Australian sea lion (Neophoca
cinerea): a comparison with morphological analysis. Marine Ecology, 4, 1428–1439
doi: 10.1111/maec.12242
Pochon, X., Bott, N. J., Smith, K. F., and Wood, S. A. (2013). Evaluating detection limits of
next-generation sequencing for the surveillance and monitoring of international
marine pests. PLoS ONE, 8, 1–12.
Pompanon, F., Deagle, B. E., Sydmonson, W. O. C, Brown, D. S., Jarman, S. J., and Taberlet,
P. (2012). Who is eating what: diet assessment using next generation sequencing?
Molecular Ecology, 21, 1931–1950.
Prokopowich, C. D., Gregory, T. R., and Crease, T. J. (2003). The correlation between rDNA
copy number and genome size in eukaryotes. Genome, 46, 48–50.
Quéméré, E., Hibert, F., C. Miquel, Lhuillier, E., Rasolon-draibe, E., Champeau, J.,
Rabarivola, C., Nusbaumer, L., Chatelain, C., Gautier, L., Ranirison, P., Crouau-Roy,
B.,Taberlet, P. and Chikhi, L. (2013). A DNA Metabarcoding Study of a primate
dietary diversity and plasticity across its entire fragmented range. PLoS ONE, 8,
e58971. doi:10.1371/journal.pone.0058971

CHAPTER 5: Insights into seasonal prey use of the Australian sea lion
243
Razgour, O., Clare, E. L., and Zeale, M. R. K. (2011). High-throughput sequencing offers
insight into mechanisms of resource partitioning in cryptic bat species. Ecology and
Evolution, 1, 556–570.
Rayé, G., Miquel, C., Coissac, E., Redjadj, C., Loison, A., and Taberlet, P. (2011). New
insights on diet variability revealed by DNA barcoding and high-throughput
pyrosequencing: chamois diet in autumn as a case study. Ecological Research, 26,
265–276.
Richardson, K. C., and Gales, N. J. (1987). Functional morphology of the alimentary tract of
the Australian sea-lion, Neophoca cinerea. Australian Journal of Zoology, 35, 219–
226. doi:10.1071/ZO9870219.
Rongahi, M. (2001). Pyrosequencing Sheds Light on DNA Sequencing. Genome Research
11, 3–11.
Schiffman, S., Reynolds, M. L., and Young, F. W. (1981). Introduction to multidimensional
scaling. Academic Press, NY, USA.
Shaughnessy, P. D., Goldsworthy, S. D., Hamer, D., Page B., and McIntosh, R. (2011).
Australian sea lions Neophoca cinerea at colonies in South Australia: distribution and
abundance, 2004 to 2008. Endangered Species Research, 13, 87–98.
Shepherd, S. A., Bryars, S., Kirkegaard, I., Harbison, P., and Jennings, J. T. (2008). Natural
history of Gulf St Vincent. Royal Society of South Australia Inc., Adelaide, pp 132–
147.
CHAPTER 5: Insights into seasonal prey use of the Australian sea lion
244
Shepherd, S. and Edgar, G. (2013). Ecology of Australian Temperate Reefs: the Unique
South. Editors: Scoresby Shepherd and Graham Edgar. CSIRO Publishing,
Collingwood, VIC.
Shokralla, S., Spall, J. L., Gibson, J. F., and Hajibabaei, M. (2012). Next-generation
sequencing technologies for environmental DNA research. Molecular Ecology, 21,
1794–1805.
Soininen, E. M., Valentini, A., Coissac, E., Miquel, C., Gielly, L., Brochmann, C., and
Taberlet, P. (2009). Analysing diet of small herbivores: the efficiency of DNA
barcoding coupled with high-throughput pyrosequencing for deciphering the
composition of complex plant mixtures. Frontiers in Zoology, 6, 16.
Springer, A. M., Estes, J. A., van Vliet, G. B., Williams, T. M., Doak, D. F. , Danner, E.
M., Forney, K. A. and Pfister, B. (2003). Sequential megafaunal collapse in the North
Pacific Ocean: an ongoing legacy of industrial whaling? Proceedings of the National
Academy of Sciences of the United States of America, 100,12223–12228.
Staniland, I. (2002). Investigating the biases in the use of hard prey remains to identify diet
composition using Antarctic fur seals (Arctocephalus gazella) in captive feeding
trials. Marine Mammal Science, 18, 223–243.
Sydmonson, W. O. C. (2002). Molecular identification of prey in predator diets. Molecular
Ecology, 11, 627–641.
Thomas, A. C., Jarman, S. N., Haman, K. H., Trites, A.W., and Deagle, B. E. (2014).
Improving accuracy of DNA diet estimates using food tissue control materials and an
evaluation of proxies for digestion bias. Molecular Ecology, 23, 3706–3718.

CHAPTER 5: Insights into seasonal prey use of the Australian sea lion
245
Thompson, J. D., Gibson, T. J., Plewniak, F., Jeanmougin, F., and Higgins, D. G. (1997). The
Clustal X windows interface: flexible strategies for multiple sequence alignment aided
by quality analysis tools. Nucleic Acids Research, 25, 4876–4882.
Tollit, D. J., Steward, M. J., Thompson, P. M., Pierce, G. J., Santos, M. B., and Hughes, S.
(1997). Species and size differences in the digestion of otoliths and beaks:
implications for estimates of pinniped diet composition. Canadian Journal of
Fisheries and Aquatic Science, 54, 105–119.
Tollit, D. J., Wong, M., Winship, A. J., Rosen, D. A., and Trites, A. W. (2003). Quantifying
errors associated with using prey skeletal structures from fecal samples to determine
the diet of Steller's sea lion (Eumetopias jubatus). Marine Mammal Science, 19, 724–
744.
Tollit, D. J., Schulze A.D., Trites, A. W., Olesiuk, P. F., Crockford, S. J., Gelatt, T. S., Ream,
R. R., and Miller, K. M. (2009). Development and application of DNA techniques for
validating and improving pinniped diet estimates. Ecological Applications, 19, 889–
905.
Trillmich, F., and Dellinger, T. (1991). The effects of El Niño on Galapagos pinnipeds.
Ecological studies, 88, 66–74.
Trites, A. W. (1997). The role of pinnipeds in the ecosystem. Pinniped populations, eastern
north Pacific: status, trends and issues. Pages 31-39 in G. Stone, J. Goebel and S.
Webster, eds. A symposium of the 127th Annual Meeting of the American Fisheries
Society. New England Aquarium, Conservation Department, Central Wharf, Boston,
MA 02110.

CHAPTER 5: Insights into seasonal prey use of the Australian sea lion
246
Vestheim, H., and Jarman, S. N. (2008). Blocking primers to enhance PCR amplification of
rare sequences in mixed samples — a case study on prey DNA in Antarctic krill
stomachs. Frontiers in Zoology, 5, 12.
Vestheim, H., Deagle B. E., and Jarman, S. N. (2011). Application of blocking
oligonucleotides to improve signal-to-noise ratio in a PCR. Methods in Molecular
Biology, 687, 265–274.
Walker, G. E., and Ling, J. K. (1981). Australian sea lion Neophoca cinerea (Péron, 1816).
Pages 99-118, S. H. Ridgway and R. J. Harrison, eds. Handbook of Marine Mammals;
the Walrus, Sea Lions, Fur Seals and Sea Otter. Academic Press, London, UK.
Wilkinson, I. S., Duignan, P. J., Grinberg, A., Chilvers B. L., and Robertson, B. C. (2006).
Klebsiella pneumoniae epidemics: possible impact on New Zealand sea lion
recruitment. Pages 455-471 in A.W. Trites, D. P. DeMaster, L. W. Fritz, L. D. Gelatt,
L. D. Rea, and K. M. Wynne, eds. Sea lions of the world. Alaska Sea Grant,
Fairbanks, AK.
Willerslev, E., Davison, J., Moora, M., Zobel, M., Coissac, E., Edwards, M. E., Lorenzen, E.
D., Vestergard, M., Gussarova, G., Haile, J., Craine, J., Gielly, L., Boessenkool, S.,
Epp, L. S., Pearman, P. B., Cheddadi, R., Murray, D., Brathen, K.A., Yoccoz, N.,
Binney, H., Cruaud, C., Wincker, P., Goslar, T., Alsos, I. G., Bellemain, E., Brysting,
A.K., Elven, R., Sonstebo, J. H., Murton, J., Sher, A., Rasmussen, M., Ronn, R.,
Mourier, T., Cooper, A., Austin, J., Moller, P., Froese, D., Zazula, G., Pompanon, F.,
Rioux, D., Niderkorn, V., Tikhonov, A., Savvinov, G., Roberts, R.G., MacPhee, R. D.
E., Gilbert, M.T.P., Kjaer, K.H., Orlando, L., Brochmann, C., and Taberlet, P. (2014).
Fifty thousand years of Arctic vegetation and megafaunal diet. Nature, 506, 47e51.

247
CHAPTER 6
General Discussion and Future Directions

CHAPTER 6: General discussion and future directions
248
GENERAL DISCUSSION
Pinniped diets have been studied by analysing prey items recovered from stomach and faecal
samples, fatty acids, stable isotopes, and more recently, using DNA analyses. These methods
continue to evolve and improve, but each has well documented shortcomings (reviewed in
Chapter 1). Despite these shortcomings, diet studies have provided new insights into the
ecology of pinnipeds, and conservation managers have benefited from the information (e.g.,
Goldsworthy et al. 2013).
Determining the diet of Australian sea lions (Neophoca cinerea) (ASL) has been particularly
problematic because the hard parts of their prey are completely digested, heavily eroded, or
are retained within the stomach as found by other authors (Richardson and Gales, 1987;
Gales and Cheal 1992; McIntosh et al. 2006). The small numbers of samples that have been
analysed (Gales and Cheal 1992, McIntosh et al. 2006; Gibbs et al. 2008; Fragnito et al.
2013) have also limited the conclusions from these studies. Unlike other pinnipeds, limited
detailed information of ASL diet has constrained an important aspect of understanding their
biology and ecology, which is critical for conservation management to determine their role as
predators within marine ecosystems. The continued decline of ASL across their South
Australian range (Goldsworthy et al. 2015), further imparts the need to determine the extent
of resource competition with sympatric otariids, the Australian fur seal (Arctocephalus
pusillus doriferus) and long-nosed fur seal (Arctocephalus forsteri), and with commercial and
recreational fisheries (Goldsworthy and Page, 2007).
The unique life history characteristics of ASL (protracted 17-18 mo gestation, aseasonal
breeding and asynchronous reproductive cycles among colonies) (Higgins, 1993; Higgins and
Gass, 1993; Gales et al. 1994) combined with limited natal site dispersal increases their

CHAPTER 6: General discussion and future directions
249
vulnerability to depletion from diffuse (e.g., extractive) and direct sources (e.g., by-catch). In
addition, the fact that ASL display long-term site fidelity to foraging locations and a temporal
persistence to particular trophic levels of prey, make them more susceptible to local prey
depletions if foraging behaviour is rigid and limited flexibility to search for alternate sources
of food (e.g., Lowther et al. 2011).
In the current study, the diet of ASL was determined from faeces and a limited number of
regurgitate samples collected from several ASL breeding colonies in South Australia. This is
one of the largest, fine-scale studies of ASL diet to date, which, by using traditional hard part
and novel DNA-based analyses, aimed to improve the information available on the diet of
ASL. A comparison of the methods is provided in Table 1.
The initial hard part analyses (Chapter 2) conducted across the range of ASL colonies in
South Australia, confirmed the results of Gales and Cheal et al. (1992) who classified the
approach as ‘unreliable’. This study indicated hard parts recovered from faeces and
regurgitates of ASL are mostly digested, biasing results towards prey items such as
cephalopod beaks that are highly resistant to digestion. Even though a large sample size was
examined in this study (n = 345), the hard part approach yielded poor information of ASL
prey diversity other than cephalopod prey. Here, only 344 prey items (273 cephalopod, 66
fish and 5 crustaceans) were identified. In comparison, the study by Reinhold et al. (2015),
identified 789 prey items from 110 faecal samples of the long-nosed fur seal (A. forsteri),
exhibiting the magnitude of difference in level of digestion that must occur in ASL compared
with the fur seal. It is unlikely that this relates to the types of prey ingested because digestion
transit rates of prey hard parts are similar between these pinniped species (Richardson and
Gales, 1987; Casper et al. 2007a). In addition, small, fragile otoliths such as those of redbait
and sardine that are prone to digestion are common in long-nosed fur seal faeces. Information

CHAPTER 6: General discussion and future directions
250
on the cephalopod component of ASL diet from this study is however, invaluable. Four key
taxa: octopus (O. maorum), cuttlefish (Sepia spp.), and loliginid (S. australis) and
ommastrephid squids (N. gouldi) were identified as important prey of ASL. The distribution
patterns and abundance of demersal Loliginidae and Ommastrephidae cephalopods is well
understood in South Australia (e.g. Steer et al. 2006; Stark, 2008), however, little is known of
the spatial extent of distribution of benthic species such as octopus in the GAB and Gulf
ecosystems (M. Steer pers. com). In this study, the latter were the most frequent and abundant
ASL cephalopod prey. Sampling multiple ASL colonies across South Australia provided
useful information on the spatial extent of these cephalopods and their consumption by ASL.
This information could be important to determine the level of competition with sympatric
foraging Australian and long-nosed fur seals, and fisheries (Page et al. 2005; Reinhold et al.
2015). By calculating cephalopod biomass, this study also found smaller octopuses were as
important in the diet as larger Loliginidae and Ommastrephidae squids. Biomass was also
determined for a small number of teleost fish species. Although this information was limited,
it provided information of the size of fish prey handled by ASL. Analysis of hard parts
improved the baseline data of potential prey groups examined in subsequent DNA- based
analyses.
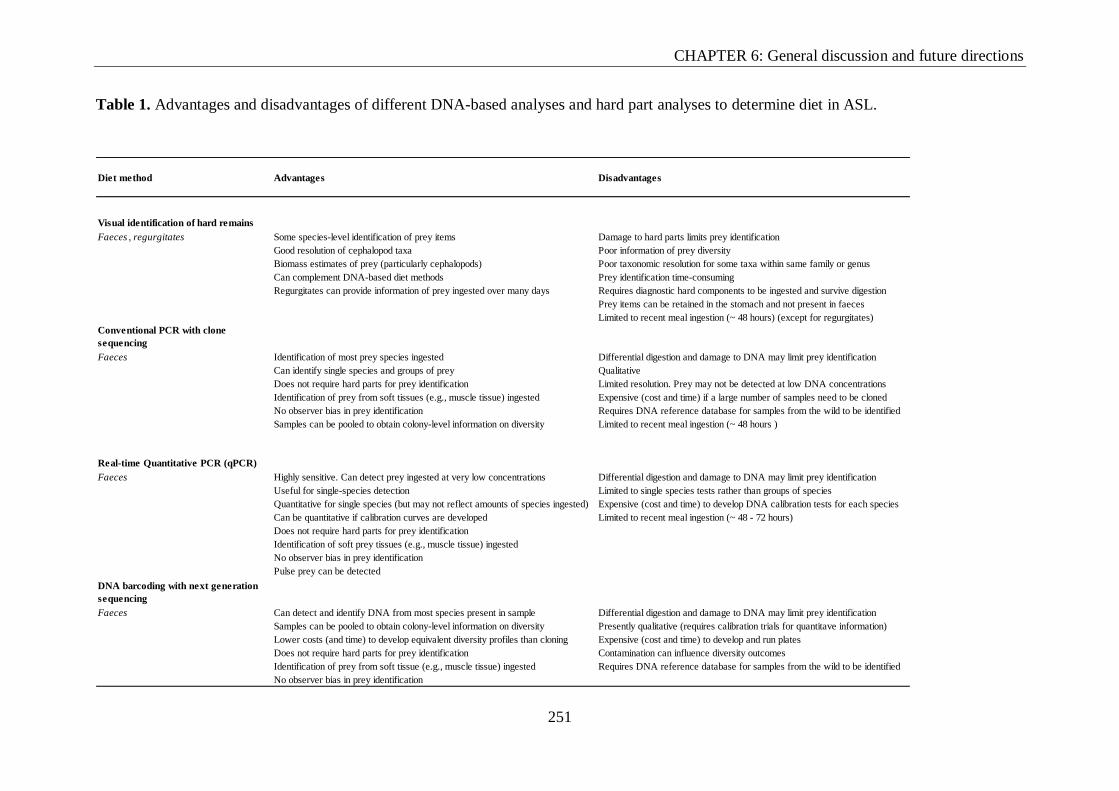
CHAPTER 6: General discussion and future directions
251
Table 1. Advantages and disadvantages of different DNA-based analyses and hard part analyses to determine diet in ASL.
Diet method Advantages Disadvantages
Visual identification of hard remains
Faeces , regurgitates Some species-level identification of prey items Damage to hard parts limits prey identification
Good resolution of cephalopod taxa Poor information of prey diversity
Biomass estimates of prey (particularly cephalopods) Poor taxonomic resolution for some taxa within same family or genus
Can complement DNA-based diet methods Prey identification time-consuming
Regurgitates can provide information of prey ingested over many days Requires diagnostic hard components to be ingested and survive digestion
Prey items can be retained in the stomach and not present in faeces
Limited to recent meal ingestion (~ 48 hours) (except for regurgitates)
Conventional PCR with clone
sequencing
Faeces Identification of most prey species ingested Differential digestion and damage to DNA may limit prey identification
Can identify single species and groups of prey Qualitative
Does not require hard parts for prey identification Limited resolution. Prey may not be detected at low DNA concentrations
Identification of prey from soft tissues (e.g., muscle tissue) ingested Expensive (cost and time) if a large number of samples need to be cloned
No observer bias in prey identification Requires DNA reference database for samples from the wild to be identified
Samples can be pooled to obtain colony-level information on diversity Limited to recent meal ingestion (~ 48 hours )
Real-time Quantitative PCR (qPCR)
Faeces Highly sensitive. Can detect prey ingested at very low concentrations Differential digestion and damage to DNA may limit prey identification
Useful for single-species detection Limited to single species tests rather than groups of species
Quantitative for single species (but may not reflect amounts of species ingested) Expensive (cost and time) to develop DNA calibration tests for each species
Can be quantitative if calibration curves are developed Limited to recent meal ingestion (~ 48 - 72 hours)
Does not require hard parts for prey identification
Identification of soft prey tissues (e.g., muscle tissue) ingested
No observer bias in prey identification
Pulse prey can be detected
DNA barcoding with next generation
sequencing
Faeces Can detect and identify DNA from most species present in sample Differential digestion and damage to DNA may limit prey identification
Samples can be pooled to obtain colony-level information on diversity Presently qualitative (requires calibration trials for quantitave information)
Lower costs (and time) to develop equivalent diversity profiles than cloning Expensive (cost and time) to develop and run plates
Does not require hard parts for prey identification Contamination can influence diversity outcomes
Identification of prey from soft tissue (e.g., muscle tissue) ingested Requires DNA reference database for samples from the wild to be identified
No observer bias in prey identification

CHAPTER 6: General discussion and future directions
252
Captive feeding trials are often useful to validate new methods of diet analysis and have been
important in the development of DNA-based analysis of pinniped faeces. DNA validation
trials have been conducted on several pinniped species including harbour seals (Phoca
vitulina) (Thomas et al. 2015), sub-Antarctic fur seals (A. tropicalis), long-nosed fur seals
(Casper et al. 2007a), and Steller sea lions (Eumetopias jubatus) (Deagle et al. 2005; Bowles
et al. 2011), with such studies indicating DNA-based analysis improves prey detection. A few
studies have also attempted DNA quantification from meals ingested, with varying degrees of
success (e.g. Bowles et al. 2011). The ASL feeding trial (Chapter 3) is the only pinniped
DNA-based diet study to assess simultaneously, the efficacy of conventional PCR and real-
time quantitative PCR (qPCR) prey detection, enabling a broader comparison of results to
hard part analysis (Chapter 3). The results indicated qPCR was more sensitive and detected
prey DNA more frequently than conventional PCR methods (by about 25%). However, when
compared to hard parts, both DNA methods significantly improved the detection of fish,
shark, and squid that had been fed to ASL by ≥ 50 -100%. The importance of all prey
ingested was significantly underestimated by hard part analysis and some species remained
undetected (shark and cephalopods). Furthermore, there were large discrepancies in the
recovery of DNA between individual ASL, suggesting intraspecific biases may limit
detection of some prey taxa if these techniques were applied to ASL faeces collected in the
wild. The results of this study indicated DNA-based methods are reliable and can readily
detect prey from ASL faecal DNA in the absence of hard parts. These findings will improve
understanding of the limitations and biases of different studies and different methods to
determine the diet of ASL and other pinnipeds.
A general conclusion from previous DNA-based diet studies of pinnipeds is that compared to
hard part analyses, DNA-based methods can improve information on the diversity of some
CHAPTER 6: General discussion and future directions
253
prey species (Casper et al. 2006; Matejusová et al. 2008; Deagle et al. 2009). This study
reinforced these interpretations. I employed species-specific and universal primers to amplify
prey DNA, and trialled the clone sequence and next-generation (NGS) sequencing methods to
identify individual species and different taxonomic groups of prey (Chapter 3, 4, 5).
Following the success of the feeding trial (Chapter 3), the clone sequencing approach was
used to study the diet of a small number of individuals (n = 12) from two breeding ASL
colonies (Chapter 4). Clone sequencing revealed ASL consumed a wide diversity of
benthopelagic and demersal prey, and 23 species of fish and five cephalopod prey were
identified. Approximately 28 species identified were novel, having not been previously
described in the diet of ASL. In comparison, the study of diet by hard parts identified one fish
and one cephalopod prey. Diets of individuals varied between sites, and colonies varied in
overall diversity, but there were several prey families (e.g. Labridae, Monacanthidae,
Platycephalidae, Octopodidae) common to both colonies. This suggests individual diet of
ASL probably reflects their individual foraging patterns, supporting the conclusion of
foraging fidelity (e.g. Lowther et al. 2011), while at the same time could indicate ASL target
common habitats or region-specific prey. To my knowledge, this is the first study to assess
fine-scale individual diet variation in ASL using DNA-based methods, which provided
intriguing insights into ASL prey. Clone sequencing has been a useful approach to assess diet
diversity of other aquatic and terrestrial consumers (e.g. Bradley et al. 2007; Carreon-
Martinez, 2011). However, the time and costs to clone and sequence large numbers of
samples may limit such an approach to smaller diet studies of single individuals and groups
of prey, particularly if diet comprises a wide diversity of prey.
The fact that ASL repeatedly target the same foraging locations and forego others that may be
potentially viable has been suggested a response to long-term individual specialisation and
familiarisation to local habitat and food resources (Lowther et al. 2011). In ASL, benthic

CHAPTER 6: General discussion and future directions
254
foraging in patchy heterogeneous seafloor environments could be expensive if the trade-off of
viable resources is not met. Because benthic species are unlikely to escape vertically to the
mid-water layer to avoid predation (Shepherd and Edgar, 2013), the predictability of certain
patches and their associated prey is likely to be an important factor in decision making for
ASL when feeding, as also observed in northern fur seals (Benoit-Bird et al. 2013).
I trialled novel next-generation sequencing (NGS) to examine seasonal diet variation in ASL
by repeat sampling of faeces at the Seal Bay colony over time (Chapter 5). The NGS
approach enables thousands to millions of DNA fragments to be sequenced simultaneously
(Deagle et al. 2009; Rayé et al. 2011; Yoccoz, 2012; Sousa et al. 2016). By combining
individual samples this method provided an unparalleled depth of information of the prey
diversity used by ASL throughout the year. Diet of ASL at Seal Bay comprised 39 families of
fish and five families of cephalopod prey, of which many were demersal species found in reef
and sandy habitats that are common in shelf waters near Seal Bay. The consistency of
common prey groups consumed over each season, suggested ASL consumed some prey that
are available throughout the year. These results provide a cautionary tale of seasonal diet
because colony-level synthesis generalises prey use and may not reflect the diets of all
individuals or sex and age classes at the colony. Anomalies such as the disparity in sequence
generation between seasons could have also influenced these results. Sequencing error, which
is indicative of older Roche NGS platforms, could be resolved by conducting parallel analysis
on newer sequencers such as Illumina. This would still require an assessment of the biases in
a controlled environment such as a captive feeding trial, because of intraspecific differences
in digestion between individuals and the digestive variability of DNA among prey. Such
influences will ultimately exclude some prey if DNA-based approaches are employed to
determine diet at ASL breeding colonies. Nevertheless, these methods are effective in
providing fine-scale information.

CHAPTER 6: General discussion and future directions
255
Although independent foraging behaviour was not tracked in any of these studies, the results
appeared consistent with biologging and animal borne videography diet studies, which
indicate ASL target specific foraging patches and trophic levels of prey (Lowther and
Goldsworthy, 2011, Lowther et al. 2011; Fragnito, 2013). Studies of the diets of other sea
lion species have typically identified differences between individuals, colonies, and seasons
(Villegas-Amtmann et al. 2008; Drago et al. 2016). The spatial differences observed in the
diets of ASL in this study could therefore be explained by the differences in the benthic
habitats near each colony that are known to support different species of prey (Bryars et al.
2003; Lowther and Goldsworthy 2011; Lowther et al. 2011; Shepherd et al. 2013). Many
pinniped diet studies have concluded that diets reflect prey availability but few have
measured the distribution or abundance of prey. Guinet et al. (2001) measured the abundance
of prey in locations used by Antarctic fur seals (A. gazella) and found that diet did not reflect
prey availability. They concluded that factors other than prey availability could influence
their diet. Call et al. (2008), for example, proposed individual foraging site fidelity in
northern fur seals (Callorhinus ursinus) was a function of route choice to reduce competition
with conspecifics. In contrast, Benoit-Bird et al. (2013) found that northern fur seal foraging
behaviour matched aggregations of preferred prey. A compelling avenue of research for ASL
diet studies would be to compare the diet and feeding locations of ASL and the availability of
their prey. The combination of NGS and biologging technology for example, could greatly
improve understanding of how local-scale prey densities and diversity influence the foraging
fidelity of ASL. Adult male ASL tracked by Lowther et al. (2013), for example, showed
temporal fidelity to foraging grounds and isotopic data indicated seasonal trophic-level shifts
in their use of prey. They concluded that although individuals may exhibit strong fidelity to
sites, oceanographic events such as coastal upwellings could influence the diversity of
available prey. Finer-scale studies of ASL diet using NGS could therefore assist in

CHAPTER 6: General discussion and future directions
256
understanding the foraging patterns of individuals and their trophic requirements. Such
studies would improve understanding of ASL foraging ecology, as well as their interactions
with commercial and recreational fisheries.
FUTURE STUDIES OF ASL DIET
The aim of this study was to develop and assess different DNA-based techniques to
determine diet in wild populations of ASL. Although small-scale individual diet variability of
female ASL was assessed (Chapter 3), this study did not investigate demographic differences
such as sex or age in the diets of ASL, or spatial differences across their entire breeding
range. These factors are likely to drive differences in the diet of ASL. In fur seals and sea
lions body mass and diving capability are intrinsically correlated to the capacity to store
oxygen, which determine the depth of water and habitats at which prey can be accessed
(Kooyman 1989; Fowler et al. 2006; Weise et al. 2010; Jeglinski et al. 2012). Larger seals
are also able to handle and consume relatively larger prey (Page et al. 2005). Future ASL diet
studies should determine whether different age and sex groups use different prey, which
could potentially reduce intra-specific competition as noted for northern fur seals (Call et al.
2008). For example, during lactation female fur seals and sea lions behave as central place
foragers, alternating foraging with regular provisioning of their dependent pups on shore
(Orians and Pearson, 1979; Robson et al. 2004; Lowther et al. 2011; Villegas-Amtmann et al.
2016). The need to commute between foraging grounds and the colony is one factor that
influences their foraging behaviours. ASL are particularly interesting in this regard because
they provision their young for approximately 18 months (Higgins, 1993), and during lactation
ASL pups may travel between colonies and haul-out sites in the processes of foraging with
their mother (Lowther et al. 2012). Because DNA-based studies can identify the diet of
individuals, future diet studies could investigate fine-scale differences in the foraging ecology

CHAPTER 6: General discussion and future directions
257
of individual lactating females and their pups. Trophic level studies have partly quantified
such relationships between mother and pup pairs (Lowther et al. 2012); if the availability of
different prey was also quantified such studies could determine the extent to which pups learn
foraging sites and skills from their mothers and improve our understanding of the habitat
requirements of ASL.
Spatial differences in the diet of ASL are highly likely because they breed over a wide range,
from South Australia to Western Australia. This entire area is influenced by the low nutrient
environment of the Leeuwin Current particularly in the west of their range (Creswell and
Golding, 1980), but other oceanographic features are also important, and may drive
differences in the diets of ASL (Lowther et al. 2011). For example, seasonal upwellings
increase productivity offshore from southwestern Australia (Gersbach et al. 1997; Rennie et
al. 2009) and in the Kangaroo Island area (Butler et al. 2002; Middleton, 2007; Middleton
and Bye, 2007; Van Ruth et al. 2010; Lowther et al. 2013). These increases in productivity
may influence the prey available to ASL and increases in productivity have been associated
with increased survival of ASL pups at Seal Bay (McIntosh et al., 2013). To inform the
management of ASL, including the species’ potential trophic interactions with commercial
and recreational fisheries, future studies should seek to quantify the diet of ASL across their
range. This should also include an analysis of crustaceans that are likely important prey of
ASL (McIntosh et al. 2006), but were not addressed here. Recent advances in DNA-based
methods have improved the capacity to undertake such studies, because samples can be
combined for analyses to examine spatial differences.
CONCLUSION
Recent improvements in DNA-based methods are likely to increase the efficacy of pinniped
diet studies. In particular, continual growth of DNA sequence libraries and greater use of

CHAPTER 6: General discussion and future directions
258
NGS technology to characterise environmental sources of DNA (e.g., faeces, soil), will likely
improve species-level information available to determine diet diversity of terrestrial and
aquatic consumers. This information, combined with methods that quantify next-generation
sequence counts to determine the relative abundance of prey will improve estimates of
biomass consumed by pinnipeds (Deagle et al. 2013). Such studies will be able to quantify
interactions between ASL and other marine predators and prey, and with commercial
fisheries. These studies are required to address one of the most compelling questions facing
conservation and fisheries managers – what is preventing the recovery of ASL populations
across their range? This question is particularly interesting because sympatric populations of
the Long-nosed fur seal and Australian fur seal are now rapidly recovering, and studies
indicate that their populations could continue to increase in number over the next 15 to 20
years (Shaughnessy et al., 2014, 2016). These data will also improve ecological models (e.g.
Goldsworthy et al. 2013), which are used to inform the management of ASL populations and
the ecological sustainable development of fisheries.
REFERENCES
Benoit-Bird, K., Battaile, B., Nordstrom, C., and Trites, A. (2013). Foraging behaviour of
northern fur seals closely matches the hierarchical patch scales of prey. Marine
Ecology Progress Series, 479, 283–302. doi: 10.3354/meps10209
Bowles, E., Schulte, P.M., Tollit, D.J., Deagle, B.E., and Trites, A.W. (2011). Proportion of
prey consumed can be determined from faecal DNA using real-time PCR. Molecular
Ecology Resources. doi: 10.1111/j.1755-0998.2010.02974.x.
Bradley, B. J., Stiller, M., Doran-Sheehy, D. M., Harris, T., Chapman, C. A., Vigilant, L., and
Poinar, H. (2007). Plant DNA sequences from feces: potential means for assessing
diets of wild primates. American Journal of Primatology, 69, 699–705.

CHAPTER 6: General discussion and future directions
259
Bryars, S. (2003) and Natural Heritage Trust (Australia) and Primary Industries and
Resources SA. Fish Habitat Program (2003). An inventory of important coastal
fisheries habitats in South Australia. Fish Habitat Program, Primary Industries and
Resources South Australia, Adelaide
Butler, A., Althaus, F., Furlani, D., and Ridgway, K. (2002). Assessment of the conservation
values of the Bonney upwelling area: A component of the Commonwealth Marine
Conservation Assessment Program 2002–2004: Report to the Environment Australia,
CSIRO Marine Research.
Call, K., Ream, R., Johnson, D., Sterling J.T., and Towell, R.G. (2008). Foraging route tactics
and site fidelity of adult female northern fur seal (Callorhinus ursinus) around the
Pribilof Islands. Deep Sea Research Part II Topical Studies in Oceanography, 55,
1883–1896. doi: 10.1016/j.dsr2.2008.04.022
Carreon-Martinez, L., Johnson, T. B., Ludsin, S., A., and Heath D. D. (2011). Utilisation of
stomach content DNA to determine diet diversity in piscivorous fishes. Journal of
Fish Biology, 78, 1170–1182.
Cresswell, G. R., and Golding T. J. (1980). Observations of a southflowing current in the
southeastern Indian Ocean. Deep-Sea Research, 27A, 449–466.
Casper, R. M., Gales, N. J., Hindell, M. A., Robinson, S. M. (2006). Diet estimation based on
an integrated mixed prey feeding experiment using Arctocephalus seals. Journal of
Experimental Marine Biology and Ecology, 328, 228–239.
Casper, R. M., Jarman, S. N., Deagle, B. E., Gales, N. J., and Hindell, M. A. (2007a).
Detecting prey from DNA in predator scats: A comparison with morphological

CHAPTER 6: General discussion and future directions
260
analysis, using Arctocephalus seals fed a known diet. Journal of Experimental Marine
Biology and Ecology, 347, 144–154.
Casper R. M., Jarman S. N., Gales N. J., and Hindell, M. A. (2007b). Combining DNA and
morphological analyses of faecal samples improves insight into trophic interactions: a
case study using a generalist predator. Marine Biology, 152, 815–825.
Deagle, B. E., Tollit, D.J., Jarman, S.N., Hindell, M.A., Trites, A.W., and Gales, N. J. (2005).
Molecular scatology as a tool to study diet: analysis of prey DNA in scats from
captive Steller sea lions. Molecular Ecology, 14, 1831–1842.
Deagle, B. E., Eveson, J. P., and Jarman, S. N. (2006). Quantification of damage in DNA
recovered from highly degraded samples - a case study on DNA in faeces. Frontiers
in Zoology, 3, 1–10.
Deagle, B. E., Kirkwood, R., and Jarman, S.N. (2009). Analysis of Australian fur seal diet by
pyrosequencing prey DNA in faeces. Molecular Ecology, 18, 2022–2038
Deagle, B. E., Thomas, A. C., Shaffer, A. K., Trites, A. W. and Jarman, S. N. (2013).
Quantifying sequence proportions in a DNA-based diet study using Ion Torrent
amplicon sequencing: which counts count? Molecular Ecology Resources, 13, 620–
633.
Drago, M., Franco-Trecu, V., Cardona, L., Inchausti, P.,Tapia, W., and Páez-Rosas, D.
(2016). Stable isotopes reveal long-term fidelity to foraging grounds in the Galapagos
sea lion (Zalophus wollebaeki). PLoS ONE, 11, e0147857. doi:
10.1371/journal.pone.0147857

CHAPTER 6: General discussion and future directions
261
Fowler, S. L., Costa, D. P., and Arnould, J. P. Y. (2007). Ontogeny of movements and
foraging ranges in the Australian sea lion. Marine Mammal Science, 23, 598–614.
Fragnito, K. (2013). Feeding behaviour and habitat utilisation of adult female Australian sea
lions (Neophoca cinerea) using animal-borne video cameras. BSc Honours thesis, The
University of Adelaide, South Australia.
Gersbach, G. H., Pattiaratchi, C. B., Ivey, G.N., and Cresswell, G. (1999). Upwelling on the
south-west coast of Australia – source of the Capes Current? Continental Shelf
Research, 19, 363–400.
Goldsworthy, S. D. and Page, B. (2007) A risk-assessment approach to evaluating the
significance of seal bycatch in two Australian fisheries. Biological Conservation 139,
269–285. doi: 10.1016/j.biocon.2007.07.010
Goldsworthy, S. D., Page, B., Rogers, P. J., Bulman, C., Wiebkin, A., McLeay, L. J., Einoder,
L., Baylis, A. M. M., Braley, M., Caines, R., Dalye, K., Huveneers, C., Peters, K.,
Lowther, A. D., and Ward, T. M. (2013). Trophodynamics of the eastern Great
Australian Bight ecosystem: Ecological change associated with the growth of
Australia’s largest fishery. Ecological Modelling, 255, 38 –57.
Guinet, C., Dubroca, L., Lea, M., Goldsworthy, S., Cherel, Y., Duhamel, G., Bonadonna, F.,
and Donnay, J. P (2001). Spatial distribution of foraging in female Antarctic fur seals
Arctocephalus gazella in relation to oceanographic variables: a scale-dependent
approach using geographic information systems. Marine Ecology Progress Series
219, 251–264. doi: 10.3354/meps219251
Higgins, L. V. (1993). The nonannual, non-seasonal breeding cycle of the Australian sea lion,
Neophoca cinerea. Journal of Mammalogy, 74, 270–274.

CHAPTER 6: General discussion and future directions
262
Jeglinski, J., Werner, C., Robinson, P., Costa, D. P., and Trillmich, F. (2012). Age, body
mass and environmental variation shape the foraging ontogeny of Galapagos sea
lions. Marine Ecology Progress Series 453, 279–296. doi: 10.3354/meps09649
Lowther, A. D. and Goldsworthy, S. D. (2011). Detecting alternate foraging ecotypes in
Australian sea lion (Neophoca cinerea) colonies using stable isotope analysis. Marine
Mammal Science, 27, 567–586. doi: 10.1111/j.1748-7692.2010.00425.x
Lowther, A. D., Harcourt, R., Hamer, D., and Goldsworthy, S. D. (2011). Creatures of habit:
foraging habitat fidelity of adult female Australian sea lions. Marine Ecology
Progress Series, 443, 249–263. doi: 10.3354/meps09392
Lowther, A., Harcourt, R., Goldsworthy, S., and Stow, A. (2012). Population structure of
adult female Australian sea lions is driven by fine-scale foraging site fidelity. Animal
Behaviour, 83, 691–701.
Lowther, A. D., and Goldsworthy, S. D. (2012). Head start: Australian sea lion pups gain
experience of adult foraging grounds before weaning. Marine Biology, 159, 2687–
2696. doi:10.1007/s00227-012- 2026-2
Lowther, A. D., Harcourt, R. G., Page, B., and Goldsworthy, S. D. (2013). Steady as he goes:
At-Sea Movement of Adult Male Australian Sea Lions in a Dynamic Marine
Environment. PLoS ONE, 8, e74348 doi: 10.1371 / journal.pone.0074348
Marshall, H. D., Hart, K. A., Yaskowiak, G. B., Stenson, G. B., McKinnon, D., and Perry, E.
A. (2010). Molecular identification of prey in the stomach contents of Harp Seals
(Pagophilus groenlandicus) using species-specific oligonucleotides. Molecular
Ecology Resources, 10, 181–189.

CHAPTER 6: General discussion and future directions
263
Matejusová, I., Doig, F., Middlemas, S. J., Mackay, S., Douglas, A., Armstrong, J. D.,
Cunningham, C. O., and Snow, M. (2008). Using quantitative real-time PCR to detect
salmonid prey in scats of grey Halichoerus grypus and harbour Phoca vitulina seals in
Scotland — an experimental and field study. Journal of Applied Ecology, 45, 632–
640.
McIntosh, R. R., Page, B., and Goldsworthy, S. D. (2006). Dietary analysis of regurgitates
and stomach samples from free-living Australian sea lions. Wildlife Research, 33,
661–669.
McIntosh, R. R., Arthur, A. D., Dennis, T., Berris, M., Goldsworthy, S. D., Shaughnessy, P.
D., and Teixeira, C. E. P. (2013). Survival estimates for the Australian sea lion:
negative correlation of sea surface temperature with cohort survival to weaning.
Marine Mammal Science, 29, 84–108. doi:10.1111/j.1748-7692.2011.00558.
Meynier L., Duncan, D.S., Mackenzie, D. D. S., Duignan, P. J., Chilvers, B. L., and Morel,
P.C.H. (2009). Variability in the diet of New Zealand sea lion (Phocarctos hookeri) at
the Auckland Islands, New Zealand. Marine Mammal Science, 25, 302–326. doi:
10.1111/j.1748-7692.2008.00252.x.
Middleton, J. F. (2000). Wind forced upwelling: the role of the surface mixed layer. Journal
of Physical Oceanography, 30, 745e763.
Middleton, J. F., and Bye, J. A. T. (2007). A review of the shelf slope circulation along
Australia’s southern shelves: Cape Leeuwin to Portland. Progress in Oceanography,
75, 1e41.

CHAPTER 6: General discussion and future directions
264
Orians, G. H., and Pearson, N. E. (1979). On the theory of central place foraging. In: Horn,
D.J., Stairs, G.R., Mitchell, R.D. (Eds.), Analysis of Ecological Systems. Ohio State
University Press, Columbus, OH, pp. 155–177.
Page, B., McKenzie, J., and Goldsworthy, S. D. (2005). Dietary resource partitioning among
sympatric New Zealand and Australian fur seals. Marine Ecology Progress Series
293, 283–302. doi: 10.3354/meps293283
Rayé, G., Miquel, C., Coissac, E., Redjadj, C., Loison, A., and Taberlet, P. (2011). New
insights on diet variability revealed by DNA barcoding and high-throughput
pyrosequencing: chamois diet in autumn as a case study. Ecological Research, 26,
265–276.
Rennie, S., Hanson, C. E., McCauley, R. D., Pattiaratchi, C., Burton, C., Bannister, J., Jenner,
C., and Jenner, M. N. (2009). Physical properties and processes in the Perth Canyon,
Western Australia: links to water column production and seasonal pygmy blue whale
abundance. Journal of Marine Systems, 77, 21–44
Richardson, K.C., and Gales, N. J. (1987). Functional morphology of the alimentary tract of
the Australian sea lion, Neophoca cinerea. Australian Journal of Zoology, 35, 219–
226. doi:10.1071/ZO9870219
Robson, B. W., Goebel, M. E., Baker, J. D., Ream, R. R., Loughlin, T. R., Francis, R. C.,
Antonelis, G. A., and Costa, D. P. (2004). Separation of foraging habitat among
breeding sites of a colonial marine predator, the northern fur seal (Callorhinus
ursinus). Fisheries Science, 29, 20–29. doi: 10.1139/Z03-208
Shepherd, S. and Edgar, G. (2013). Ecology of Australian Temperate Reefs: the Unique
South. CSIRO Publishing, Collingwood, VIC.

CHAPTER 6: General discussion and future directions
265
Sousa, L. L., Xavier, R., Costa, V., Humphries, N. E., Trueman, C., Rosa, R., Sims, D. W.,
and Queiroz, N. (2016). DNA barcoding identifies a cosmopolitan diet in the ocean
sunfish. Nature Scientific Reports, 6, 1–9. doi.org/10.1038/srep28762
Shaughnessy, P. D., Goldsworthy, S. D., and Mackay, A. I. (2015). The long-nosed fur seal
(Arctocephalus forsteri) in South Australia in 2013-14: abundance, status, and trends.
Australian journal of Zoology, 63, 101–110.
Shaughnessy, P. D., and Goldsworthy, S. D. (2016). Increasing abundance of pups of the
long-nosed fur seal (Arctocephalus forsteri) on Kangaroo Island, South Australia,
over 26 breeding seasons to 2013–14. Wildlife Research, 42, 619–632.
Stark, E. K. (2008) Ecology of the Arrow Squid (Nototodarus gouldi) in Southeastern
Australian Waters. PhD Thesis. University of Tasmania, Australia.
Steer, M. A, Lloyd, M.T., and Jackson, W. B. (2006). Southern Calamary (Sepioteuthis
australis) Fishery. Fishery Assessment Report to PIRSA. South Australian Research
and Development Institute (Aquatic Sciences), Adelaide. SARDI Research Report
Series Number 229, SARDI Publication Number F2007/000528-2
Thomas, A. C., Jarman, S. N., Haman, K. H., Trites, A.W., and Deagle, B. E. (2014).
Improving accuracy of DNA diet estimates using food tissue control materials and an
evaluation of proxies for digestion bias. Molecular Ecology, 23, 3706 – 18.
doi:10.1111/mec.12523
Van Ruth, P. D., Ganf, G. G., and Ward, T. M. (2010). Hotspots of primary productivity: an
alternative interpretation to conventional upwelling models. Estuarine, Coastal and
Shelf Science, 90, 142e158.

CHAPTER 6: General discussion and future directions
266
Villegas-Amtmann, S., Costa, D., Tremblay, Y., Salazar, S., and Aurioles-Gamboa, D.
(2008). Multiple foraging strategies in a marine apex predator, the Galapagos sea lion
Zalophus wollebaeki. Marine Ecology Progress Series 363, 299–309. doi:
10.3354/meps07457
Villegas-Amtmann, S., McDonald, B. I., Páez-Rosas, D. Aurioles-Gamboa, D., and Costa, D.
(2016). Adapted to change: low energy requirements in a low and unpredictable
productivity environment, the case of the Galapagos sea lion. Deep Sea Research Part
II: Topical Studies of Oceanography 1–11. doi: 10.1016/j.dsr2.2016.05.015
Weise, M. J., Harvey, J. T., and Costa, D. P. (2010). The role of body size in individual-based
foraging strategies of a top marine predator. Ecology, 91, 1004–1015.
Yoccoz, N. G. (2012). The future of environmental DNA in ecology. Molecular Ecology, 21,
2031–2038.