didactic daylight design education forjrwhite2/whitethesis.pdfdidactic daylight design education a...
TRANSCRIPT
DIDACTIC DAYLIGHTDESIGN EDUCATION
A thesis submitted to the Faculty of the Graduate School ofthe University at Buffalo, State University of New York
in partial fulfi llment of the degree requirements for the degree of
Master of Architecture
Department of Architecture
by
Jonathan Robert WhiteJune 1, 2009
FOR

Copyright © June 2009, Jonathan Robert White. All rights reserved.
ii


Dedicatedto Mom and Dad
Thank you for all of the years of encouragement and never letting me give up. No school or
church, and few other parents, can teach the values and ethics you have instilled in me. For
all of that and so much more, I am eternally grateful.
to Beth Tauke, Ken MacKay, and Ed Steinfeld
Your continued guidance, care, and consideration for this thesis and all of my school works
are an excellent indication of your character, dedication, and commitment. Your inspira-
tion has proved to be extremely helpful for this thesis, and will prove to be invaluable to my
future endeavors. Thank you.
iii


iv
Table of ContentsDedication iiiAbstract vCHAPTER ONE SUBJECT & CONCEPT Introduction 1Book Organization 3Project Workfl ow 3CHAPTER TWO ENVIRONMENTAL VARIABLES
Overview 7Light 8Air 15Sound 23Other 29 CHAPTER THREE CONTROL VARIABLES & TECHNIQUES
Overview 31Control Variables 32Physical Modeling 33Digital Modeling 39Physics of Light 39Case Study 40CHAPTER FOUR THE PHYSICAL MODEL
Overview 43Objectives 44Process 45Pseudo Color Renditions 50 CHAPTER FIVE CONCLUSION
Project Workfl ow Analysis 65Physical Model Objectives Analysis 68Further Reading & References 69


v
Abstract
STATEMENT OF ISSUEThis thesis investigates a modeling method for daylight design in the early design phase, as a
means of promoting a positive and inclusive educational environment that allows for multiple
modes of learning. Specifi cally, this study focuses on developing a tool for designers to study and
apply daylighting methods in a rapid but informed manner. It also provides metrics to allow design-
ers to analyze different daylighting design variables in relation to one another and against the light-
ing requirements of different modes of learning.
STATEMENT OF SIGNIFICANCE OF ISSUEThe design of learning environments is an important specialty within architectural practice, and
encompasses “ever changing educational theories, the subtle spatial and psychological require-
ments of growing children and practical issues that are unique to these types of buildings.” (Dudek,
2000) It is argued that the architectural environment has a psychological effect on all humans, but
can an inclusive, naturally well-lit environment presented to children aid in cognitive, spatial, and
sensorial development? The signifi cance of this topic lies in the fact that our fi rst formal learning
environments have the capability to infl uence the development of attitudes, knowledge, and skills
throughout our lives. If all children experienced well-designed, inclusive environments, would they
be more curious, creative, and open to new experiences, people, and places? Numerous studies
have concluded that children experiencing naturally well-lit environments perform better on stan-
dard tests and that natural light promotes positive learning behaviors. Despite this, there seems to
be few examples of naturally well-lit schools. This thesis proposes a tool designers can use to aid in
the development of day lit schools and how can the lighting strategies be customized based on the
different modes of learning?
vi
METHOD OF INQUIRYThe method of inquiry includes a literature review of research on childhood psychology, elementary
educational theory, behavioral design, and inclusive design with a specifi c emphasis on the effects
of the architectural environment on children. It also includes extensive research on daylighting with
an emphasis on its application to schools. The research includes daylighting design guidelines and
case studies of daylighting strategies in schools. This research provides an evidence base for the
development of a didactic daylighting design tool, metrics for its use, and theoretical designs it can
produce. The daylight design tool takes the form of a scale model and drawings with metrics that
utilize photographic and multimedia tools.
OUTCOMEThis thesis provides research on the ways that daylighting can contribute to the development of
educational environments that promote learning for a wider range of elementary school children.
Preliminary work (research, experiments, and discussions) and a proposal for a didactic design tool
complete with drawings, models, and corresponding data are included in the documentation, which
is bound and submitted to the Faculty of the Graduate School of the University at Buffalo, State Uni-
versity of New York in partial fulfi llment of the requirements for the degree of Master of Architecture.
COMMITTEE MEMBERSMajor Professor / Committee Chair: Beth Tauke
Committee Member: Kenneth MacKay
Committee Member: Edward Steinfeld

1
Introduction
In recent years, many advocates for the use of natural light in buildings, practices that design
professionals refer to as “daylighting,” have emerged. Recent rise in the popularity of sustainable
energy practices is a major contributor to the calls for natural light in the built environment. The so
called, “green” energy practice, when implemented properly, is often cited as a way of saving costs
by reducing dependence on electric lighting as well as heating and air conditioning. This thesis
posits that human factors, in addition to these green factors, are modifi ed by natural light and cites
studies in educational performance to demonstrate a need for daylighting in educational environ-
ments.
Architects are well aware that before the invention and popularization of electric lighting, many
buildings were designed to take advantage of natural light. The reason was simple; people need
light to do their jobs. Some architects simply fl ooded buildings with as much light as possible
CHAPTER ONESUBJECT & CONCEPT
2
without concern for glare or heat gain. Others carefully factored in the sun’s altitude and azimuth
and invented methods for daylighting that considered the tasks to be performed in a space. It was
generally understood that factory workers worked better with better light conditions. Likewise, would
it not stand to reason that students would learn better in improved light conditions?
The invention of electric lighting brought a slow decrease in the presence of architecture that ac-
knowledged the benefi ts of daylighting. As buildings with effective daylighting aged, tenants and in-
dustries changed. Now, even buildings previously hailed for their excellent lighting were mismatched
with new tenants with different lighting needs. This contributed to the growing perception of day-
light as an aesthetic benefi t rather than a functional necessity. The reconsideration of daylighting
in buildings for green buildings reminds us of its functional attributes as well. This thesis focuses
on the functional benefi ts of daylighting by presenting a list of educational activities and modes of
learning, setting parameters for those educational activities, and quantitative evaluation criteria us-
ing false color rendition, a technique for applying a new spectrum of color to black-and-white images
to make changes in brightness more apparent to the human eye.
This thesis offers research as evidence of the functional benefi ts of daylight in educational settings
as a foundation for photographic studies of a didactic daylight study tool in the form of a physical
model. The photographic studies are analyzed based on their relation to educational activities, and
qualitative evaluation criteria mentioned above. The intention of this thesis is to develop didactic
daylighting tools that combine metrics that have never been combined before, to aid in the design
of sustainable and inclusive educational spaces. These tools include both a physical daylight model
with assembly instructions; a set of instructions for performing photographic analysis in the form of
false color renditions; and an example of how this tool may be used. The hope is that designers will
use the tools provided to develop daylight solutions for their projects and in doing so, become more
aware of the properties, behavior, and effects of daylight. Ideally, the same designers would become
better designers, and begin to refi ne the tools to correct its fl aws and better suit their individual
needs.

3
Project Workfl ow
The conceptual diagram on the next page helps the reader visualize of the progression of the
project from its inception. Each branch of the diagram is a different step in the decision-making
process. Every effort has been made to ensure the terminology used in the diagram is consistent
with terminology used throughout the book. The diagram on page 4 is supplemented by the text on
page 5 which explains why each branch was pursued for this thesis. The chapters and subsections
of this book are organized and labeled based on this diagram. The diagram will also reappear in the
conclusion as a method for analysis.
Book Organization
This book is organized into fi ve chapters. This chapter has introduced the thesis and will introduce a
conceptual diagram that informs the organization of the project, and of the remaining chapters and
subsections. Chapter two provides background information on the environmental variables studied,
such as light, sound, and air issues in schools. This helps the reader to understand the basic con-
cepts that have been introduced and that will be discussed further. It gives specifi cs on daylight and
issues related to current daylighting practices. It describes specifi c problems with current lighting
practices and offers research evidence of the impact of typical lighting and daylighting on learning.
It gives a clear presentation of the relevance of the thesis in relation to human performance and
more specifi cally, education.
Chapter three and four describe the method of inquiry and analysis; give a detailed description of a
daylight study model using drawings and photographs. It couples the studies from previous daylight
study models with evaluation criteria and metrics and describes how the criteria and metrics can be
used as a design tool.
Chapter fi ve summarizes the thesis research, fi ndings, and provides a critical look at the project and
design tools using the conceptual diagram introduced in this chapter.

4
Thesis Subject:
Thesis Concept:
Environment Variables:
Light Method Variables:
Control Variables:
Techniques:
Design Variables:
Human Performance & Behavior in Education
Architectural Environment Social Environment
Light Air Sound Scent Material Comfort
Natural Artifi cial Nanotechnology
Early Design Late Design Perception Sequence Personal
Physical Model Digital Model Physics Case Studies
Orientation Color Materials
Light Entry Geometry Objects

5
This thesis asserts that differences in performance and behavior in the classroom are infl uenced by the environment. This thesis studies the architectural environment as the infl uence for performance and behavior, as opposed to studying social concepts such as teaching style, classroom crowding,
and funding, which can also infl uence student performance and behavior.
Research presented in later chapters will show that architectural environmental variables have a signifi cant impact on test scores and positive behaviors in the classroom. Lighting is one environ-mental variable that is related to multiple other aspects of design. Variables such as air, material,
and comfort are also often addressed within light design.
The research also indicates positive improvement in test scores and behavior with light that has a more natural appearance, with the highest test scores and behavior in natural light. Views of the
outdoors also contributes to better performance.
Despite the research, daylight is rarely effectively utilized in educational settings. Controlling the early design process by making daylight studies integral will allow designers to utilize and learn
about daylight.
Physical modeling is more practical in the early design phase because it does not require specifi ca-tion of all of the design features, allowing the designer to control the level of model input. Digital modeling and physics equations require specifi c information before they can be useful, making
them diffi cult to employ in the early design phases.
Allowing for the variables shown in the model will allow the designer to be as specifi c or as general as desired in the early design process. Controlling the level of input needed and the type of experi-ments performed will allow the designer to learn while using the model. It will also allow the same techniques to be used across multiple phases of the design process if needed, and in tandem with
other techniques as they may become more appropriate as the design process progresses.


7
Overview
This chapter will discuss how environmental variables such as light, air, sound, scent, material, and
comfort have an impact on performance and behavior in the classroom based on research and
case studies. In particular, a special emphasis will be placed on light, as it is the main focus of this
thesis. Air and sound have also been studied and researched as part of the project. Although no
design has been developed to account for improving air and sound quality in the classroom, as the
reader will see, the research strongly indicates that they have a signifi cant impact on performance
and behavior in the classroom as well.
CHAPTER TWOENVIRONMENTAL VARIABLES

8
Light
Lighting has an impact on behavior in education environments in many different ways. This section
will look at evidence of the impact of light on task performance using current research in addition
to some background on the properties of light. It will address intensity; glare; and the differences
between natural, full-spectrum, and cool-white fl uorescent lights. It will also suggest solutions for
improving classroom lighting.
LIGHTING BASICSLight intensity can vary from eight to 1,000 foot-candles in a single room. (Gifford, 337) Generally,
the eye can adjust to light changes quickly. Given enough transition time, students could read just
as quickly with a very dim three foot-candles (32 lux) of light as they could at 53 foot-candles (570
lux), which is the standard classroom light intensity (cite). However, a study (Gifford, 337) showed
that depending on placement in the room, and availability of natural lighting, This high variance
within a room can create fl uctuations of the eye causing strain on the eye. It also means that some
students receive adequate light levels while others do not.
There are many reasons why daylight has the positive effects described above. One is the body’s cir-
cadian rhythm. The body’s internal clock is dependent on the daylight cycle to know when to release
its hormones. Some of these hormones improve memory and others improve concentration. For
example, it is recommended to study for a few hours after six in the evening because this is when a
hormone that enhances long-term memory is released. Another hormone that improves concentra-
tion is released around ten in the morning. The presence of daylight allows the body to know when
to release those hormones. In addition to hormone regularity, seasonal affective disorder (SAD)
and depression is triggered by a lack of daylight. Children in windowless classrooms displayed
symptoms of SAD including restlessness and irritability. SAD is believed to be a major contributor to
absenteeism (Dudek, 35).
Despite the human body’s ability to adapt to light levels quickly, more natural light from windows re-
sults in 7-26% higher scores, and faster completion times on math and reading tests (Gifford, 339).

9
In addition, there is some indication that individual preferences may play a role in performance as
well. Generally, students who preferred dim light performed better in dim light. Likewise, students
who preferred more light, performed better in a more intense light (Gifford, 339).
LIGHT SOURCES AND THEIR IMPACTS ON PERFORMANCE AND BEHAVIORThe type of light source is another important factor in performance. Many classrooms use fl uores-
cent lighting that emit x-rays, radiation, and radio waves. These emissions decrease productivity,
cause fatigue, confusion, eyestrain, irritability, depression, and hyperactivity (Rapp, 227). See the
next section for more on issues that can arise from poor air quality. The noise emitted from ballasts
can also be a distraction. See the section on Sound for more issues that can arise from noise. In
addition, a small portion of the population may have sensitivity to fl uorescent lighting. Known as
photophobia, light sensitivity is usually a symptom of another condition such as corneal abrasion,
uveitis, meningitis, retinal detachment, or others (Lee & Bailey). The studies suggest the need for
better lighting conditions in the classroom.
One inexpensive way of reducing the need for fl uorescent lights is the utilization of natural light.
However, there are trade-offs which must be studied carefully, such as an increased glazing area
that may increase unwanted heat loss or gain if not designed properly. When designed properly, this
method is a more sustainable practice that can save energy and money. Another possible solution
is the use of full-spectrum lighting. Full-spectrum lighting has color rendition that is much closer to
natural light than fl uorescent lighting. Although it cannot capture the complexity of the natural light
spectrum, it spikes at each of the primary and secondary colors on the spectrum, as opposed to
cool-white which gradually rises in the blue area of the spectrum. Germany has banned cool-white
fl uorescent lighting in all hospitals and schools. Studies also suggest that shielding lighting and
the use of incandescent lighting can improve attention as well (Rapp, 228). Shielding also reduces
glare, making reading and concentrating on other tasks easier.
In one study (Mayron, 441-448) of the differences between typical fl uorescent lighting and full-spec-
trum lamps, 98 fi rst-grade students in four classrooms were fi lmed during routine classroom activi-
ties. Each classroom was windowless, two had cool-white fl uorescent lighting, and the other two had
10
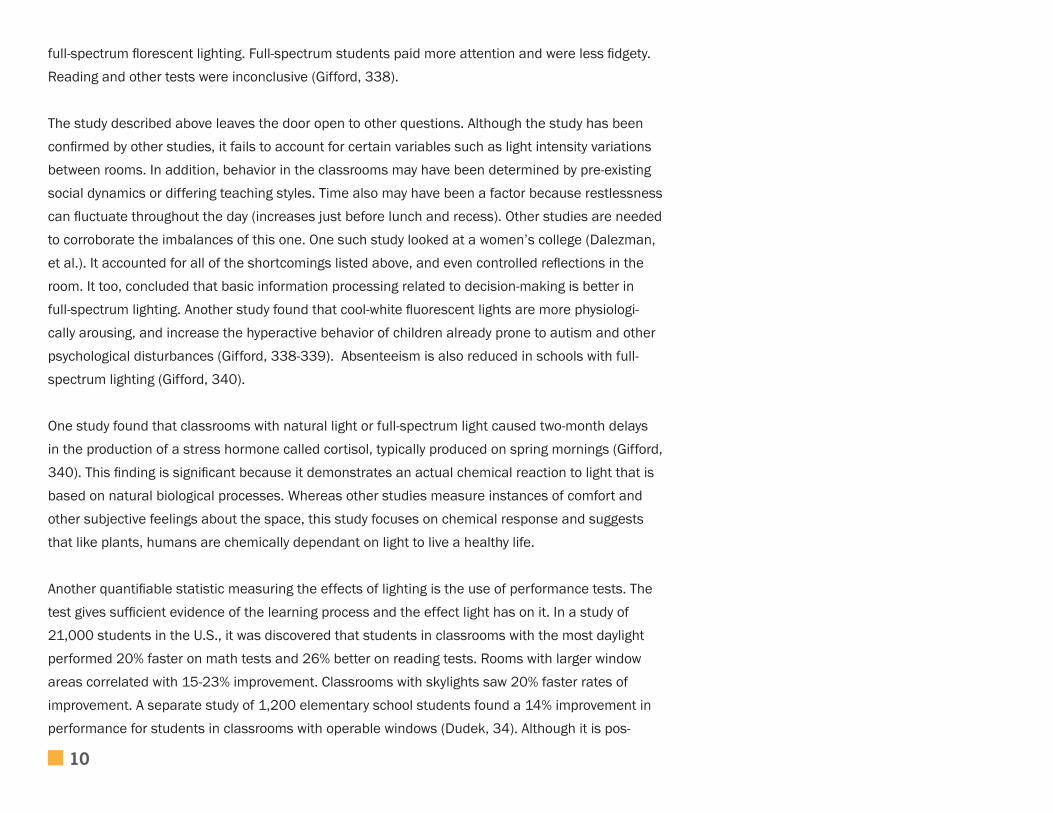
full-spectrum fl orescent lighting. Full-spectrum students paid more attention and were less fi dgety.
Reading and other tests were inconclusive (Gifford, 338).
The study described above leaves the door open to other questions. Although the study has been
confi rmed by other studies, it fails to account for certain variables such as light intensity variations
between rooms. In addition, behavior in the classrooms may have been determined by pre-existing
social dynamics or differing teaching styles. Time also may have been a factor because restlessness
can fl uctuate throughout the day (increases just before lunch and recess). Other studies are needed
to corroborate the imbalances of this one. One such study looked at a women’s college (Dalezman,
et al.). It accounted for all of the shortcomings listed above, and even controlled refl ections in the
room. It too, concluded that basic information processing related to decision-making is better in
full-spectrum lighting. Another study found that cool-white fl uorescent lights are more physiologi-
cally arousing, and increase the hyperactive behavior of children already prone to autism and other
psychological disturbances (Gifford, 338-339). Absenteeism is also reduced in schools with full-
spectrum lighting (Gifford, 340).
One study found that classrooms with natural light or full-spectrum light caused two-month delays
in the production of a stress hormone called cortisol, typically produced on spring mornings (Gifford,
340). This fi nding is signifi cant because it demonstrates an actual chemical reaction to light that is
based on natural biological processes. Whereas other studies measure instances of comfort and
other subjective feelings about the space, this study focuses on chemical response and suggests
that like plants, humans are chemically dependant on light to live a healthy life.
Another quantifi able statistic measuring the effects of lighting is the use of performance tests. The
test gives suffi cient evidence of the learning process and the effect light has on it. In a study of
21,000 students in the U.S., it was discovered that students in classrooms with the most daylight
performed 20% faster on math tests and 26% better on reading tests. Rooms with larger window
areas correlated with 15-23% improvement. Classrooms with skylights saw 20% faster rates of
improvement. A separate study of 1,200 elementary school students found a 14% improvement in
performance for students in classrooms with operable windows (Dudek, 34). Although it is pos-
11
sible that there are methodological fl aws (e.g., socioeconomic factors may be infl uence test scores
in wealthier school districts, that happen to be able to afford better quality architecture with more
natural light), these studies are strong evidence in support of the use of natural day-lighting to il-
luminate spaces.
GLAREGlare is an important issue. A study of teachers found that glare could lead to complaints of eye-
strain, nausea, and headaches (Gifford, 340). This is in addition to other studies that show glare
can have a negative impact on learning.
Because of the problems associated with glare, a consensus amongst authors is that glare should
be reduced and that school environments should have a light refl ectance value between 50 and
60 percent. There is also agreement that the brightness ratios should be uniform throughout the
room (Brubacker, 148). As mentioned earlier, this will help achieve more uniform lighting and create
equal opportunities for learning no matter where a student sits.
Glare, along with other factors, have at least one common problem, and that is the distraction of
light. Colors and lighting patterns should always supplement learning; they should provide some
stimulation, but not so much that it distracts. In general, materials and colors should be considered
based on their light refl ectance value. Floors should have a 20 to 30 percent refl ectance (Bruback-
er, 148). Carpet is one way of reducing refl ectance but it can cause problems in air quality and is
diffi cult to maintain. Natural wood has a refl ectance of 20-30% and could be considered. Other
materials such as stone and concrete have varying refl ectance making some of them suitable to be
considered as an alternative to high-refl ectance linoleum.
DAYLIGHTING STRATEGIESGiven this evidence of the benefi ts, both physical and mental, of natural light, several strategies
have been developed over time to help achieve effective daylight infi ltration. One method is to have
a one-storey building oriented along the east-west axis. This allows diffuse north light to enter and
for easily controlled south light. Another method is to place clearstory, skylight, or tall side windows
12
in the classrooms. It is also helpful to bring daylight in from multiple locations to help reduce the
chances of glare. Classrooms should always use indirect lighting to reduce glare. Light shelves can
also be used to bring light deeper into a room, and again, reduce glare (Dudek, 36).
The teaching walls, or the area where the teacher stands, should be the foreground, with remaining
walls fading into the background. Teaching walls should have a slightly lower refl ectance than the
rest of the walls. Since color variation can be benefi cial, this provides an opportunity to introduce a
color in the form of an accent wall. Benefi ts of this accent wall include: relief of eye fatigue, focus
of attention on the teacher, reduction in the overall glare refl ected from white boards, and provide
stimulation. It also reduces glare from natural light sources (Brubacker, 149). It should be noted
that the focus of attention on the teacher by using an accent wall should work well in a traditional
classroom using traditional teaching methods; however, classrooms with a focus on experimental
learning may not require focus on the teacher, but instead encourage a group interaction.
Furniture, doors, and walls should have a refl ectance value of 40 to 55 percent. The ceiling refl ec-
tance value should be 90 to 100 percent. Given these refl ectance values, the refl ective contrast
ratio would be 2.5 to 1. The refl ectance contrast ratio should never exceed 3 to 1. As a whole, the
room average should be between 40 and 60 percent (Brubacker, 149). These values will help mini-
mize distraction while providing clear and focused contrast between the background and the fore-
ground. These values can be used in the design process. The photographic techniques discussed
later in this book can use these values to determine if the light in a model will be suitable.
COLORIt is important to consider that when choosing color to understand that colors affect the body
differently at different ages so the selection of color should be based on the age of students that
will occupy the space. Secondary grades should have a cool-colored background, which has been
correlated to lowering heart and breathing rates (Brubacker, 149). One study of child-care centers
suggests that rooms with varied colors increase cooperative behavior as opposed to single colored
rooms (Gifford, 340).

13
The best approach to using color is to use a neutral color to allow the architecture to create the in-
terest. Colors for accents should be chosen based on a scientifi c process and not taste and trends
(Brubacker 149).
Warm colors are best in elementary schools as they have a diverting effect that “draws visual and
emotional interest outward” (Brubacker, 149). Cool colors have a passive effect that elicits bet-
ter concentration. Libraries and study halls, as well as other spaces where individual tasks are of
importance should be painted in cool colors (Brubacker, 149).
It is important to note the correlation to light and air quality. Lights and computer monitors (particu-
larly CRT displays), give off electromagnetic energy that attracts dust. Lights are often not cleaned
because of their location. It is important to use compressed air to dust light fi xtures when school is
not in session, and prior to vacuuming (Rapp, 229).
LIGHTING CONCLUSIONNumerous studies have linked learning behavior and performance in the classroom, as well as
chemical and biological fl uctuations, to light quality. Many schools consider fl uorescent lighting
because they are generally the most cost effective, but considering the results of some of the stud-
ies, an increase in test scores by even fi ve percent and in some cases, many more, may cause a
school to see the value in effective lighting. The balance between the need for daylight, the need
for ventilation, and the desire for a more sustainable environment can help infl uence school dis-
tricts to embrace daylighting as necessary, rather than a frivolous detail. Even in existing schools,
where daylighting may be impossible to add, changes from cool-white to full-spectrum fl uorescent
can be markedly benefi cial. Choosing new light fi xtures that reduce glare, enhance refl ectance, and
distribute light evenly, will be of great benefi t. These studies have shown the benefi ts of something
as simple as choosing proper colors and fi nishes for the next repainting, can be a good start in the
right direction.
This research provides suffi cient evidence that light, in particular, natural light has a positive impact
on performance and behavior in the classroom. Since light also corresponds to color, air quality,

14
materials, and comfort, in addition to its sustainable benefi ts, it became the focus of the thesis. The
following sections will demonstrate how other environmental variables such as air and sound also
impact performance and behavior in the classroom, but since they are not the focus of this thesis,
further evidence will be needed to determine how they can be effectively utilized. Chapter three and
four will then describe how light can be controlled and planned for early in the design process using
a physical model combined with metrics for evaluation.
NOTESBrubaker, C. William. Planning and Designing Schools. New York: McGraw-Hill Professional, 1997,
p148.
Dalezman, Jones, Belvig, Polf, and Keeny, cited in Gifford, Robert. Environmental Psychology: Prin-
ciples and Practice. 4th ed. Optimal Books, 2007, p 339.
Dudek, Mark. Schools and Kindergartens. Boston: Birkhauser Boston, 2007, p35.
Gifford, Robert. Environmental Psychology: Principles and Practice. 4th ed. Optimal Books, 2007,
p341.
Lee, Judith, and Gretchyn Bailey. “Photophobia (Light Sensitivity) - AllAboutVision.com.” All About
Vision: Guide to Eye Care and Vision Correction - LASIK, Contact Lenses and Eyeglasses. Ed. Vance
Thompson. 06 May 2009 <http://www.allaboutvision.com/conditions/lightsensitive.htm>.
Mayron, L.W., Ott, J. N., Nations, R., and Mayron, E. L. “Light, Radiation, and Academic Behavior.”
Academic Therapy. 10. 1974, p. 441-448.
Rapp, Doris J. Is this Your Child’s World? How You Can Fix the Schools and Homes that are Making
Your Child Sick. Bantam Books, 1996.
15
Air
This section will explore the different types of air issues commonly found in the built environment
and why it will offer evidence of the impact of air on performance. It will look at current research
and give examples of the consequences of poor air quality as well as suggest solutions to air quality
problems based on the available evidence.
AIR ISSUES AND THEIR IMPACT ON PERFORMANCE AND BEHAVIORIn the past, many studies have tied comfort to performance, including performance in the class-
room. The exact level of comfort is diffi cult to measure and therefore it may be diffi cult to establish
how performance increases or decreases as the comfort level changes. It is possible that with too
much comfort, one will become less productive. In fact, several studies refute the idea that the
most comfortable setting produces optimal performance in the classroom. A study of British class-
rooms found that performance increased at temperatures slightly below optimal comfort. The study
also concluded that performance increased when humidity was low with moderate air circulation.
Work settings found similar results (Gifford, 341). Despite the specifi cs on exactly what level of com-
fort is necessary, the studies show that the environment does indeed have an impact on behavior
and performance. Additional studies will show that the exact nature of that effect is dependant on
several different aspects of the air, including quality and temperature, as well as other factors.
In recent years, support for research on the links between environmental dangers and health in chil-
dren has been increasing. This is because health services researchers, environmental policy mak-
ers, and environmental economists have begun to notice the shortcomings of the lack of research
(OECD, 80). Because of the amount of time children spend in educational facilities; the quality of
the air in those facilities is of utmost importance. To illustrate the urgency of this issue, a 2005
study found that by improving air quality, absenteeism dropped by 15%, and test scores improved
by 5%. Other studies have confi rmed test score increases, reporting three to four percent increases
(Lawson). The positive benefi ts of air control are impressive in their own right but consider the num-
ber of schools without air control measures in place. In fact, more than 350 separate reports gave
schools less than a C grade for indoor air quality. This was consistent with an earlier report that

16
found that less than half of all schools had an indoor air quality program in place at all (Lewis). The
U.S. Government Accountability Offi ce reported that 14 million students (over 25%) in the U.S. at-
tend schools with air quality that is below standard or dangerous and that the air in 15,000 schools
is unfi t to breathe (Lawson).
In 2003, the Organization for Economic Cooperation and Development (OECD) conducted a re-
search project to evaluate the relationship between the environment and children’s health. From
this research, they determined that children and adults have different health risks due to different
exposures, susceptibility, as well as biological differences (OECD, 11). This means that when study-
ing air quality problems, schools are an important place to consider.
The OECD determined that children are especially susceptible to environmental health risks. This is
because children are more likely to be exposed to risks, more likely to be exposed to different risks
than adults, and the risks they are exposed to will have a greater effect on them than on adults
(OECD, 11). The different risks children are exposed to involve the nature of their interactions with
the environment , their inexperience, and a general lack of understanding about risks. For example,
a young child may crawl on the ground, exposing him or herself to dangers otherwise not threaten-
ing to adults. This part of risk exposure is not necessarily relevant to the air section of this thesis
but can be helpful in understanding the environmental risks to children in the educational environ-
ment. It also brings attention to the need for advanced cleaning procedures and policy decisions
that can help keep the learning environment a safer place. In addition to having an immune system
that can only become more tolerant and capable of detoxifying pollutants with age, environmental
hazards can have a greater impact on children than adults because of the total intake of pollutants
per unit of body weight can be greater. For example, although children have smaller lungs, they
breathe and circulate the contaminants of that air at a greater rate. Per unit of body weight, children
require a greater percentage of food, water, and oxygen (OECD, 11). This means that by the time air
quality is poor enough to warrant suspicion in adults, children already may have been feeling the ef-
fects. In addition, the symptoms can be less identifi able. Due to the qualitative differences between
children through puberty and adults; and the OECD concludes that susceptibility differences are
both substance specifi c and developmental stage specifi c (OECD, 42). Because children’s organs
17
are still developing, there also is a greater risk that damage resulting from toxins can be irreversible
(OECD, 41).
AIR POLLUTANTS
To understand exactly what air quality problems put children at risk, we will now look at several
common pollutants as well as their potential harmful effects and the solutions that can prevent
those harmful effects. Many toxic, irritating, and/or carcinogenic gasses can be found in the air. In
1994, an indoor air quality crisis occurred at the University of Massachusetts at Boston. The cause
of this crisis was the use of toxic agents in a poorly ventilated area. The chemicals were circulated
through a heating system return grate and remained for a sustained period of time because the
school had not used the fresh air intake system in years to save an estimated $600,000 in heating
costs per year (May, 6). Indeed, this example demonstrates the need for awareness of the types of
gasses that can be harmful.
One potentially hazardous gas is ozone (O3). Ozone is a gas made up of three oxygen atoms, as op-
posed to the two oxygen atoms (O2) that make up the oxygen molecules normally present in the at-
mosphere. It is created when electrical discharges split oxygen molecules into two separate atoms.
Each of these atoms then bonds with another molecule, creating ozone. Air purifi ers, laser printers,
and photocopiers all can produce ozone. It is important to be sure ozone is kept below 0.1 parts per
million because it can kill cells in the lungs, cause infl ammation, and cause people with asthma to
become symptomatic (May, 77-79).
Another harmful gas is carbon dioxide (CO2). In high concentrations (over 1,000 parts per million),
it can cause drowsiness and affect one’s ability to focus on tasks. Because people exhale carbon
dioxide, if the area is not properly ventilated, carbon dioxide concentrations can quickly rise to
problematic levels. For example, an unventilated bedroom with doors and windows shut can reach
2,000 ppm overnight with only two people sleeping in it. An unventilated classroom with twenty
students can quickly reach levels of over 3,000 ppm (May, 79-80). Adequate ventilation replenishes
this stale air with oxygen, keeping students focused. Green plants can also have a small impact in

18
reducing CO2 levels.
Not to be confused with carbon dioxide, carbon monoxide (CO), is a deadly, odorless gas that
reduces the blood’s ability to carry oxygen to vital organs. It is a gas given off by vehicles and is the
reason why a person should not leave a vehicle running indoors. Low-level concentrations of CO
can cause heart problems, depression, and psychosis. A greater concentration (3,200 ppm) initially
causes headache, dizziness, and nausea within ten minutes and unconsciousness and death in
less than half an hour. Fresh air is the only way to prevent high carbon monoxide levels. Generally,
faulty heating equipment usually is to blame for carbon monoxide poisoning, but it is possible that
air intake vents located near parking garages can increase the level as well (May, 80-81).
Nitrogen dioxide (NO2) is the brown gas that mixes with ozone to form smog from combustion
engines, notably, automobiles (May, 82). In 2005, a survey showed that increased concentrations
of nitrogen dioxide reduced school attendance and that low ventilation rates are linked to reduced
performance (Lawson).
Other combustible gasses such as methane, nitric oxide, formaldehyde, sulfur dioxide, and sul-
furous acid can all be present in the air if combustion equipment such as heaters and stoves are
not properly ventilated. In addition, research has shown that aggression, domestic disputes, and
psychiatric disturbances increase with exposure to unpleasant odor and photochemical oxidants
(Gifford, 303-304). Photochemical oxidants, hydrocarbons, ammonia, and amines are gasses given
off by many cleaning products and must be used carefully, in well-ventilated areas. Generally, policy
decisions can infl uence which cleaning chemicals are permitted in school buildings (May, 82-87).
Most gas-related air quality problems can be solved if attention is paid to ensure proper equipment
installation and maintenance. Ultimately, adequate ventilation is the best way to combat most air
quality problems.
ENVIRONMENTAL ALLERGENS
Another problem with indoor air quality is related to living allergens. There are many causes of
19
indoor air quality problems relating to allergens such as mold in an HVAC system, bacteria, or fungi
in carpeting. In 2001, the McKinley Elementary School in Connecticut was closed due to mold and
fungus allergens present in some areas of up to 25 times greater than found in outside air. Immedi-
ately before closing, absentee rates had risen to over 25%. A combination of the problems that will
be described below quickly exacerbated the situation, ultimately resulting in the school being per-
manently closed. Rather than remodeling the old school building for a cost of 3.5 million dollars, the
district decided against renovating the old building, originally built in 1928, and instead build a new
school for 21 million dollars (May 151-155). Some problem areas were in an addition to the original
school that was built in the 1970s. This is consistent with an EPA report that says mold increases
are likely due to substandard construction practices of the 70s, 80s, and 90s. This example shows
how simple allergenic organisms can have a disastrous effect on health and the economy if they are
allowed to fl ourish. An understanding of what these organisms are and what conditions cause them
to fl ourish is the fi rst step to ensuring they do not.
Environmental allergens are hazardous for all people, and potentially deadly for people with asth-
ma. Some studies have found an increase in the number of children with asthma in the past 20 to
30 years. In some countries the increase was slight, while in others, the number of instances has
nearly tripled. In the United States, approximately 4.8 million school-age children have asthma,
which amounts to one for every thirteen students. It is the leading cause of school absenteeism in
the U.S (OECD, 80). It is important to point out that asthma can have other sources than air pollut-
ants such as dietary allergens, which can account for some of the increase. The exact risk specifi -
cally due to air pollutants has yet to be determined (OECD, 52). It is however, safe to assume that
regardless of the causes of asthma, the increase is cause for concern.
Carpeting is a nest for dust, mold, and microbial growth, the kind of environmental allergens that
can cause or exacerbate asthmatic symptoms. In 2002, a study of Houston elementary schools
found high levels of dust mites in 20% of rooms. Carpet placed on concrete slabs can be problemat-
ic if there is no moisture membrane because many schools are closed during the summer and left
unventilated, dehumidifi ed, and un-air-conditioned. Moisture can diffuse through the concrete and
into the carpet. Depending on the relative humidity, mold and fungi will sprout in the carpet. Often,

20
carpets are cleaned during the summer, and reinstalled before completely drying as well. When
placed back into an unventilated classroom, mold and fungi will grow (May, 143). The presence of
a musty or stale odor is an indicator of the presence of mold. The best way to combat this is to not
install carpet, but a well-ventilated room is always necessary. Fragrances to cover the musty, stale
odor are not a substitute for an effective air handling system. They are often used in restrooms but
sometimes employees use them to cover odor that may be an indicator of a greater problem. For ex-
ample, a musty smell in the basement may be an indicator of mold in addition to being unpleasant.
Covering the unpleasantness with a fragrance simply masks the odor but does nothing for occupant
health. A more common misconception is the use of air purifi ers. An air purifying system removes
particle matter using a fi lter but the air itself is not clean of the environmental allergens (May, 151).
An often-overlooked aspect of air quality is pest control. A study of Baltimore schools found that
69% of the buildings contained measurable amounts of roach allergens in the dust. Kitchens could
bring cockroaches and other pests. Aside from the bacteria and other problems caused by contact,
roach allergen presence gives off allergens. About half of people with asthma are sensitive to those
allergens (May, 141-142). Properly sealing the building and the implementation of proper policy can
help curb this nuisance.
VENTILATIONProper ventilation is the most obvious remedy for schoolrooms that are problematic when it comes
to air quality. Science labs, machine shops, kitchens, and even administrative offi ces all have high
potential for air quality problems. Proper space planning can help as well. Since ventilation of these
areas will require more than the typical air handling system, by grouping these areas near each
other, the same system can be used for all. Some of these methods for solving gaseous and living
agitators of air quality will also help curb thermal discomforts. For example, operable windows are
the best way to ensure adequate ventilation, as well as thermal comfort. In colder climates, a me-
chanical system is necessary for ventilation because of the need for thermal comfort.
HEATING AND COOLINGTemperature is the most-researched weather-related effect on people’s behavior. According to the

21
United States Riot Commission, all but one of 1967 riots started at temperatures above 800 F. The
result of this study prompted another study that studied riots over a four-year period that concluded
that riots did increase with temperature. Violent crimes such as assault, burglary, and rape occur
more often when temperatures rise above 850 F and another study shows that baseball pitchers
hit twice as many batters when temperatures rise above 900 F (Gifford, 303). From this evidence, it
seems likely that if higher temperatures lead to higher aggression, learning environments will like-
wise be affected (Gifford, 303-304).
Ensuring schools are at the proper temperature and humidity can ensure the optimal learning
environment. Studies have shown that elementary school children perform more poorly at language
tasks in warmer temperatures. In schools without temperature control, a research study concluded
that the temperature affected spelling, language, reading, and math abilities (Gifford, 342). Some
suggest that occupant control is the best way to improve performance (Santamouris). However, in
schools where 25 students may occupy a single classroom, it seems implausible to give each one
individual control. It is also very plausible that students may not adjust temperature in the interest
of what is best for learning. In addition, it becomes increasingly diffi cult to ensure proper air quality
control if the occupants are given control rather than allowing computerized control of the systems.
One study looked at temperature and gasses together. In 2000, that study showed that an increase
the outdoor air fl ow rate from 1.3 to 11.5 1/s lowers asthmatic risks in school children. Another
study found a signifi cant correlation between measured room temperature, higher perceived tem-
perature, lower air movement, more odor, and poorer air quality in computer classrooms. It was also
noted that females were more likely to report indoor air quality dissatisfaction as well as related
illness. The study concluded that computer classrooms must be air-conditioned with a signifi cantly
high ventilation fl ow (at least 10 1/s) and that CO2 levels must remain below 1000 ppm. It also
concluded that there is a possible loss of learning ability resulting from poor indoor air quality
(Norback). It is evident based on this that temperature, gasses, and allergens all have an effect on
comfort, behavior, and learning ability in children.

22
AIR CONCLUSION
Both mechanical decisions and policy decisions can be used to improve indoor air quality, and pre-
sumptuously, comfort, behavior, and learning ability. These include: thorough and frequent cleaning
and vacuuming, having a duct work cleaning schedule, replacing fi lters often, using only environ-
mentally approved cleaners, reducing chemical use, keeping material data safety sheets (MSDS),
using biological pest controls, and raising temperatures over 900 F, provided the indoor humidity
levels are low, periodically when school is not in session to “bake-out” molds and chemicals. Some
mechanical decisions include installing exhaust systems, ventilation systems, air-purifi cation sys-
tems, dehumidifi ers, and using natural ventilation (Rapp).
There have been many studies linking student performance and attendance to air quality. It has
also been shown that many schools currently do not have adequate air quality. The most common
air quality problems are related to carbon dioxide, and mold. It seems apparent that the best solu-
tions to air quality problems are to increase ventilation. Schools should be designed with airfl ow
and temperature in mind fi rst, and materials should be carefully chosen to reduce mold presence.
Finally, a program of policy decisions regarding cleaning and maintenance should be implemented
to ensure continuing air quality. Further evidence is needed on what techniques are available for
controlling air quality.
NOTES
Economic Valuation of Environmental Health Risks to Children. Alexandria: Organization for Econom-
ic Cooperation & Development, 2006, p80.
Gifford, Robert. Environmental Psychology: Principles and Practice. 4th ed. Optimal Books, 2007,
p341.
Lawson, Scott H. “Why schools should breath easier: schools face a much wider variety of possible
indoor air quality problems than typical adult workplaces. (Going Green).” New Hampshire Business
Review. 30 (2008).

23
Lewis, Anne C. “School Air Quality.” The Education Digest. 47th ser. 71 (2006).
May, Jeffrey C. My Offi ce is Killing Me! : The Sick Building Survival Guide. New York: Johns Hopkins
UP, 2006, p6.
Norback, Dan. “An experimental study on effects of increased ventilation fl ow on students’ per-
ception of indoor environment in computer classrooms.” 15 Apr. 2008. Blackwell Munksgaard.
07 Sept. 2008 <http://www3.interscience.wiley.com.gate.lib.buffalo.edu/journal/120122854/
abstract?cretry=1&sretry=0>.
Rapp, Doris J. Is this Your Child’s World? How You Can Fix the Schools and Homes that are Making
Your Child Sick. Bantam Books, 1996.
Santamouris, Mat, ed. Advances in Passive Cooling. Detroit: Earthscan/James & James, 2007.
Sound
SOUND BASICSSchools have many different types of spaces and they have different acoustic issues. It is best to
avoid sharing spaces that require different acoustic needs. For example, a cafeteria or gymnasium
requires sound damping, while an auditorium requires amplifi cation (Grondzik, 844-846). One
reason for the importance of acoustics in design is that the body perceives sound more quickly than
other senses. Middle frequencies can be heard at three milliseconds. 160 milliseconds are required
to react to touch (Dudek, 28). As people age, higher pitches become inaudible. Younger students
can actually hear higher pitched noises that are inaudible to adults. This means that a high pitched
noise emanating from a light ballast or HVAC system may be annoying and distracting to a student
taking a test but the teacher may not even notice (Grondzik, 733). News outlets recently reported
on cell-phone ringtones that are now available that are such a pitch audible to students but not
teachers, preventing students from getting in trouble for having a ringing phone in class. Of course,
this is not benefi cial to the other students in class.
24
Sound and noise reduction are important issues in classroom design because of many different
types of spaces in a school, the quick perception of sounds, and the wider range of pitch recogni-
tion in children. An inclusive environment facilitates these for everyone. If a person cannot see or
hear because of a disability, it is of utmost importance to ensure the senses that are available to
him or her are of the highest quality. A student who cannot see must rely solely on sound for instruc-
tion, so that sound must be free of distracting echoes, background noise, or noise from another
room. This section will explore the basics of sound, and common sound problems in buildings. It will
also suggest remedies to the common acoustical challenges.
AIR-BORNE SOUND ISSUES, IMPACT, & SOLUTIONSBackground noise accounts for the majority of sounds in the built environment: computers, HVAC
systems, and lighting. Vehicles and wind can add to the noise, even with the windows closed.
Sometimes, background noise is acceptable because, it blends into the background. If it is a
constant tone, and if it is quiet enough, many can ignore it. A repetitive sound is different though.
Constant clicking, or snoring are examples of a repetitive sounds. They are particularly irritating
because the brain is constantly working to process them as information. For background noises, the
brain has the ability to dismiss the constancy as unimportant, irrelevant information, whereas every
time a repetitive noise reoccurs, the brain is again stimulated. This is similar to odor. For example,
the brain tunes out the smell of one’s own cologne or perfume throughout the day. Likewise, light
information is easy for the brain to adjust to. When entering a dark room, a person is fi rst blinded,
and then the brain and eye adjust, processing the information better with time. If the lights con-
stantly fl ashed on and off, this would not happen.
To understand the reasons why sound has an impact on performance, we must examine what
exactly sound is. Sound is created by small pressure changes in the air, similar to a water wave. The
vibration of the air transfers through walls and eventually to the eardrum, which vibrates with the
pressure changes. The brain then interprets these pressure changes as sound. Insulating materi-
als will help deaden sound by absorbing the vibrations.The characteristics of sound include loud-
ness, quality and pitch, similar to light’s characteristics of intensity, luminance, refl ectance, and
hue. Loudness is dependent on the energy of the sound and how far the eardrum moves in and
out. This is like a large speaker with the volume turned up. As the volume increases, the vibration of
25
the speaker becomes more visible. The pitch determines how fast the eardrum moves. When pitch
is so low that it is inaudible, it can actually cause mild stress, fatigue, and nausea (May, 69-71). In
fact, sound energy can be deadly. 130 decibels is the equivalent of standing directly next to a jet
engine and the vibrations are so intense that the body will be in pain. 150 decibels causes immedi-
ate loss of hearing (Grondzik, 748). The study of acoustics was actually popularized by the govern-
ment looking for a weapon that would send an invisible concentrated wave of sound that would
match the resonant frequency of human organs, causing death. Many are familiar with the collapse
of the Tacoma Narrows Bridge in Washington on November 7, 1940. The fl uctuations in the bridge
were caused by wind matching the resonant frequency of the bridge. The theoretical weapon had
the same principle in mind. The project was abandoned because there was no way to shield the
resonant frequency from non-combatants, and because it would be considered too cruel (Batta-
glia). Obviously, these examples do not refl ect dangers of school construction, but do represent the
extreme nature that sound can have. Loud noises or even ultra-high or low frequency sounds can
create unpleasant vibrations.
Two notes with close to identical pitches played at the same time creates a periodic change in am-
plitude that can cause stress. One such instance of this can be found in HVAC systems. Larger HAVC
systems have two fans, one for blowing air and one for removing air. The noises generated by the
fans are pure pitches. If the fans rotate at the same speed and the frequencies are close enough, a
beat is produced that creates stress. The same effect can be produced with one source. If a noise
is refl ecting off surfaces, the sound waves behave similarly to two waves. This creates confusion for
the listener because the brain is attempting to locate the sound. Since the sound is refl ecting, one
ear hears the sound, then the other, and they continue to alternate back in forth. The brain can-
not locate the sound which can result in stress and headaches (May, 72). Sound can also trigger
emotions as well as fl uctuations in blood pressure and respiration rate (Dudek, 28). Think of an
“energizing” song that gets a football player “pumped-up” before a big game. Fear, tranquility, and
sadness are some emotions that may be elicited by sounds.
Aside from automatic body responses, noise can also have behavioral responses. Noise, as op-
posed to informative sound, is simply sound that interferes with the sound that is desired. Studies
show that loud noise makes people walk faster and look straight ahead more. People were more

26
likely to give money to panhandlers at 72 decibels as opposed to 92 decibels outside of a construc-
tion site. The seriousness of a situation in which someone needs help is a factor as well. A study
was conducted where a researcher dropped books and counted how many people helped. The
experiment was conducted under normal sound background levels and again when a lawn mower
was running nearby. The experiment was repeated another time when a cast was placed on the re-
searcher. Twenty percent of passersby helped the cast-less stranger without noise. Only ten percent
helped with noise. When the stranger wore a cast, eighty percent helped without noise, and only
fi fteen percent with noise. This might mean that although a greater percentage will help if the situa-
tion is more serious, the gap interval between helpers and non-helpers increases greatly in a more
serious situation. The results documented by these tests assume the person recognizes the noise
and understands that if he or she moves faster, the noise will end sooner (Gifford, 304-305). In the
case of a building where noise is in the background with a student sitting at a desk, this would not
be the case. Although, one could hypothesize that the student would attempt to rush through a test
or reading faster to reduce the burden on the brain more quickly, but that is merely conjecture.
The most common noise problems in schools are reverberation within rooms and noise transfer
between rooms. Insulating rooms and sealing gaps is the best way to prevent noise transmissions
between rooms. Sealing gaps prevents “fl anking paths” which are areas such as under doorways or
the cracks around a light switch that allow sound to pass through directly regardless of the insula-
tion of the wall.
Reverberation within a room is much more diffi cult to address, and like lighting, is best addressed
in the early stages of design (Dudek, 28-29). Children generally enjoy a room with an acoustic
design that matches the room’s function. For example, children are more likely to yell in a reverber-
ant space and to be quiet in a room where sound is dampened. The creation of specifi c places for
specifi c functions and acoustical requirements are the fi rst step to effective acoustic planning. Sec-
ondly, speech recognition is improved if the source can be seen. This is because the lips and body
language provide additional cues to words. Knowing the speaker can see the listener also encour-
ages children not to converse either out of respect, or for fear of getting in trouble. Tiered seating, or
a raised speaker is one way to achieve this. Sounds should be directed towards the listener from all
directions. This means angling the ceiling and all walls toward the listener. Middle-range and high-

27
range frequency absorption can be accomplished by upholstered seating, carpets, curtains, and
textured walls. Low-range frequencies can be absorbed using slotted boards. Absorbing materials
should have a regular distribution. They should reduce reverberation time to 0.7 second for speech.
This time will change for music rooms and for different sized rooms. Speech should be twice as loud
as any background noise to be intelligible by most people. In addition, high ceilings help ensure
adequate sound quality (Dudek, 29-30).
As mentioned above, the optimum reverberation time changes with room function. Elementary
classrooms have an optimum time of 0.6 to 0.8 seconds. Lecture and conference rooms have an
optimum rime of 0.9 to 1.1 seconds. Auditoriums and general-purpose rooms have a necessary
time of 1.5 to 1.8 seconds (Grondzik, 776). Controlling reverberation often employs the use of
absorptive materials in addition to room shape. Some absorptive materials include acoustic ceiling
tiles, panel and cavity resistors, acoustic panel boards, acoustic plaster, sound baffl es, carpeting,
and drapery (Grondzik, 789-793).
Echoes are slightly different from reverberation. Echoes are produced when a refl ected sound at
high intensity reaches listeners 50 milliseconds after the direct sound is heard. Reverberation, on
the other hand, has a lower intensity. Echoes are most commonly caused by ceiling and back wall
refl ections. Damping on the back wall reduces echoes. In addition, an angled ceiling in the back can
lower the back wall height, and help direct sound waves in the right direction (Grondzik, 789-793).
STRUCTURE-BORNE SOUND ISSUES, IMPACT, & SOLUTIONSMost of the sound measures discussed here are airborne sound related. Another, often overlooked
aspect of noise reduction is structure-borne sound. The difference can be described using a cell
phone as an analogy. A cell phone set to “vibrate” is often heard as well. The vibration agitates the
airwaves, making a sound. When a person in a room is holding a vibrating cell-phone is his or her
hand, the sound is less audible than if the phone were on a table. This is because the table is a
better transmitter of sound than the air. The same is true with the building structure. A beam with
a industrial blower on top will transmit the sound along the beam, which in turn will make the noise
much more audible in rooms farther away. The most common structure-borne noise producers re
components of HVAC such as, fans, compressors, cooling towers, condensers, duct work, damp-

28
ers, mixing boxes, induction units, and diffusers. Pipes and elevators are additional common noise
producers. Floating fl oors, suspended ceilings, cavity absorbers, resilient pipe sealants, and cush-
ioned fl oor tiles all aid in damping structure-borne sound transmission. To reduce machine noise,
machines can be placed on vibration isolators that minimize the contact points between the ma-
chine and the fl oor. Baffl es, board liners, and glass fi ber honeycomb in ducts can reduce the noise
air makes when passing through them (Grondzik, 832-837).
SOUND CONCLUSIONThere are numerous studies in the fi eld of acoustics, and many that link sound to negative behav-
iors. Many schools attempt to combine spaces that have opposite acoustic needs such as a cafete-
ria, which needs to absorb sound, and a concert space that needs to direct sound in specifi c ways.
It is certain that there are better ways to arrange spaces that have the same fi nancial benefi ts of
combining spaces that are inappropriate to combine. Studies have shown the advantages of proper
acoustic design and that schools are important because of the various and complex acoustic con-
fi gurations of schools. Acoustic decisions should be based on calculations factoring in the complexi-
ties of every space individually to ensure the best possible condition. Further evidence is needed
to determine which techniques for controlling early design of sound work best, and how to make
common practices (such as insulating and installing HVAC systems) better for noise reduction.
NOTESBattaglia, Paul. “Environmental Controls 2.” ARC 475. Crosby Hall, Buffalo, NY. 2006.
Dudek, Mark. Schools and Kindergartens. Boston: Birkhauser Boston, 2007.
Gifford, Robert. Environmental Psychology: Principles and Practice. 4th ed. Optimal Books, 2007.
Grondzik, Walter T., Alison G. Kwok, and John S. Reynolds. Mechanical and Electrical Equipment for
Buildings. New York: Wiley, 2005.
May, Jeffrey C. My Offi ce Is Killing Me! : The Sick Building Survival Guide. New York: Johns Hopkins
UP, 2006.

29
Other Environmental Variables
Other factors of the architectural environment that may play a role in infl uencing performance and
behavior in the classroom include scent, color, materials, and comfort. Although all of these vari-
ables are factors in performance and behavior, this research thesis needs to be very specifi c in its
study to be useful, and these other factors can be studied more in-depth by others at a different
time.
Scent was briefl y discussed in the section on air, and generally speaking, if one controls airfl ow, one
can control odor. That is not to say that more pleasant, or bad odors do not have an infl uence on hu-
man performance and behavior, but in terms of built solutions, scent would be accommodated with
air. Further studies may be conducted in fi elds other than architecture on the introduction of arti-
fi cial scents to classroom environments. Likewise, color, unless determined by material, is applied
after construction. The idea of modifying behavior through the introduction of pleasing or agitating
colors has been studied by others and was not the focus of this thesis. In terms of built solutions,
the only role color plays is in lighting, which is the topic of this thesis, and as such, it is included as
a design variable for the physical model. Further research may need to be conducted to determine
the exact relationship between color (as perceived independent of light), and performance and be-
havior in the classroom. Materiality is considered very important to architecture. Is it possible that
materials, independent from their relationship to other environmental variables, have an impact on
performance and behavior? Further studies would need to be conducted to determine an answer.
With regard to light, materials are included as a design variable in the physical model because dif-
ferent materials may have different effects on the transmittance and refl ectance of light. Finally,
comfort is a broad category because it is dependent on all of the other environmental variables.
It is known that comfort plays a role in determining performance and behavior, but as far as what
specifi c interventions (cushioned chairs, etc.) can be a factor, further evidence is needed.
There may be more architectural environment variables that infl uence performance and behavior
in addition to the ones discussed in this chapter. The remainder of the thesis looks specifi cally at
natural lighting and how it can be controlled in the early design phase.


31
Overview
This chapter discusses different methods for controlling daylight, in particular, control in the early
design process. It discusses techniques for controlling daylight in the early design process such as
physical modeling, digital modeling, studying physics, and case studies. It takes a closer look at
physical modeling and the early studies conducted to develop the latest model version used in the
photographic studies.
CHAPTER THREECONTROL VARIABLES & TECHNIQUES
32
Control Variables
There are many ways to control daylighting. The recent popularity of sustainability has made com-
mon daylighting practices more prevalent in the lexicon of the average person. Practices like install-
ing light shelves, skylights, rooftop monitors, and other passive shading devices are well known in
the sustainability community. It is the author’s assertion that their utilization does not often account
for performance and behavior; rather, it often accompanies concerns for energy effi ciency. The
two do not always go hand-in-hand. Likewise, there is often no consideration for performance and
behavior in determining which practice is used.
This thesis proposes a physical model that allows for the imperial study of each of the daylighting
methods. The physical model also allows for studies on different sizes and placements of these
methods. The light entry methods and other design variables will be discussed in further detail in
chapter four.
It is important to recognize the different ways in which architects can control natural light. This the-
sis focuses on controlling the early design phase. By allowing light to be a factor before the building
and classroom arrangement has been determined, and before form and materials have been set,
they can all be chosen to effectively compliment the daylighting method. Generally, controlling early
design is accepted as better than adding features afterwards. This is true for most architectural
interventions. For example, window shades are an example of a late design decision that are too
generic to effectively distribute and control light in a specifi c way.
Other psychological controls are also plausible techniques that could have a signifi cant impact. The
idea of controlling one’s perception of light, or controlling the sequence in which one enters a space
may be important. For example, a hallway painted black leading to a 50% grey classroom will make
the classroom appear to be well lit. Whether this has a signifi cant impact on performance and be-
havior or not remains to be seen. Perhaps it does for a short period but the eyes may soon readjust.
Further evidence is needed. Other seemingly science-fi ction types of personal control may have
an impact as well. For example, body suits, integrated nanotechnology, and smart-sunglasses are
33
all technologies that are being studied in other fi elds, but may also have an impact on classroom
performance and behavior.
Again, this thesis will be looking exclusively at techniques for controlling the early design phase but
it is important to recognize control variables studied in other fi elds could also play an important role
in shaping light perception as well as performance and behavior.
Physical Modeling Technique
INCEPTIONThe physical modeling technique was determined to be the best technique for achieving the objec-
tives discussed in chapter four. It was also determined to be the best technique for controlling the
early design because it is a familiar tool to designers, especially in the early stages of design. This,
in combination with the failures of the other techniques discussed later in this chapter, led to the
decision to pursue it as the primary study technique.
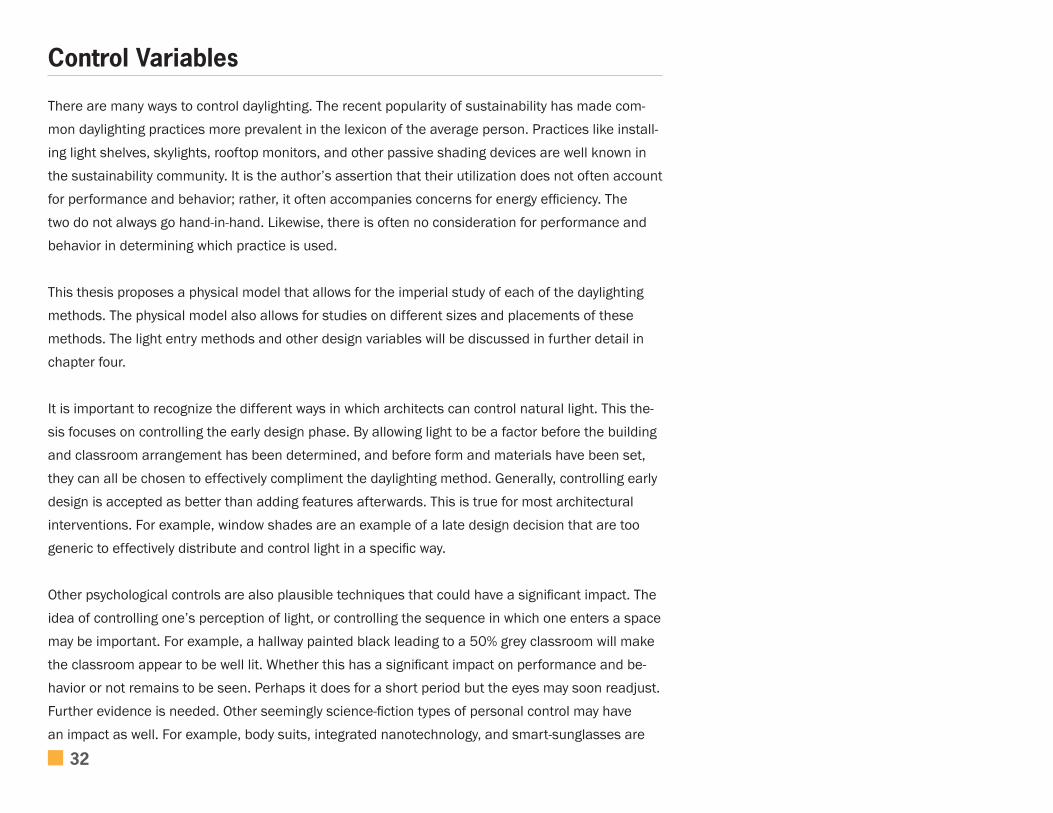
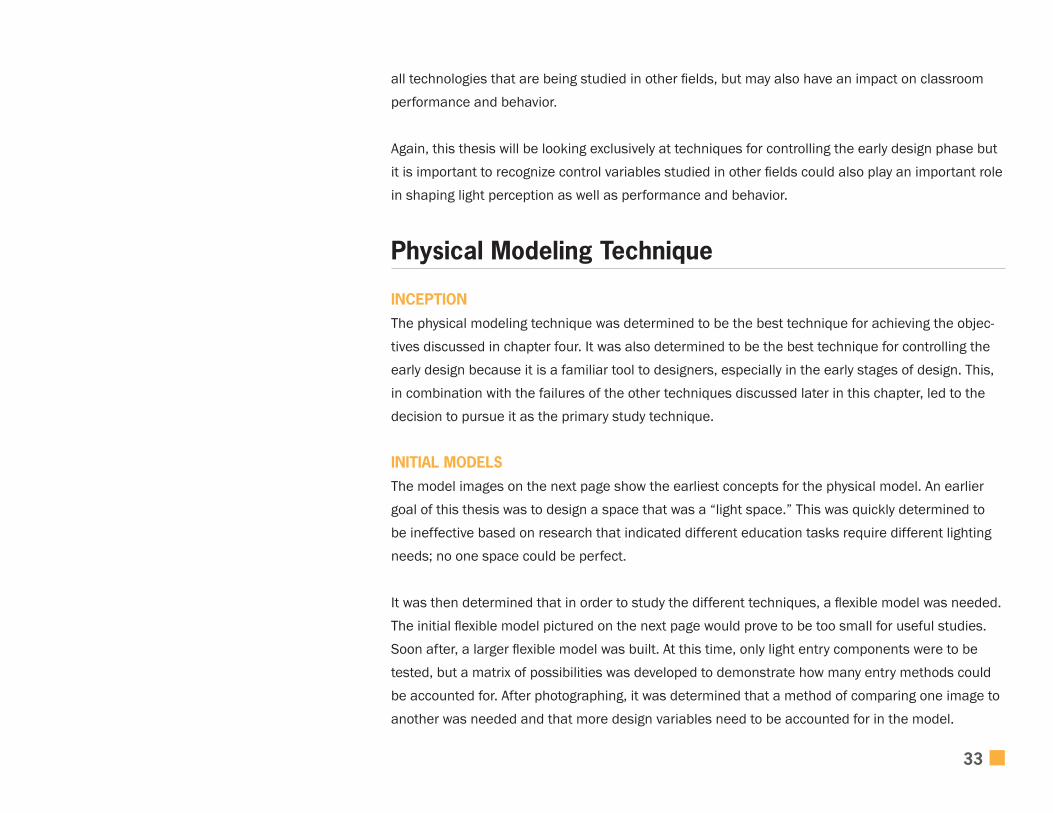
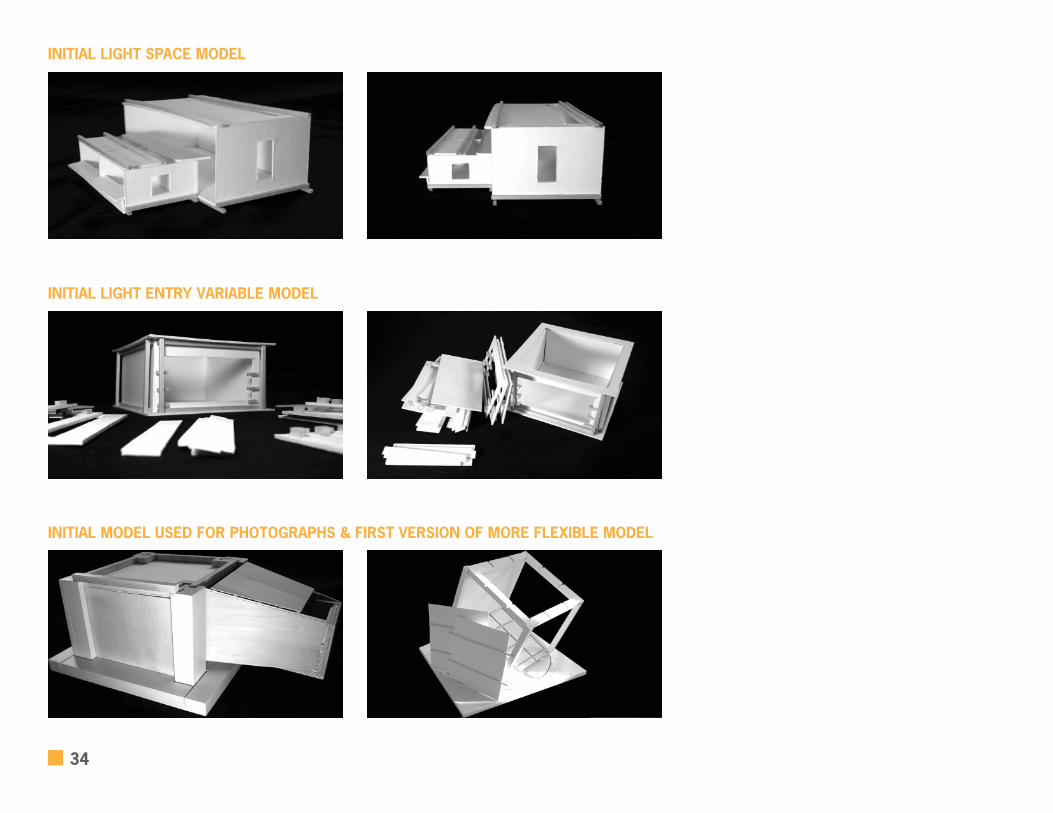
INITIAL MODELSThe model images on the next page show the earliest concepts for the physical model. An earlier
goal of this thesis was to design a space that was a “light space.” This was quickly determined to
be ineffective based on research that indicated different education tasks require different lighting
needs; no one space could be perfect.
It was then determined that in order to study the different techniques, a fl exible model was needed.
The initial fl exible model pictured on the next page would prove to be too small for useful studies.
Soon after, a larger fl exible model was built. At this time, only light entry components were to be
tested, but a matrix of possibilities was developed to demonstrate how many entry methods could
be accounted for. After photographing, it was determined that a method of comparing one image to
another was needed and that more design variables need to be accounted for in the model.
34
INITIAL LIGHT SPACE MODEL
INITIAL LIGHT ENTRY VARIABLE MODEL
INITIAL MODEL USED FOR PHOTOGRAPHS & FIRST VERSION OF MORE FLEXIBLE MODEL

35
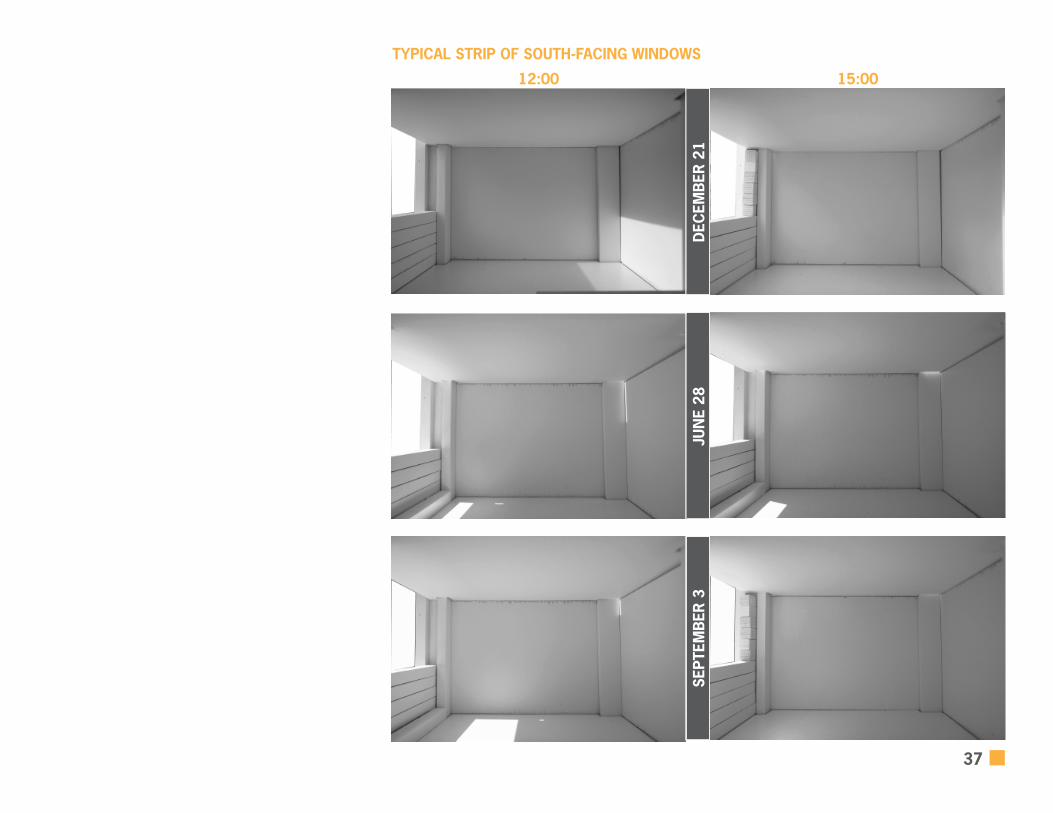
INITIAL MODEL USED FOR PHOTOGRAPHSThe matrix below illustrates the fl exibility accounted for in the initial photographic model. The
photographs on the following pages correspond to the times, dates, and positions indicated.
TIMES & DATES FOR ANALYSISSeptember 1 December 21 July 1
07:00 - 08:00 EST12:00 EST
14:00 - 15:00 EST
ABC
DEF
GHJ
Time
POSSIBLE COMBINATIONS OF SIDES TO LIGHT
East onlyWest only
23
South & East
South & North
East & WestEast & NorthEast & TopWest & NorthWest & Top
South, East, & WestSouth, East, & NorthSouth, East, & TopSouth, West, & TopSouth, North, & TopEast, West, & NorthEast, West, & TopWest, North, & TopSouth, East, West, & NorthSouth, East, West, & TopEast, West, North, & TopAll Sides
6
8
101112
1413
161718
202122
19
242526
23
27
South only 1
North only 4Top lighting only 5
South & West 7
South & Top 9
North & Top 15
LIGHTING METHOD USED
Light ShelfWindows
0.20.3
Partial Vertical CoverageSkylight
0.50.6
Horizontal Bars 0.1 Vertical Bars 0.4

36
Alt. open every 2
Closing top cornerAlt. closing top corner
4.e
5.a5.b
Alt. closed 4.d
Alt. closed every 2 4.f
BAR POSITIONS
Open at bottom / near sideAlt. open every other
1.a/6.a1.b/6.b
Alt. open every 4
Alt. closed every otherAlt. closed every 2Alt. closed every 3Alt. closed every 4Closed top & bot, open cente r
1.e/6.e
1.g/6.g
1.i/6.i1.j/6.j1.k/6.k
1.m/6.m
1.l/6.l
Open at top / far side
Alt. open every 21.c/6.c
Alt. open every 31.d/6.d
Open top & bot, closed center1.f/6.f
Open center 1.h/6.h
Open topClosing top
2.a2.b
Alt. open every 3
Low positions
Mid. positionsAlt. open mid. positionsFar side openFar side closedAlt. open
2.e
3.a
3.c3.d4.a
4.c
4.b
Closed center 1.n/6.n
Alt. open every other 2.cAlt. open every 2 2.d
Alt. open every 4 2.f
High positions 3.b
Description # Example (bars at position # ’s)
6,7,8,9,10,111,2,3,4,5
1,3,5,7,9,112,3,5,6,8,9,11
2,3,4,5,7,8,9,102,3,4,6,7,8,10,11
51,2,3,4,6,7,8,9,10,11
1,4,7,102,4,6,8,10
1,5,91,6,10
2,3,4,5,6,7,8,9,101,11
1,2,3,s1,2,3,s,10,11
1,2,3,s,6,91,2,3,s,5,7,9,11
1,2,3,s,7,111,s,6,11
1,2,3,4,5,111,7,8,9,10,11
1,2,3,9,10,111,2,3,5,7,9,10,11
6,7,8,9,10,111,2,3,4,5
1,3,5,7,9,112,4,6,8,10
1,4,7,102,3,5,6,8,9,11
37
12:00 15:00
DEC
EMB
ER 2
1JU
NE
28SE
PTEM
BER
3
TYPICAL STRIP OF SOUTH-FACING WINDOWS
38
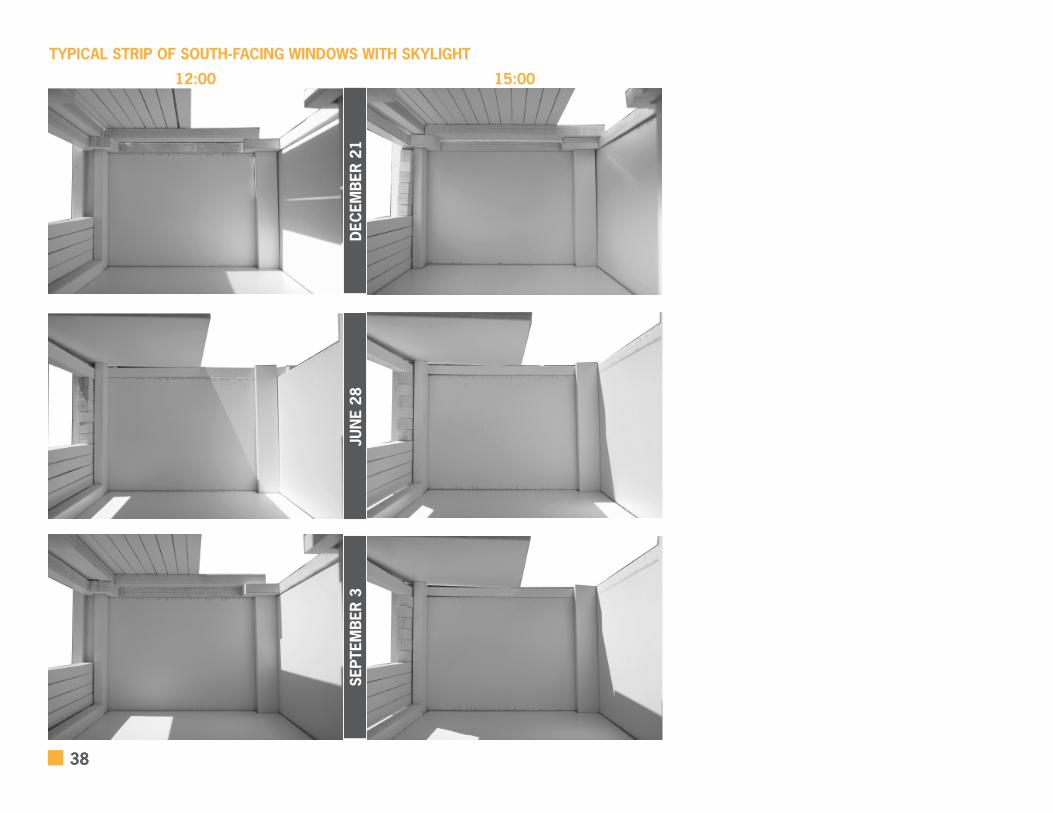
12:00 15:00
TYPICAL STRIP OF SOUTH-FACING WINDOWS WITH SKYLIGHT
DEC
EMB
ER 2
1JU
NE
28SE
PTEM
BER
3
39
Digital Modeling Technique
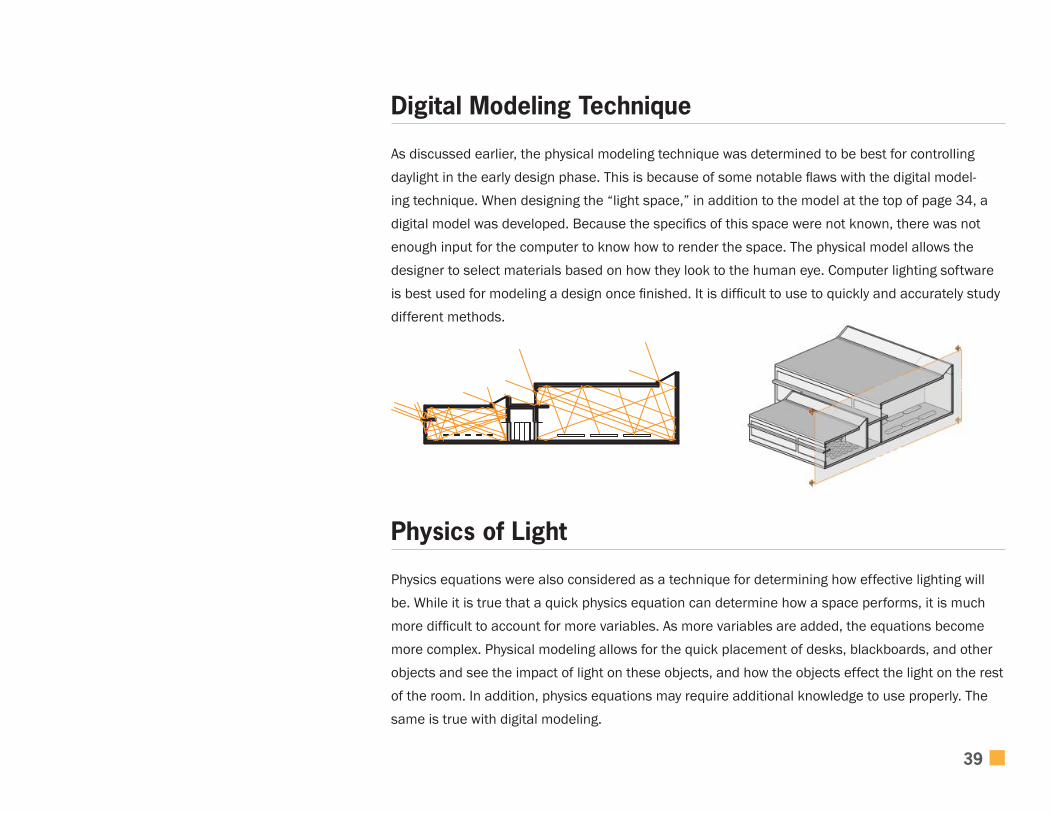
As discussed earlier, the physical modeling technique was determined to be best for controlling
daylight in the early design phase. This is because of some notable fl aws with the digital model-
ing technique. When designing the “light space,” in addition to the model at the top of page 34, a
digital model was developed. Because the specifi cs of this space were not known, there was not
enough input for the computer to know how to render the space. The physical model allows the
designer to select materials based on how they look to the human eye. Computer lighting software
is best used for modeling a design once fi nished. It is diffi cult to use to quickly and accurately study
different methods.
Physics of Light
Physics equations were also considered as a technique for determining how effective lighting will
be. While it is true that a quick physics equation can determine how a space performs, it is much
more diffi cult to account for more variables. As more variables are added, the equations become
more complex. Physical modeling allows for the quick placement of desks, blackboards, and other
objects and see the impact of light on these objects, and how the objects effect the light on the rest
of the room. In addition, physics equations may require additional knowledge to use properly. The
same is true with digital modeling.
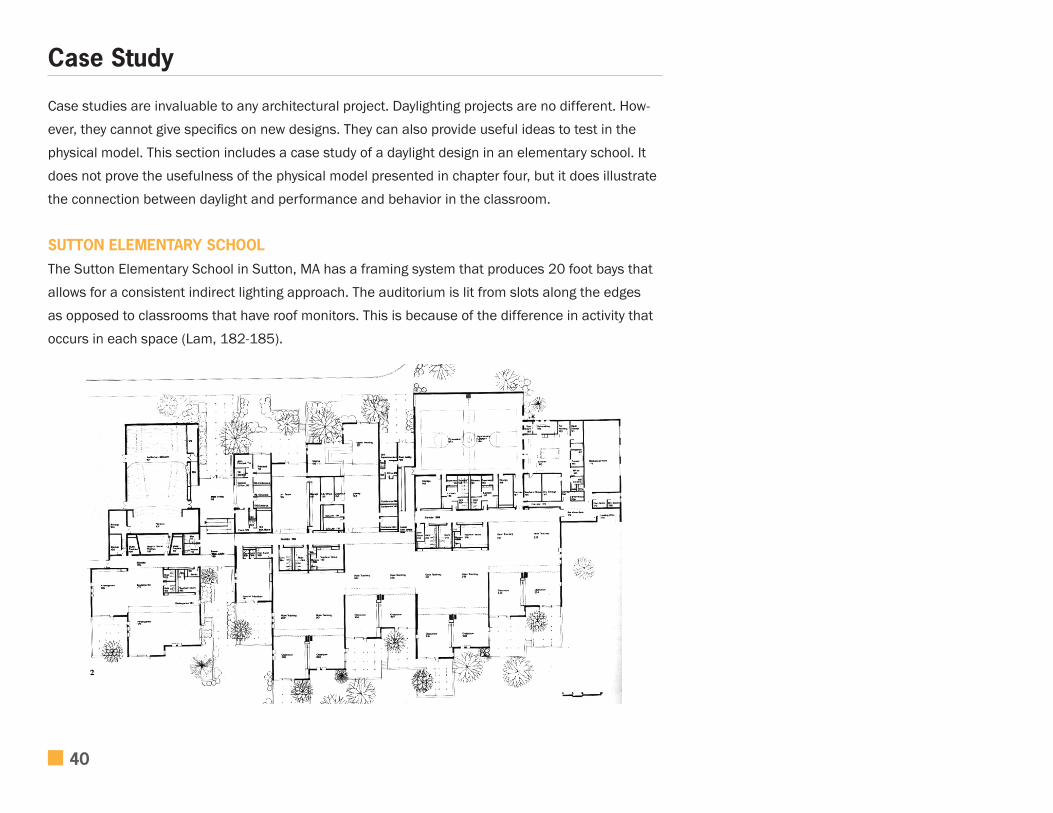
40
Case Study
Case studies are invaluable to any architectural project. Daylighting projects are no different. How-
ever, they cannot give specifi cs on new designs. They can also provide useful ideas to test in the
physical model. This section includes a case study of a daylight design in an elementary school. It
does not prove the usefulness of the physical model presented in chapter four, but it does illustrate
the connection between daylight and performance and behavior in the classroom.
SUTTON ELEMENTARY SCHOOLThe Sutton Elementary School in Sutton, MA has a framing system that produces 20 foot bays that
allows for a consistent indirect lighting approach. The auditorium is lit from slots along the edges
as opposed to classrooms that have roof monitors. This is because of the difference in activity that
occurs in each space (Lam, 182-185).
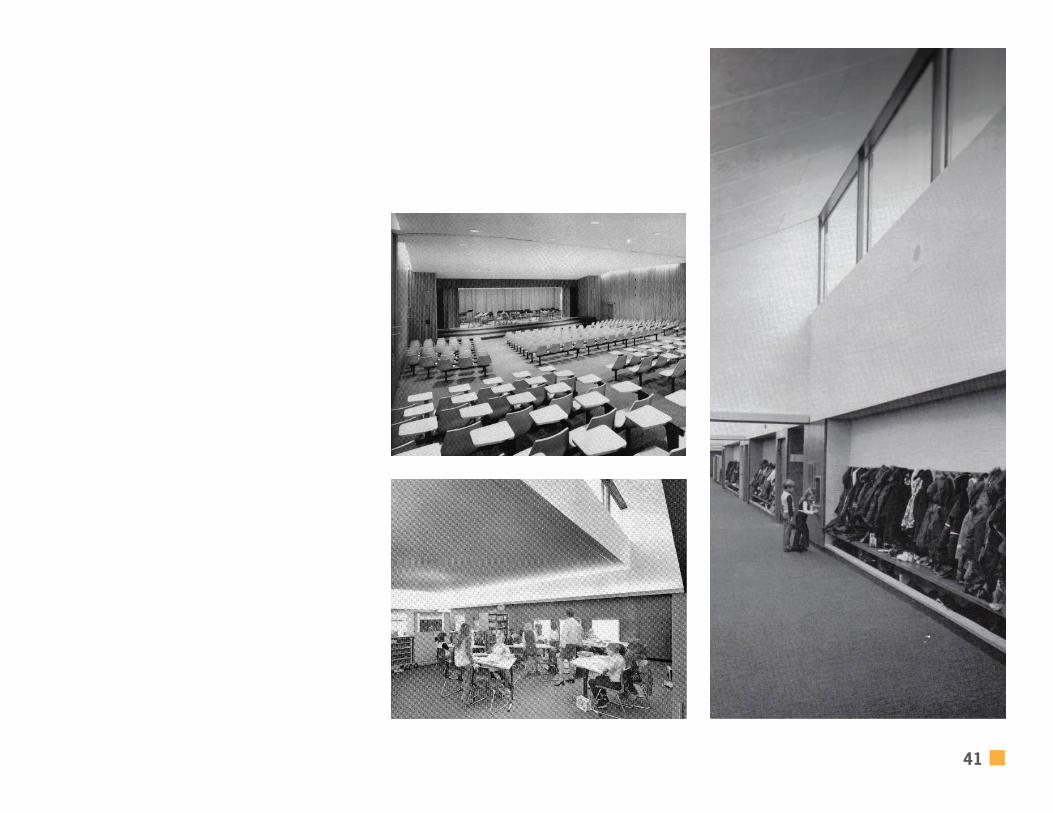
41


43
Overview
This chapter will establish the physical model objectives, describe the model’s process using its de-
sign variables, and give several example photographs of the pseudo color rendition technique. This
chapter represents the main work of the thesis. This thesis asserts that the physical model, given
its objectives, and in combination with pseudo color rendition, will aid in controlling the early design
of natural lighting for educational environments in order to have a positive infl uence on student
performance and behavior in the classroom.
CHAPTER FOURTHE PHYSICAL MODEL
44
Physical Model Objectives
FLEXIBILITY IN USEThe multiple design variables demonstrate the fl exibility in the model’s use. This is important be-
cause the model must account for many variables. To be useful as a design tool, the model must
allow the designer to be as fl exible as possible.
SIMPLE & INTUITIVE USEBy not requiring full knowledge of the physics of light, or the knowledge of and specifi cations
required by digital modeling, the familiar architectural language of the physical model renders it
simple and intuitive. This, along with fl exibility in use, are two of the seven principals of Inclusive
Design.
ALLOW STUDY & COMPARISON BETWEEN DESIGN VARIABLESThe plug-in components of the model can be photographed and compared. The process of pseudo
color rendering allows for easy comparison between design variables.
INFORM AND EDUCATE (DIDACTIC)As design variables are studied and compared, a new understanding of light behavior will be gained
allowing for quicker studies and experiments in the future and eventually leading to smarter design.

45
Process
STEP ONE: PROCESS FOR TESTING PREFABRICATED MODEL DESIGN VARIABLES
1.1: DETERMINE SCALE & DEVELOP DESIGN VARIABLES BASED ON NEEDAfter determining a base scale and site location, the designer develops wall components, roofs,
desks, people, other items in the room, different colored panels, or other design variables that
the designer wishes to explore. Below are images and drawings of example panels for the physical
model.

46
MODEL PHOTOGRAPHS
1.2: PHOTOGRAPH DIFFERENT DESIGN VARIABLESUsing a manual camera, the designer photographs the model, positioning it at different times of
day and year. He or she substitutes different panels one-at-a-time for a more empirical approach, or
carefully combines panels. The designer must ensure the same sky conditions for each photograph,
and ensure the same camera settings for each photograph. The same amount of light must enter
the lens for each photograph to ensure photographs can be compared later.
See page 176 of Concepts and Practice of Architectural Daylighting for more specifi cs on camera
position, exposure, and lenses. Note that this book only discusses analog photography. The pseudo
color rendition process will require digital versions of the photographs. Whether using analog or
digital photography, regardless of the settings, it is important to be sure that the camera is not auto-
matically adjusting to light, and that the manual settings are consistent for every photograph.
Examples of these photographs along with pseudo color renditions can be found starting on page
50.
Fuller Moore developed a similar model on page 171 of Concepts and Practice of Architectural Day-lighting. He also discusses measurement methods on page 174 including the use of light meters.

47
1.3: ANALYZE USING PSEUDO COLOR RENDITIONUsing photo-editing software, the designer applies a new color table to the one already on the
photograph. First, the photograph must be converted to black-and-white (not desaturated). This
eliminates hue information but maintains lightness and saturation of the image. Now, the black to
white spectrum is replaced with a new colored spectrum determined by the designer. This allows
the designer to more clearly see otherwise subtle changes in light.
The designer can control the new color spectrum. With this method, lighter appearing colors such
as yellow and cyan were given to areas where one would expect lighter conditions. It is more simple
and intuitive. It is very possible to reverse this, assigning darker colors to lighter areas, though this
is less intuitive. It is also possible to assign bands of a single color to certain values of grey. For
example, a green band could be applied to an area that is good for a particular task and red applied
areas too dark to perform said task to allow the designer to quickly see what areas are acceptable
and which are not.
Using Adobe Photoshop CS3, use the following steps:
1: Image > Mode > Greyscale
2: Image > Mode > RGB Color
3: Image > Mode > Indexed Color, Click OK
4: Image > Mode > Color Table
5: Select a new color table such as spectrum, or create your own. Check the “Preview” box to see
the changes while making them. To create your own table, simply select a shade of grey and
then choose a new color. Or, select a range of grey shades to apply a new gradient. When
selecting multiple colors, you will be prompted twice for a color. These will be the start and end
points for the new gradient. When fi nished, you can save the color table fi le. Likewise, you can
click “Load” to load a previously saved fi le. Click OK.
6: Image > Mode > RGB Color
See the examples of pseudo color rendition on the next page. Also, see the physical model analysis
using pseudo color renditions on page 50.
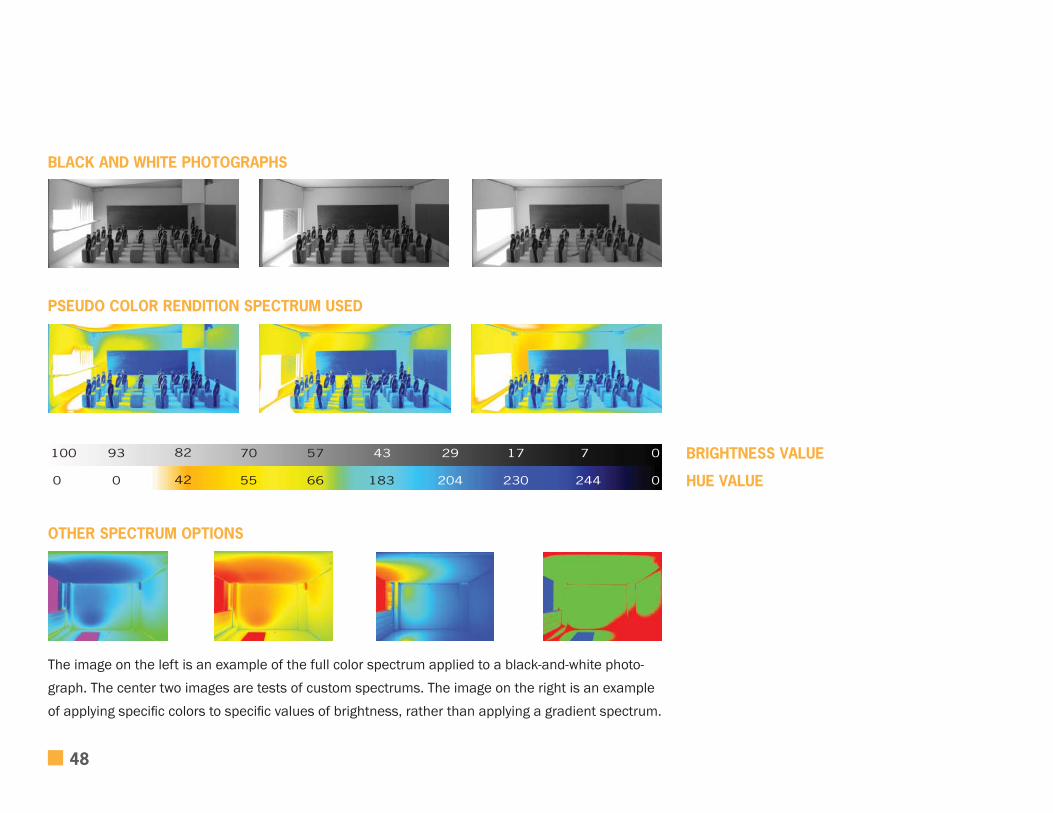
48
BLACK AND WHITE PHOTOGRAPHS
PSEUDO COLOR RENDITION SPECTRUM USED
93 82 70 57 43 29 17 7 0100
0 42 55 66 183 204 230 244 00
BRIGHTNESS VALUE
HUE VALUE
OTHER SPECTRUM OPTIONS
The image on the left is an example of the full color spectrum applied to a black-and-white photo-
graph. The center two images are tests of custom spectrums. The image on the right is an example
of applying specifi c colors to specifi c values of brightness, rather than applying a gradient spectrum.

49
STEP TWO: USING THE TEST MODEL BASE TO TEST A CUSTOM MODELOnce the designer has developed a set of design variable components that seem to work together
based on the pseudo color renditions, he or she can then build a more precise scaled model that
accounts for a greater number of other conditions.
Once this is complete, the model can be placed on the same base originally used for testing. Now
the custom model can be photographed and rendered in pseudo color to ensure the results expect-
ed are actually present. The designer can then tweak the details of the custom model as needed.
STEP THREE: DESIGNING FOR THE ENTIRE BUILDINGThe design used for one classroom will not work for all classrooms. The process must be repeated
for classrooms with different functions, sizes, and solar orientation. It is important to remember that
designing the building is not as easy as stacking each of these classroom blocks together. Some
areas such as corners, or rooms off courtyards may require special considerations. As the designer
assembles the classroom confi guration, there may need to be changes to the original design. In this
case, the change should be modeled and tested to see if it still accomplishes its initial goal.
It is also possible to use the solutions developed in the classroom to develop a concept for the rest
of the building if desired. For example, a unique window treatment with vertical expressions could
drive the facade materials and rhythm as well as set up an architectural language for the interior
spaces.
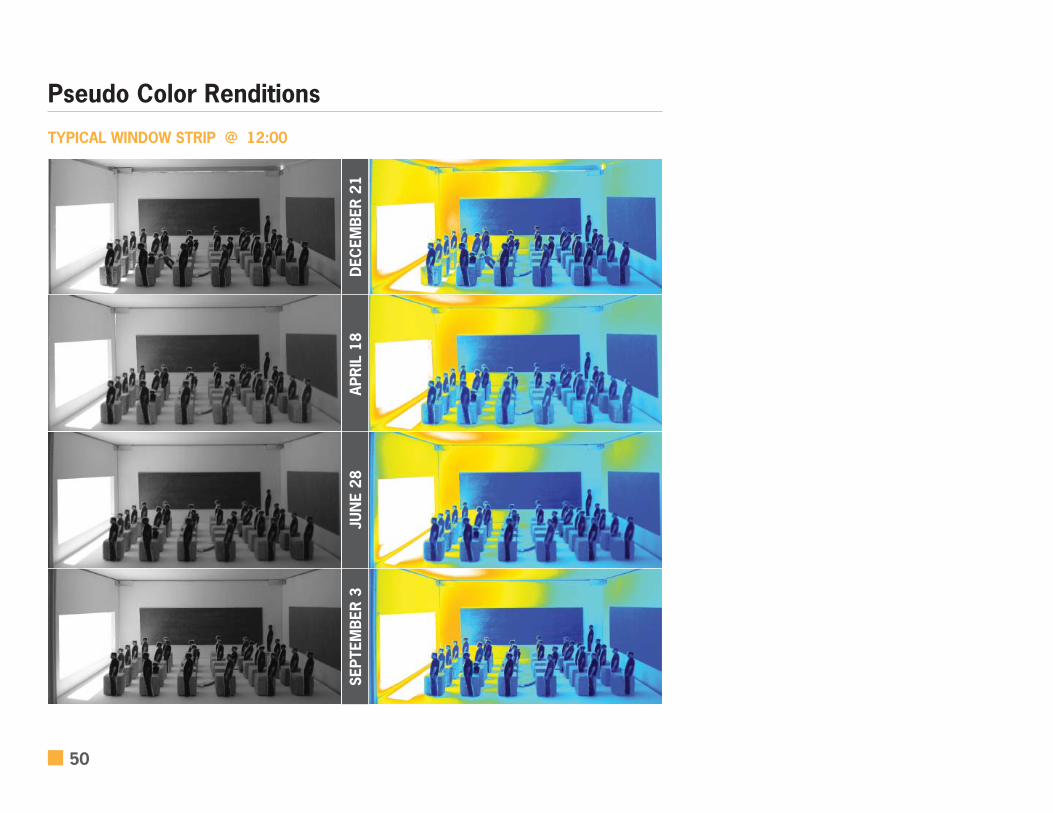
50
Pseudo Color Renditions
TYPICAL WINDOW STRIP @ 12:00
SEPT
EMB
ER 3
JUN
E 28
APR
IL 1
8D
ECEM
BER
21
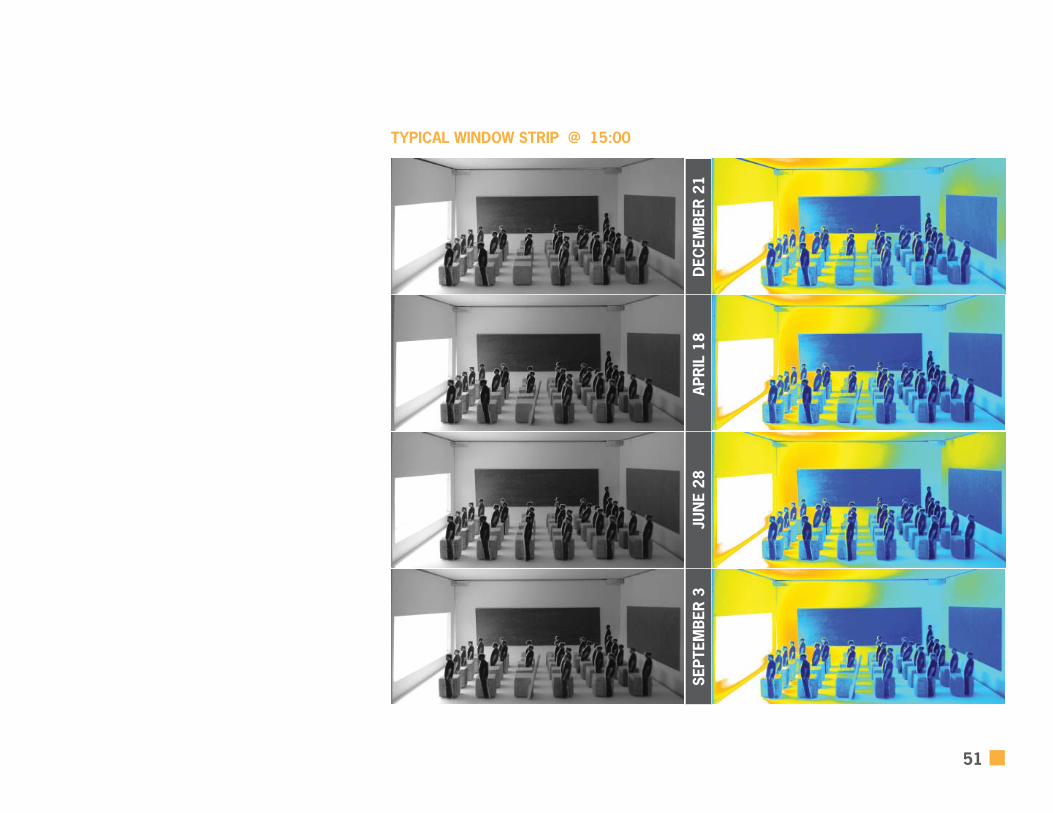
51
TYPICAL WINDOW STRIP @ 15:00
SEPT
EMB
ER 3
JUN
E 28
APR
IL 1
8D
ECEM
BER
21

52
Pseudo Color Renditions
TYPICAL THREE WINDOW CONFIGURATION @ 12:00
SEPT
EMB
ER 3
JUN
E 28
APR
IL 1
8D
ECEM
BER
21
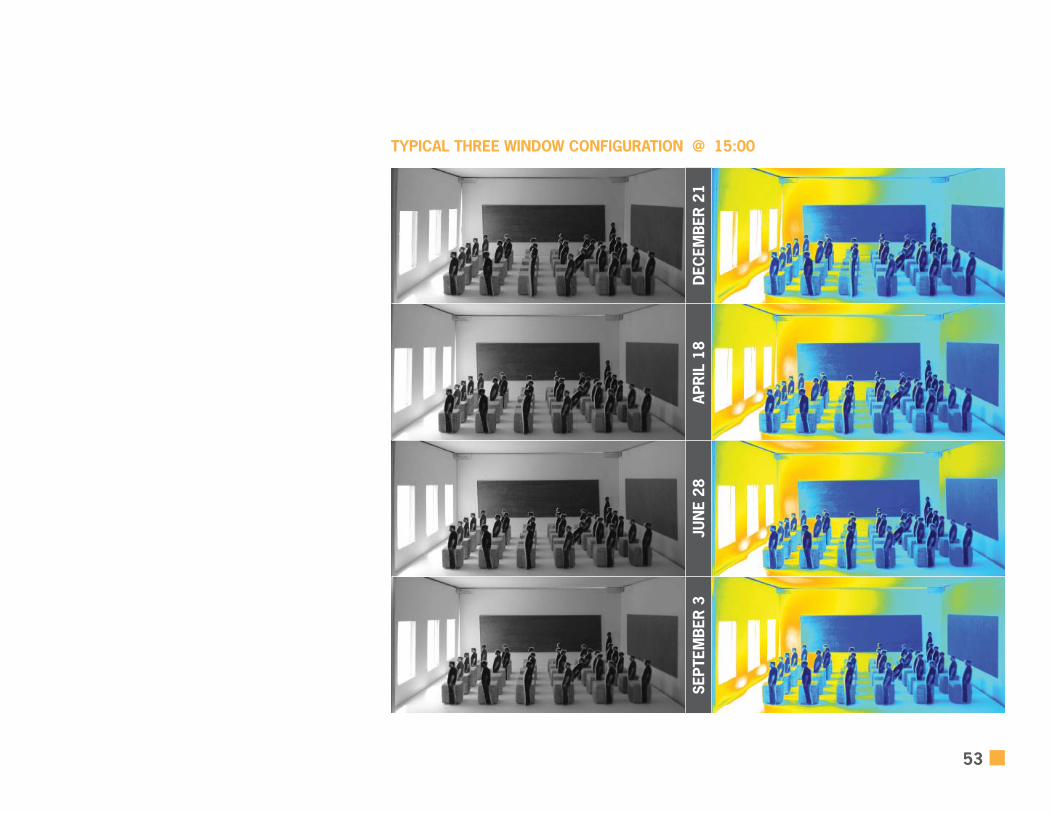
53
TYPICAL THREE WINDOW CONFIGURATION @ 15:00
SEPT
EMB
ER 3
JUN
E 28
APR
IL 1
8D
ECEM
BER
21

54
Pseudo Color Renditions
HALF EXPANDED METAL MESH SCREEN @ 12:00
SEPT
EMB
ER 3
JUN
E 28
APR
IL 1
8D
ECEM
BER
21
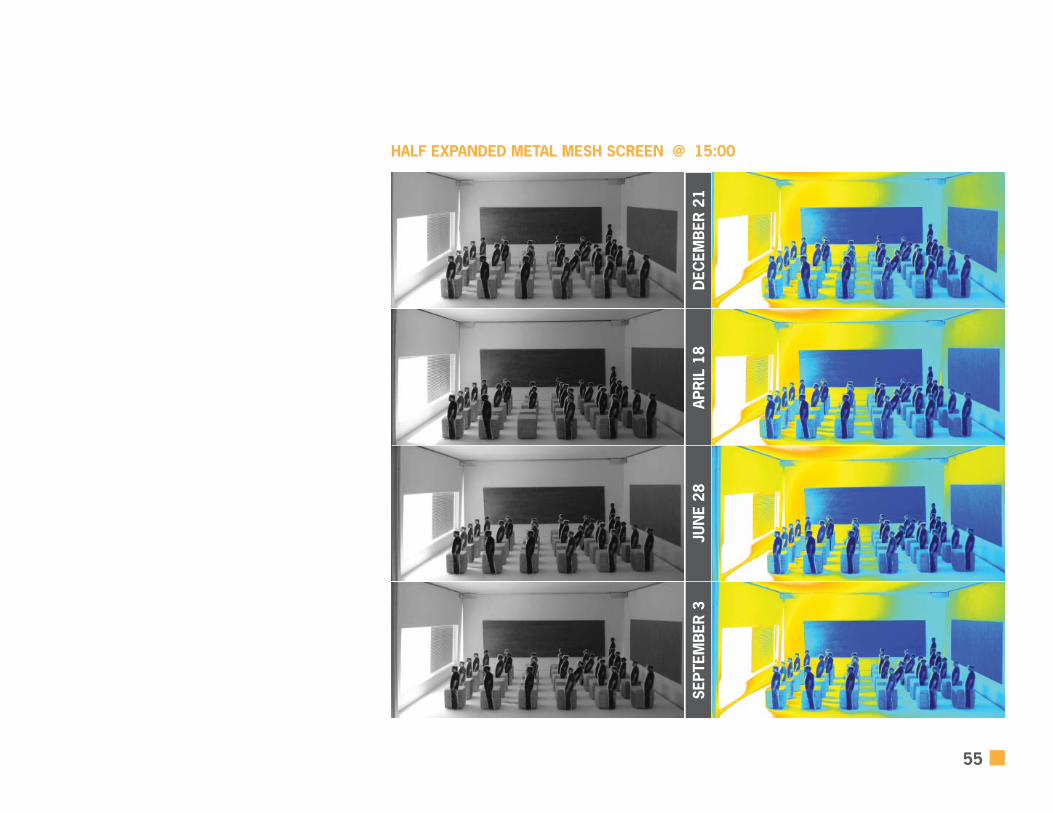
55
HALF EXPANDED METAL MESH SCREEN @ 15:00
SEPT
EMB
ER 3
JUN
E 28
APR
IL 1
8D
ECEM
BER
21
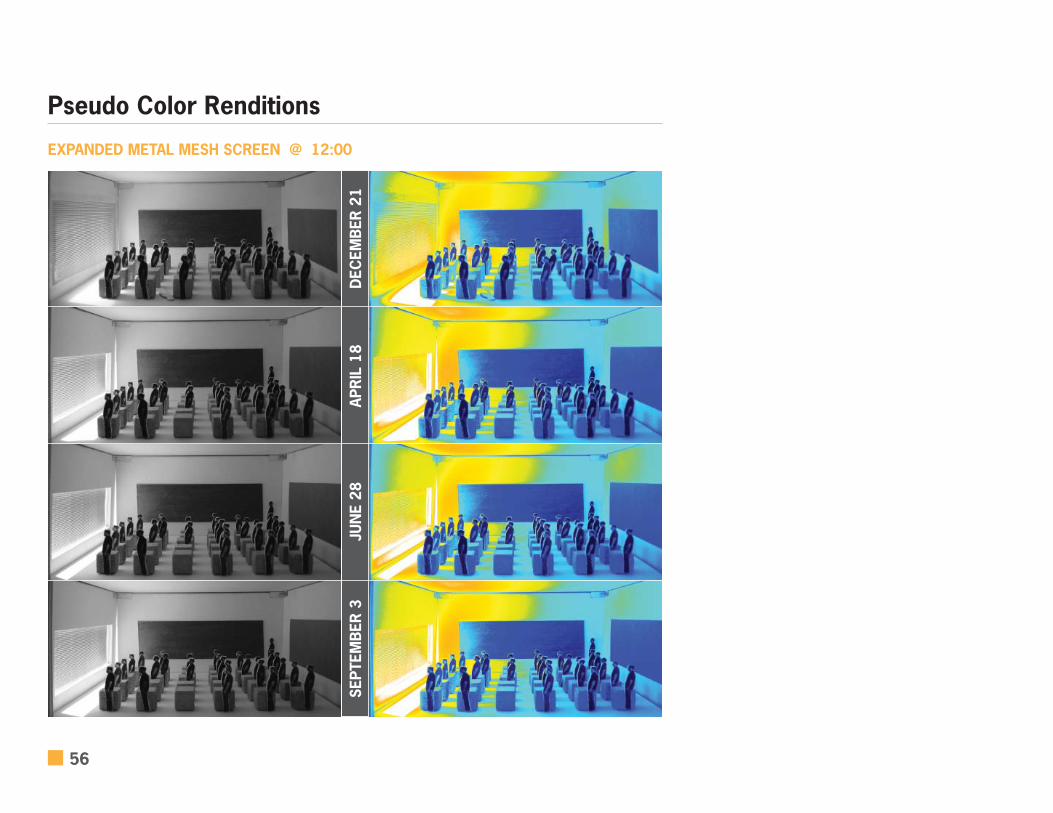
56
Pseudo Color Renditions
EXPANDED METAL MESH SCREEN @ 12:00
SEPT
EMB
ER 3
JUN
E 28
APR
IL 1
8D
ECEM
BER
21
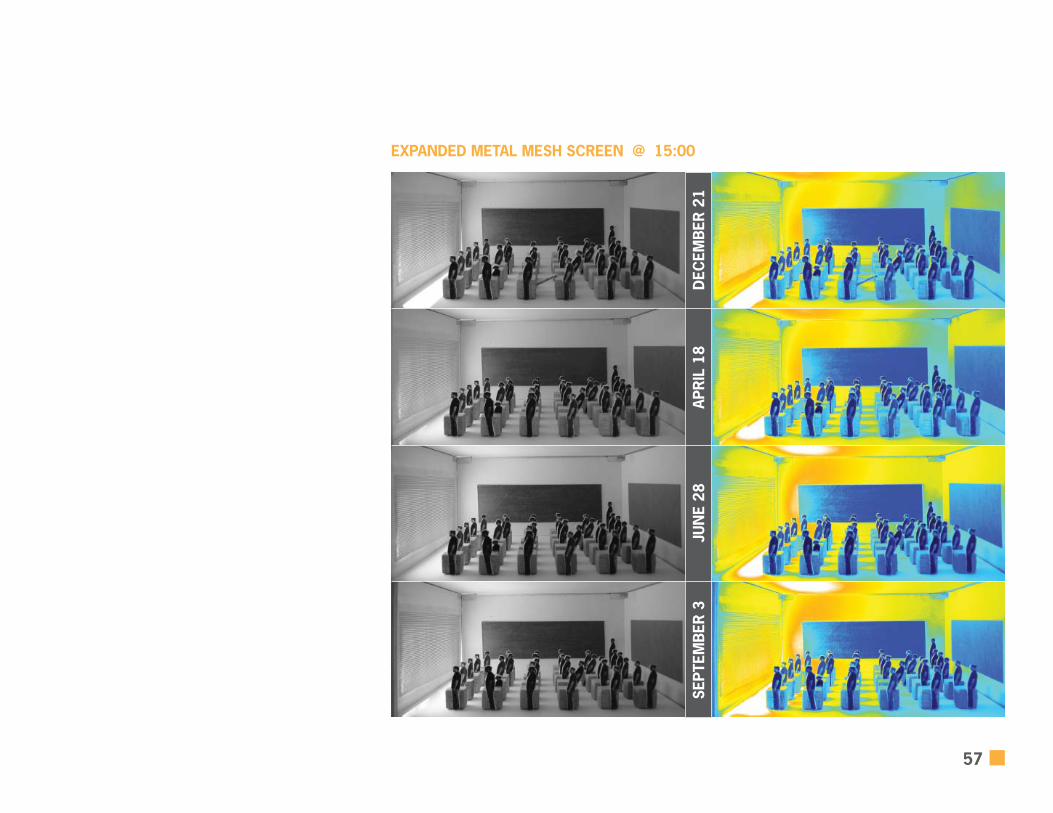
57
EXPANDED METAL MESH SCREEN @ 15:00
SEPT
EMB
ER 3
JUN
E 28
APR
IL 1
8D
ECEM
BER
21

58
Pseudo Color Renditions
LIGHT SHELF WITH LOUVERS ABOVE HALF OF SHELF @ 12:00
SEPT
EMB
ER 3
JUN
E 28
APR
IL 1
8D
ECEM
BER
21

59
LIGHT SHELF WITH LOUVERS ABOVE HALF OF SHELF @ 15:00
SEPT
EMB
ER 3
JUN
E 28
APR
IL 1
8D
ECEM
BER
21
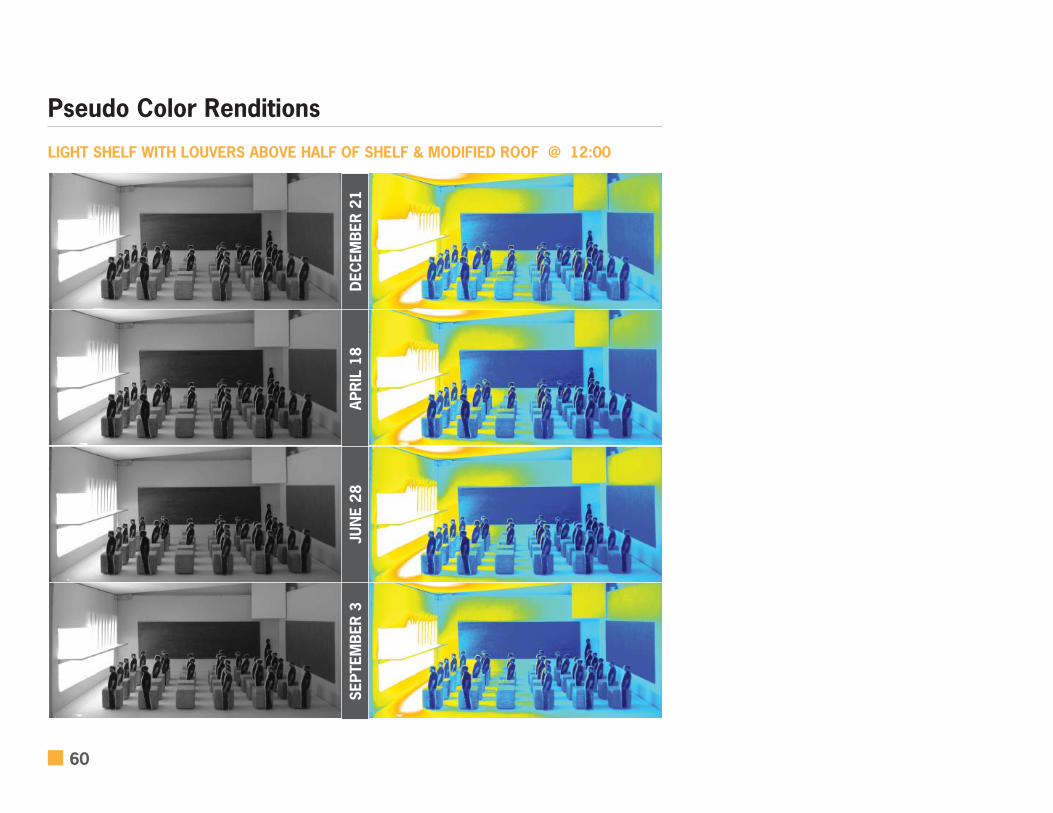
60
Pseudo Color Renditions
LIGHT SHELF WITH LOUVERS ABOVE HALF OF SHELF & MODIFIED ROOF @ 12:00
SEPT
EMB
ER 3
JUN
E 28
APR
IL 1
8D
ECEM
BER
21

61
LIGHT SHELF WITH LOUVERS ABOVE HALF OF SHELF & MODIFIED ROOF @ 15:00
SEPT
EMB
ER 3
JUN
E 28
APR
IL 1
8D
ECEM
BER
21

62
Pseudo Color Renditions
TESTING WITH DETAILED MODEL CHAIRS @ 16:00
APR
IL 1
5AP
RIL
15
APR
IL 1
8AP
RIL
18
REAL SPACE WITH & WITHOUT SUPPLEMENTAL FLUORESCENT LIGHTS @ 10:00
63
ANALYSISThe pseudo color renditions on the previous pages clearly highlight changes in refl ectance bet-
ter than the black-and-white photographs. Although each of the interventions appears to look the
same, upon closer inspection and comparison, changes based on time of day and year are evident,
and as expected. The different design variables seem to have minimal impact on lighting; however,
they do leave clues that allow the designer to infer potential changes to the design.
The studies shown were arranged as part of a sequence designed to mimic an imperial process
of design. The fi rst two confi gurations test typical classroom window arrangements. Then, a half
screen is placed in the front of the room, the intention being to create a zone in the front of the
room suitable for projection, while allowing adequate light on desktops for note taking. This not be-
ing successful, a full screen is tested, then a light shelf, then fi nally a new roof is added in tandem
with a light shelf. This study showed that the angle chosen for projection is clearly unacceptable for
said task. However, the designer can use information in the photographs to determine new solu-
tions. For example, in the last experiment, darker areas are seen in the roof cavity, leading one to
believe that by recessing areas, no matter how much light enters a room, a different zone can be
created. One can then postulate that by recessing a projection area, perhaps this zone can be cre-
ated. Then, this new design can be tested, along with another, and so forth.
Using the gradient charts on page 48, one can determine the brightness from the camera, assum-
ing the camera is properly calibrated. Further evidence is needed to determine how once assures
the brightness level displayed on screen is equal to that refl ecting into the camera lens.
The real room studies should also be noted because they are evidence that the same technique can
be used to study existing spaces.
Pseudo color rendition offers quantifi able metrics to analyze photographs of the physical model.
However more evidence is needed to determine the specifi cs and validity of those metrics. This will
be discussed further in the conclusion.


65
Project Workfl ow Analysis
This conclusion analyzes the project in relation to the project workfl ow conceptual diagram intro-
duced in chapter one. It discusses what research has been supported, and which needs further evi-
dence. It then analyzes the physical model objectives in a similar fashion. Finally, it lists resources
for further reading in addition to the resources cited throughout the book.
CHAPTER FIVECONCLUSION

66
Thesis Subject:
Thesis Concept:
Environment Variables:
Light Method Variables:
Control Variables:
Techniques:
Design Variables:
Human Performance & Behavior in Education
Architectural Environment Social Environment
Light Air Sound Scent Material Comfort
Natural Artifi cial Nanotechnology
Early Design Late Design Perception Sequence Personal
Physical Model Digital Model Physics Case Studies
Orientation Color Materials
Light Entry Geometry Objects
67
There is suffi cient evidence to support the concept and suggest that the architectural environment does, in fact, have an impact on human performance and behavior in education. Further studies on each of the environment variables will help determine which variable has the largest effect, and which are more prudent to investigate.
There is suffi cient evidence to suggest that lighting conditions are an aspect of the architectural environment that effect human performance and behavior in the classroom, as discussed in chap-ter two. There is also suffi cient evidence to suggest that natural lighting is key to better performance
and behavior.
Natural light improves performance and behavior, when compared to existing artifi cial light technol-ogies. Further studies on artifi cial light, or other new technologies such as “smart building” systems are needed to determine if such technologies can exceed the positive results shown with natural light. Some artifi cial lighting such as full-spectrum have been shown to have a positive effect on
performance and behavior but that effect is not yet greater than that of natural light.
Based on experimentation, it is clear that controlling the early design process can bring changes to how natural light is utilized and it is clear that it is better than adding natural light controls in the later design phases. Further evidence is needed to determine if the same results could be better achieved through psychological controls such as perception, sequencing, and personalization, as
discussed in chapter two.
The physical model allows for suffi cient manipulation of different design variables but each variable could be improved to a new degree of accuracy and usability. For example, objects such as people and desks need a better method of fastening to be simpler to use in the outdoor environment. A fl oor and objects with embedded magnets would help keep objects still when tilting the model, or using it in windy conditions. Although the model can account for a wide range of material studies, textured materials may behave differently in light at a smaller scale. Given unlimited resources, every design variable would ideally be tested to determine if it meets the physical model objectives,
and every design variable would be machined to precisely fi t together.
68
Physical Model Objectives Analysis
FLEXIBILITY IN USEThe model’s multiple design variables illustrate its fl exibility in use. However, in order to achieve this
fl exibility, the model has many component parts, which reduces the effectiveness of the simple and
intuitive objective. Further research is needed to determine if components could be combined to in-
crease fl exibility without sacrifi cing other objectives. For example, the camera positioning apparatus
cannot be used with a different camera, or model scale. This would require a different camera ap-
paratus. Although the base is fl exible enough to allow for a different camera apparatus, the camera
apparatus itself is not as fl exible as it should be.
SIMPLE & INTUITIVE USEThe model’s fl exibility objective sometimes competes with its simplicity and intuitiveness. The model
is simple and easy to use, and explain. It also utilizes the concept of interchangeable parts, increas-
ing its simplicity. Further evidence is needed by means of a focus group to determine its simplicity
and usefulness for those unfamiliar with the project, and those of different demographics than the
author.
ALLOW STUDY & COMPARISON BETWEEN DESIGN VARIABLESSuffi cient studies have been done to conclude that the model allows for study and comparison
between design variables. Research also supports pseudo color rendition as a method for analysis.
Further evidence is needed to test the reliability of the cross-media (analog to digital) method used
and determine if there is a more accurate and/or more simplifi ed cross-media method or a direct
method.
INFORM & EDUCATE (DIDACTIC)It is clear from use that the model is informative and it educates the user about daylight conditions.
Further evidence is needed in the form of a study and/or focus group to determine the correlation be-
tween the information and education gained and the impact of that new knowledge on new designs.
69
Further Reading & References
This thesis is one step towards improving design in schools. It aims to improve design by providing
a tool for designers that both aids in the design process, and teaches more inclusive and sustain-
able design. The conceptual diagram on page 66 identifi es several other topics that require further
study, both in architecture as well as other fi elds.
The following resources were useful for this thesis and contain a wealth of knowledge that cannot
possibly be replaced by this thesis alone. This thesis is intended as a supplement to the existing
knowledge in the fi eld. Particularly useful sources have been highlighted.
Sources are formatted in MLA style.
Ackerman, James, Toper Carew, Robert Coles, Giancarlo De Carlo, Aldo Van Eyck, Robert Goodman,
Herman Goodman, Peter Prangnell, Maurice Smith, Saul Steinberg, and Shadrach Woods. Har-
vard Educational Review: Architecture and Education. 4th ed. Vol. 39. 1969.
Battaglia, Paul. “Environmental Controls 2.” ARC 475. Crosby Hall, Buffalo, NY. 2006.
Benya, James. Lighting for Schools. Rep. Dec. 2001. National Clearinghouse for Educational Facili-
ties. 29 Jan. 2009 <http://www.edfacilities.org/pubs/lighting.pdf>.
Better Lighting for Healthier Students. Rep. Sept. 2001. Healthy Schools Network, Inc. 29 Jan. 2009
<http://www.healthyschools.org>.
Boese, Stephen, and John Shaw. New York State School Facilities and Student Health, Achievement,
and Attendance: A Data Analysis Report. Rep. Nov. 2005. Healthy Schools Network, Inc., Next
Wave. 01 Feb. 2009 <www.healthyschools.org/documents/NYS_SchoolFacilityData.pdf>.
Bowe, Frank G. Universal Design in Education : Teaching Nontraditional Students. Westport: Bergin
& Garvey, 2000.
Brubaker, C. William. Planning and Designing Schools. New York: McGraw-Hill Professional, 1997.

70
Bourgeois, Denis, Francis F. Reinhart, and Gary Ward. A Standard Daylight Coeffi cient Model for Dy-
namic Daylighting Simulations. Rep. Feb. 2007. Ecole d’architecture: Universite Laval, National
Research Council Canada, Anyhere Software. 29 Jan. 2009 <http://lightswitch.irc.nrc.ca/web-
site/Publications_f.html>.
Classroom Lighting Knowhow. Rep. 2002. Northern Energy Effi ciency Partnerships, Inc. and Design
Lights Consortium. 29 Jan. 2009 <http://www.designlights.org/downloads/classroom_guide.
pdf>.
Cuniff, Meghann M. “Air quality can be a diffi cult subject for schools: CdA offi cials scrub plan for
class at district offi ces.” Spokesman-Reiew (2008).
Daylight Dividends Case Study: Smith Middle School, Chapel Hill, NC. Rep. 2004. Lighting Re-
search Center at Rensselear Polytechnic Institute. 29 Jan. 2009 <http://www.lrc.rpi.edu/pro-
grams/daylighting/pdf/SmithCaseStudyFinal.pdf>.
Daylighting in Architecture: A European Reference Book. London: Published for the Commission
by James & James, 1993.
Daylighting In Schools: Reanalysis Report. Tech. Oct. 2003. California Energy Commission. 29 Jan.
2009 <http://www.energy.ca.gov/2003publications/CEC-500-2003-082-A-03.pdf>.
Designing Quality Learning Spaces: Lighting. Rep. 2007. BRANZ Ltd. and the New Zealand Ministry
of Education. 29 Jan. 2009 <http://www.minedu.govt.nz/web/downloadable/dl11663_v1/
moe-branz-lighting-v13.pdf>.
Donovan, Susan, and John D. Bransford, eds. How Students Learn : History, Math, and Science in
the Classroom. New York: Joseph Henry P, 2004.
Dudek, Mark. Children’s Spaces. New York: Architectural P, 2003.
Dudek, Mark. Schools and Kindergartens. Boston: Birkhauser Boston, 2007.
Eckerlin, Herbert, Myra Manning, Umesh Atre, and Jon Zubizarreta. A New Daylighting Strategy for a
Middle School in North Carolina. Rep. 2008.

71
Egan, M. David. Concepts in Architectural Lighting. New York: McGraw-Hill, 1983.
Economic Valuation of Environmental Health Risks to Children. Alexandria: Organization for Econom-
ic Cooperation & Development, 2006.
Epstein, Gary, Brian McCowan, and Daniel Birleanu. Integrating Daylighting and Electrical Lighting
for Premium Effi ciency and Performance. Rep. 2002. United States Green Building Council. 29
Jan. 2009 <http://www.usgbc.org/Docs/Archive/MediaArchive/205_Epstein_PA484.pdf>.
Fielding, Randall. “Learning, Lighting and Color: Lighting Design for Schools and Universities in the
21st Century.” Professional Lighting Design (2006). 2006. 29 Jan. 2009 <http://www.design-
share.com/articles/1/133/fi elding_light-learn-color.pdf>.
Gerber, Michael M. Education for All : Critical Issues in the Education of Children and Youth with Dis-
abilities. Ed. Terese C. Jimenez and Victoria L. Graf. San Francisco: Jossey-Bass, 2008.
Getting Brighter At Dena Boer Elementary School: Daylighting an Entire School Within a Standard
Construction Budget. Rep. 1999. Pacifi c Gas & Electric Company, Daylighting Initiative. 29 Jan.
2009 <http://www.pge.com/includes/docs/pdfs/shared/edusafety/training>.
Gifford, Robert. Environmental Psychology: Principles and Practice. 4th ed. Optimal Books, 2007.
Grondzik, Walter T., Alison G. Kwok, and John S. Reynolds. Mechanical and Electrical Equipment
for Buildings. New York: Wiley, 2005.
Guide for Daylighting Schools. Rep. 2004. Innovative Design, Inc., Daylight Dividends, Lighting
Research Center at the Rensselear Polytechnic Institute. 29 Jan. 2009 <http://www.innovati-
vedesign.net/pdf/daylightguide_8511.pdf>.
Heschong, Lisa. Daylighting in Schools. An Investigation into the Relationship between Daylight-
ing and Human Performance. Rep. 20 Aug. 1999. Heschong Mahone Group. 29 Jan. 2009
<http://www.coe.uga.edu/sdpl/research/daylightingstudy.pdf>.
Hess, Robert D., and Roberta M. Bear, eds. Early Education: A Comprehensive Evaluation of Current
Theory, Research, and Practice. Chicago, IL: Aldine Company, 1969.
72
Lam, William M. Perception and Lighting as Formgivers for Architecture. Ed. Christopher H. Rip-
man. McGraw Hill Book Company, 1977.
Lau, Andrew, and Richard Mistrick. Advancing the Art & Science of Daylighting Design. Rep.
2002. United States Green Building Council. 29 Jan. 2009 <http://2002.greenbuildexpo.org/
Expo2002/schedule/documents/>.
Lawson, Scott H. “Why schools should breath easier: schools face a much wider variety of possible
indoor air quality problems than typical adult workplaces. (Going Green).” New Hampshire Busi-
ness Review 30 (2008).
Letts, Lori, Patty Rigby, and Debra Stewart. Using Environment to Enable Occupational Performance.
Danbury: SLACK, Incorporated, 2003.
Lewis, Anne C. “School Air Quality.” The Education Digest 47th ser. 71 (2006).
Long, George. “Heating, Cooling of Schools, Air Quality Aid Learning.” Dayton Daily News 17 Apr.
2008.
May, Jeffrey C. My Offi ce Is Killing Me! : The Sick Building Survival Guide. New York: Johns Hopkins
UP, 2006.
Modular Skylight Wells: Design Guidelines for Skylights with Suspended Ceilings. Rep. Oct. 2003.
California Energy Commission. 29 Jan. 2009 <http://www.energy.ca.gov/2003publications/
CEC-500-2003-082>.
Moore, Fuller. Concepts and Practice of Architectural Daylighting. New York: Van Nostrand Rein-
hold, 1985.
Nicklas, Michael, and Umesh Atre. Comparison of Daylighting Strategies for Schools. Rep. 2007. In-
novative Design, Inc. 29 Jan. 2009 <http://www.innovativedesign.net/pdf/1143P.pdf>.
Norback, Dan. “An experimental study on effects of increased ventilation fl ow on students’ percep-
tion of indoor environment in computer classrooms.” 15 Apr. 2008. Blackwell Munksgaard. 07
Sept. 2008 <http://www3.interscience.wiley.com.gate.lib.buffalo.edu/journal/120122854/
73
abstract?cretry=1&sretry=0>.
O’Connor, Jennifer, Eleanor Lee, Francis Rubenstein, and Stephen Selkowitz. Tips for Daylighting
with Windows: An Integrated Approach. Rep. no. LBNL-39945. 1997. University of California,
Ernest Orlando Lawrence Berkeley National Laboratory. 29 Jan. 2009 <http://windows.lbl.gov/
pub/designguide/designguide.html>.
Olsen, Stephen, and Shana Kellum. The Impact of Sustainable Buildings on Educational Achieve-
ments in K-12 Schools. Rep. 25 Nov. 2003. Leonardo Academy, Inc. 29 Jan. 2009 <http://www.
cleanerandgreener.org/download/sustainableschools.pdf>.
PIER Daylighting Plus: Daylight Metrics. Rep. 12 Mar. 2008. Heschong Mahone Group, Inc., Cali-
fornia Energy Commission PIER Program, Daylighting Plus Research Program; Daylight Metrics
Project. 29 Jan. 2009 <h-m-g.com/DaylightPlus/Deliverables/Daylight Metrics Project Descrip-
tion for Webpage 031108.pdf>.
Pines, Maya. Revolution in Learning: The Years from Birth to Six. New York, NY: Harper & Row, 1967.
Plympton, Patricia, Susan Conway, and Kyra Epstein. “Daylighting in Schools: Improving Student
Performance and Health at a Price Schools Can Afford.” Proc. of American Solar Energy Society
Conference, Madison, WI. 16 June 2000. National Renewable Energy Lab at the Department
of Energy. 29 Jan. 2009 <http://www.eric.ed.gov/ERICWebPortal/contentdelivery/servlet/
ERICServlet?accno=%20ED440529/a4.pdf>.
Rapp, Doris J. Is this Your Child’s World? How You Can Fix the Schools and Homes that are Making
Your Child Sick. Bantam Books, 1996.
Reinhart, Christof F., Denis Bourgeois, Francois Dubrous, Aziz Laouadi, Phylroy Lopez, and Octa-
vian Stelescu. Daylight 1-2-3; A State-of-the-Art Daylighting/Energy Analysis Software for Initial
Design Investigations. Rep. 2007. Institute for Institute for Research in Construction: National
Research Council Canada, Ecole d’architecture, Universit Atilde; Laval, CANMET Energy Technol-
ogy Centre: Natural Resources Canada. 29 Jan. 2009 <www.ibpsa.org/proceedings/BS2007/
p233_fi nal.pdf>.
74
Reinhart, Christof F. “Dynamic Daylight Solutions.” A File Format for Dynamic Daylight Simulations.
Proc. of Radiance Workshop 2005, McGill University, School of Architecture, 815 Sherbrooke
Street West, Montreal, CA. 11 Aug. 2005. National Research Council, Canada. 29 Jan. 2009
<radiance-online.org/.../cd/website/PDF/DDS_fi le_format_RadWS.pdf>.
Reinhart, Christof F., John Mardaljevic, and Zach Rogers. “Dynamic Daylight Performance Metrics for
Sustainable Building Design.” LEUKOS 3 (2006): 7-31. July 2006. Illuminating Engineering So-
ciety of North America. 29 Jan. 2009 <irc.nrc-cnrc.gc.ca/pubs/fulltext/nrcc48669/nrcc48669.
pdf>.
Santamouris, Mat, ed. Advances in Passive Cooling. Detroit: Earthscan/James & James, 2007.
United States of America. California Energy Commission. Public Interest Energy Research Program.
Daylight Harvesting Made Simple. 2008.
United States of America. Department of Energy. Offi ce of Energy Effi ciency and Renewable Energy.
National Best Practices Manual For Building High Performance Schools. 2007. 29 Jan. 2009
<http://www.nrel.gov/docs/fy08osti/31545.pdf>.
Windows and Classrooms: A Study of Student Performance and the Indoor Environment.
Tech. Oct. 2003. California Energy Commission. 29 Jan. 2009 <http://www.energy.
ca.gov/2003publications/CEC-500-2003-082>.
Yee, Roger. Educational Environments. Minneapolis: Visual Reference Publications, Incorporated,
2002.
Young, Paul G., and Gail Connelly. Promoting Positive Behaviors : An Elementary Principal’s Guide to
Structuring the Learning Environment. New York: Corwin P, 2007.