did the animal move? a cross-wavelet approach to
TRANSCRIPT

Vol.:(0123456789)1 3
Marine Biology (2021) 168:114 https://doi.org/10.1007/s00227-021-03923-x
ORIGINAL PAPER
Did the animal move? A cross‑wavelet approach to geolocation data reveals year‑round whereabouts of a resident seabird
Amédée Roy1 · Karine Delord2 · Guilherme T. Nunes3 · Christophe Barbraud2 · Leandro Bugoni4 · Sophie Lanco‑Bertrand1
Received: 13 January 2021 / Accepted: 10 June 2021 / Published online: 22 June 2021 © The Author(s), under exclusive licence to Springer-Verlag GmbH Germany, part of Springer Nature 2021
AbstractConsiderable progress in our understanding of long-distance migration has been achieved thanks to the use of small geolo-cator devices (GLS). The tracking of resident or short-distance migrant animals remains however challenging because geolocation errors are substantial and difficult to estimate. This study aims to examine the sex-specific marine space uses of a resident tropical seabird, the masked booby (Sula dactylatra), during its full annual life cycle at the Fernando de Noronha archipelago (Brazil). Masked boobies (n = 31) tagged with GLS recording light intensity, seawater immersion, and water temperature showed a resident behaviour over their entire annual cycle. A wavelet analysis of GLS data revealed oscillatory patterns of inferred longitude correlated with changes in immersion frequency. This synchronicity demonstrated that birds traveled away and back from the colony on consecutive trips of short length ( ∼ 2–4 days) and short range ( ∼ 100–300 km) eastward of the colony. Duration and range of trips depended on the sex of the individual and on the time of the year. Trip duration increased gradually from the end of the breeding period to the post-breeding period, probably due to the release of the central-place breeding constraints. During the pre-breeding period, females had farther ranges eastward and spent more time in water than males. Despite inherent limits of light-based geolocation, this study demonstrates the relevance of synchronicity analysis of GLS data for investigating year-round movements of resident or short-distance migrants.
Introduction
Animals move to feed, to find mates, to avoid risks such as predation or adverse climatic conditions, or to locate breed-ing areas, within the range of their motion and navigation abilities (Bowler and Benton 2005; Nathan et al. 2008). Birds in particular, including seabirds, have great mobil-ity and navigation skills. Many migratory birds travel over long distances, occupy distant areas at different seasons, and return repeatedly to the same localities from year to year (Egevang et al. 2010; González-Solís et al. 2007; Shaffer et al. 2006; Stenhouse et al. 2012; Weimerskirch and Wilson 2000; Wilson et al. 1998). Other seabirds can in contrast be referred to resident (or sedentary) when their distribution and center of distribution remain more or less the same all year round, and from year to year (Newton 2008; Schacter and Jones 2018).
Resident behaviour might be explained by a reliable sup-ply of food available locally all year, and/or by territorial advantages to regular year-round visits to their breeding site (Newton 2008). This behaviour might therefore be related to an energy-saving strategy, where birds avoid metabolic
Reviewers: undisclosed experts.
Responsible Editor: V. Paiva.
* Amédée Roy [email protected]
1 Institut de Recherche pour le Développement (IRD), MARBEC (Univ. Montpellier, Ifremer, CNRS, IRD), Avenue Jean Monnet, 34200 Sète, France
2 Centres d’Etudes Biologiques de Chizé UMR7372, Centre National de la Recherche Scientifique, 79360 Villiers en Bois, France
3 Centro de Estudos Costeiros, Limnológicos e Marinhos, Universidade Federal do Rio Grande do Sul (UFRGS), Avenida Tramandaí, 976, Imbé, RS 95625-000, Brazil
4 Institute of Biological Sciences, Seabirds and Sea Turtles Laboratory, Universidade Federal do Rio Grande (FURG), Avenida Itália, km 8, Carreiros, Rio Grande, RS 96203-900, Brazil
Content courtesy of Springer Nature, terms of use apply. Rights reserved.

Marine Biology (2021) 168:114
1 3
114 Page 2 of 12
costs associated with migration and prefer to spend energy in remaining in seasonally less favorable habitats (Garthe et al. 2012). In particular, numerous tropical seabirds such as petrels, shearwaters, tropicbirds, boobies and noddies are classed as resident species (Ballance et al. 2006; Diamond 1978). Seasonality is indeed generally less pronounced and food resources have smoother variation in tropical areas than in temperate and polar regions (Ashmole 1971; Longhurst and Pauly 1987).
Migration may have evolutionary consequences at the species level, as it increases the probability of encounter-ing individuals from other populations and, consequently, of gene flow. Being resident can therefore have important consequences on gene flow disruption between populations and on population genetic structures (Friesen et al. 2007), which in the end conditions the evolutionary resources pop-ulations may rely on in changing environments. Resident behaviour is thus of great interest for future investigations into the topic of population resilience. Current knowledge of seabird residency is however mainly based on direct obser-vations (Jaquemet et al. 2004; Olson et al. 2001), and to our knowledge few studies have aimed at confirming or elucidat-ing year-round behaviour of a resident seabird using tracking devices (Schacter and Jones 2018).
Masked booby (Sula dactylatra) is a pan-tropical seabird found in every ocean on or off nearly every coast except the eastern Atlantic, northern Indian Ocean and the central-eastern Pacific (Nelson 2005). This species has been the sub-ject of a relatively large number of movement-based stud-ies during breeding period (Lerma et al. 2020; Wilkinson et al. 2020). Yet, the movements of masked boobies during the non-breeding period remain unclear. Adults would stay in the vicinity of the colony and would eventually disperse widely (thousands of km from the colony), while post-breed-ers return back to the colony intermittently (Del Hoyo et al. 1992; Nelson 2005). Apart from the uncertainties related to the post-breeding whereabouts of masked boobies, other questions remain, particularly concerning their reversed sexual dimorphism (hereafter RSD, when females are heav-ier and larger than males). Several studies have expected sex-related differences in the foraging strategies of masked boobies, assuming that the challenges related to foraging in tropical ecosystems characterized by low productivity presumably exert strong selection pressure on body size differences of tropical seabird species (Lewis et al. 2005; Weimerskirch et al. 2009). Some studies suggested a higher foraging effort by females (Weimerskirch et al. 2009), how-ever most of them did not demonstrate differences between sexes in foraging trips (Poli et al. 2017; Sommerfeld et al. 2013; Young et al. 2010).
Accurately tracking year-round resident seabirds such as masked boobies is yet challenging. Due to attachment and power limitations, the use of tracking devices such as GPS
loggers and Argos transmitters is often limited to short time periods (from hours to months) (Ropert-Coudert et al. 2004; Wakefield et al. 2009; Wilson et al. 2002). Light-level data loggers or global location sensors (GLS) remain the pre-ferred option for studying seabird spatial behaviour peren-nially since they are small enough to be attached on a plastic ring, energy-efficient when deployed for up to several years, and associated with reduced costs. Positions can be inferred from light data with an analysis of twilights derived from high-frequency light intensity records (Hill 1994; Lisovski et al. 2019). However, light signals may be subject to errors due to physical features (e.g., shade from vegetation or ani-mal body covering the device), weather (e.g., cloud cover), and animal behaviour (individuals nesting in burrows or being sat on the logger). As a consequence, positions derived from light records are less precise than positions estimated from GPS (Ekstrom 2007; Lisovski et al. 2012; Phillips et al. 2004). Latitude error is for example highest during the equi-noxes and close to the equator (Hill 1994). GLS and associ-ated analytical methods are for these reasons particularly relevant for elucidating migratory movements, as well as for movements that are in the order of magnitude of geolocation errors (e.g., 65 ± 54 km in longitude and 347 ± 462 km in latitude, as estimated in our study; Fig. 1a). In the latter case, the stumbling block remains in distinguishing movements from geolocation error to detect animal movements.
Many GLS also record external data such as saltwater immersion and sea surface temperature, which is crucial for improving geolocation estimations and/or interpreting GLS data (Guilford et al. 2009; Merkel et al. 2016). To identify whether oscillatory patterns of location inferred for GLS-tagged resident seabirds represent real movement, a solu-tion would be to study its synchronicity to external data. For example, if a measure of animal behaviour supposedly independent of geolocation error (e.g., saltwater immersion frequency) correlate with changes in location, this would be evidence that movements are real, and not a consequence of GLS location error. Wavelet analysis provides appropriate tools for comparing the frequency contents of time-series and drawing conclusions about series’ synchronicity at cer-tain periods and across certain ranges of time. It has been widely used in ecology (e.g., Bertrand et al. 2008; Cazelles et al. 2008; Fablet et al. 2013; Jenouvrier et al. 2005) since this method is highly appropriate to analyze periodic pat-terns in biological time series that are often noisy, non-linear and non-stationary, such as in GLS data (Cazelles and Stone 2003).
In this study, we use GLS to understand year-round at-sea movements of the masked booby. The goal is to elucidate the post-breeding movements of masked boobies and sex-specific non-breeding behaviours, and to demonstrate the relevance of wavelet analysis as an analysis tool for GLS data derived from short-migrants or resident species.
Content courtesy of Springer Nature, terms of use apply. Rights reserved.
Marine Biology (2021) 168:114
1 3
Page 3 of 12 114
Material and methods
Study site
Fernando de Noronha (hereafter FdN, 03◦50´ S, 32◦25´ W) is an offshore archipelago (21 islands and islets, 18.2 km2 ) lying at 360 km east from the mainland city of Natal, Brazil. FdN is a clear priority for biodiversity conservation at the Brazilian federal state level (through the Ministry of Environment, ICMBio) and scientific data are critical for improving the design of conservation policies. This archi-pelago hosts the largest number of breeding seabird spe-cies in Brazil, with eleven species reported to breed there (Mancini et al. 2016). To elucidate the year-round where-abouts of masked boobies breeding on the archipelago, fieldwork was conducted on one of the secondary islets, Meio island, which hosts one of the main masked booby breeding colony with 388 active nests (i.e., with eggs
or chicks) censused in April 2018 (Antas 1991, authors unpublished data).
GLS data analysis
GLS deployment
Breeding adults raising two to seven weeks old chicks were caught on 4–6 May 2017 and fitted with GLS attached to a plastic ring. In total, 34 individuals were caught (16 females and 18 males) and 2 types of GLS were deployed (n = 20 MK3006 and n = 14 MK3005 models both from Biotrack Ltd., Wareham, UK). GLS weighted 2.5 g and were fixed to the plastic ring (2 g) with cable ties, the entire equipment corresponding to less than 0.4% of the body mass. All log-gers recorded daylight level intensity, saltwater immersion (i.e., activity data) and sea surface temperature data.
Loggers measured daylight level intensity every 60 s and recorded the maximum light intensity for each 10 min for
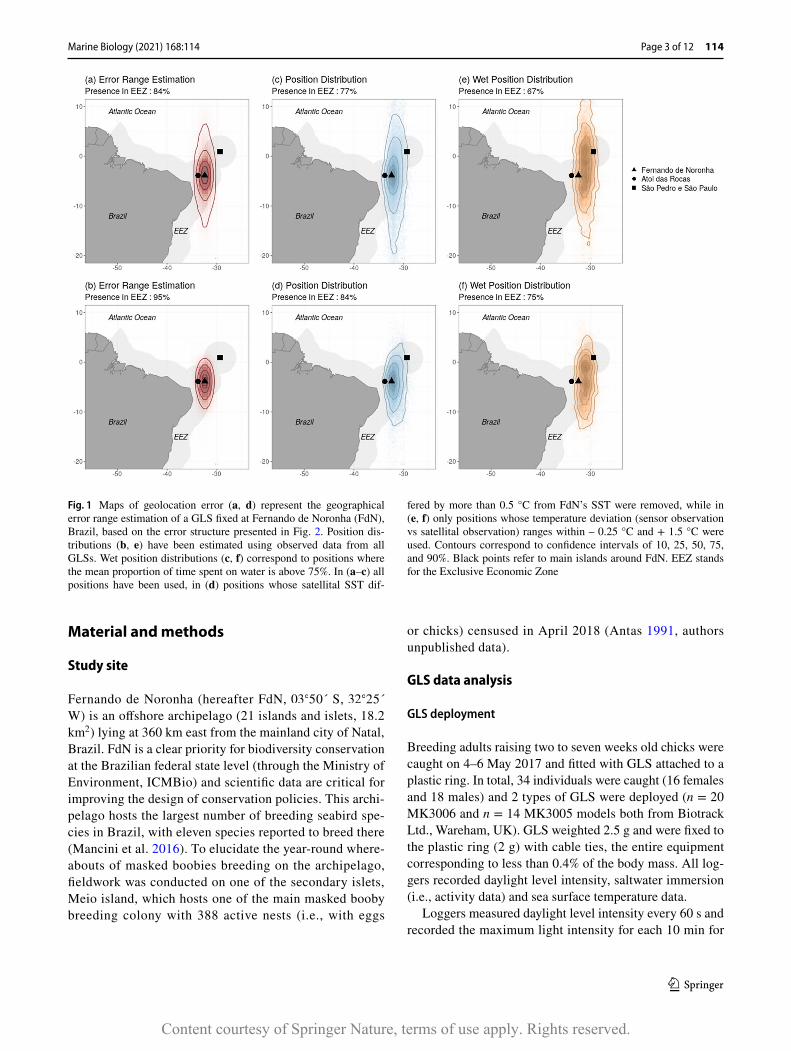
Fig. 1 Maps of geolocation error (a, d) represent the geographical error range estimation of a GLS fixed at Fernando de Noronha (FdN), Brazil, based on the error structure presented in Fig. 2. Position dis-tributions (b, e) have been estimated using observed data from all GLSs. Wet position distributions (c, f) correspond to positions where the mean proportion of time spent on water is above 75%. In (a–c) all positions have been used, in (d) positions whose satellital SST dif-
fered by more than 0.5 °C from FdN’s SST were removed, while in (e, f) only positions whose temperature deviation (sensor observation vs satellital observation) ranges within – 0.25 °C and + 1.5 °C were used. Contours correspond to confidence intervals of 10, 25, 50, 75, and 90%. Black points refer to main islands around FdN. EEZ stands for the Exclusive Economic Zone
Content courtesy of Springer Nature, terms of use apply. Rights reserved.

Marine Biology (2021) 168:114
1 3
114 Page 4 of 12
MK3006 and each 5 min for MK3005. They measured wet/dry status based on conductivity measurement. For MK3006 wet/dry status was sampled every 3 s and the sum of immer-sion events for each 10 min received a score between 0 and 200 (wet; immersion data > 0) and was stored. Temperature was recorded after 20 first minutes continuously wet, tem-perature wet timer reset anytime the device goes dry for > 3 s. For MK3005, wet/dry status was sampled every 3 s and the sum of wet/dry duration was stored. Temperature was recorded after 25 min continuously wet, temperature wet timer reset anytime device went dry for > 6 s.
Light‑based geolocation
Twilight times (i.e., sunrise and sunset) were determined using an arbitrary light intensity threshold of 2.5. A good choice for light threshold is often the lowest value that is consistently above any noise in the nighttime light levels (Pollet et al. 2014). The selection of the threshold was per-formed through the existing R library TwGeos (Lisovski et al. 2016). In situ calibration was done following Lisovski et al. (2019) recommendations. Relying on our knowledge of the phenology of masked boobies based on in situ observa-tions, we assumed that birds stayed at their breeding place at least from 10 May 2017 to 15 June 2017. A sun elevation angle was computed for each tag using the Hill-Ekstrom calibration (i.e., minimization of latitude error variance), and used for the estimation of birds’ geographic positions over the whole deployment. This was performed through the existing R library SGAT (Wotherspoon et al. 2016). Light-based geolocation using the threshold method provides one position from two consecutive twilights (i.e., two positions per day). We assigned to each position a mean temperature and the proportion of time in water calculated between two twilights.
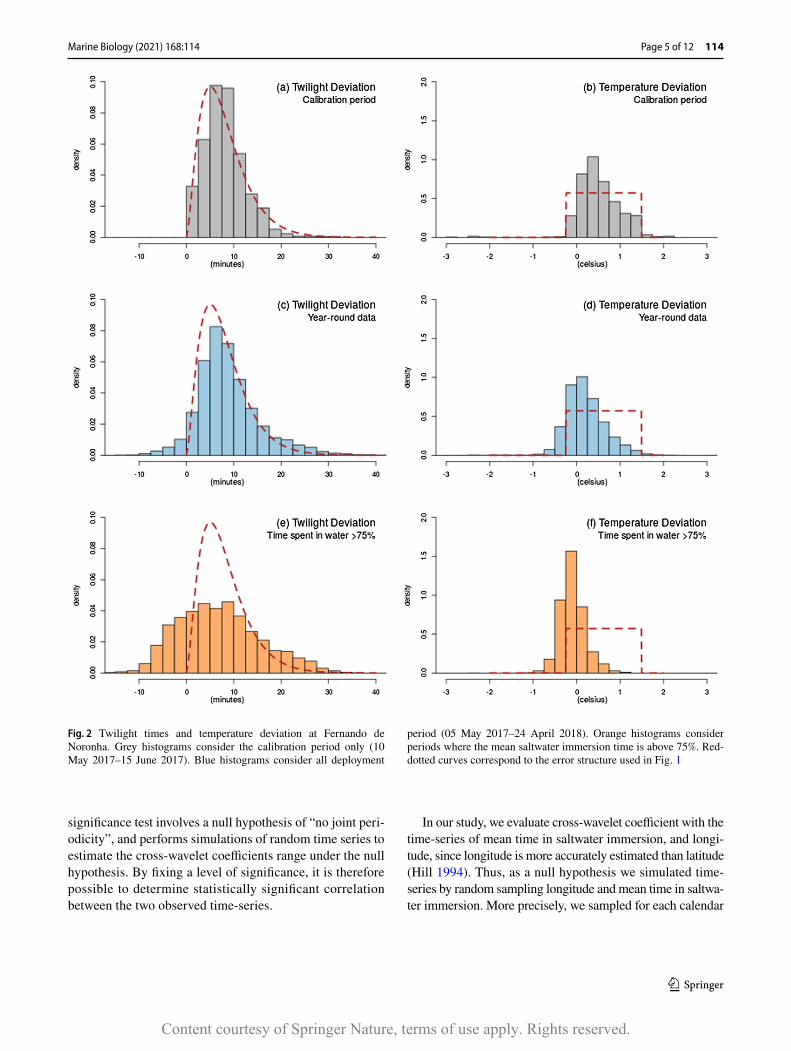
For each individual, we evaluated the deviation between all observed twilight times and theoretical twilight at FdN with respect to the calibrated sun elevations (Fig. 2a, c, e). The OSTIA global sea surface temperature (SST) repro-cessed product1 provided by the Copernicus Marine Ser-vice was also used to compute the deviation between mean temperature recorded by the tags and the SST gathered from satellite observations at FdN (Fig. 2b, d, f).
Position distributions and map of geolocation errors
The impact of measurement errors on geolocation estimates was illustrated by maps of geolocation error (Fig. 1a, b). These maps were estimated by sampling positions likely to be observed from a fixed GLS at FdN and by applying
a two-dimensional Kernel Density Estimation (KDE) with grid of mesh 0.5◦ and a bandwidth of 2◦ . In our case, a twi-light error structure was defined by fitting a gamma distri-bution on all twilight times deviation estimated during the calibration period (Fig. 2a). Twilight time observations were then simulated and used to estimate geolocations. Estimated positions whose satellite-based SST deviated over 0.5 °C from FdN’s SST were removed (Fig. 1b), based on the theo-retical sensor accuracy given by the archival tag provider (Biotrack Ltd., Wareham, UK).
Position distributions were estimated by applying a two-dimensional KDE on observed positions from all GLSs with same parameters (Fig. 1c–f). A temperature error structure was arbitrary defined using a uniform distribution on all temperature deviation estimated during calibration period (Fig. 2b). Such distribution was then used to remove posi-tions whose deviation between sensor-derived temperature and satellital SST was unlikely (Fig. 1d–f). Percentage of presence, defined as the proportion of positions laying within the Exclusive Economic Zone (EEZ), was also com-puted. Bhattacharyya coefficient was used for estimating quantitatively the dissimilarities between these distributions.
Cross‑wavelet analysis
Wavelet analysis consists in a local scale decomposition of a signal through the computation of the wavelet coefficient:
where Ψa,� is the mother wavelet in its conjugate form, � represents time, and a is the scale of the wavelet (Fig. 3). The wavelet coefficient represents the contribution of a scale a (i.e., the time periods on vertical axis in Figs. 3 and 4) in the observed signal at time � (i.e. the absolute time on hori-zontal axis in Figs. 3 and 4). In other words, the more the signal y(t) at time has a pattern with the same period as Ψa,� , the higher is Wy(a, �) . In practice, the Morlet wavelet is the most widely used mother wave, and is known for perform-ing a good trade-off between temporal and scale resolutions (Torrence and Compo 1998).
The cross-wavelet transform of two time series x(t) and y(t), with respective wavelet transforms Wx and Wy is defined by:
The evaluation of the statistical significance of power cross-wavelet coefficients is then critical for interpreting them correctly (Cazelles et al. 2014; Rouyer et al. 2008). The
(1)Wy(a, �) = ∫+∞
−∞
y(t)Ψa,�(t),
(2)Wx,y(a, �) =1
�
.Wx(a, �).Wy(a, �).
1 https:// resou rces. marine. coper nicus. eu/ (produ ctide ntifi erSST_ GLO_ SST_ L4_ REP_ OBSER VATIO NS_ 010_ 001).
Content courtesy of Springer Nature, terms of use apply. Rights reserved.
Marine Biology (2021) 168:114
1 3
Page 5 of 12 114
significance test involves a null hypothesis of “no joint peri-odicity”, and performs simulations of random time series to estimate the cross-wavelet coefficients range under the null hypothesis. By fixing a level of significance, it is therefore possible to determine statistically significant correlation between the two observed time-series.
In our study, we evaluate cross-wavelet coefficient with the time-series of mean time in saltwater immersion, and longi-tude, since longitude is more accurately estimated than latitude (Hill 1994). Thus, as a null hypothesis we simulated time-series by random sampling longitude and mean time in saltwa-ter immersion. More precisely, we sampled for each calendar
Fig. 2 Twilight times and temperature deviation at Fernando de Noronha. Grey histograms consider the calibration period only (10 May 2017–15 June 2017). Blue histograms consider all deployment
period (05 May 2017–24 April 2018). Orange histograms consider periods where the mean saltwater immersion time is above 75%. Red-dotted curves correspond to the error structure used in Fig. 1
Content courtesy of Springer Nature, terms of use apply. Rights reserved.

Marine Biology (2021) 168:114
1 3
114 Page 6 of 12
day one daylight and one night data point (i.e., longitude and corresponding time in water). Analysis were conducted with the help of the WaveletComp R library (Rosch and Schmid-bauer 2018).
Results
Light‑based geolocation
GLS were recovered (n = 31 loggers, i.e., 91% recovery rate) during the following breeding season during the
second half of April 2018, and the light-based geoloca-tion approach revealed that no masked booby had shown any migratory or wide-range movement (Fig. 1c, d). Indeed, 84% of the estimated positions laid within EEZ after filtering positions based on satellital sea surface tem-perature data (Fig. 1d). The estimation of twilight devia-tions between observed and expected times at FdN over a year-round deployment did not differ much from devia-tions estimated during the calibration period (Fig. 2a, c). The estimation of global error twilight structure lead to a gamma distribution of scale 2.66 and rate 0.32, which corresponds to detection of dawn and dusk with about 10
Fig. 3 Illustration of the cross-walelet theory based on GLS time-series derived from one individual and the associated cross-wavelet power matrix. The upper plot is longitude and saltwater immersion time-series. The bottom plot is the cross-wavelet power coefficient matrix. In such matrix, each power coefficient depends on one spe-cific pair time/scale. The two plots on the right (a, b), illustrate how to compute such coefficients for the time/scale pairs marked with red crosses. In both cases, black lines consist in raw time-series for
distinct time-windows, red lines show the Morlet wavelet with asso-ciated period, and grey rectangles show nights. Finally, coefficient matrix with significant synchronicity (p < 0.01; lower left panel) are contoured with white lines, and white arrows illustrate the difference of phases between these synchronized time-series. Arrows pointing to the right (respectively left) indicate that the two series are in phase (respectively anti-phase)
Content courtesy of Springer Nature, terms of use apply. Rights reserved.

Marine Biology (2021) 168:114
1 3
Page 7 of 12 114
min deviation in average and 20 min in worst cases, while maximal deviations over the whole deployment were about 30 min. SST measured by GLS over the whole deployment mainly deviated between – 1 °C and + 1.5 °C from satel-lital temperature at FdN (Fig. 2b). Yet, during calibration period, GLS-derived temperature records of SST were in average 0.52 °C higher than temperature at FdN derived from satellital data (Fig. 2b).
The twilight detection error structures fixed during cali-bration (Fig. 2a) lead to geolocation errors of around 65 ± 54 km in longitude and 347 ± 462 km in latitude (Fig. 1a). When filtering positions whose satellital SST deviated from FdN satellital SST more than 0.5 °C, errors in latitude were
reduced to 198 ± 168 km (Fig. 1b). Positions distributions were very similar to these geolocation errors when comparing respectively without and with filtering coordinates related to temperature data (Bhattacharyya coefficient of 0.95 and 0.92, respectively) (Fig. 1a–d). However, important deviations in twilight times occurred when masked boobies spent more than 75% of the time in water between two consecutive twilights (Fig. 2e), and were associated with a slight deviation eastward in the position distribution (Fig. 1e, f) and with temperature measurement up to 1 °C lower than FdN’s SST (Fig. 2f).
Fig. 4 Averaged cross-wavelet matrixes of longitude and activity time-series based on the analysis of all GLSs over the whole deployment for females (n = 14; F) and males (n = 17; M). White lines contour the time/period pairs where at least one individual has shown significant joint-periodicity between the two time-series. White arrows illustrate the dif-ference of phases between the two time-series (see Fig. 3 for further explanations). The white area corresponds to the cone of influence (sensu Cazelles et al. 2008). The different stages of the phenology of masked boobies are indicated for Fernando de Noronha (center panel), Brazil, based on in situ observations. Lower panel show the averaged power over the three respective time-windows: a early chick-rearing, b late chick-rearing to post-breeding and c pre-breeding periods. Individual analysis are available on a GitHub repository (Amed-eeRoy/WaveLightGLS)
Content courtesy of Springer Nature, terms of use apply. Rights reserved.

Marine Biology (2021) 168:114
1 3
114 Page 8 of 12
Wavelet analysis
The cross-wavelet analysis revealed local significant joint-periodicities (i.e., synchrony) between longitude and salt-water immersion time-series for every individual (p < 0.01). This synchronicity appeared for different couple of specific periods and times and they are discernable in matrixes of cross-wavelet power coefficients (Fig. 3). The average matrixes of cross-wavelet power coefficient for all individuals show global patterns of joint synchronicity, and a strong relationship with the phenology of masked boo-bies (Fig. 4). Periods with almost no significant periodicity occurred mostly between March and July which correspond to the first stage of the breeding period (i.e., incubation: laying to hatching). In contrast, from July to March, which corresponds to the last stage of the breeding season until the end of the non-breeding season, significant joint-periodicity can be observed for both females and males. During this period, eastward movement (longitude increasing) corre-sponded to an increase of time spent on water and, equally, westward movement (longitude decreasing) corresponded to a decrease of proportion of time spent on water. These joint-periodicities occurred mainly for periods of 2–8 days, with a modal period that increases from 2 days in July to 5 days in November. Specific periods could also be observed where all birds seemed to stop showing joint-periodicity such as in the end of September or in mid-December. Differences by sex appeared when breeding is over, i.e., after fledging with higher power coefficient for females (Fig. 4).
These joint-periodicity illustrated that the tagged birds traveled way and back from the colony on consecutive trips of short length with ( ∼ 2–4 days) to the east of the colony, with length and range depending on the sex and on the time of the year (Figs. 4 and 5). Trips had increasing average duration from the end of the breeding season to the pre-breeding period (Fig. 4) and associated increasing range (Fig. 5). In particular, during the pre-breeding period (Jan-uary–March), females travelled significantly further to the east (Welch Two Sample t-test: p < 0.001) and spent more time in water than males (Fig. 5).
Discussion
GLS data and resident behaviour
Data from 31 GLS showed that masked boobies from FdN archipelago stayed in the vicinity of their breeding site both during breeding and non-breeding seasons. The cross-wavelet analysis revealed their short round trip of few days eastward to their breeding site.
GLS data have been only rarely used to demonstrate resident behaviour (Schacter and Jones 2018). Existing studies have dealt with staging behaviour and most of them have estimated positions distributions by applying KDE on a scatter of light-derived positions (Bächler et al. 2010; Stenhouse et al. 2012). Travelling periods are usu-ally discriminated from resting periods by fixing empiri-cal thresholds on distance to the colony (Leal et al. 2017) or on change in longitude (Guilford et al. 2009). In this study, we estimated maps of error range, and year-round position distribution of FdN’s masked boobies, suggesting that masked boobies are resident at FdN. One could argue that it would be impossible to detect wide range move-ments in case seabirds would have changed of breeding location or simply skipped the breeding season. Indeed, because birds with archival tags needed to be recaptured, we only recovered tags that have been deployed on birds that bred at the same place for two consecutive years. However, previous observations (Kepler 1969), as well as our own with recovery rate around 90%, suggest that such behaviour would be rather rare, especially since the remaining fraction cannot be disentangled from natural mortality previously estimated at 8.6% (Woodward 1972).
Our study reveals joint-periodicity between longitude and saltwater immersion time-series. These periodicities might hypothetically have resulted from bias in the meas-ure of light-level intensity when masked boobies sit on water and that they have not travelled eastward to FdN. This is however unlikely since shading due to immersion could explain a positive twilight deviation, but not the negative twilight deviation observed in Fig. 2e. Indeed negative twilight errors are theoretically impossible with GLS data in environments with no artificial lights. Finally, GPS tracking of masked boobies in the same colony during the breeding season conducted every April between 2017 and 2019 revealed that masked boobies from FdN foraged almost exclusively at the east of the archipelago, and that they occasionally spent one night at sea, eastward of their breeding locations (8 out of 130 recorded trips, S. Ber-trand, unpubl. data). Such nights at sea should be observ-able in GLS data, and in April a few males showed indeed a joint periodicity of period 48 h, which could correspond to trips lasting about 24 h (Fig. 4). Based on our analysis, we are thus confident that masked boobies travelled way and back to the colony during the non-breeding season and at the beginning of breeding season, and that the eastward deviation consisted in real movements of about 150 km eastward to FdN.
Masked boobies’ year‑round residency
The year-round residence of masked boobies might be related to the presence of twice more productive areas at the
Content courtesy of Springer Nature, terms of use apply. Rights reserved.

Marine Biology (2021) 168:114
1 3
Page 9 of 12 114
north-east of FdN due to the island effect of São Pedro e São Paulo offshore archipelago (SPSP). This area triggers a local enrichment in the surrounding waters through an upwelling island effect (Campelo et al. 2019), and also supports a resi-dent population of brown boobies Sula leucogaster (Nunes et al. 2018). The average structure of this local upwelling is notably described by an average SST decreasing gradually between FdN and SPSP with an average difference of about 0.5 °C (Campelo et al. 2019). This small effect is indeed observed with GLS-derived temperature data as deviation in mean temperature were in average 0.5 °C higher during calibration than when masked boobies spent time in water eastward to FdN (Fig.2b, f). The bias in temperature devia-tion during calibration is however likely to be due to skin warming according to previous in situ observation in the
same area (Clayson and Weitlich 2007). The intermittent way back to the colony is also consistent with the territorial behaviour of masked boobies, known to come back to the colony intermittently during post-breeding period (Nelson 2005).
Most studies on seabirds at FdN relied on colony-based sightings (Antas 1991; Mancini et al. 2016; Sazima and de Almeida 2008) and stable isotope analyses for trophic ecol-ogy (Mancini et al. 2013, 2014). Studies underlined the need for going further in the study of the ecology of seabirds at FdN, especially on their movement and the definition of their habitat, so as to improve conservation strategies (Mancini et al. 2016). This work provides a first answer on masked boobies year-round behaviour. In particular, we show that masked boobies stay within the Brazilian EEZ throughout
Fig. 5 Sex-specific positions distributions for specific time-windows, where columns correspond to time-windows described in Fig. 4. a Early chick-rearing, b late chick-rearing to post-breeding and c pre-breeding periods. Maps illustrate the position distribution by sex (F: females-light blue, M: males-red) for the associated periods. Con-tours represents position distribution of 90%, and crosses the mean positions. Black points refer to main islands around FdN. Histograms
(center panels) show at which frequency birds spent proportion of time rather in wet or dry environment during the associated period. Density plots (lower panels) illustrate the eastward deviations of posi-tions with activity higher to 75% for the associated periods. p-values specify the significance of difference in mean between the two distri-butions derived from Welch Two Sample t-test
Content courtesy of Springer Nature, terms of use apply. Rights reserved.

Marine Biology (2021) 168:114
1 3
114 Page 10 of 12
the year, which brings valuable information for developing relevant conservation strategies such as designing Marine Protected Areas.
Stage‑related and sex‑specific activity patterns
If some uncertainties remain on the exact home range of masked boobies due to GLS inaccuracy, our study brings new insights into temporal, year-round, variation of their space use. In particular, we show that the duration of trips outside FdN is strongly related to breeding constraints. Lay-ing, incubating and hatching periods were associated with no joint periodicity, suggesting that the range and duration of foraging trips during these periods are below the error threshold of the signal provided by light and activity. These breeding stages are characterized by substantial thermal and energetic constraints linked to reproduction, since adults need to incubate or to brood and feed their chick. They mostly share time between defending the nest site or their chick and foraging at sea. Therefore, they are not expected to spend time resting at the sea surface for long periods during breeding (e.g., within the timeframe of two locations per day derived from GLS). Even if they forage far from their colony, they have to come back frequently and are likely to be observed at FdN. When chicks are older and can survive without the protection of their parents (i.e., rearing to fledg-ing), the release of the thermal constraints was evidenced by joint-periodicity with gradually increasing periods.
Interestingly, when there was no constraint related to reproduction (i.e., no strict obligation to return to the nest), males and females showed slight differences in cross-wavelet power, particularly the few months prior breeding. During this specific period (January–March), the cross-wavelet anal-ysis revealed higher power coefficients for females, which can be explained by longer trips and longer time spent on water. This confirms the fact that for this species, attendance at site prior to mate is larger for males than for females. Males are territorial and work at conquering and defending a nest place at that period (Nelson 2005). By travelling further eastward and resting on water for longer period, females may reach and stay in more productive area (Campelo et al. 2019), at a period where they need to accumulate energy for the ovogenesis. Sexual differences in space use and activity patterns in the pre-breeding period (which is not observed during the breeding period) provides a new light on reversed sexual dimorphism of masked boobies. One of the functions proposed for RSD is niche segregation, especially to avoid intersexual competition and optimize the use of resources (Serrano-Meneses and Székely 2006). Where many studies have failed to demonstrate differences in foraging behav-iours of masked boobies in order to explain masked boo-bies’ RSD, our study provides relevant sex-specific activity
patterns during the pre-breeding period i.e. pre-laying (Poli et al. 2017; Sommerfeld et al. 2013; Young et al. 2010).
Wavelet analysis of geolocation data
When dealing with GLS data deployed on resident or other non-migratory animals, the question might not be “where is the animal?” but rather “did the animal move?”. Exter-nal data might be helpful to examine movement based on a relevant correlation, particularly close to the equator where error in latitude are the highest (Hill 1994). This is the case in our study, where we aimed at determining masked boo-bies’ movements by elucidating the relationships between saltwater immersion and longitude. Our analytical frame-work could easily be used to investigate the space-uses of other resident seabirds, but also to tell if high deviations in position are due to shading caused by clouds (Lisovski et al. 2018). It could also be extended on analysis of change in latitude, or in distance to the colony coupled with any other relevant external data (e.g., weather data, behavioural data), because it is a convenient and powerful tool for studying the sequentiality of noisy time-series.
Despite the inaccuracy of GLS geolocation, our study shows that these devices are appropriate for revealing year-round whereabouts of a resident tropical seabird over long periods, such as during the non-breeding season. Based on external data with higher precision and reliability than light-based geolocation, we elucidated activity patterns that cor-relate with periodic change in position. We brought new insights on masked booby year-round movements related to breeding constraints, and we revealed pre-breeding sex-spe-cific movements that had not been observed to date. Finally, we demonstrated that wavelet analysis is a relevant way to extract more out of GLS data further broadly, to provide strong demonstration of animal movement or residency, and to avoid the possible over-interpretation of GLS data.
Acknowledgements We would like to thank all people involved in the fieldwork activities. Fieldwork activities received the administrative and logistical support from the Fernando de Noronha administration, the Instituto Chico Mendes de Conservação da Biodiversidade (ICM-Bio, Brazil), the military firemen from Fernando de Noronha and the TAMAR Project. We also want to express grateful thanks to anony-mous reviewers and to colleagues from IFREMER and IRD for having helped us significantly on the manuscript.
Author contributions AR, SB and KD conceived the ideas and AR performed the analysis; AR, GT, KD, CB, KD and SB have been on fieldworks for collecting the data; AR led the writing of the manuscript. All authors contributed critically to the drafts and gave final approval for publication.
Funding This work is a contribution to the TRIATLAS project (fund-ing by the European Union’s Horizon 2020 research and innovation program—Grant agreement No. 817578). This project has received funding from the Paddle Rise project—European Union’s Horizon
Content courtesy of Springer Nature, terms of use apply. Rights reserved.

Marine Biology (2021) 168:114
1 3
Page 11 of 12 114
2020 research and innovation program under Grant Agreement No. 734271. This study was partially funded by IRD (Mixed International Laboratory Tapioca), CPER Celimer (France), Fundação O Boticário (Brazil), Young Team IRD Programm Tabasco (JEAI) and Brazil-ian National Research Council (CNPq, No. 422759/2016-3). L.B. is research fellow from CNPq (PQ 311409/2018-0).
Data/Code availability Data and code are available on our github page: https:// github. com/ Amede eRoy/ WaveL ightG LS.
Declarations
Conflict of interest The authors declare that they have no conflict of interest.
Ethical approval This work was conducted with the approval of the Brazilian Ministry of Environment—Instituto Chico Mendes de Con-servação da Biodiversidade (Authorization No 52583-5).
References
Antas PTZ (1991) Status and conservation of seabirds breeding in Bra-zilian waters. ICBP Tech Publ 11:141–158
Ashmole N (1971) Seabird ecology and the marine environment. Avian Biol 1:223–286
Bächler E, Hahn S, Schaub M, Arlettaz R, Jenni L, Fox JW, Afanasyev V, Liechti F (2010) Year-round tracking of small trans-Saharan migrants using light-level geolocators. PLoS One 5:e9566. https:// doi. org/ 10. 1371/ journ al. pone. 00095 66
Ballance LT, Pitman RL, Fiedler PC (2006) Oceanographic influ-ences on seabirds and cetaceans of the eastern tropical Pacific: a review. Prog Oceanogr 69:360–390. https:// doi. org/ 10. 1016/j. pocean. 2006. 03. 013
Bertrand A, Gerlotto F, Bertrand S, Gutiérrez M, Alza L, Chipol-lini A, Díaz E, Espinoza P, Ledesma J, Quesquén R, Peraltilla S, Chavez F (2008) Schooling behaviour and environmental forcing in relation to anchoveta distribution: an analysis across multiple spatial scales. Prog Oceanogr 79:264–277. https:// doi. org/ 10. 1016/j. pocean. 2008. 10. 018
Bowler DE, Benton TG (2005) Causes and consequences of animal dispersal strategies: relating individual behaviour to spatial dynamics. Biol Rev 80:205–225. https:// doi. org/ 10. 1017/ S1464 79310 40066 45
Cazelles B, Stone L (2003) Detection of imperfect population syn-chrony in an uncertain world. J Anim Ecol 72:231–242. https:// doi. org/ 10. 1046/j. 1365- 2656. 2003. 00763.x
Cazelles B, Chavez M, Berteaux D, Ménard F, Vik JO, Jenou-vrier S, Stenseth NC (2008) Wavelet analysis of ecological time series. Oecologia 156:287–304. https:// doi. org/ 10. 1007/ s00442- 008- 0993-2
Cazelles B, Cazelles K, Chavez M (2014) Wavelet analysis in ecol-ogy and epidemiology: impact of statistical tests. J R Soc Inter-face 11:20130585. https:// doi. org/ 10. 1098/ rsif. 2013. 0585
Clayson CA, Weitlich D (2007) Variability of tropical diurnal sea surface temperature. J Clim 20:334–352. https:// doi. org/ 10. 1175/ JCLI3 999.1
Campelo RPS, Bonou FK, de Melo Júnior M, Diaz XFG, Bezerra LEA, Neumann-Leitão S (2019) Zooplankton biomass around marine protected islands in the tropical Atlantic Ocean. J Sea Res 154:101810. https:// doi. org/ 10. 1016/j. seares. 2019. 101810
Del Hoyo J, Elliott A, Sargatal J (1992) Handbook of the birds of the world, vol 1. Lynx Editions, Barcelona
Diamond AW (1978) Feeding strategies and population size in tropi-cal seabirds. Am Nat 112:215–223
Egevang C, Stenhouse IJ, Phillips RA, Petersen A, Fox JW, Silk JRD (2010) Tracking of Arctic terns Sterna paradisaea reveals longest animal migration. Proc Natl Acad Sci 107:2078–2081. https:// doi. org/ 10. 1073/ pnas. 09094 93107
Ekstrom P (2007) Error measures for template-fit geolocation based on light. Deep Sea Res Part II Top Stud Oceanogr 54:392–403. https:// doi. org/ 10. 1016/j. dsr2. 2006. 12. 002
Fablet R, Chaigneau A, Bertrand S (2013) Multiscale analysis of geometric planar deformations: application to wild animal electronic tracking and satellite ocean observation data. IEEE Trans Geosci Remote Sens 52:3627–3636. https:// doi. org/ 10. 1109/ TGRS. 2013. 22741 57
Friesen VL, Burg TM, McCOY KD (2007) Mechanisms of popula-tion differentiation in seabirds. Mol Ecol 16:1765–1785. https:// doi. org/ 10. 1111/j. 1365- 294X. 2006. 03197.x
Garthe S, Ludynia K, Hüppop O, Kubetzki U, Meraz JF, Furness RW (2012) Energy budgets reveal equal benefits of varied migration strategies in northern gannets. Mar Biol 159:1907–1915. https:// doi. org/ 10. 1007/ s00227- 012- 1978-6
González-Solís J, Croxall JP, Oro D, Ruiz X (2007) Trans-equatorial migration and mixing in the wintering areas of a pelagic sea-bird. Front Ecol Environ 5:297–301. https:// doi. org/ 10. 1890/ 1540- 9295(2007) 5[297: TMAMIT] 2.0. CO;2
Guilford T, Meade J, Willis J, Phillips R, Boyle D, Roberts S, Collett M, Freeman R, Perrins C (2009) Migration and stopover in a small pelagic seabird, the Manx shearwater Puffinus puffinus: insights from machine learning. Proc R Soc Lond B Biol Sci 276:1215–1223. https:// doi. org/ 10. 1098/ rspb. 2008. 1577
Hill RD (1994) Theory of geolocation by light levels. In: Le Boeuf BJ, Laws RM (eds) Elephant seals: population ecology, and physiology. University of California Press, Berkeley, pp 227–236
Jaquemet S, Le Corre M, Weimerskirch H (2004) Seabird community structure in a coastal tropical environment: importance of natural factors and fish aggregating devices (FADs). Mar Ecol Prog Ser 268:281–292
Jenouvrier S, Weimerskirch H, Barbraud C, Park YH, Cazelles B (2005) Evidence of a shift in the cyclicity of Antarctic seabird dynamics linked to climate. Proc R Soc Lond B Biol Sci 272:887–895. https:// doi. org/ 10. 1098/ rspb. 2004. 2978
Kepler CB (1969) The breeding biology of the blue-faced booby (Sula dactylatra personata) on Green Island, Kure atoll. Publications of the Nuttall Ornithologists Club, p 8
Leal GR, Furness RW, McGill RAR, Santos RA, Bugoni L (2017) Feeding and foraging ecology of Trindade petrels Ptero-droma arminjoniana during the breeding period in the South Atlantic Ocean. Mar Biol 164:211. https:// doi. org/ 10. 1007/ s00227- 017- 3240-8
Lerma M, Serratosa J, Luna-Jorquera G, Garthe S (2020) Foraging ecology of masked boobies (Sula dactylatra) in the world’s larg-est “oceanic desert”. Mar Biol 167:87. https:// doi. org/ 10. 1007/ s00227- 020- 03700-2
Lewis S, Schreiber EA, Daunt F, Schenk GA, Orr K, Adams A, Wan-less S, Hamer KC (2005) Sex-specific foraging behaviour in tropi-cal boobies: does size matter? Ibis 147:408–414. https:// doi. org/ 10. 1111/j. 1474- 919x. 2005. 00428.x
Lisovski S, Hewson CM, Klaassen RHG, Korner-Nievergelt F, Kris-tensen MW, Hahn S (2012) Geolocation by light: accuracy and precision affected by environmental factors. Methods Ecol Evol 3:603–612. https:// doi. org/ 10. 1111/j. 2041- 210X. 2012. 00185.x
Lisovski S, Wotherspoon S, Sumner M (2016) TwGeos: basic data processing for light-level geolocation archival tags. R package version 0.1.2. https:// github. com/ sliso vski/ TwGeos
Content courtesy of Springer Nature, terms of use apply. Rights reserved.

Marine Biology (2021) 168:114
1 3
114 Page 12 of 12
Lisovski S, Schmaljohann H, Bridge ES, Bauer S, Farnsworth A, Gauthreaux SA, Hahn S, Hallworth MT, Hewson CM, Kelly JF, Liechti F, Marra PP, Rakhimberdiev E, Ross JD, Seavy NE, Sumner MD, Taylor CM, Winkler DW, Wotherspoon SJ, Wunder MB (2018) Inherent limits of light-level geolocation may lead to over-interpretation. Curr Biol 28:R99–R100. https:// doi. org/ 10. 1016/j. cub. 2017. 11. 072
Lisovski S, Bauer S, Briedis M, Davidson SC, Dhanjal-Adams KL, Hallworth MT, Karagicheva J, Meier CM, Merkel B, Ouwehand J, Pedersen L, Rakhimberdiev E, Roberto-Charron A, Seavy NE, Sumner MD, Taylor CM, Wotherspoon SJ, Bridge ES (2019) Light-level geolocator analyses: a user’s guide. J Anim Ecol 89:221–236. https:// doi. org/ 10. 1111/ 1365- 2656. 13036
Longhurst AR, Pauly D (1987) Ecology of tropical oceans. Academic Press, San Diego (574.52636 L6)
Mancini PL, Bond AL, Hobson KA, Duarte LS, Bugoni L (2013) For-aging segregation in tropical and polar seabirds: testing the inter-sexual competition hypothesis. J Exp Mar Biol Ecol 449:186–193. https:// doi. org/ 10. 1016/j. jembe. 2013. 09. 011
Mancini PL, Hobson KA, Bugoni L (2014) Role of body size in shap-ing the trophic structure of tropical seabird communities. Mar Ecol Prog Ser 497:243–257. https:// doi. org/ 10. 3354/ meps1 0589
Mancini PL, Serafini PP, Bugoni L (2016) Breeding seabird popula-tions in Brazilian oceanic islands: historical review, update and a call for census standardization. Rev Brasil Ornitol 24:94–115. https:// doi. org/ 10. 1007/ BF035 44338
Merkel B, Phillips RA, Descamps S, Yoccoz NG, Moe B, Strøm H (2016) A probabilistic algorithm to process geolocation data. Mov Ecol 4:26. https:// doi. org/ 10. 1186/ s40462- 016- 0091-8
Nathan R, Getz WM, Revilla E, Holyoak M, Kadmon R, Saltz D, Smouse PE (2008) A movement ecology paradigm for unify-ing organismal movement research. Proc Natl Acad Sci USA 105:19052–19059. https:// doi. org/ 10. 1073/ pnas. 08003 75105
Nelson B (2005) Pelicans, cormorants, and their relatives: the Pelecani-formes. Oxford University Press, Oxford
Newton I (2008) The migration ecology of birds. Academic Press, LondonNunes GT, Bertrand S, Bugoni L (2018) Seabirds fighting for land:
phenotypic consequences of breeding area constraints at a small remote archipelago. Sci Rep 8:665. https:// doi. org/ 10. 1038/ s41598- 017- 18808-7
Olson PA, Ballance LT, Hough KR, Dutton PH, Reilly SB (2001) Summary of seabird, marine turtle, and surface fauna data collected during a survey in the eastern tropical pacific ocean July 8–December 9, 2000. NOAA Techn Memo NMFS NOAA-TM-NMFS-SWFSC-304
Phillips R, Silk J, Croxall J, Afanasyev V, Briggs D (2004) Accuracy of geolocation estimates for flying seabirds. Mar Ecol Prog Ser 266:265–272. https:// doi. org/ 10. 3354/ meps2 66265
Poli CL, Harrison AL, Vallarino A, Gerard PD, Jodice PGR (2017) Dynamic oceanography determines fine scale foraging behavior of masked boobies in the Gulf of Mexico. PLoS One 12:18. https:// doi. org/ 10. 1371/ journ al. pone. 01783 18
Pollet IL, Hedd A, Taylor PD, Montevecchi WA, Shutler D (2014) Migratory movements and wintering areas of Leachs storm-petrels tracked using geolocators. J Field Ornithol 85:321–328. https:// doi. org/ 10. 1111/ jofo. 12071
Ropert-Coudert Y, Wilson RP, Daunt F, Kato A (2004) Patterns of energy acquisition by a central place forager: benefits of alternat-ing short and long foraging trips. Behav Ecol 15:824–830. https:// doi. org/ 10. 1093/ beheco/ arh086
Rosch A, Schmidbauer H (2018) WaveletComp R package version 1.1. https:// cran.r- proje ct. org/ packa ge= Wavel etComp
Rouyer T, Fromentin JM, Stenseth NC, Cazelles B (2008) Analysing multiple time series and extending significance testing in wavelet analysis. Mar Ecol Prog Ser 359:11–23. https:// doi. org/ 10. 3354/ meps0 7330
Sazima I, de Almeida LB (2008) The bird kraken: octopus preys on a sea bird at an oceanic island in the tropical West Atlantic. Mar Biodivers Rec 1:e47. https:// doi. org/ 10. 1017/ S1755 26720 60054 58
Schacter CR, Jones IL (2018) Confirmed year-round residence and land roosting of whiskered auklets (Aethia pygmaea) at Buldir Island, Alaska. Auk 135:706–715. https:// doi. org/ 10. 1642/ AUK- 17- 235.1
Serrano-Meneses MA, Székely T (2006) Sexual size dimorphism in seabirds: sexual selection, fecundity selection and differential niche-utilisation. Oikos 113:385–394. https:// doi. org/ 10. 1111/j. 0030- 1299. 2006. 14246.x
Shaffer SA, Tremblay Y, Weimerskirch H, Scott D, Thompson DR, Sagar PM, Moller H, Taylor GA, Foley DG, Block BA, Costa DP (2006) Migratory shearwaters integrate oceanic resources across the Pacific Ocean in an endless summer. Proc Natl Acad Sci USA 103:12799–12802. https:// doi. org/ 10. 1073/ pnas. 06037 15103
Sommerfeld J, Kato A, Ropert-Coudert Y, Garthe S, Hindell MA (2013) Foraging parameters influencing the detection and inter-pretation of area-restricted search behaviour in marine predators: a case study with the masked booby. PLoS One 8:e63742. https:// doi. org/ 10. 1371/ journ al. pone. 00637 42
Stenhouse IJ, Egevang C, Phillips RA (2012) Trans-equatorial migra-tion, staging sites and wintering area of Sabine’s gulls Larus sabini in the Atlantic Ocean. Ibis 154:42–51. https:// doi. org/ 10. 1111/j. 1474- 919X. 2011. 01180.x
Torrence C, Compo GP (1998) A practical guide to wavelet analysis. Bull Am Meteorol Soc 79:61–78
Wakefield E, Phillips R, Matthiopoulos J (2009) Quantifying habitat use and preferences of pelagic seabirds using individual move-ment data: a review. Mar Ecol Prog Ser 391:165–182. https:// doi. org/ 10. 3354/ meps0 8203
Weimerskirch H, Wilson RP (2000) Oceanic respite for wandering albatrosses. Nature 406:955–956. https:// doi. org/ 10. 1038/ 35023 068
Weimerskirch H, Le Corre M, Gadenne H, Pinaud D, Kato A, Rop-ert-Coudert Y, Bost CA (2009) Relationship between reversed sexual dimorphism, breeding investment and foraging ecology in a pelagic seabird, the masked booby. Oecologia 161:637–649. https:// doi. org/ 10. 1007/ s00442- 009- 1397-7
Wilkinson BP, Haynes-Sutton AM, Meggs L, Jodice PGR (2020) High spatial fidelity among foraging trips of masked boobies from Pedro Cays, Jamaica. PLoS One 15:e0231654. https:// doi. org/ 10. 1371/ journ al. pone. 02316 54
Wilson RP, Culik BM, Kosiorek P, Adelung D (1998) The over-winter movements of a chinstrap penguin (Pygoscelis antarctica). Polar Rec 34:107–112. https:// doi. org/ 10. 1017/ S0032 24740 00152 42
Wilson R, Grémillet D, Syder J, Kierspel M, Garthe S, Weimerskirch H, Schäfer-Neth C, Scolaro J, Bost C, Plötz J, Nel D (2002) Remote-sensing systems and seabirds: their use, abuse and poten-tial for measuring marine environmental variables. Mar Ecol Prog Ser 228:241–261. https:// doi. org/ 10. 3354/ meps2 28241
Woodward PW (1972) The natural history of Kure Atoll, northwestern Hawaiian islands. Atoll Res Bull 164:1-317. https:// doi. org/ 10. 5479/ si. 00775 630. 164.1
Wotherspoon SJ, Sumner MD, Lisovski S (2016) SGAT: solar/satellite geolocation for animal tracking. R package version 0.1.3. https:// github. com/ SWoth erspo on/ SGAT
Young H, Shaffer S, McCauley D, Foley D, Dirzo R, Block B (2010) Resource partitioning by species but not sex in sympatric boobies in the central Pacific Ocean. Mar Ecol Prog Ser 403:291–301. https:// doi. org/ 10. 3354/ meps0 8478
Publisher’s Note Springer Nature remains neutral with regard to jurisdictional claims in published maps and institutional affiliations.
Content courtesy of Springer Nature, terms of use apply. Rights reserved.

1.
2.
3.
4.
5.
6.
Terms and Conditions Springer Nature journal content, brought to you courtesy of Springer Nature Customer Service Center GmbH (“Springer Nature”). Springer Nature supports a reasonable amount of sharing of research papers by authors, subscribers and authorised users (“Users”), for small-scale personal, non-commercial use provided that all copyright, trade and service marks and other proprietary notices are maintained. Byaccessing, sharing, receiving or otherwise using the Springer Nature journal content you agree to these terms of use (“Terms”). For thesepurposes, Springer Nature considers academic use (by researchers and students) to be non-commercial. These Terms are supplementary and will apply in addition to any applicable website terms and conditions, a relevant site licence or a personalsubscription. These Terms will prevail over any conflict or ambiguity with regards to the relevant terms, a site licence or a personal subscription(to the extent of the conflict or ambiguity only). For Creative Commons-licensed articles, the terms of the Creative Commons license used willapply. We collect and use personal data to provide access to the Springer Nature journal content. We may also use these personal data internally withinResearchGate and Springer Nature and as agreed share it, in an anonymised way, for purposes of tracking, analysis and reporting. We will nototherwise disclose your personal data outside the ResearchGate or the Springer Nature group of companies unless we have your permission asdetailed in the Privacy Policy. While Users may use the Springer Nature journal content for small scale, personal non-commercial use, it is important to note that Users maynot:
use such content for the purpose of providing other users with access on a regular or large scale basis or as a means to circumvent access
control;
use such content where to do so would be considered a criminal or statutory offence in any jurisdiction, or gives rise to civil liability, or is
otherwise unlawful;
falsely or misleadingly imply or suggest endorsement, approval , sponsorship, or association unless explicitly agreed to by Springer Nature in
writing;
use bots or other automated methods to access the content or redirect messages
override any security feature or exclusionary protocol; or
share the content in order to create substitute for Springer Nature products or services or a systematic database of Springer Nature journal
content. In line with the restriction against commercial use, Springer Nature does not permit the creation of a product or service that creates revenue,royalties, rent or income from our content or its inclusion as part of a paid for service or for other commercial gain. Springer Nature journalcontent cannot be used for inter-library loans and librarians may not upload Springer Nature journal content on a large scale into their, or anyother, institutional repository. These terms of use are reviewed regularly and may be amended at any time. Springer Nature is not obligated to publish any information orcontent on this website and may remove it or features or functionality at our sole discretion, at any time with or without notice. Springer Naturemay revoke this licence to you at any time and remove access to any copies of the Springer Nature journal content which have been saved. To the fullest extent permitted by law, Springer Nature makes no warranties, representations or guarantees to Users, either express or impliedwith respect to the Springer nature journal content and all parties disclaim and waive any implied warranties or warranties imposed by law,including merchantability or fitness for any particular purpose. Please note that these rights do not automatically extend to content, data or other material published by Springer Nature that may be licensedfrom third parties. If you would like to use or distribute our Springer Nature journal content to a wider audience or on a regular basis or in any other manner notexpressly permitted by these Terms, please contact Springer Nature at