did behavioral mutual funds exploit market …...1 did behavioral mutual funds exploit market...
TRANSCRIPT

1
Did Behavioral Mutual Funds Exploit Market Inefficiencies
During or After the Financial Crisis?
Nikolaos Philippas*
August 2013
Abstract
This study examines the performance of mutual funds that employ investment strategies based
on the principles of behavioral finance, collectively known as “behavioral mutual funds”. A
series of performance measures is employed in order to test whether behavioral mutual funds
outperform the stock market, their benchmarks or passively managed index funds, using
monthly data for the period January 2007-March 2013. Results from the full sample and
subperiod analysis show that behavioral mutual funds actually exhibited poor performance,
both during the recent financial crisis and in its aftermath, rejecting the conjecture that the
crisis period would provide an ideal environment for their strategies to be profitable by
exploiting market inefficiencies and investors' behavioral biases.
Keywords: Behavioral Mutual Funds, Financial Crisis, Market Inefficiencies, Performance
Evaluation
JEL classification code: G15
*Department of Business Administration, University of Piraeus, Greece. E-mail: [email protected].

2
1. Introduction
The recent global crisis was characterized by a series of unprecedented events in the
financial markets and the banking sector showing that asset prices can deviate from their
fundamental values for a prolonged period and that market forces may be too slow or even
incapable of restoring equilibrium (see Brunnermeier, 2009, for a detailed account of the
crisis events). Brunnermeier (2001) has analyzed how asymmetric information and herding
behavior in periods of financial stress and turmoil can lead to bubbles and crashes harming
the price discovery mechanism of the market. Leading to the same conclusions, Gromb and
Vayanos (2010) have shown that assets’ mispricings may be persistent due to a series of
frictions that prevent arbitrageurs from eliminating them. Among these frictions,
Constantinides (1997) focused on the impact of the transaction costs on asset pricing and Shin
(2010) and Brunnermeier and Pedersen (2009) particularly emphasize the role of liquidity risk
that financially constrained intermediaries face.
Another strand of the literature attempts to explain the same market phenomena
resorting to the generic term “investor sentiment”, introduced by DeLong et al. (1990). As
Baker and Wurgler (2007, p. 129) note: “investor sentiment, defined broadly, is a belief about
future cash flows and investment risks that is not justified by the facts in hand”. This concept
has given rise to a voluminous literature in “behavioral finance” that borrows insights from
cognitive psychology to examine how investors’ biases can affect their financial decision
making and, in aggregation, the formation of market prices (see Shefrin, 2000 for an
introduction). Apart from enhancing our understanding of extreme phenomena in financial
markets, the concept of investor sentiment has recently proved quite useful for asset pricing
too (see Brown and Cliff, 2005, Baker and Wurgler, 2006 and Kumar and Lee, 2006).
The appeal of the investor sentiment approach led to the introduction of mutual funds
that follow investment strategies trying to exploit behavioral biases and market anomalies for
the benefit of their shareholders. These are collectively termed as “behavioral mutual funds”.
However, this market development also poses a real challenge to this investment approach,

3
allowing us to test whether it actually yields superior returns when it is implemented by
professional fund managers. This is the aim of this study. In particular, the paper presents a
series of raw as well as risk-adjusted performance measures to examine whether behavioral
funds outperform their benchmark indices, market returns and passive mutual funds (index
funds, ETFs), using monthly data for the period January 2007-March 2013. Moreover, a
subperiod analysis is conducted, distinguishing between the crisis period, January 2007-
December 2009 and the post-crisis period, January 2010-March 2013. We conjecture that
persistent mispricings during the crisis period, which were caused by "limits to arbitrage" as
previously discussed, would be more difficult to exploit by institutional investors relative to
opportunistic mispricings due to investors’
The present study contributes to the limited existing literature on the performance
evaluation of behavioral mutual funds in a series of ways. This paper is the first to examine
how these behavioral funds performed during and after the recent financial crisis period,
providing an ideal environment to test the conjecture that their strategies can exploit market
inefficiencies and investors
behavioral biases arising in the aftermath of the
crisis.
’ behavioral biases. Secondly, a larger number of funds is
employed relative to previous studies in the literature (see Wright, Banerjee and Boney, 2006,
and Reinhart and Brennan, 2007), who reported inconclusive evidence due to the very small
number of funds and short time period they examined. Thirdly, in contrast to the recent study
of Santoni and Kelshiker (2010), who provide mainly descriptive statistics on funds’
The larger number of funds and the use of various performance measures allows us to
reach the following conclusions. The results indicate that behavioral funds’ managers neither
outperformed their benchmarks nor they exhibited market timing ability during the examined
sample period. To the contrary, economically and statistically significant underperformance is
performance, we use a plethora of sophisticated performance evaluation measures that can
formally test the existence of superior managerial performance adjusting for common risk
factors and using different benchmark indices as well as for their market timing ability.

4
reported for a number of funds relative to the market and their benchmark indices. This
evidence remains intact even when we distinguish between the crisis period and its aftermath.
Moreover, there is no evidence that behavioral funds follow any particular investment style,
such as size, value or momentum strategies.
The rest of the study is organized as follows. Section 2 provides a brief background
on the global mutual fund industry and behavioral funds’ sector. Section 3 contains the details
regarding the dataset and the definitions of the performance measures. Section 4 presents and
discusses the empirical results of the study, while Section 5 concludes.
2. Global fund industry and behavioral funds
The importance of mutual funds in financial markets has dramatically risen over the
past twenty five years, due to their unique benefits for individual investors (see Philippas and
Tsionas, 2002, for a detailed discussion). The extensive variety of available mutual funds
necessitates a comprehensive performance evaluation of mutual fund managers to identify
whether fund managers actually add value in shareholder portfolios or they simply waste
resources through the active management strategies they employ (Philippas and Tsionas,
2002).
Fund managers’ ability to outperform the market has been a subject of debate during
the last decades. Previous research indicates that, on average, traditional active mutual funds
tend to underperform their passive benchmarks1 (see Babalos et al., 2012, for recent
evidence). According to Wermers (2000), actively managed mutual funds do not succeed in
outperforming the market on a risk-adjusted basis. In fact, high costs of actively managed
U.S. equity mutual funds reduce returns below market’s returns (see Fama and French, 2010).
A comprehensive study by Bogle (2005) documented that the average equity net-of-expenses
fund return for the period 1983-2003 did not exceed the corresponding market index return.
This finding provides a rationale for the dramatic rise of indexing and low cost passive
investment strategies.

5
Performance evaluation of behavioral funds is a relatively new field of research; it
examines whether fund managers can actually exploit market inefficiencies as well as
documented behavioral biases. In fact, as previous studies have identified, behavioral funds’
strategies are not based on the classical portfolio theory but implicitly accept investors’
irrational behavior and the possibility of abnormal returns by acknowledging potential market
inefficiencies (see Reinhart and Brennan, 2007 and Santoni amd Kelshiker, 2010, for a
discussion). As expected, behavioral funds do not explicitly state their particular investment
strategies, since this is their comparative advantage relative to their competitors.
Reinhart and Brennan (2007) examined the performance of 9 behavioral mutual funds
during the period 1997-2003; they also compared behavioral funds’ performance with
traditional mutual funds (in terms of premia, alphas, Sharpe ratios, Treynor ratios and
information ratios) and showed that inefficiencies can actually improve portfolios’
performance, mainly when examining large-cap behavioral funds. In the same spirit, Wright
et al. (2006) examined the performance of 16 behavioral funds since their inception date,
identifying their ability to attract investment flows. They found that even though behavioral
funds as a group outperform S&P 500 index funds, they did not deliver abnormal returns once
they account for size, value and momentum factors in line with the Fama-French 3-factor and
Carhart 4-factor models; this is because behavioral funds exhibited a heavy loading on the
value factor. More recently, Santoni and Kelshiker (2010) analyzed the performance of 31
international behavioral mutual funds from 1997 to 2003. These studies yielded mixed
evidence regarding the funds’ performance. This is because they examine a relatively small
number of funds, using different and rather short sample periods. Moreover, with the
exception of Wright et al. (2006), this mixed evidence can be attributed to the use of rather
simple performance measures that fail to properly account for market risk as well as other
common factors, such as size, value and momentum.

6
3. Data and Methodology
The study covers the recent global financial crisis period and its aftermath, i.e. the
period from January 2007 to March 2013, and examines the performance of 22 US behavioral
mutual funds using monthly returns.2
-Table 1 here-
Table 1 provides the details of the funds used. To build
our dataset, we firstly include the same funds that prior studies have used (see Reinhart and
Brennan, 2007, Wright et al., 2006, 2008, and Santoni and Kelshiker, 2010). In addition to
these funds, an extensive search on Bloomberg fund database was conducted in order to
identify other funds that explicitly state in their prospectuses that they follow behavioral
strategies. Moreover, two Index Funds (VFINX- Vanguard 500 Index Fund and FUSEX -
Fidelity S&P 500 Index Fund) and one ETF written on S&P 500 (SPY - SPDR S&P 500 ETF
Trust) are employed as the most representative funds of passive management. These passive
funds are used as a benchmark of comparison for behavioral funds. Data regarding market,
funds’ and benchmarks’ returns were sourced from Bloomberg, Financial Industry Regulatory
Authority, Lipper as well as individual mutual fund companies. Bloomberg is also the source
for the funds’ characteristics used in the cross-sectional analysis of their performance.
Monthly returns for the market, risk free rate, size (SMB), value (HML) and momentum
(UMD) factors are sourced from Kenneth French’s online data library.
The analysis is conducted in two stages. Firstly, we estimate average monthly returns
as well as the standard deviation of returns and the beta coefficient of the funds from the
Capital Asset Pricing Model (CAPM). Secondly, we employ several performance measures
on a risk-adjusted basis. The most commonly used risk-adjusted performance measures are
Sharpe (1966) and Treynor (1965) ratios that measure funds’ reward (excess return) to
variability captured either by standard deviation of returns or by beta coefficient.
Sharpe ratio is defined as follows:
Sharpe Ratio = (Rp−Rf )/ sdp (1)

7
where Rp is the return of the portfolio/fund, Rf is the risk free rate and sdp
Treynor ratio is defined as follows:
is the standard
deviation of the mutual fund’s returns (total risk).
Treynor Ratio = (Rp−Rf )/ βp (2)
where Rp is the return of the fund, Rf is the risk free rate and βp
Apart from the simple risk-adjusted measures, we also estimate funds’ abnormal
return after accounting for several risk factors. The models used include the Jensen’s model
(1968), the Treynor and Mazuy’s model (1966), as well as the Carhart’s model (1997). Jensen
(1968) estimated the following single factor model to measure portfolios’ abnormal
performance:
is the mutual fund’s beta
coefficient of systematic risk from the CAPM.
( )pt f p p mt f ptR R R Rα β ε− = + − + (3)
where Rpt is the return of the fund p, Rmt is the return of the market portfolio, αp is a measure
of security selection ability (abnormal return), βp is the beta coefficient of the portfolio p and
εpt
Carhart (1997) added the well known momentum factor to the traditional Fama-
French 3-factor model, providing an alternative measure for fund managers’ selectivity skill
(Carhart’s alpha), as follows:
is a random error.
( )pt f p p mt f p t p t p t ptR R R R s SMB h HML m UMDα β ε− = + − + + + + (4)
where Rmt-Rf, SMBt and HMLt stand for the returns of Fama and French’s factor-mimicking
portfolios on the market, size and value, respectively, while UMDt
The previous models for estimating abnormal performance do not capture a
manager’s potential market timing skill, which is also very important especially during
periods of financial crisis. In fact, the funds’ risk level is not expected to be constant because
is the return of Carhart’s
momentum factor.

8
fund managers may shift their portfolios’ risk composition according to their expectations
about the direction of the market (bull/bear market). Treynor and Mazuy (1966) proposed a
simple method that has been widely used in order to jointly identify potential stock selection
(selecting the better performing stocks) and market timing (shift risk composition according
to market conditions) abilities of the fund managers. Treynor and Mazuy (1966) added a
quadratic term to equation (3) in order to test for potential fund manager’s market timing
ability. In this case, the fund return will be a nonlinear function of the market return as
follows:
ptfmtpfmtppfpt RRcRRaRR εβ +−+−+=− 2)()( (5)
where all variables have been already defined. A positive and statistically significant value of
coefficient cp indicates the existence of a positive market timing skill. In this case, the last
term of the equation will make the characteristic line steeper as Rm
2( ) ( )p tf p p mt f p mt f p t p t p t p tR R a R R c R R s SMB h HML m UMDβ ε− = + − + − + + + +
becomes greater. For
robustness, we have also augmented the Treynor-Mazuy model to further adjust for size,
value and momentum premia. The augmented Treynor-Mazuy model is given by:
(6)
Finally, we have modified the Treynor-Mazuy model to include SMB, HML and
MOM factors in levels as well as their squares. In this way, one could test for the funds'
timing ability with respect to these factors as follows:
ptpptppptppptpfmtppfpt UMDmUMDmHMLhHMLhSMBsSMBsRRaRR εβ +++++++−+=− 221
221
221)(
5
(7)
where Rmt-Rf, SMBt and HMLt stand for the returns of Fama and French’s factor-mimicking
portfolios on the market, size and value, respectively, UMDt
is the return of Carhart’s
momentum factor.
4. Results
This section presents the empirical results of the study. Table 2 presents the results
for the simple risk-adjusted performance measures (Sharpe ratio and Treynor ratio) as well as

9
the average monthly return, the standard deviation of returns and the systematic risk beta
coefficient. Overall, funds’ betas were very close to 1 and, with the exception of few funds
that exhibited negative average returns, most of the funds exhibited Sharpe and Treynor ratios
that are comparable to the ones yielded by the S&P 500 and passive index funds.
-Table 2 here-
Table 3 presents the empirical results using Jensen’s alpha as performance measure.
Panel A reports results for the full sample period January 2007 - March 2013, while Panels B
and C report the corresponding results for the subperiods January 2007 - December 2009 and
January 2010 - March 2013.3
-Table 3 here-
There is no fund that yielded economically or statistically
significant Jensen alpha in the full sample period. To the contrary, there are 8 funds that
actually yielded significantly negative alphas. Very similar are the results from the subperiod
analysis. In particular, there is only one fund that exhibited a significantly positive Jensen
alpha during the crisis period. In the aftermath of the crisis period, when these funds could
potentially exploit investors’ biases, most of them yielded negative market-adjusted returns,
which was found to be even statistically significant for 9 funds. Our results are in broad
agreement with Santoni and Kelshiker (2010), who found no evidence of outperformance in
terms of Jensen alphas, but contrasts the findings of Wright et al. (2006). This is due to the
fact that the latter study examined a much earlier sample period (mostly before 2004), when
behavioral funds were much smaller in size and could potentially implement their strategies in
a profitable manner.
Table 4 reports the corresponding full sample results when we use the benchmark
index that each fund self-reports rather than the market index. Again, there is no evidence of
significant outperformance, but now there are fewer negative alpha estimates and only 2 of
them are statistically significant. In sum, using self-reported benchmark indices yields a more
favourable picture for funds’ performance, but still there is no evidence of outperformance.
-Table 4 here-

10
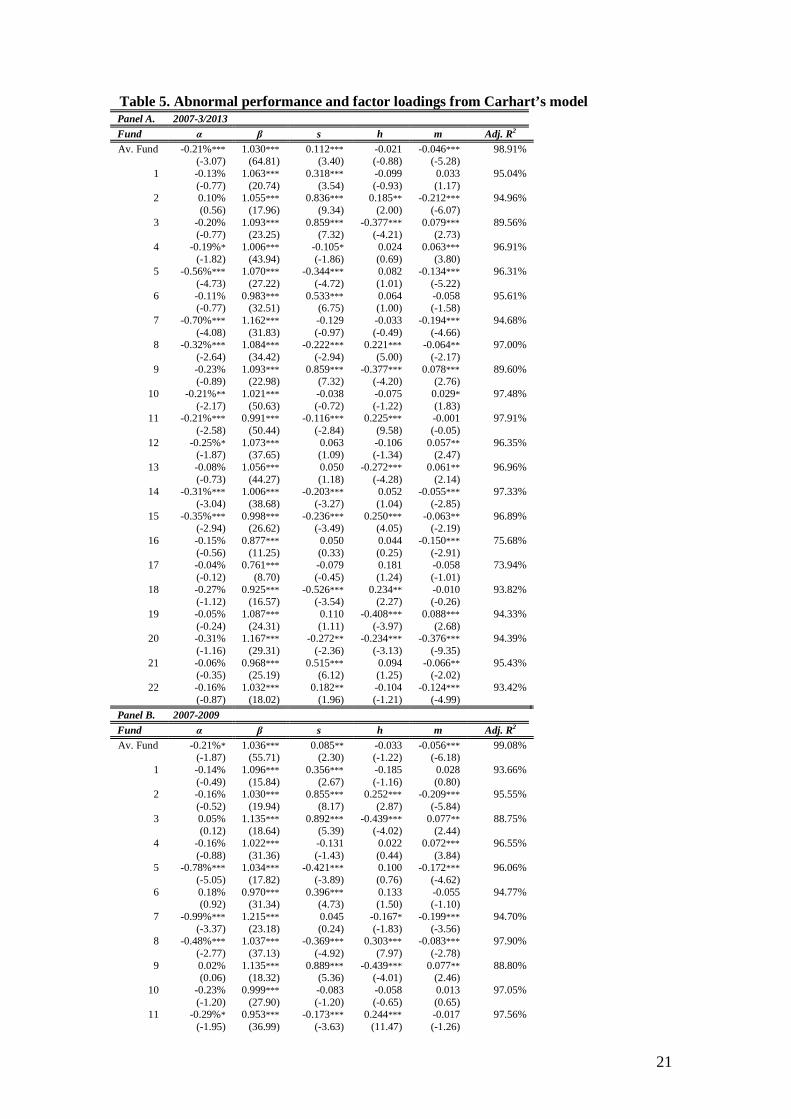
Following the approach of Wright et al. (2006), Table 5 reports funds’ alphas
estimated from the Carhart model in (4), i.e. after adjusting for market, size, value and
momentum premia. As in Table 3, we report results for the full sample period in Panel A and
the corresponding subperiod results in Panels B and C, respectively. Carhart alphas yield
results that are very similar to the ones using Jensen alphas. For the majority of funds we
report negative risk-adjusted performance and for a large number of them, this evidence is
economically and statistically significant. These findings hold in the full sample period as
well as in the subperiods considered. It should be noted that there is no fund, regardless of the
period examined, that yields a significant positive Carhart alpha. These results are
qualitatively similar to the evidence provided by Wright et al. (2006), who also find no
significant outperformance using the 4-factor Carhart model. They argue that Carhart alphas
are reduced relative to Jensen alphas because of funds’ positive loading to value (HML)
factor. Contrary to their results, we do not find any systematic evidence that behavioral funds
mimic value strategies. Moreover, while we find significant loadings on the size and
momentum factors, these are positive for some funds and negative for others, and hence it
cannot be argued that these funds systematically implemented size or momentum strategies.
Finally, when we use as benchmark index the one that funds self-reported, this significant
underperformance disappears and Carhart alphas reported in Table 6 are mostly insignificant.
-Tables 5 and 6 here-
We further augment Carhart’s model with an additional explanatory variable in order
to estimate managers’ ability to capture market sentiment, as it is proxied by the CBOE
implied volatility index VIX (see Baker and Wurgler, 2006). According to the results reported
in Panel A of Table 7 none of the funds has a statistically significant sentiment coefficient (v)
in the full sample period. Only during the recovery period from 2010 to March 2013 (Panel
C) do we identify three funds with positive and two funds with negative and statistically
significant VIX coefficients.
-Table 7 here-

11
The next step is to estimate the Treynor-Mazuy model to examine whether these
funds had significant market timing ability. Results are reported in Table 8 for the full sample
period (Panel A) as well as the two subperiods we examine (Panels B and C, respectively).
We find no fund with a positive stock picking ability, while 6 funds have negative and
statistically significant alphas in the full sample period. Moreover, none of the funds has a
superior market timing skill, while four funds exhibited negative market timing ability.4
-Tables 8 and 9 here-
Negative market timing can have devastating consequences for the funds’ shareholders,
particularly during prolonged bear markets. The subperiod results are similar, with the
exception that there were some funds that had significant positive timing ability during the
crisis. During the post-crisis period, there was no such evidence, also indicating that this
timing ability was short-lived. For robustness, we have repeated this exercise by adjusting for
size, value and momentum factors, estimating the augmented Treynor-Mazuy model specified
in (6). The results reported in Table 9 are very similar, with the addition that the previously
reported positive timing ability during the crisis period has now disappeared. Overall, these
results are in agreement with the evidence provided by Santoni and Kelshiker (2010), who
find no significant evidence to support that behavioral funds can anticipate market reversals.
Furthermore, the results reported in the Table 10 indicate little significant evidence of
funds' timing ability with respect to the SMB, HML and MOM factors (model 7). Only few
funds exhibit significant ability with respect to the HML or MOM factor, but even among
these funds, half of them exhibit negative rather than positive timing ability.
-Table 10 here-
The final step in our analysis is to examine what fund characteristics affect their
performance. To this end, we regress funds’ Jensen alpha or, alternatively, Carhart alpha full
sample estimates on their age, size (assets under management), management stated fee and
total expense ratio. Results from this cross-sectional regression are reported in Table 11. The
only significant relationship found is the one between fund performance and size. This finding

12
is consistent with the commonly stated assumption of decreasing returns to scale for fund
performance (see, for example, Berk and Green, 2004; Alexakis and Tsolas, 2011 etc.). Since
the cross-section of the examined funds is rather small, and hence we have very few degrees
of freedom in the performed regression, we also report pairwise correlations between alphas
(Jensen and Carhart) and each of these characteristics. In particular, we report in Table 12
both Pearson correlation coefficients (Panel A) and Spearman (rank) correlation coefficients
(Panel B). Again, the most notable and consistent relationship across the various measures
appears to be the negative correlation between funds’ performance and their size.
-Tables 11 and 12 here-
5. Conclusion
This paper examines the performance of US behavioral mutual funds during the
recent financial crisis period and its aftermath, when market inefficiencies were more likely to
lead to profitable trading strategies. Contributing to the limited prior literature on behavioral
mutual funds (Wright et al., 2006, Reinhart and Brennan, 2007, and Santoni and Kelshiker,
2010), we use a series of raw as well as risk-adjusted performance measures to test whether
behavioral mutual funds outperform their benchmark indices, market returns and passive
mutual funds (index funds, ETFs).
The results indicate that there is no evidence of outperformance of behavioral funds
versus the market return and respective benchmark indices on a risk-adjusted basis. To the
contrary, we find that some funds significantly underperform their benchmarks both in
economic and in statistical terms. Moreover, there is no evidence that these funds
systematically follow size, value or momentum investment strategies. We also find no
evidence to support the argument that these funds could time the market by suitably
modifying their market exposure. To the contrary, a number of funds exhibited negative
timing ability. Finally, when analyzing the determinants of funds’ performance, we find a
negative correlation with their size as measured by total assets under management. When

13
detailed funds’ stock holdings become available, a more detailed analysis could examine the
particular investment strategies that these funds follow and whether these strategies exploit
market inefficiencies for the benefit of funds’ shareholders. We leave this issue for future
research.
Endnotes
1. Identifying the appropriate benchmark index is of particular importance in order to
measure the performance of the fund managers (Tabner, 2009).
2. There is one more behavioral fund with inception date 8/9/2011. Since we do not have
enough observations to evaluate the funds’ performance during the crisis period we
exclude this fund from our sample.
3. We would like to thank an anonymous referee for this suggestion.
4. These results are also in accordance with relevant market timing studies regarding
mutual funds (e.g. Elton, Gruber and Blake, 2012) or closed end funds (e.g. Kousenidis
and Negakis, 2012) revealing that on average fund managers do not present superior
market timing skills.
5. We would like to thank an anonymous referee for this suggestion.
References
Alexakis, P., and Tsolas, I., 2011. Appraisal of mutual equity fund performance using data
envelopment analysis. Multinational Finance Journal
Babalos, V., Philippas, N., Doumpos, M., and Zopounidis C., 2012. Mutual funds
performance appraisal using stochastic multicriteria acceptability analysis.
15: 273-296.
Applied
Mathematics and Computation 218: 5693–5703.

14
Baker, M., and Wurgler, J., 2006. Investor sentiment and the cross-section of stock returns.
Journal of Finance
Baker, M., and Wurgler, J., 2007. Investor sentiment and the stock market.
61: 1645–1680.
Journal of
Economic Perspectives
Berk, J., and Green, R., 2004. Mutual fund flows and performance in rational markets.
21: 129-151.
Journal of Political Economy
Bogle, J., 2005. The Mutual Fund Industry 60 Years Later: For Better or Worse?.
112: 1269-1295.
Financial
Analysts Journal
Brown, G. W., and Cliff, M. T., 2005. Investor sentiment and asset valuation.
61: 15-24.
Journal of
Business
Brunnermeier, M. K., 2001. Asset Pricing under Asymmetric Information: Bubbles, Crashes,
Technical Analysis and Herding. Oxford University Press.
78: 405-440.
Brunnermeier, M. K., 2009. Deciphering the Liquidity and Credit Crunch 2007-2008. Journal
of Economic Perspectives
Brunnermeier, M. K., and Pedersen, L. H., 2009. Market Liquidity and Funding Liquidity.
23: 77-100.
Review of Financial Studies
Carhart, M. M., 1997. On persistence in mutual fund performance.
22: 2201-2238.
Journal of Finance
Constantinides, G. M., 1997. Transaction costs and the pricing of financial assets.
52: 52–
82.
Multinational Finance Journal
DeLong, J. B., Shleifer, A., Summers, L. H., and Waldmann, R. J., 1990. Noise Trader Risk
in Financial Markets.
1: 93-99.
Journal of Political Economy
Elton, E. J., Gruber, M. J., and Blake, C. R., 2012. An examination of mutual fund timing
ability using monthly holdings data.
98: 703-738.
Review of Finance
Fama, E. F., and French K. R., 2010. Luck versus Skill in the Cross-Section of Mutual Fund
Returns.
16: 619-645.
Journal of Finance 65: 1915-1947.

15
Gromb, D., and Vayanos, D., 2010. Limits of Arbitrage: The State of the Theory. Annual
Review of Financial Economics
Jensen, M., 1968. The performance of mutual funds in the period 1945–64.
2: 251-275.
Journal of Finance
Kousenidis, D., and Negakis, C., 2012. The Underperformance of Young Closed-End Funds
in Greece.
23: 389–416.
Multinational Finance Journal
Kumar, A., and Lee, C. M. C., 2006. Retail investor sentiment and return comovements.
, forthcoming.
Journal of Finance
Philippas, N., and Tsionas, E., 2002. Performance Evaluation: A Review Article and an
Empirical Investigation of Greek Mutual Fund Managers.
61: 2451-2486.
The International Business and
Economics Journal
Reinhart, W. J., and Brennan, M., 2007. Behavioral Portfolios Performance Measurement.
1: 31-44.
Financial Decisions
Santoni, A., and Kelshiker, A. R., 2010. Behavioral Finance: An Analysis of the Performance
of Behavioral Finance Funds.
19: 1-15.
The Journal of Index Investing
Sharpe, W. F., 1966. Mutual fund performance.
1: 56-72.
Journal of Business
Shefrin, H., 2000. Beyond Greed and Fear: Understanding Bahavioral Finance and the
Psychology of Investing, Oxford University Press.
39: 119–138.
Shin, H. S., 2010. Risk and Liquidity. Clarendon Lectures in Finance, Oxford University
Press.
Tabner, I. T., 2009. Benchmark Concentration: Capitalization Weights Versus Equal Weights
in the FTSE 100 Index. Multinational Finance Journal
Treynor, J., 1965. How to rate management of investment funds.
13: 209–228.
Harvard Business Review
Treynor, J., and Mazuy, K., 1966. Can mutual funds outguess the market?
43: 63–75.
Harvard Business
Review 44: 131–136.

16
Wermers, R., 2000. Mutual Fund Performance: An Empirical Decomposition into Stock-
Picking Talent, Style, Transactions Costs, and Expenses. Journal of Finance
Wright, C., Banerjee, P., and Boney, V., 2006. Behavioral Finance: Are the Disciples
Profiting from the Doctrine?
55: 1655 –
1695.
The Journal of Investing
17: 82-90 (2008).

17
Table 1. Dataset of behavioral mutual funds
Ticker Name Category Inception date Sample period 1 WOOPX JPMorgan Intrepid Mid Cap Fund Mid-Cap Core 1/6/1991 4/1/2007-28/3/2013
2 UBVLX Undiscovered Managers Behavioral Value Fund Small-Cap Value 28/12/1998 4/1/2007-28/3/2013
3 UBRLX Undiscovered Managers Behavioral Growth Fund Small-Cap Growth 31/12/1997 4/1/2007-31/10/2012
4 HIEZX Virtus Value Equity Fund Multi-Cap Value 11/2/1999 4/1/2007-28/9/2012
5 KDHAX DWS Strategic Value Fund Large-Cap Core 18/3/1988 4/1/2007-28/3/2013 6 KDSAX DWS Dreman Small Cap Value Fund Small-Cap Value 22/5/1992 4/1/2007-28/3/2013
7 LMVTX Legg Mason Capital Management Value Trust Large-Cap Core 16/4/1982 4/1/2007-28/3/2013
8 LSVEX LSV Value Equity Fund Multi-Cap Value 31/3/1999 4/1/2007-28/3/2013
9 UBGAX Undiscovered Managers Behavioral Growth Fund Small-Cap Growth 4/6/2004 4/1/2007-31/10/2012
10 JPIAX JPMorgan Intrepid America Fund Large-Cap Core 28/2/2003 4/1/2007-28/3/2013 11 JPIVX JPMorgan Intrepid Value Fund Large-Cap Value 28/2/2003 4/1/2007-28/3/2013 12 JIISX JPMorgan Intrepid Multi Cap Fund Multi-Cap Core 28/2/2003 4/1/2007-28/3/2013 13 JPGSX JPMorgan Intrepid Growth Fund Large-Cap Growth 28/2/2003 4/1/2007-28/3/2013 14 LSVPX LSV Conservative Core Equity Fund Large-Cap Value 22/5/2007 6/6/2007-28/3/2013 15 LSVVX LSV Conservative Value Equity Fund Multi-Cap Value 30/3/2007 24/4/2007-28/3/2013 16 OSEUSBV Degroof - Equities US Behavorial Value Large-Cap Value 30/1/2004 4/1/2007-28/3/2013 17 DEGUSBA Degroof - Equities US Behavioral Flexible Large-Cap Blend 29/11/2007 20/5/2008-28/3/2013 18 SSLAX Sunamerica Focused Large-Cap Value Large-Cap Value 15/10/1997 4/1/2007-23/10/2009
19 NLCIX Nicholas Applegate Institutional Funds US Systematic Large Cap Growth Fund Large Cap Growth 14/1/2000 4/1/2007- 19/3/2010
20 DRQLX Dreman Market Over-Reaction Fund Large Cap Value 3/4/2007 3/4/2007-30/11/2012 21 DRISX Dreman Contrarian Small Cap Value I Small Cap Value 20/8/2007 20/8/2007-28/3/2013
22 DRMVX Dreman Contrarian Mid Cap Value Institutional Mid-Cap Value 31/12/2003 4/1/2007-30/11/2012
Sources: Bloomberg, Mutual Funds Companies

18
Table 2. Descriptive statistics and behavioral funds’ risk-adjusted performance
Fund Av. monthly
return St. Dev. beta Sharpe ratio Treynor ratio Av. Fund 0.33% 5.57% 1.067 0.044 0.23%
1 0.47% 5.82% 1.088 0.066 0.36% 2 0.80% 7.54% 1.351 0.094 0.53% 3 0.40% 6.73% 1.144 0.047 0.28% 4 0.16% 5.24% 0.962 0.013 0.07% 5 -0.10% 5.80% 1.082 -0.033 -0.18% 6 0.50% 6.08% 1.125 0.067 0.36% 7 -0.13% 6.56% 1.217 -0.034 -0.18% 8 0.14% 5.93% 1.117 0.009 0.05% 9 0.37% 6.73% 1.144 0.043 0.25%
10 0.30% 5.17% 0.985 0.041 0.22% 11 0.22% 5.36% 1.017 0.026 0.13% 12 0.30% 5.49% 1.036 0.038 0.20% 13 0.49% 5.23% 0.981 0.076 0.41% 14 0.08% 5.46% 1.001 -0.001 0.00% 15 0.01% 5.63% 1.034 -0.013 -0.07% 16 0.32% 5.78% 0.964 0.040 0.24% 17 0.42% 5.36% 0.818 0.061 0.40% 18 -0.86% 5.68% 0.919 -0.166 -1.03% 19 -0.12% 5.65% 0.925 -0.036 -0.22% 20 0.07% 7.21% 1.237 -0.002 -0.01% 21 0.56% 6.33% 1.120 0.074 0.42% 22 0.28% 6.06% 1.102 0.032 0.17%
SPY 0.27% 5.04% 0.967 0.035 0.18% VFINX 0.27% 5.05% 0.971 0.036 0.18% FUSEX 0.27% 5.03% 0.966 0.037 0.19% S&P 500 0.27% 5.08% 0.977 0.035 0.18% Market 0.50% 5.18% 1.000 0.079 0.41%
Notes: This table reports the average monthly return, the standard deviation of returns (St. Dev.), the coefficient of systematic risk (beta), Sharpe ratio and Treynor ratio for the average behavioral fund (average return of the 22 behavioral funds), the individual twenty two behavioral funds, the three passive funds, the S&P 500 index and the US market return as proxied by the US market returns retrieved from the Kenneth French’s online data library. Monthly data for the period from January 2007 to March 2013.

19
Table 3. Jensen alphas and CAPM betas for Behavioral funds Panel A. 2007-3/2013 Panel B. 2007-2009 Panel C. 2010-3/2013
Fund α β Adj. R 2 α β Adj. R 2 α β Adj. R2
Av. Fund -0.19%*** 1.067*** 98.61% -0.13% 1.082*** 98.71% -0.23%** 1.049*** 98.39% (-2.90) (64.08) (-1.21) (63.38) (-2.03) (31.17)
1 -0.06% 1.088*** 93.93% -0.04% 1.075*** 92.38% -0.11% 1.110*** 95.75% (-0.33) (25.78) (-0.15) (16.81) (-0.50) (24.75)
2 0.16% 1.351*** 86.13% 0.24% 1.394*** 83.99% 0.17% 1.288*** 89.26% (0.47) (16.51) (0.36) (14.01) (0.50) (8.52)
3 0.02% 1.144*** 81.73% 0.28% 1.085*** 80.05% -0.40% 1.259*** 84.47% (0.06) (14.02) (0.62) (9.31) (-0.84) (11.43)
4 -0.21%* 0.962*** 96.43% -0.27% 0.953*** 95.74% -0.17% 0.973*** 97.24% (-1.73) (43.69) (-1.22) (27.41) (-1.41) (41.60)
5 -0.64%*** 1.082*** 93.46% -0.73%*** 1.132*** 92.11% -0.42%*** 0.994*** 96.70% (-4.14) (21.92) (-2.73) (15.24) (-4.05) (44.22)
6 -0.05% 1.125*** 92.05% 0.32% 1.111*** 91.68% -0.46%* 1.174*** 93.21% (-0.27) (22.88) (1.20) (20.54) (-1.78) (13.97)
7 -0.72%*** 1.217*** 92.34% -0.75%* 1.327*** 92.70% -0.45%** 1.041*** 94.80% (-3.01) (23.78) (-1.73) (27.22) (-2.43) (23.30)
8 -0.40%*** 1.117*** 95.40% -0.55%** 1.132*** 94.67% -0.23% 1.082*** 96.38% (-2.67) (30.09) (-2.17) (21.25) (-1.20) (21.11)
9 -0.01% 1.144*** 81.76% 0.25% 1.085*** 80.14% -0.43% 1.259*** 84.43%
(-0.04) (13.96) (0.56) (9.26) (-0.91) (11.46) 10 -0.19%** 0.985*** 97.25% -0.26% 0.959*** 96.96% -0.18%* 1.020*** 97.62%
(-2.14) (36.89) (-1.53) (22.96) (-1.73) (64.72) 11 -0.28%** 1.017*** 96.91% -0.36%* 1.010*** 96.21% -0.22%** 1.022*** 97.69%
(-2.39) (45.87) (-1.67) (28.91) (-2.05) (44.39) 12 -0.22% 1.036*** 95.81% -0.34% 1.012*** 94.28% -0.14% 1.065*** 97.82%
(-1.64) (28.29) (-1.39) (17.84) (-1.23) (54.89) 13 0.00% 0.981*** 94.66% 0.06% 0.955*** 94.03% -0.13% 1.026*** 95.42%
(-0.03) (24.31) (0.29) (16.12) (-0.88) (30.39) 14 -0.35%*** 1.001*** 96.53% -0.43%** 1.008*** 96.70% -0.27%** 0.985*** 95.88%
(-3.34) (43.18) (-2.06) (26.73) (-2.29) (41.46) 15 -0.45%*** 1.034*** 94.67% -0.65%** 1.040*** 93.14% -0.26%* 1.008*** 96.81%
(-2.76) (22.97) (-2.18) (14.39) (-1.84) (23.47) 16 -0.17% 0.964*** 74.43% -0.16% 1.078*** 79.24% 0.09% 0.783*** 65.45%
(-0.67) (13.08) (-0.48) (13.54) (0.21) (9.14) 17 -0.07% 0.818*** 73.91% -0.45% 0.993*** 90.96% 0.47% 0.561*** 48.72%
(-0.24) (9.74) (-1.49) (19.51) (1.19) (5.27) 18 -0.40% 0.919*** 90.37% -0.40% 0.919*** 90.37% - - -
(-1.43) (16.00) (-1.43) (16.00) 19 -0.06% 0.925*** 88.52% 0.06% 0.937*** 89.31% - - -
(-0.19) (11.45) (0.17) (10.91) 20 -0.28% 1.237*** 85.96% 0.47% 1.365*** 89.34% -0.74%* 1.080*** 83.66%
(-0.72) (13.55) (0.76) (13.07) (-1.77) (11.68) 21 0.03% 1.120*** 91.95% 0.57%* 1.109*** 92.06% -0.43%* 1.172*** 92.85%
(0.12) (19.41) (1.82) (16.25) (-1.65) (14.33) 22 -0.10% 1.102*** 92.14% 0.10% 1.124*** 91.45% -0.28% 1.082*** 93.22%
(-0.58) (23.75) (0.35) (18.14) (-1.19) (17.02) Notes: This table reports the empirical results using Jensen’s model (1968): ( )pt f p p mt f ptR R R Rα β ε− = + − + , where Rpt is the return of the
fund p and Rmt is the return of the market portfolio. Panel A reports the results for the full sample period January 2007- March 2013, while Panels B and C report the corresponding results for the subperiods January 2007- December 2009 and January 2010- March 2013. t-statistics reported in the parentheses are calculated using Newey-West heteroscedasticity and autocorrelation consistent standard errors. ***, ** and * represent statistical significance at the 1%, 5%, and 10% level, respectively.

20
Table 4. Jensen alphas and CAPM betas for Behavioral funds relative to benchmark index 2007-3/2013
Fund α β Adj. R2
1 -0.02% 0.948*** 97.70% (-0.17) (35.30)
2 0.49%* 1.102*** 93.12% (1.87) (20.82)
3 -0.11% 0.972*** 91.15% (-0.49) (23.96)
4 0.19% 0.913*** 93.93% (1.15) (20.73)
5 -0.39%*** 1.109*** 94.31% (-3.01) (23.90)
6 0.24% 0.882*** 91.83% (1.21) (26.86)
7 -0.45%* 1.241*** 92.11% (-1.81) (25.49)
8 0.02% 1.082*** 97.51% (0.17) (50.46)
9 -0.14% 0.972*** 91.20% (-0.62) (24.04)
10 0.00% 0.986*** 97.36% (0.01) (36.11)
11 0.10% 0.980*** 98.01% (1.61) (41.20)
12 -0.02% 1.020*** 95.74% (-0.16) (28.05)
13 0.00% 1.009*** 97.98% (0.05) (41.95)
14 -0.12% 1.027*** 97.22% (-1.27) (50.77)
15 -0.05% 1.008*** 98.14% (-0.75) (57.30)
16 -0.01% 0.954*** 75.01% (-0.03) (13.46)
17 0.07% 0.809*** 74.47% (0.26) (9.91)
18 0.05% 0.873*** 92.79% (0.23) (31.92)
19 -0.13% 0.969*** 95.19% (-0.58) (22.72)
20 0.23% 1.179*** 84.48% (0.50) (12.96)
21 0.22% 0.887*** 92.66% (1.08) (26.55)
22 -0.05% 0.956*** 95.08% (-0.43) (38.73)
Notes: This table reports the empirical results using Jensen’s model (1968) relative to each individual fund benchmark index:
( )pt f p p mt f ptR R R Rα β ε− = + − + , where Rpt is the return of the fund p and Rmt
is the return of the benchmark
index, for the period January 2007 to March 2013. t-statistics reported in the parentheses are calculated using Newey-West heteroscedasticity and autocorrelation consistent standard errors. ***, ** and * represent statistical significance at the 1%, 5%, and 10% level, respectively.
21
Table 5. Abnormal performance and factor loadings from Carhart’s model Panel A. 2007-3/2013 Fund α β s h m Adj. R2 Av. Fund -0.21%*** 1.030*** 0.112*** -0.021 -0.046*** 98.91%
(-3.07) (64.81) (3.40) (-0.88) (-5.28) 1 -0.13% 1.063*** 0.318*** -0.099 0.033 95.04% (-0.77) (20.74) (3.54) (-0.93) (1.17)
2 0.10% 1.055*** 0.836*** 0.185** -0.212*** 94.96% (0.56) (17.96) (9.34) (2.00) (-6.07)
3 -0.20% 1.093*** 0.859*** -0.377*** 0.079*** 89.56% (-0.77) (23.25) (7.32) (-4.21) (2.73)
4 -0.19%* 1.006*** -0.105* 0.024 0.063*** 96.91% (-1.82) (43.94) (-1.86) (0.69) (3.80)
5 -0.56%*** 1.070*** -0.344*** 0.082 -0.134*** 96.31% (-4.73) (27.22) (-4.72) (1.01) (-5.22)
6 -0.11% 0.983*** 0.533*** 0.064 -0.058 95.61% (-0.77) (32.51) (6.75) (1.00) (-1.58)
7 -0.70%*** 1.162*** -0.129 -0.033 -0.194*** 94.68% (-4.08) (31.83) (-0.97) (-0.49) (-4.66)
8 -0.32%*** 1.084*** -0.222*** 0.221*** -0.064** 97.00% (-2.64) (34.42) (-2.94) (5.00) (-2.17)
9 -0.23% 1.093*** 0.859*** -0.377*** 0.078*** 89.60% (-0.89) (22.98) (7.32) (-4.20) (2.76)
10 -0.21%** 1.021*** -0.038 -0.075 0.029* 97.48% (-2.17) (50.63) (-0.72) (-1.22) (1.83)
11 -0.21%*** 0.991*** -0.116*** 0.225*** -0.001 97.91% (-2.58) (50.44) (-2.84) (9.58) (-0.05)
12 -0.25%* 1.073*** 0.063 -0.106 0.057** 96.35% (-1.87) (37.65) (1.09) (-1.34) (2.47)
13 -0.08% 1.056*** 0.050 -0.272*** 0.061** 96.96% (-0.73) (44.27) (1.18) (-4.28) (2.14)
14 -0.31%*** 1.006*** -0.203*** 0.052 -0.055*** 97.33% (-3.04) (38.68) (-3.27) (1.04) (-2.85)
15 -0.35%*** 0.998*** -0.236*** 0.250*** -0.063** 96.89% (-2.94) (26.62) (-3.49) (4.05) (-2.19)
16 -0.15% 0.877*** 0.050 0.044 -0.150*** 75.68% (-0.56) (11.25) (0.33) (0.25) (-2.91)
17 -0.04% 0.761*** -0.079 0.181 -0.058 73.94% (-0.12) (8.70) (-0.45) (1.24) (-1.01)
18 -0.27% 0.925*** -0.526*** 0.234** -0.010 93.82% (-1.12) (16.57) (-3.54) (2.27) (-0.26)
19 -0.05% 1.087*** 0.110 -0.408*** 0.088*** 94.33% (-0.24) (24.31) (1.11) (-3.97) (2.68)
20 -0.31% 1.167*** -0.272** -0.234*** -0.376*** 94.39% (-1.16) (29.31) (-2.36) (-3.13) (-9.35)
21 -0.06% 0.968*** 0.515*** 0.094 -0.066** 95.43% (-0.35) (25.19) (6.12) (1.25) (-2.02)
22 -0.16% 1.032*** 0.182** -0.104 -0.124*** 93.42% (-0.87) (18.02) (1.96) (-1.21) (-4.99)
Panel B. 2007-2009 Fund α β s h m Adj. R2 Av. Fund -0.21%* 1.036*** 0.085** -0.033 -0.056*** 99.08%
(-1.87) (55.71) (2.30) (-1.22) (-6.18) 1 -0.14% 1.096*** 0.356*** -0.185 0.028 93.66% (-0.49) (15.84) (2.67) (-1.16) (0.80)
2 -0.16% 1.030*** 0.855*** 0.252*** -0.209*** 95.55% (-0.52) (19.94) (8.17) (2.87) (-5.84)
3 0.05% 1.135*** 0.892*** -0.439*** 0.077** 88.75% (0.12) (18.64) (5.39) (-4.02) (2.44)
4 -0.16% 1.022*** -0.131 0.022 0.072*** 96.55% (-0.88) (31.36) (-1.43) (0.44) (3.84)
5 -0.78%*** 1.034*** -0.421*** 0.100 -0.172*** 96.06% (-5.05) (17.82) (-3.89) (0.76) (-4.62)
6 0.18% 0.970*** 0.396*** 0.133 -0.055 94.77% (0.92) (31.34) (4.73) (1.50) (-1.10)
7 -0.99%*** 1.215*** 0.045 -0.167* -0.199*** 94.70% (-3.37) (23.18) (0.24) (-1.83) (-3.56)
8 -0.48%*** 1.037*** -0.369*** 0.303*** -0.083*** 97.90% (-2.77) (37.13) (-4.92) (7.97) (-2.78)
9 0.02% 1.135*** 0.889*** -0.439*** 0.077** 88.80% (0.06) (18.32) (5.36) (-4.01) (2.46)
10 -0.23% 0.999*** -0.083 -0.058 0.013 97.05% (-1.20) (27.90) (-1.20) (-0.65) (0.65)
11 -0.29%* 0.953*** -0.173*** 0.244*** -0.017 97.56% (-1.95) (36.99) (-3.63) (11.47) (-1.26)

22
12 -0.33% 1.078*** 0.082 -0.131 0.052 94.73% (-1.18) (23.07) (0.85) (-1.08) (1.44)
13 0.07% 1.075*** 0.057 -0.269*** 0.066* 96.80% (0.43) (29.79) (0.92) (-3.00) (1.92)
14 -0.41%*** 0.954*** -0.275*** 0.157*** -0.067*** 98.55% (-2.97) (37.45) (-3.41) (4.38) (-2.99)
15 -0.58%*** 0.926*** -0.371*** 0.367*** -0.084*** 97.95% (-4.06) (31.77) (-5.63) (6.19) (-3.01)
16 -0.47% 0.945*** 0.134 -0.234* -0.232*** 82.35% (-1.04) (10.93) (0.69) (-1.69) (-3.57)
17 -0.96% 0.885*** 0.166 -0.090 -0.116* 90.95% (-1.63) (11.24) (0.98) (-0.76) (-1.95)
18 -0.27% 0.925*** -0.526*** 0.234** -0.010 93.82% (-1.12) (16.57) (-3.54) (2.27) (-0.26)
19 0.07% 1.115*** 0.121 -0.391*** 0.109*** 95.72% (0.37) (32.22) (1.24) (-3.55) (3.66)
20 0.11% 1.205*** -0.329** -0.216*** -0.349*** 96.09% (0.41) (21.29) (-2.27) (-2.58) (-7.80)
21 0.31% 0.947*** 0.314*** 0.189* -0.066 94.79% (1.01) (21.70) (4.40) (1.84) (-1.38)
22 -0.09% 1.039*** 0.107 -0.126 -0.135*** 92.54% (-0.32) (11.11) (0.95) (-1.08) (-4.13)
Panel C. 2010-3/2013 Fund α β s h m Adj. R2 Av. Fund -0.22%** 1.008*** 0.160*** -0.020 0.001 98.57%
(-2.26) (39.21) (3.42) (-0.39) (0.04) 1 -0.10% 1.027*** 0.308*** 0.029 0.050 96.60% (-0.59) (31.32) (4.37) (0.53) (1.43)
2 0.32% 1.073*** 0.790*** 0.032 -0.202*** 93.33% (1.48) (9.87) (5.44) (0.19) (-2.89)
3 -0.48%* 1.073*** 0.810*** -0.334** 0.180*** 89.77% (-1.72) (11.84) (4.15) (-2.16) (3.33)
4 -0.15% 0.970*** -0.020 0.078 0.005 97.05% (-1.14) (36.71) (-0.42) (1.19) (0.10)
5 -0.44%*** 1.062*** -0.258*** 0.000 -0.018 97.35% (-3.89) (31.86) (-3.74) (0.00) (-0.41)
6 -0.36%** 0.982*** 0.713*** 0.020 -0.091*** 97.30% (-2.26) (18.37) (9.78) (0.20) (-2.36)
7 -0.42%*** 1.116*** -0.317*** 0.071 -0.107** 96.21% (-3.08) (25.43) (-4.00) (0.72) (-2.07)
8 -0.18% 1.073*** -0.017 0.117 -0.074 96.42% (-0.99) (22.41) (-0.18) (1.42) (-1.32)
9 -0.51%* 1.071*** 0.815*** -0.335** 0.180*** 89.80% (-1.84) (11.90) (4.21) (-2.16) (3.30)
10 -0.23%** 1.033*** -0.002 -0.111 0.069 97.77% (-2.04) (48.83) (-0.03) (-1.50) (1.02)
11 -0.19%** 1.016*** -0.063 0.232*** -0.021 98.46% (-2.05) (51.48) (-0.99) (4.33) (-0.80)
12 -0.18% 1.061*** 0.049 -0.080 0.071 97.93% (-1.58) (55.53) (0.95) (-1.31) (1.51)
13 -0.22% 1.051*** 0.031 -0.310*** 0.116 96.96% (-1.59) (37.27) (0.46) (-4.03) (1.40)
14 -0.30%* 1.041*** -0.159 -0.141 -0.006 96.29% (-1.82) (21.44) (-1.46) (-1.37) (-0.10)
15 -0.23% 1.021*** -0.082 0.079 -0.065 96.89% (-1.44) (22.91) (-0.90) (1.18) (-1.35)
16 0.03% 0.760*** -0.002 0.276 0.225 66.92% (0.07) (9.42) (-0.01) (0.97) (1.64)
17 0.34% 0.595*** -0.183 0.212 0.346*** 54.82% (0.92) (6.55) (-0.93) (0.81) (2.67)
18 - - - - - - 19 - - - - - - 20 -0.59% 1.140*** -0.172 -0.200 -0.443*** 90.28%
(-1.36) (19.72) (-0.89) (-0.99) (-4.28) 21 -0.33%* 0.972*** 0.747*** 0.013 -0.099*** 97.38%
(-1.99) (19.86) (10.83) (0.12) (-2.67) 22 -0.20% 0.993*** 0.330*** -0.020 -0.138*** 94.14%
(-0.85) (18.11) (2.83) (-0.16) (-2.70) Notes: This table reports the empirical results using Carhart’s model (1997):
( )pt f p p mt f p t p t p t ptR R R R s SMB h HML m UMDα β ε− = + − + + + + , where Rmt-Rf, SMBt and HMLt stand for the returns of
Fama and French’s factor-mimicking portfolios on the market, size and value, respectively, while UMDt is the return of Carhart’s momentum factor. Panel A reports the results for the full sample period January 2007- March 2013, while Panels B and C report the corresponding results for the subperiods January 2007- December 2009 and January 2010- March 2013. t-statistics reported in the parentheses are calculated using Newey-West heteroscedasticity and autocorrelation consistent standard errors. ***, ** and * represent statistical significance at the 1%, 5%, and 10% level, respectively.

23
Table 6. Abnormal performance and factor loadings from Carhart’s model using benchmark index 2007-3/2013
Fund α β s h m Adj. R2
1 -0.04% 0.984*** 0.032 -0.041 0.083*** 98.31%
(-0.36) (52.11) (0.46) (-0.91) (5.48)
2 0.43%*** 1.093*** -0.010 -0.304*** -0.212*** 95.39%
(2.67) (18.22) (-0.13) (-2.81) (-6.73)
3 -0.16% 0.974*** 0.212** -0.099 0.091*** 91.97%
(-0.72) (25.97) (2.05) (-1.19) (2.82)
4 0.12% 1.004*** 0.074 -0.27*** 0.073*** 96.08%
(0.98) (36.16) (1.25) (-4.69) (3.37)
5 -0.35%*** 1.068*** -0.187** 0.052 -0.137*** 96.24%
(-3.16) (26.88) (-2.51) (0.67) (-5.58)
6 0.20% 0.992*** -0.215** -0.369*** -0.063 93.59%
(1.19) (27.21) (-2.14) (-4.69) (-1.26)
7 -0.47%*** 1.158*** 0.042 -0.066 -0.198*** 94.43%
(-2.73) (29.97) (0.31) (-0.87) (-4.69)
8 0.00% 1.091*** -0.033 -0.105*** -0.051*** 97.73%
(0.02) (56.03) (-0.55) (-2.93) (-3.33)
9 -0.19% 0.974*** 0.213** -0.099 0.091*** 92.02%
(-0.85) (26.17) (2.06) (-1.19) (2.87)
10 -0.02% 1.007*** 0.047 -0.076 0.030** 97.55%
(-0.24) (55.62) (0.87) (-1.25) (2.06)
11 0.08% 0.993*** 0.058 -0.070** 0.010 98.06%
(1.21) (51.74) (1.52) (-2.15) (0.61)
12 -0.05% 1.056*** 0.076 -0.117 0.057*** 96.35%
(-0.42) (40.13) (1.27) (-1.47) (2.59)
13 -0.01% 1.017*** 0.056* 0.023 0.055*** 98.25%
(-0.02) (53.14) (1.71) (0.59) (4.00)
14 -0.11% 1.007*** -0.061 0.022 -0.058*** 97.53%
(-1.23) (42.55) (-1.11) (0.50) (-3.23)
15 -0.05% 1.009*** -0.065 -0.053 -0.050*** 98.36%
(-0.74) (44.25) (-1.27) (-1.21) (-3.55)
16 -0.01% 0.871*** 0.054 0.033 -0.147*** 76.15%
(-0.04) (11.69) (0.37) (0.19) (-2.87)
17 0.10% 0.756*** -0.079 0.173 -0.056 74.41%
(0.30) (8.95) (-0.46) (1.19) (-0.98)
18 0.16% 0.947*** -0.292** -0.077 0.010 93.99%
(0.64) (18.17) (-1.96) (-0.95) (0.36)
19 -0.10% 1.022*** 0.068 -0.079 0.077*** 96.21%
(-0.51) (25.85) (0.85) (-1.08) (2.94)
20 0.06% 1.159*** -0.058 -0.568*** -0.365*** 93.36%
(0.22) (26.56) (-0.54) (-7.50) (-7.35)
21 0.22% 0.994*** -0.236** -0.348*** -0.068 94.33%
(1.15) (31.68) (-2.50) (-5.58) (-1.52)
22 -0.05% 0.948*** -0.088 -0.040 -0.078*** 95.43%
(-0.43) (32.51) (-0.89) (-0.86) (-2.81) Notes: This table reports the empirical results using Carhart’s model (1997) relative to each individual fund benchmark index:
( )pt f p p mt f p t p t p t ptR R R R s SMB h HML m UMDα β ε− = + − + + + + , where Rmt-Rf, is the excess return of the
individual fund benchmark, SMBt and HMLt stand for the returns of Fama and French’s factor-mimicking portfolios on the size and value, respectively, while UMDt is the return of Carhart’s momentum factor for the period January 2007 to March 2013. t-statistics reported in the parentheses are calculated using Newey-West heteroscedasticity and autocorrelation consistent standard errors. ***, ** and * represent statistical significance at the 1%, 5%, and 10% level, respectively.

24
Table 7. Abnormal performance and factor loadings from Carhart’s model augmented with VIX Panel A. 2007-3/2013 Fund α β s h m v Adj. R2 Av. Fund -0.23%*** 1.045*** 0.112*** -0.031 -0.045*** 0.004 98.91%
(-3.58) (49.11) (3.37) (-1.05) (-5.10) (0.94) 1 -0.08% 1.017*** 0.316*** -0.070 0.032 -0.012 95.07% (-0.46) (15.29) (3.60) (-0.71) (1.10) (-1.31)
2 0.16% 1.003*** 0.835*** 0.218* -0.214*** -0.014 94.96% (0.83) (11.22) (9.67) (1.88) (-6.16) (-0.96)
3 -0.31% 1.189*** 0.862*** -0.435*** 0.082*** 0.026 89.76% (-1.25) (11.58) (7.05) (-3.99) (2.70) (1.28)
4 -0.14% 0.961*** -0.106* 0.052* 0.061*** -0.012 97.00% (-1.38) (24.99) (-1.92) (1.65) (3.78) (-1.52)
5 -0.56%*** 1.068*** -0.344*** 0.083 -0.134*** 0.000 96.25% (-4.32) (18.63) (-4.68) (1.08) (-5.11) (-0.04)
6 -0.11% 0.987*** 0.533*** 0.061 -0.057 0.001 95.55% (-0.71) (21.61) (6.69) (0.87) (-1.57) (0.14)
7 -0.72%*** 1.183*** -0.128 -0.046 -0.193*** 0.006 94.62% (-3.60) (18.67) (-0.95) (-0.61) (-4.65) (0.46)
8 -0.30%** 1.069*** -0.222*** 0.230*** -0.064** -0.004 96.97% (-2.50) (26.24) (-2.89) (4.27) (-2.17) (-0.50)
9 -0.34% 1.188*** 0.862*** -0.435*** 0.081*** 0.026 89.79% (-1.37) (11.50) (7.07) (-3.98) (2.72) (1.27)
10 -0.19%** 1.009*** -0.039 -0.068 0.029* -0.003 97.45% (-2.01) (29.83) (-0.72) (-1.08) (1.80) (-0.60)
11 -0.17%** 0.953*** -0.118*** 0.250*** -0.002 -0.010 97.96% (-2.25) (29.28) (-2.97) (8.68) (-0.14) (-1.49)
12 -0.25%* 1.070*** 0.062 -0.104 0.057** -0.001 96.30% (-1.80) (25.64) (1.08) (-1.24) (2.45) (-0.10)
13 -0.12% 1.091*** 0.051 -0.294*** 0.062** 0.009 96.99% (-1.03) (33.01) (1.17) (-4.20) (2.19) (1.56)
14 -0.29%*** 0.992*** -0.204*** 0.061 -0.055*** -0.004 97.30% (-2.87) (25.25) (-3.22) (1.14) (-2.83) (-0.55)
15 -0.35%*** 0.990*** -0.237*** 0.255*** -0.064** -0.002 96.85% (-2.78) (20.91) (-3.46) (3.83) (-2.18) (-0.24)
16 -0.24% 0.953*** 0.052 -0.004 -0.148*** 0.020 75.61% (-0.89) (8.60) (0.34) (-0.02) (-2.85) (0.82)
17 -0.15% 0.865*** -0.076 0.103 -0.057 0.028 74.04% (-0.41) (6.11) (-0.44) (0.53) (-0.99) (0.94)
18 -0.30% 0.959*** -0.513*** 0.205** -0.009 0.009 93.69% (-1.22) (15.21) (-3.34) (2.05) (-0.22) (0.89)
19 -0.10% 1.136*** 0.127 -0.447*** 0.090*** 0.013 94.31% (-0.42) (13.28) (1.13) (-3.36) (2.74) (0.86)
20 -0.28% 1.141*** -0.274** -0.218** -0.376*** -0.007 94.32% (-0.99) (16.53) (-2.39) (-2.17) (-9.29) (-0.47)
21 -0.10% 1.005*** 0.515*** 0.068 -0.066** 0.010 95.41% (-0.47) (17.16) (6.20) (0.79) (-1.99) (0.90)
22 -0.22% 1.086*** 0.184** -0.137 -0.122*** 0.015 93.46% (-1.10) (14.55) (2.02) (-1.53) (-4.84) (1.20)
Panel B. 2007-2009 Fund α β s h m v Adj. R2 Av. Fund -0.23%** 1.051*** 0.090** -0.047 -0.055*** 0.004 99.06%
(-2.11) (32.47) (2.17) (-1.20) (-5.87) (0.78) 1 -0.08% 1.031*** 0.335** -0.130 0.025 -0.017 93.66% (-0.28) (9.65) (2.53) (-0.78) (0.70) (-1.07)
2 -0.06% 0.933*** 0.823*** 0.333** -0.213*** -0.026 95.66% (-0.18) (7.95) (7.93) (2.26) (-5.88) (-1.04)
3 -0.10% 1.292*** 0.944*** -0.572*** 0.083** 0.043 89.46% (-0.26) (8.72) (5.46) (-3.83) (2.54) (1.60)
4 -0.13% 0.994*** -0.141 0.046 0.070*** -0.008 96.49% (-0.77) (17.01) (-1.58) (0.88) (3.66) (-0.65)
5 -0.75%*** 1.010*** -0.430*** 0.120 -0.173*** -0.007 95.96% (-4.59) (11.19) (-3.76) (0.91) (-4.52) (-0.35)
6 0.21% 0.934*** 0.384*** 0.164 -0.056 -0.010 94.65% (1.06) (17.53) (4.32) (1.52) (-1.13) (-0.79)
7 -1.02%*** 1.249*** 0.056 -0.196* -0.197*** 0.009 94.56% (-3.18) (19.54) (0.28) (-1.87) (-3.57) (0.53)
8 -0.45%** 1.004*** -0.380*** 0.331*** -0.084*** -0.009 97.88% (-2.57) (20.45) (-4.83) (5.81) (-2.73) (-0.83)
9 -0.12% 1.289*** 0.941*** -0.569*** 0.083** 0.042 89.47% (-0.33) (8.61) (5.46) (-3.80) (2.56) (1.57)
10 -0.21% 0.978*** -0.090 -0.040 0.012 -0.006 96.98% (-1.12) (17.23) (-1.26) (-0.44) (0.59) (-0.69)
11 -0.25%* 0.913*** -0.186*** 0.278*** -0.019 -0.011 97.57% (-1.82) (16.94) (-4.24) (6.61) (-1.44) (-1.03)

25
12 -0.32% 1.072*** 0.079 -0.126 0.052 -0.002 94.56% (-1.13) (15.47) (0.78) (-0.89) (1.40) (-0.18)
13 0.05% 1.101*** 0.066 -0.292*** 0.067* 0.007 96.74% (0.25) (19.73) (0.98) (-2.72) (1.92) (0.77)
14 -0.38%*** 0.910*** -0.294*** 0.197*** -0.068*** -0.012 98.60% (-2.67) (19.16) (-3.67) (4.33) (-2.95) (-1.39)
15 -0.56%*** 0.898*** -0.382*** 0.391*** -0.085*** -0.008 97.91% (-3.50) (17.44) (-5.30) (5.00) (-2.98) (-0.82)
16 -0.57% 1.051*** 0.169 -0.323 -0.228*** 0.029 82.26% (-1.17) (7.51) (0.83) (-1.53) (-3.55) (0.86)
17 -1.06%* 1.052*** 0.225 -0.262 -0.112** 0.043 91.29% (-1.77) (6.55) (1.42) (-1.19) (-2.02) (1.04)
18 -0.30% 0.959*** -0.513*** 0.205** -0.009 0.009 93.69% (-1.22) (15.21) (-3.34) (2.05) (-0.22) (0.89)
19 0.01% 1.181*** 0.143 -0.446*** 0.112*** 0.018 95.87% (0.04) (16.83) (1.28) (-3.05) (3.84) (1.18)
20 0.11% 1.205*** -0.329** -0.215 -0.349*** 0.000 95.93% (0.36) (10.36) (-2.12) (-1.53) (-7.49) (-0.01)
21 0.31% 0.957*** 0.317*** 0.180 -0.066 0.003 94.56% (0.97) (10.96) (4.46) (1.16) (-1.35) (0.14)
22 -0.10% 1.059*** 0.114 -0.143 -0.134*** 0.005 92.31% (-0.37) (8.42) (0.97) (-1.08) (-3.91) (0.30)
Panel C. 2010-3/2013 Fund α β s h m v Adj. R2 Av. Fund -0.23%*** 1.015*** 0.158*** -0.021 0.001 0.001 98.53% (-2.64) (23.76) (2.84) (-0.39) (0.02) (0.17)
1 -0.10% 1.022*** 0.310*** 0.030 0.050 -0.001 96.50% (-0.52) (16.69) (3.69) (0.53) (1.35) (-0.08)
2 0.36% 1.043*** 0.803*** 0.037 -0.199*** -0.007 93.15% (1.52) (7.82) (5.65) (0.22) (-2.91) (-0.57)
3 -0.54%* 1.117*** 0.791*** -0.337** 0.174*** 0.011 89.45% (-1.83) (7.15) (3.60) (-2.04) (3.22) (0.35)
4 -0.03% 0.872*** 0.023 0.076 0.020 -0.024** 97.42% (-0.28) (16.87) (0.34) (1.21) (0.44) (-2.42)
5 -0.41%*** 1.040*** -0.249*** 0.004 -0.016 -0.005 97.29% (-3.40) (19.54) (-3.46) (0.07) (-0.36) (-0.51)
6 -0.42%** 1.031*** 0.692*** 0.012 -0.095** 0.011* 97.30% (-2.44) (16.30) (9.51) (0.12) (-2.33) (1.84)
7 -0.47%** 1.156*** -0.333*** 0.064 -0.110** 0.009 96.16% (-2.41) (13.69) (-3.75) (0.66) (-2.31) (0.73)
8 -0.11% 1.012*** 0.009 0.128 -0.069 -0.014 96.46% (-0.60) (17.04) (0.09) (1.50) (-1.31) (-1.39)
9 -0.57%** 1.118*** 0.795*** -0.337** 0.174*** 0.011 89.49% (-1.96) (7.20) (3.65) (-2.03) (3.21) (0.37)
10 -0.20%* 1.011*** 0.007 -0.107 0.071 -0.005 97.72% (-1.68) (25.97) (0.12) (-1.44) (0.99) (-0.60)
11 -0.11% 0.955*** -0.038 0.242*** -0.016 -0.014** 98.57% (-1.19) (31.48) (-0.71) (4.90) (-0.54) (-2.25)
12 -0.19% 1.068*** 0.046 -0.081 0.070 0.002 97.87% (-1.37) (19.18) (0.84) (-1.27) (1.42) (0.16)
13 -0.29%** 1.110*** 0.006 -0.320*** 0.110 0.014 97.02% (-1.98) (29.27) (0.10) (-4.00) (1.31) (1.38)
14 -0.25%* 1.004*** -0.144 -0.135 -0.003 -0.009 96.24% (-1.75) (24.15) (-1.34) (-1.36) (-0.05) (-0.93)
15 -0.15% 0.960*** -0.056 0.089 -0.059 -0.014 96.97% (-0.96) (17.17) (-0.58) (1.34) (-1.36) (-1.46)
16 -0.03% 0.809*** -0.023 0.267 0.221 0.011 66.04% (-0.08) (4.78) (-0.10) (0.95) (1.53) (0.37)
17 0.26% 0.665*** -0.212 0.200 0.340** 0.016 53.82% (0.57) (3.75) (-0.99) (0.79) (2.54) (0.58)
18 - - - - - - - 19 - - - - - - - 20 -0.52% 1.081*** -0.148 -0.194 -0.435*** -0.014 90.07%
(-1.18) (13.13) (-0.74) (-0.92) (-4.07) (-0.71) 21 -0.40%** 1.033*** 0.721*** 0.002 -0.105*** 0.014** 97.42%
(-2.35) (18.76) (10.39) (0.02) (-2.64) (2.26) 22 -0.34% 1.122*** 0.279*** -0.031 -0.156*** 0.031** 94.61%
(-1.37) (17.26) (2.68) (-0.28) (-2.70) (2.20) Notes: This table reports the empirical results using Carhart’s model (1997) augmented with the CBOE implied volatility index (VIX):,
ptptptptpfmtppfpt VIXvUMDmHMLhSMBsRRaRR εβ +++++−+=− )( , where Rmt-Rf, SMBt and HMLt stand for the
returns of Fama and French’s factor-mimicking portfolios on the market, size and value, respectively, UMDt is the return of Carhart’s momentum factor, while VIX stands for the returns of the CBOE implied volatility index. Panel A reports the results for the full sample period January 2007- March 2013, while Panels B and C report the corresponding results for the subperiods January 2007- December 2009 and January 2010- March 2013. t-statistics reported in the parentheses are calculated using Newey-West heteroscedasticity and autocorrelation consistent standard errors. ***, ** and * represent statistical significance at the 1%, 5%, and 10% level, respectively.

26
Table 8. Empirical estimations of Treynor-Mazuy model Panel A. 2007-3/2013 Panel B. 2007-2009 Panel C. 2010-3/2013
Fund α β c Adj. R 2 α β c Adj. R 2 α β c Adj. R2 Av. Fund -0.17%* 1.065*** -0.105 98.59% -0.14% 1.083*** 0.026 98.67% -0.18% 1.053*** -0.270 98.37%
(-1.92) (54.59) (-0.61) (-1.04) (43.02) (0.12) (-1.47) (28.67) (-0.67) 1 0.10% 1.075*** -0.563** 94.01% 0.17% 1.043*** -0.674* 92.41% 0.10% 1.129*** -1.093** 95.97% (0.44) (28.01) (-2.36) (0.44) (19.21) (-1.73) (0.45) (21.03) (-2.13)
2 -0.11% 1.373*** 0.955 86.22% -0.18% 1.458*** 1.347 84.06% -0.14% 1.260*** 1.654 89.50% (-0.25) (14.87) (0.96) (-0.23) (11.53) (1.00) (-0.38) (8.84) (1.21)
3 0.09% 1.138*** -0.250 81.48% 0.77% 1.010*** -1.598*** 80.68% -0.71% 1.234*** 1.477 84.39% (0.22) (13.29) (-0.45) (1.38) (10.63) (-2.86) (-1.59) (9.99) (0.86)
4 0.01% 0.944*** -0.765*** 96.78% 0.04% 0.907*** -0.985*** 96.34% 0.01% 0.987*** -0.838* 97.41% (0.07) (39.73) (-2.57) (0.19) (29.30) (-2.75) (0.06) (39.92) (-1.88)
5 -0.75%*** 1.091*** 0.400 93.46% -1.05%*** 1.181*** 1.030** 92.41% -0.52%*** 0.985*** 0.525 96.70% (-4.13) (20.72) (1.15) (-3.16) (16.87) (2.39) (-3.22) (49.72) (1.25)
6 -0.15% 1.133*** 0.360 92.01% 0.24% 1.122*** 0.240 91.46% -0.43% 1.177*** -0.149 93.02% (-0.63) (21.95) (0.87) (0.68) (14.96) (0.36) (-1.64) (13.04) (-0.20)
7 -0.73%*** 1.218*** 0.042 92.24% -1.09%** 1.379*** 1.098*** 92.92% -0.49%** 1.037*** 0.234 94.68% (-2.68) (20.68) (0.09) (-2.40) (25.76) (2.90) (-2.19) (21.37) (0.53)
8 -0.40%** 1.117*** -0.006 95.34% -0.66%** 1.150*** 0.370 94.58% -0.15% 1.089*** -0.394 96.32% (-2.25) (28.26) (-0.03) (-2.15) (21.19) (1.23) (-0.62) (21.62) (-0.69)
9 0.06% 1.138*** -0.246 81.51% 0.75% 1.010*** -1.592*** 80.76% -0.74%* 1.233*** 1.479 84.35% (0.15) (13.26) (-0.44) (1.33) (10.58) (-2.87) (-1.65) (10.04) (0.87)
10 -0.18% 0.984*** -0.042 97.22% -0.17% 0.946*** -0.269 96.92% -0.18% 1.021*** -0.024 97.55% (-1.57) (31.58) (-0.17) (-1.01) (17.47) (-0.71) (-1.15) (61.79) (-0.07)
11 -0.27%*** 1.016*** -0.053 96.86% -0.37%** 1.012*** 0.043 96.10% -0.14% 1.030*** -0.436 97.69% (-2.66) (44.31) (-0.17) (-2.21) (23.39) (0.10) (-1.21) (53.09) (-1.33)
12 -0.15% 1.031*** -0.232 95.79% -0.18% 0.989*** -0.505 94.28% -0.13% 1.066*** -0.057 97.76% (-0.98) (25.53) (-0.78) (-0.64) (14.68) (-1.15) (-0.90) (49.63) (-0.19)
13 0.01% 0.980*** -0.039 94.58% 0.17% 0.938*** -0.354 93.94% -0.13% 1.027*** -0.023 95.29% (0.04) (22.58) (-0.15) (0.66) (13.67) (-0.97) (-0.64) (31.88) (-0.06)
14 -0.42%*** 1.006*** 0.222 96.51% -0.55%** 1.025*** 0.359* 96.67% -0.35%* 0.978*** 0.404 95.83% (-3.24) (45.00) (1.40) (-2.30) (29.51) (1.84) (-1.97) (38.27) (0.93)
15 -0.54%*** 1.041*** 0.305 94.65% -0.90%*** 1.075*** 0.730*** 93.22% -0.25% 1.009*** -0.028 96.72% (-3.39) (24.99) (1.26) (-2.82) (17.68) (3.57) (-1.41) (24.15) (-0.06)
16 0.19% 0.933*** -1.305 74.96% -0.30% 1.100*** 0.455 78.72% 0.89%* 0.854*** -4.205*** 71.47% (0.57) (11.94) (-1.48) (-0.73) (10.96) (0.76) (1.83) (16.27) (-3.15)
17 0.51% 0.773*** -1.756* 75.69% -0.86% 1.034*** 0.805 90.79% 1.17%*** 0.624*** -3.695*** 55.21% (1.15) (8.76) (-1.84) (-1.44) (15.35) (1.13) (2.84) (7.25) (-2.69)
18 -0.39% 0.917*** -0.044 90.06% -0.39% 0.917*** -0.044 90.06% - - - - (-1.05) (17.53) (-0.06) (-1.05) (17.53) (-0.06)
19 0.23% 0.883*** -0.956** 88.85% 0.34% 0.894*** -0.908** 89.58% - - - - (0.64) (12.03) (-2.40) (0.90) (11.03) (-2.07)
20 -0.44% 1.249*** 0.543 85.85% -0.03% 1.434*** 1.478 89.71% -0.84%* 1.071*** 0.476 83.21% (-1.19) (11.30) (0.45) (-0.06) (10.61) (1.07) (-1.74) (10.23) (0.40)
21 -0.15% 1.134*** 0.584 91.98% 0.42% 1.127*** 0.388 91.82% -0.43% 1.172*** -0.008 92.65% (-0.54) (20.93) (1.35) (1.00) (14.48) (0.61) (-1.55) (13.38) (-0.01)
22 -0.04% 1.097*** -0.222 92.05% 0.17% 1.113*** -0.226 91.22% -0.26% 1.084*** -0.119 93.01% (-0.17) (23.19) (-0.33) (0.42) (14.97) (-0.24) (-0.95) (15.88) (-0.18)
Notes: This table reports the empirical results using the Treynor and Mazuy model (1966):
ptfmtpfmtppfpt RRcRRaRR εβ +−+−+=− 2)()( , where Rpt is the return of the fund p, Rmt
is the return of the market portfolio.
Panel A reports the results for the full sample period January 2007- March 2013, while Panels B and C report the corresponding results for the subperiods January 2007- December 2009 and January 2010- March 2013. t-statistics reported in the parentheses are calculated using Newey-West heteroscedasticity and autocorrelation consistent standard errors. ***, ** and * represent statistical significance at the 1%, 5%, and 10% level, respectively.

27
Table 9. Empirical estimations of Treynor-Mazuy model with Fama-French-Carhart factors Panel A. 2007-3/2013
Fund α β c s h m Adj. R2 Av. Fund -0.13% 1.020*** -0.310* 0.119*** -0.028 -0.052*** 98.95%
(-1.40) (56.62) (-1.75) (3.47) (-1.17) (-4.87) 1 0.06% 1.042*** -0.686** 0.333*** -0.115 0.020 95.21% (0.28) (22.56) (-2.33) (3.54) (-1.08) (0.58)
2 0.09% 1.056*** 0.026 0.836*** 0.186** -0.211*** 94.88% (0.39) (14.06) (0.04) (10.01) (2.10) (-5.05)
3 -0.04% 1.075*** -0.566* 0.872*** -0.389*** 0.068** 89.53% (-0.13) (23.93) (-1.80) (7.32) (-4.21) (2.29)
4 -0.03% 0.988*** -0.569*** -0.093 0.013 0.052*** 97.08% (-0.21) (40.28) (-2.58) (-1.60) (0.38) (3.04)
5 -0.62%*** 1.076*** 0.216 -0.348*** 0.087 -0.130*** 96.28% (-4.01) (25.56) (0.71) (-4.74) (1.09) (-5.06)
6 -0.10% 0.982*** -0.031 0.534*** 0.063 -0.058 95.55% (-0.58) (27.55) (-0.10) (6.77) (1.03) (-1.52)
7 -0.57%** 1.147*** -0.482 -0.119 -0.044 -0.203*** 94.69% (-2.40) (26.73) (-1.25) (-0.89) (-0.63) (-5.22)
8 -0.31%* 1.083*** -0.031 -0.221*** 0.220*** -0.064** 96.96% (-1.86) (28.63) (-0.11) (-2.96) (5.07) (-2.14)
9 -0.07% 1.075*** -0.563* 0.872*** -0.389*** 0.068** 89.56% (-0.24) (23.67) (-1.80) (7.33) (-4.21) (2.29)
10 -0.22%** 1.022*** 0.041 -0.039 -0.074 0.030* 97.44% (-1.99) (40.29) (0.19) (-0.70) (-1.15) (1.80)
11 -0.23%** 0.993*** 0.057 -0.118*** 0.227*** 0.000 97.88% (-2.44) (40.17) (0.21) (-2.77) (8.99) (0.02)
12 -0.21% 1.068*** -0.137 0.065 -0.109 0.054** 96.31% (-1.45) (35.76) (-0.63) (1.12) (-1.33) (2.22)
13 -0.09% 1.058*** 0.045 0.049 -0.271*** 0.062** 96.92% (-0.80) (36.62) (0.20) (1.13) (-4.14) (2.09)
14 -0.36%** 1.012*** 0.189 -0.208*** 0.056 -0.052** 97.31% (-2.57) (35.12) (0.96) (-3.28) (1.18) (-2.45)
15 -0.44%*** 1.008*** 0.316 -0.243*** 0.257*** -0.058* 96.90% (-3.06) (26.70) (1.13) (-3.77) (4.33) (-1.87)
16 0.35% 0.819*** -1.863** 0.090 0.002 -0.185*** 77.09% (0.94) (12.07) (-2.38) (0.61) (0.01) (-3.10)
17 0.57% 0.698*** -1.903** -0.035 0.139 -0.090 76.08% (1.24) (10.12) (-2.41) (-0.21) (1.06) (-1.28)
18 -0.21% 0.908*** -0.227 -0.528*** 0.236** -0.018 93.64% (-0.69) (19.51) (-0.40) (-3.50) (2.24) (-0.44)
19 -0.03% 1.082*** -0.091 0.109 -0.407*** 0.086** 94.16% (-0.12) (16.65) (-0.23) (1.09) (-3.91) (2.13)
20 -0.17% 1.152*** -0.467 -0.261** -0.243*** -0.384*** 94.38% (-0.57) (26.79) (-1.26) (-2.23) (-3.40) (-8.67)
21 -0.13% 0.975*** 0.220 0.510*** 0.100 -0.062* 95.38% (-0.59) (25.00) (0.57) (6.17) (1.39) (-1.85)
22 0.04% 1.009*** -0.730 0.198** -0.119 -0.138*** 93.58% (0.19) (20.05) (-1.71) (2.04) (-1.35) (-4.99)
Panel B. 2007-2009 Fund α β c s h m Adj. R2 Av. Fund -0.10% 1.007*** -0.390 0.080** -0.031 -0.069*** 99.13%
(-0.71) (30.22) (-1.27) (2.39) (-1.15) (-5.09) 1 -0.01% 1.063*** -0.457 0.350*** -0.182 0.013 93.55% (-0.02) (10.87) (-0.68) (2.71) (-1.15) (0.24)
2 0.00% 0.989*** -0.555 0.848*** 0.256*** -0.227*** 95.48% (0.01) (10.29) (-0.84) (7.81) (2.73) (-4.37)
3 0.34% 1.062*** -1.007 0.879*** -0.432*** 0.044 88.80% (0.62) (11.65) (-1.48) (5.16) (-3.68) (1.06)
4 0.03% 0.974*** -0.672* -0.140 0.027 0.050* 96.73% (0.15) (20.69) (-1.82) (-1.57) (0.62) (1.80)
5 -0.75%*** 1.026*** -0.111 -0.423*** 0.101 -0.176*** 95.93% (-2.61) (11.53) (-0.16) (-3.78) (0.74) (-3.97)
6 0.30% 0.938*** -0.433 0.390*** 0.136 -0.069 94.68% (1.45) (20.14) (-1.06) (4.61) (1.47) (-1.20)
7 -0.99%*** 1.216*** 0.026 0.045 -0.167* -0.198*** 94.52% (-2.63) (22.67) (0.04) (0.23) (-1.83) (-4.02)
8 -0.33% 0.998*** -0.538** -0.375*** 0.307*** -0.100*** 97.96% (-1.46) (25.20) (-1.96) (-4.72) (8.54) (-3.36)
9 0.31% 1.063*** -1.003 0.877*** -0.432*** 0.044 88.85% (0.57) (11.51) (-1.49) (5.14) (-3.67) (1.05)
10 -0.19% 0.989*** -0.129 -0.085 -0.057 0.009 96.96% (-1.09) (15.25) (-0.27) (-1.25) (-0.65) (0.29)
11 -0.18% 0.924*** -0.392 -0.177*** 0.247*** -0.030 97.56% (-1.20) (15.13) (-0.75) (-3.76) (10.88) (-1.56)
12 -0.32% 1.075*** -0.051 0.081 -0.131 0.051 94.56% (-1.03) (14.04) (-0.10) (0.83) (-1.07) (1.03)
13 -0.06% 1.107*** 0.451 0.063 -0.272*** 0.080** 96.82% (-0.35) (18.17) (1.17) (0.99) (-3.01) (1.96)
14 -0.33%* 0.935*** -0.250 -0.277*** 0.159*** -0.075*** 98.53% (-1.95) (29.49) (-1.25) (-3.37) (4.40) (-3.10)

28
15 -0.51%*** 0.910*** -0.221 -0.373*** 0.369*** -0.091*** 97.90% (-3.27) (23.87) (-1.10) (-5.40) (6.02) (-3.11)
16 -0.19% 0.874*** -0.985 0.121 -0.227* -0.264*** 82.17% (-0.33) (6.08) (-0.84) (0.61) (-1.69) (-3.40)
17 -1.11% 0.917*** 0.365 0.175 -0.099 -0.103 90.33% (-1.44) (9.14) (0.37) (0.98) (-0.85) (-1.44)
18 -0.21% 0.908*** -0.227 -0.528*** 0.236** -0.018 93.64% (-0.69) (19.51) (-0.40) (-3.50) (2.24) (-0.44)
19 0.00% 1.133*** 0.255 0.124 -0.392*** 0.117*** 95.62% (0.00) (25.73) (1.02) (1.22) (-3.51) (3.52)
20 0.27% 1.167*** -0.527 -0.334** -0.211** -0.365*** 96.02% (0.68) (13.77) (-0.72) (-2.31) (-2.45) (-6.23)
21 0.43% 0.922*** -0.347 0.310*** 0.191* -0.077 94.61% (1.33) (14.04) (-0.62) (4.43) (1.75) (-1.40)
22 0.26% 0.951*** -1.215* 0.092 -0.117 -0.174*** 92.95% (0.77) (9.88) (-1.66) (0.81) (-1.09) (-3.60)
Panel C. 2010-3/2013 Fund α β c s h m Adj. R2 Av. Fund -0.14% 1.016*** -0.397 0.164*** -0.039 -0.004 98.58%
(-1.32) (36.90) (-1.02) (3.63) (-0.74) (-0.19) 1 0.11% 1.048*** -1.133*** 0.320*** -0.025 0.035 96.84% (0.63) (27.06) (-2.62) (4.35) (-0.46) (1.60)
2 0.04% 1.045*** 1.457 0.775*** 0.102 -0.183** 93.52% (0.16) (10.17) (1.29) (5.02) (0.75) (-2.35)
3 -0.69%** 1.055*** 0.992 0.797*** -0.287** 0.193*** 89.58% (-2.31) (9.58) (0.73) (3.92) (-2.12) (4.36)
4 0.01% 0.984*** -0.760 -0.010 0.040 -0.004 97.14% (0.05) (34.43) (-1.48) (-0.21) (0.56) (-0.08)
5 -0.55%*** 1.050*** 0.615* -0.264*** 0.029 -0.010 97.40% (-3.31) (35.00) (1.65) (-3.55) (0.71) (-0.22)
6 -0.28%* 0.990*** -0.428 0.717*** 0.000 -0.097*** 97.26% (-1.76) (17.40) (-0.82) (9.76) (0.00) (-3.06)
7 -0.47%** 1.111*** 0.294 -0.320*** 0.085 -0.103* 96.12% (-2.44) (26.32) (0.59) (-4.13) (0.79) (-1.93)
8 -0.13% 1.079*** -0.283 -0.014 0.104 -0.078 96.34% (-0.54) (22.23) (-0.46) (-0.14) (1.15) (-1.43)
9 -0.72%*** 1.053*** 0.994 0.803*** -0.288** 0.193*** 89.62% (-2.42) (9.65) (0.74) (3.99) (-2.10) (4.31)
10 -0.19% 1.037*** -0.197 0.000 -0.120* 0.066 97.71% (-1.27) (50.96) (-0.56) (0.00) (-1.65) (0.96)
11 -0.21% 1.014*** 0.125 -0.064 0.238*** -0.020 98.41% (-1.62) (52.48) (0.36) (-0.97) (3.96) (-0.72)
12 -0.15% 1.064*** -0.149 0.051 -0.087 0.069 97.88% (-1.06) (53.28) (-0.51) (0.96) (-1.44) (1.45)
13 -0.09% 1.063*** -0.673** 0.038 -0.342*** 0.107 97.01% (-0.57) (36.55) (-2.03) (0.53) (-4.37) (1.25)
14 -0.31% 1.039*** 0.076 -0.160 -0.137 -0.005 96.18% (-1.54) (21.73) (0.21) (-1.45) (-1.43) (-0.08)
15 -0.24% 1.020*** 0.065 -0.083 0.082 -0.064 96.80% (-1.21) (22.84) (0.13) (-0.90) (1.16) (-1.27)
16 0.72% 0.828*** -3.622** 0.034 0.101 0.179* 70.75% (1.30) (18.22) (-2.00) (0.21) (0.32) (1.75)
17 0.90%* 0.649*** -2.917* -0.153 0.071 0.309*** 58.05% (1.91) (9.79) (-1.73) (-0.80) (0.25) (2.91)
18 - - - - - - - 19 - - - - - - - 20 -0.39% 1.159*** -0.980 -0.161 -0.244 -0.456*** 90.18%
(-0.99) (14.81) (-0.94) (-0.81) (-1.18) (-5.14) 21 -0.27% 0.977*** -0.309 0.750*** -0.002 -0.103*** 97.33%
(-1.61) (18.54) (-0.62) (10.82) (-0.02) (-3.28) 22 -0.08% 1.004*** -0.591 0.336*** -0.046 -0.146*** 94.04%
(-0.33) (16.42) (-0.96) (2.83) (-0.35) (-3.28)
Notes: This table reports the empirical results using the Treynor and Mazuy model (1966): 2( ) ( )p tf p p mt f p mt f p t p t p t p tR R a R R c R R s SMB h HML m UMDβ ε− = + − + − + + + + , where Rmt-Rf, SMBt and HMLt stand for the returns of Fama
and French’s factor-mimicking portfolios on the market, size and value, respectively, UMDt
is the return of Carhart’s momentum factor. Panel A reports the results for the full sample period January 2007- March 2013, while Panels B and C report the corresponding results for the subperiods January 2007- December 2009 and January 2010- March 2013. t-statistics reported in the parentheses are calculated using Newey-West heteroscedasticity and autocorrelation consistent standard errors. ***, ** and * represent statistical significance at the 1%, 5%, and 10% level, respectively.

29
Table 10. Abnormal performance and factor loadings from Carhart’s model testing for timing Fund α b s s1 h2 h1 m2 m1 Adj. R2 2
Av. Fund -0.19%* 1.030*** 0.119*** -0.673 -0.023 0.061 -0.046*** 0.007 98.87% (-1.85) (57.21) (2.91) (-0.58) (-0.87) (0.12) (-2.80) (0.14)
1 -0.26% 1.086*** 0.303*** -1.023 -0.074 1.895* 0.078 0.157 95.09% (-1.28) (20.33) (3.35) (-0.47) (-0.77) (1.87) (1.48) (0.77)
2 0.17% 1.037*** 0.832*** 1.665 0.164* -1.904 -0.238*** -0.063 94.87% (0.58) (15.64) (7.46) (0.39) (1.75) (-0.98) (-3.54) (-0.33)
3 0.08% 1.094*** 0.944*** -6.879 -0.395*** 0.861 0.061 -0.025 89.57% (0.21) (21.32) (5.99) (-1.44) (-5.01) (0.60) (0.87) (-0.13)
4 -0.05% 0.996*** -0.072 -1.499 0.007 -0.555 0.035 -0.093 96.86% (-0.35) (41.54) (-1.26) (-0.96) (0.20) (-1.13) (1.17) (-0.94)
5 -0.49%*** 1.049*** -0.356*** 2.501 0.059 -2.300*** -0.162*** -0.064 96.52% (-2.96) (25.26) (-4.41) (1.42) (0.91) (-2.95) (-3.81) (-0.52)
6 -0.24% 0.990*** 0.476*** 2.343 0.065 -0.929 -0.007 0.300*** 95.84% (-1.45) (26.44) (4.56) (0.80) (1.13) (-0.96) (-0.17) (2.70)
7 -0.53%** 1.137*** -0.082 0.359 -0.047 -0.656 -0.277*** -0.439** 94.91% (-2.12) (24.64) (-0.55) (0.16) (-0.60) (-0.60) (-3.96) (-2.27)
8 -0.21% 1.074*** -0.188** -1.053 0.211*** -0.130 -0.100** -0.180 96.99% (-1.22) (31.77) (-1.99) (-0.42) (4.42) (-0.17) (-2.27) (-1.50)
9 0.04% 1.095*** 0.941*** -6.775 -0.394*** 0.894 0.064 -0.009 89.59% (0.10) (21.27) (5.99) (-1.43) (-5.00) (0.62) (0.92) (-0.04)
10 -0.22%* 1.036*** -0.022 -2.731** -0.065 1.542** 0.052* 0.085 97.66% (-1.81) (51.29) (-0.44) (-2.04) (-1.39) (2.49) (1.71) (0.85)
11 -0.20% 0.991*** -0.112** -0.280 0.225*** 0.098 -0.003 -0.010 97.82% (-1.61) (49.18) (-2.36) (-0.17) (8.53) (0.25) (-0.10) (-0.19)
12 -0.28% 1.091*** 0.080 -3.047** -0.090* 1.946** 0.085** 0.097 96.56% (-1.53) (36.33) (1.33) (-1.95) (-1.84) (2.27) (2.07) (0.75)
13 -0.24%* 1.085*** 0.027 -1.409 -0.246*** 1.988*** 0.127*** 0.279*** 97.37% (-1.86) (47.21) (0.53) (-0.96) (-4.80) (2.61) (3.80) (3.07)
14 -0.25%* 0.999*** -0.191*** -0.184 0.045 -0.374 -0.072** -0.070 97.23% (-1.67) (34.41) (-2.56) (-0.10) (0.87) (-0.58) (-2.05) (-0.63)
15 -0.17% 0.980*** -0.198** -1.251 0.227*** -1.046 -0.104** -0.142 96.90% (-1.16) (26.40) (-2.26) (-0.57) (4.20) (-1.40) (-2.44) (-1.21)
16 -0.34% 0.894*** 0.024 1.538 0.078 1.855 -0.130 -0.032 74.79% (-0.84) (11.09) (0.14) (0.27) (0.48) (0.54) (-1.55) (-0.12)
17 -0.30% 0.783*** -0.173 4.284 0.196 -0.258 0.004 0.256 73.12% (-0.64) (8.70) (-1.00) (0.84) (1.33) (-0.09) (0.05) (0.84)
18 -0.12% 0.863*** -0.512*** 5.712 0.178*** -2.808** -0.113** -0.405*** 94.96% (-0.33) (19.42) (-3.60) (0.98) (2.76) (-2.49) (-2.06) (-3.40)
19 0.01% 1.115*** 0.171 -5.131* -0.400*** 1.890** 0.108* 0.055 94.64% (0.05) (20.09) (1.46) (-1.80) (-6.32) (2.19) (1.84) (0.45)
20 -0.14% 1.159*** -0.257** -2.340 -0.267*** -1.661 -0.366*** 0.204 94.31% (-0.43) (25.72) (-2.05) (-0.65) (-3.47) (-1.62) (-5.19) (0.81)
21 -0.17% 0.969*** 0.459*** 2.719 0.091 -1.311 -0.032 0.225* 95.58% (-0.90) (22.03) (4.12) (0.85) (1.38) (-1.23) (-0.74) (1.75)
22 -0.23% 1.041*** 0.178* 0.143 -0.087 1.110 -0.117** -0.035 93.17% (-0.81) (16.18) (1.94) (0.04) (-1.05) (1.21) (-2.22) (-0.19) Notes: This table reports the empirical results using the Carhart’s model testing for timing:
ptpptppptppptpfmtppfpt UMDmUMDmHMLhHMLhSMBsSMBsRRaRR εβ +++++++−+=− 221
221
221)( w
here Rmt-Rf, SMBt and HMLt stand for the returns of Fama and French’s factor-mimicking portfolios on the market, size and value, respectively, UMDt is the return of Carhart’s momentum factor. The table reports the results for the full sample period January 2007- March 2013. t-statistics reported in the parentheses are calculated using Newey-West heteroscedasticity and autocorrelation consistent standard errors. ***, ** and * represent statistical significance at the 1%, 5%, and 10% level, respectively.

30
Table 11. Cross sectional analysis
Notes: This table reports the empirical results for the cross-sectional regressions
εβ +++++= pppppJensen feestatedMgreratioExpensedAgecSizeaa , and
εβ +++++= pppppCarhart feestatedMgreratioExpensedAgecSizeaa , , where we employ alphas (Jensen or
Carhart) for the 20 funds that cover both subperiods. Sizep is the average fund size in billion USD for the whole period using monthly data, Agep is the age of the fund since its inception (we have employed a maximum age of fifteen years), Expense ratiop is the total expense ratio of each individual fund and Mgr stated feep
is the management stated fee of each individual fund . t-statistics reported in the parentheses are calculated using Newey-West heteroscedasticity and autocorrelation consistent standard errors. ***, ** and * represent statistical significance at the 1%, 5%, and 10% level, respectively.
Panel A.
εβ +++++= pppppJensen feestatedMgreratioExpensedAgecSizeaa ,
α β c d e Adj. R2 -0.004***
(-3.41) -0.001***
(-4.75) 0.0001 (0.87)
0.055 (0.45)
0.252 (1.16)
45.67%
Panel. B.
εβ +++++= pppppCarhart feestatedMgreratioExpensedAgecSizeaa ,
α β c d e Adj. R2 -0.003***
(-2.36) -0.001***
(-5.20) 0.0001 (1.32)
0.008 (0.09)
0.032 (0.19)
40.32%

31
Table 12. Pearson and Spearman correlation
Panel A. Pearson correlation
a a Jensen Size Carhart Age Expense ratio MGR stated fee
a 1.000 Jensen 0.933 -0.654 -0.102 0.092 0.346 a 0.933 Carhart 1.000 -0.701 -0.188 -0.078 0.120 Size -0.654 -0.701 1.000 0.499 0.240 0.007 Age -0.102 -0.188 0.499 1.000 0.411 0.410 Expense ratio 0.092 -0.078 0.240 0.411 1.000 0.449 MGR stated fee 0.346 0.120 0.007 0.410 0.449 1.000
Panel B. Spearman rank-order correlation
a a Jensen Size Carhart Age Expense ratio MGR stated fee
a 1.000 Jensen 0.863 -0.277 -0.014 0.228 0.460 a 0.863 Carhart 1.000 -0.223 -0.105 0.043 0.144 Size -0.277 -0.223 1.000 0.596 0.130 -0.187 Age -0.014 -0.105 0.596 1.000 0.598 0.288 Expense ratio 0.228 0.043 0.130 0.598 1.000 0.535 MGR stated fee 0.460 0.144 -0.187 0.288 0.535 1.000
Notes: This table reports Pearson correlation coefficients (Panel A) and Spearman (rank) correlation coefficients (Panel B) for aJensen , aCarhart
, Size, Age, Expense ratio and Management stated fee for the 20 funds that cover both subperiods.