dicin papr ri - iza institute of labor economicsftp.iza.org/dp12220.pdf · the final sample...
TRANSCRIPT

DISCUSSION PAPER SERIES
IZA DP No. 12220
Michał MyckMateusz Najsztub
Policy in the Pipeline: Identifying Regional Public Investment Priorities Using a Natural Experiment
MARCH 2019

Any opinions expressed in this paper are those of the author(s) and not those of IZA. Research published in this series may include views on policy, but IZA takes no institutional policy positions. The IZA research network is committed to the IZA Guiding Principles of Research Integrity.The IZA Institute of Labor Economics is an independent economic research institute that conducts research in labor economics and offers evidence-based policy advice on labor market issues. Supported by the Deutsche Post Foundation, IZA runs the world’s largest network of economists, whose research aims to provide answers to the global labor market challenges of our time. Our key objective is to build bridges between academic research, policymakers and society.IZA Discussion Papers often represent preliminary work and are circulated to encourage discussion. Citation of such a paper should account for its provisional character. A revised version may be available directly from the author.
Schaumburg-Lippe-Straße 5–953113 Bonn, Germany
Phone: +49-228-3894-0Email: [email protected] www.iza.org
IZA – Institute of Labor Economics
DISCUSSION PAPER SERIES
ISSN: 2365-9793
IZA DP No. 12220
Policy in the Pipeline: Identifying Regional Public Investment Priorities Using a Natural Experiment
MARCH 2019
Michał MyckCentre for Economic Analysis and IZA
Mateusz NajsztubCentre for Economic Analysis

ABSTRACT
IZA DP No. 12220 MARCH 2019
Policy in the Pipeline: Identifying Regional Public Investment Priorities Using a Natural Experiment*
We identify regional public investment priorities by studying the development of the water
pipe system in the largest district in Poland. For this purpose, we take advantage of a major
administrative re-form, implemented on 1 January 1999, which substantially changed the
structure of Polish local government and reduced the number of top-tier administrative
regions from 49 to 16. We treat the reform as a natural experiment, and apply the
difference-in-differences approach to study developments along the boundary of the new
Mazovian voivodeship. We find strong and positive implications for the development of
the water pipe system in municipalities within the Mazovian voivodeship compared with
those just outside its boundaries. The overall post-reform difference in the length of the
total water pipe network is 25% and the difference in the per-capita length of the network
is 30%. Local public investment priorities at the voivodeship level, potentially related to
effective use of EU funds, are the most likely determinants of these differences.
JEL Classification: H43, H73, P35
Keywords: public investment policy, water pipe system, administrative reform
Corresponding author:Michal MyckCentre for Economic Analysis (CenEA)ul. Królowej Korony Polskiej 2570-486 SzczecinPoland
E-mail: [email protected]
* The authors gratefully acknowledge the support of the Polish National Science Centre through project no.
2016/21/B/HS4/01574. We would like to thank Ronny Freier, Krzysztof Karbownik and Dariusz Wójcik for comments
on earlier drafts of the paper, and Monika Oczkowska for assistance with the regional database. The analysis also
benefitted greatly from comments and suggestions from participants of the Ce2 Workshop (Warsaw, 2017 and 2018),
the BICEPS/SSE Seminar (Riga, 2018), the S3 Seminar (Wrocław, 2018) and seminars at the School of Geography
and the Environment, University of Oxford (2018) and the Faculty of Geography and Regional Studies, University
of Warsaw (2018). We are grateful to Judith Payne for careful copy-editing of the manuscript. The usual disclaimer
applies.

2
INTRODUCTION
Public infrastructure investments constitute one of the key elements of central and regional
governments’ economic policy. At a regional level in particular, the extent and distribution of
local public investments can play a significant role both in shaping the local economic
environment (Pereira, 2000; Aiello et al., 2012; Pereira and Pereira, 2015) and in determining
the fate of local politicians (Brender, 2003; Martinussen, 2004). Usually, though, given several
layers of local government, competing interests, parallel developments and complex decision-
making processes, it is difficult to pin down the overarching strategy with regard to public
investment that would clearly distinguish one region from others. In this paper, we take
advantage of a unique combination of a regional approach to public investment priorities and a
major administrative reform, to show direct consequences of a regional strategy on
development of the network of water pipelines. The reform, implemented in Poland on 1
January 1999, substantially changed the structure of Polish local government. We use it here to
identify the administrative driving force behind the observed developments and to link them to
strategy at the top tier of local government.
Development of the water and sewage systems has been shown to have positive implications
for health and mortality (Ferrie and Troesken, 2008; Kesztenbaum and Rosenthal, 2017) and
public investment in water and sewage pipelines brings positive returns in terms of overall
regional development (Pereira, 2000; Pereira and Pereira, 2015).1 In this respect, Poland
represents an interesting case in the analysis of the development of water systems, given the
relatively low coverage of households at the end of communist rule in the late 1980s, in
particular in rural areas, and the rapid changes that followed afterwards largely as a result of
major public investment projects (see Figure 1a). The total length of the water pipe system
increased by nearly 200% between 1990 and 2012. While the fastest growth took place in the
early 1990s, extension of the pipelines continued at a rapid pace throughout the 2000s. Most of
these developments were concentrated in rural areas (Pawełek, 2016).2 This is evident from the
municipality-level data presented in Figure 1b, in which we show the length of the water pipe
system per capita in 1995 and 2012 for municipalities grouped by population density quintiles.
While there have been increases across the five quintiles, they have been most noticeable in the
municipalities with the lowest population density levels. The length of water pipes in the 20%
least densely populated municipalities increased by about 130% over this period.

3
FIGURE 1. The water pipe network in Poland
a. Total length of water pipes in Poland, 1960–
2012
b. Water pipe length per capita
by population density quintile
Notes: Population density quintiles in Figure 1b are calculated for 1995.
Source: a: GUS (Polish central statistical office) Statistical Yearbooks; b: authors’ calculations based on GUS
local databank (BDL) data.
These changes provide an attractive background for the analysis of local government public
investment strategies. As we show below, the combination of major public investment decisions
and a unique natural experiment in the form of the administrative reform allows us to identify
important differences in public investment priorities across local governments.
A number of factors contributed to these developments and, as we show below, local
governments’ strategic priorities have played an important role in how fast the water networks
expanded in different regions. To link developments in water pipeline expansion to a specific
layer of local government, we take advantage of the Polish administrative reform that came into
force on 1 January 1999. The reform reduced the number of top-tier administrative regions
(voivodeships; NUTS 2 level) from 49 to 16 and created a large central voivodeship, the
Mazovian voivodeship, with Warsaw—the country’s capital—as its centre. In this paper, we
use the peripheral municipalities in this voivodeship and compare their water infrastructure
development with that of neighbouring municipalities that are on the other side of the Mazovian
administrative border; these latter municipalities are part of voivodeships with other,
economically weaker, regional centres. This set-up, combined with the availability of a long
time series of municipality-level data, allows us to identify the role of a specific administrative
structure in the development of the water system as an important element of public
infrastructure. We can address the question of the degree to which local government structure
influences developments in specific municipalities, including those on the periphery, and the
4
extent to which being included under the administrative power of one or another centre matters
for specific developments at the municipal level.
In Section I, we present the key features of the 1999 Polish administrative reform and
demonstrate the spatial set-up of our empirical exercise. We discuss the data used for the
analysis and the analytical approach we take in Section II. This is followed by presentation of
the results in Section III and conclusions in Section IV.
I. THE 1999 ADMINISTRATIVE REFORM AND THE MAZOVIAN VOIVODESHIP
Major administrative reforms are infrequent, which given the scope and scale of the one
implemented in Poland on 1 January 1999, makes it a unique point of reference. The reform
changed the administrative design that had existed in Poland since a reform in 1975, structured
along the lines of two tiers of local administration: the top tier, voivodeships (województwa),
and the lower tier, municipalities (gminy). After the 1999 reform was implemented, the
administrative design consisted of 49 voivodeships and 2,394 municipalities.3 The role and
responsibilities of local governments changed substantially with the political breakthrough of
1989, which led to a significant extension of municipal autonomy. Already prior to 1999,
municipalities had been given responsibility over land use, planning, environmental protection,
maintenance of public infrastructure, and ownership and maintenance of public educational and
cultural facilities, public administration buildings and community housing. They had also
gained financial independence with unlimited property rights, and were granted protection
against legal intervention from the higher levels of government. The first democratic local
elections to municipal government were held in May 1990.
The goal of the 1999 administrative reform was to further decentralise political power and
increase public finance transparency. The reform reintroduced the middle tier of local
government, the counties (powiats), responsible for the administration of institutions beyond
the scope of a single municipality (e.g. hospitals, secondary schools, public roads,
unemployment prevention and judiciary). Primarily, though, it reduced the number of
voivodeships from 49 to 16 and granted the top tier of local administration the responsibility
for overall regional development and regional infrastructure as well as for prospective
management of EU funds. Following the reform, the administrative structure in Poland
consisted of 16 voivodeships, 308 counties, 66 towns with county status and 2,478
municipalities. This structure has been in place, with minor modifications, since 1 January 1999
(for details, see Regulski (2003) and Swianiewicz (2010)).

5
For identification purposes, our analysis of the development of public infrastructure
concentrates on the municipalities along the boundary of the largest of the newly created 16
districts, the Mazovian voivodeship with the country’s capital, Warsaw, as its regional centre.
The voivodeship was formed out of 314 municipalities, 47 of which belonged before the reform
to the old Warsaw voivodeship and the rest to the voivodeships of Biała Podlaska (6),
Ciechanów (45), Łomża (5), Ostrołęka (43), Płock (30), Radom (61), Siedlce (63) and
Skierniewice (14).
Figure 2 shows a map of the Mazovian voivodeship with the boundary municipalities on either
side marked in light and darker grey. The pre-reform voivodeships are demarcated with thin
black lines while the new voivodeship boundaries are marked with bold lines. Warsaw is
marked in black. One particular feature of the Polish administrative system at the municipal
level is the distinction made for some municipalities between an urban core and a rural
periphery, which from an administrative point of view are treated as separate municipalities.
Since in reality these doughnut-like entities constitute integral economic units, for the purpose
of the analysis we merge the urban and rural parts together and analyse them jointly as single
municipalities. Overall, we identify 159 municipalities that lie along either side of the Mazovian
boundary. Of these, we exclude 9 from the analysis because of significant boundary changes.
The final sample therefore consists of 150 municipalities, including 11 entities formed by
merging the doughnut municipalities. As we can see, part of the Mazovian boundary lines up
along the borders of the old administrative system but a significant proportion of it cuts across
the old voivodeships. Of the Mazovian boundary municipalities, about 50% on the inside and
over 40% on the outside are municipalities that under the old system lined up with the old
voivodeship borders. These are marked in the lighter shade of grey and are labelled as
‘Boundary municipalities: A’ to distinguish them from those for which the Mazovian
voivodeship boundary cuts through the pre-1999 voivodeships (‘Boundary municipalities: B’,
marked in darker grey). We distinguish between these two groups to allow for testing of the
implications of potential historical factors which may be important for how the inside and
outside municipalities developed after the reform.

6
FIGURE 2. Voivodeship boundaries before and after the 1999 reform and Mazovian boundary municipalities
Notes: Warsaw—the capital of the Mazovian voivodeship—is marked in black in the centre of the figure. The
names of the pre-1999 voivodeships are placed over appropriate regions. The regional centres were Biała Podlaska
for bialskopodlaskie, Ciechanów for ciechanowskie, Łomża for łomżyńskie, Ostrołęka for ostrołęckie, Płock for
płockie, Radom for radomskie, Siedlce for siedleckie and Skierniewice for skierniewickie.
Source: Authors’ compilation using data from the Polish national boundary register (PRG).
II. ANALYTICAL APPROACH TO EXAMINING REGIONAL STRATEGIES
Identifying policy strategies at the voivodeship level
We use the 1999 administrative reform to distinguish the consequences of regional policies
with a focus on developing the water system. We look at the differences in development of the
length of water pipelines along the Mazovian administrative boundary and compare
municipalities on either side by applying the difference-in-differences (DID) approach. The
basic specification we estimate takes the following form:
(1) 𝑦𝑖𝑡 = 𝛼0 + 𝛽1𝑚𝑎𝑧𝑖 + 𝛽2𝑎𝑓𝑡𝑒𝑟𝑖𝑡 + 𝛽3𝑚𝑎𝑧𝑖 ∗ 𝑎𝑓𝑡𝑒𝑟𝑖𝑡 + 𝑀𝑖 + 𝑇𝑡 + 𝜀𝑖𝑡,
where yit is the length of the water network (per capita) for municipality i at time t, mazi is the
indicator of being within the current Mazovian voivodeship border, afterit is a dummy indicator

7
of time after the implementation of the 1999 reform and mazi*afterit is the interaction between
the two. Mi and Tt denote municipality and time fixed effects, while εit is the residual. (Since
we estimate the model with year and municipality fixed effects, the mazi and afterit controls
could be omitted, but we leave them in for clarity of the difference-in-differences presentation.)
The key coefficient of interest is β3, which is our DID estimator identifying whether being
placed within the Mazovian voivodeship as a result of the reform differentiates the development
of the water system in a municipality from that in municipalities outside the Mazovian
boundary.
To examine the potential role of older historical arrangements, we distinguish between the
effect of the new voivodeship boundary for the municipalities that used to line up with the pre-
1999 voivodeship borders and the effect for those that did not, i.e. the light grey (A) and darker
grey (B) municipalities in Figure 2 respectively. This requires a difference-in-difference-in-
differences (DIDID) estimator allowing for a different effect for the ‘B’ municipalities (Bmun)
which before the reform belonged to the same voivodeship. The estimated specification then
takes this form:
(2) 𝑦𝑖𝑡 = 𝛼0 + 𝛽1𝑚𝑎𝑧𝑖 + 𝛽2𝑎𝑓𝑡𝑒𝑟𝑖𝑡 + 𝛽3𝑚𝑎𝑧𝑖 ∗ 𝑎𝑓𝑡𝑒𝑟𝑖𝑡 + 𝛽4𝐵𝑚𝑢𝑛𝑖+𝛽5𝐵𝑚𝑢𝑛𝑖 ∗
𝑎𝑓𝑡𝑒𝑟𝑖𝑡 + 𝛽6𝐵𝑚𝑢𝑛𝑖 ∗ 𝑚𝑎𝑧𝑖 + 𝛽7𝑚𝑎𝑧𝑖 ∗ 𝑎𝑓𝑡𝑒𝑟𝑖𝑡 ∗ 𝐵𝑚𝑢𝑛𝑖 + 𝑀𝑖 + 𝑇𝑡 + 𝜀𝑖𝑡,
with β7 being the coefficient that identifies the difference in the effect for the ‘B’ municipalities.
The main dependent variable in our estimation of equations (1) and (2) is the length of the water
pipe system per capita, available from the time series of administrative data from the local
databank (Bank Danych Lokalnych, BDL) maintained by the Polish central statistical office
(GUS, 2017). The administrative data from the BDL at municipal level is available since 1995
and we use the time series up to 2012. This gives us information on four years prior to the
implementation of the reform (1995–98) and fourteen years following its implementation
(1999–2012).
Sample used for the analysis
We use data on municipality boundaries from 2017 taken from the Polish national boundary
register (Państwowy Rejestr Granic, PRG).4 As we were unable to obtain municipality
boundaries for each year covered by the analysis, we had to exclude 9 municipalities for which
there were significant boundary changes over the time covered by the analysis, as recorded in
the municipality area data. Since the analysis covers the 18 years from 1995 to 2012 and

8
includes 150 local entities (139 single municipalities and 11 formed by merging ‘doughnut’
municipalities) in the full sample, we end up with up to 2,700 observations. Basic descriptive
statistics for these municipalities are given in Table 1, while Table 2 presents average values
for pre- and post-reform total population and the length of the water network per capita at
municipal level. The statistics distinguish between the municipalities on the inside (maz = 1)
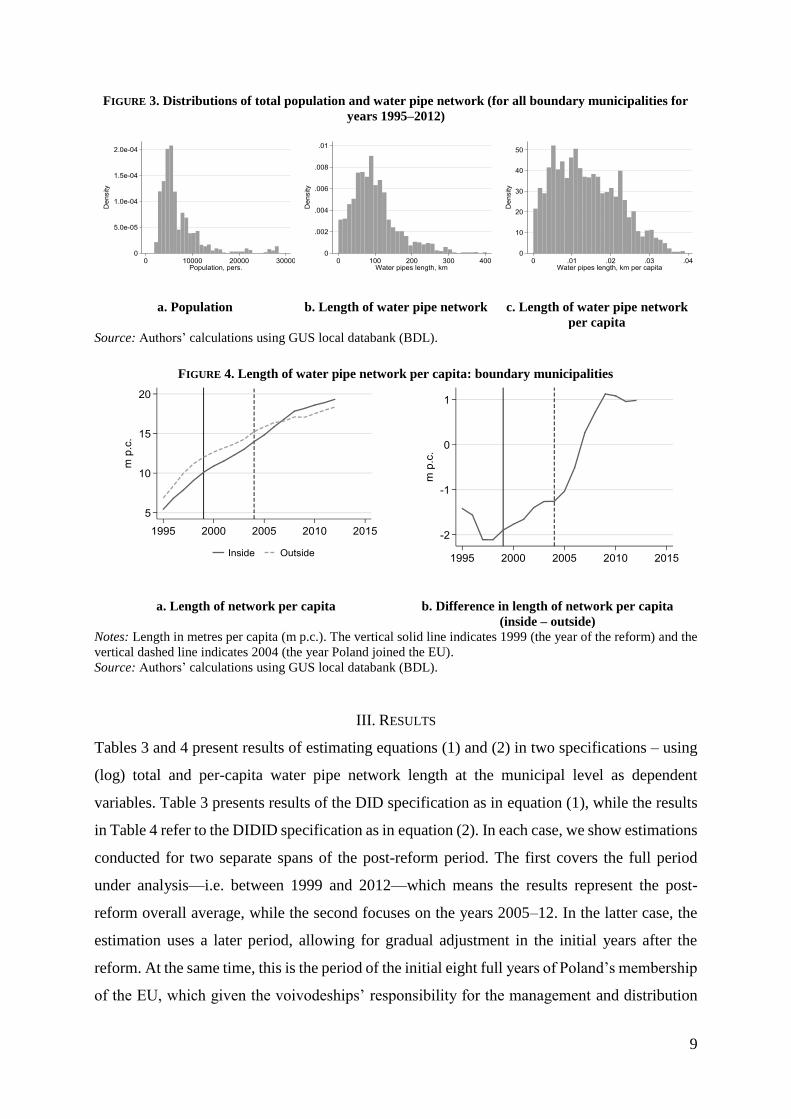
and outside (maz = 0) of the Mazovian administrative boundary. Figure 3 illustrates the
distribution of the outcome variables we use in the analysis, exhibiting a very clear log-normal
pattern. Descriptive developments of the total water pipe network per capita in the inside and
outside municipalities are presented in Figure 4, where we see a very clear pattern of much
higher growth in the per-capita length of the network inside the Mazovian boundary. While
prior to the administrative reform the length of the network per capita in the inside
municipalities was lower, by 2012 the per-capita length of water pipes in the Mazovian
municipalities was about a metre higher.
TABLE 1
SUMMARY STATISTICS FOR BOUNDARY MUNICIPALITIES, 1995–2012
Boundary
municipalities
Outside Mazovian
(maz = 0)
Inside Mazovian
(maz = 1)
Number of municipalities 150 73 77
of which ‘B’ municipalities 68 31 37
Average municipality area (km2) 147.45 157.80 137.64
Average distance to Warsaw (km) 106.80 113.85 100.11
Notes: Distance to Warsaw is computed as the distance between municipality centroids.
Source: Authors’ calculations using GUS local databank (BDL), Polish national boundary registry (PRG) and
ArcGIS.
TABLE 2
MEAN VALUES OF ANALYSED OUTCOMES FOR BOUNDARY MUNICIPALITIES BEFORE AND AFTER THE
REFORM
Pre-reform: 1995–98 Post-reform: 1999–2012
All maz = 0 maz = 1 All maz = 0 maz = 1
Population 10,566.22 12,861.46 8,390.21 10,381.78 12,680.85 8,202.15
Length of water pipes
(metres per capita)
8.17 9.10 7.30 15.35 15.55 15.15
Notes: maz = 0: outside the Mazovian voivodeship; maz = 1: inside the Mazovian voivodeship.
Source: Authors’ calculations using GUS local databank (BDL).
9
FIGURE 3. Distributions of total population and water pipe network (for all boundary municipalities for
years 1995–2012)
a. Population b. Length of water pipe network c. Length of water pipe network
per capita
Source: Authors’ calculations using GUS local databank (BDL).
FIGURE 4. Length of water pipe network per capita: boundary municipalities
a. Length of network per capita b. Difference in length of network per capita
(inside – outside)
Notes: Length in metres per capita (m p.c.). The vertical solid line indicates 1999 (the year of the reform) and the
vertical dashed line indicates 2004 (the year Poland joined the EU).
Source: Authors’ calculations using GUS local databank (BDL).
III. RESULTS
Tables 3 and 4 present results of estimating equations (1) and (2) in two specifications – using
(log) total and per-capita water pipe network length at the municipal level as dependent
variables. Table 3 presents results of the DID specification as in equation (1), while the results
in Table 4 refer to the DIDID specification as in equation (2). In each case, we show estimations
conducted for two separate spans of the post-reform period. The first covers the full period
under analysis—i.e. between 1999 and 2012—which means the results represent the post-
reform overall average, while the second focuses on the years 2005–12. In the latter case, the
estimation uses a later period, allowing for gradual adjustment in the initial years after the
reform. At the same time, this is the period of the initial eight full years of Poland’s membership
of the EU, which given the voivodeships’ responsibility for the management and distribution

10
of EU funds, may be significant from the point of view of differentiation in local policies along
the voivodeship boundary. The tables only report the estimated values of the coefficients of
interest, i.e. β3 in the case of equation (1) and β3, β5 and β7 in the case of equation (2). Given
the distributional features of the dependent variables, the estimations use log values. All
regressions include municipality and year fixed effects, we cluster the standard errors at
municipality level (see Cameron and Miller, 2015) and per-capita specifications have been
weighted by municipality population size.
TABLE 3
RESULTS: MAZOVIAN BOUNDARY AND WATER PIPE NETWORK
Post-reform time frame Length of water pipes
log p.c. log
1999–2012 maz*after (β3) 0.254*** 0.302***
(standard error) (0.0315) (0.102)
N 2,682 2,682
2005–12 maz*after (β3) 0.336*** 0.381***
(standard error) (0.0378) (0.124)
N 1,788 1,788
Notes: * p < 0.10, ** p < 0.05, *** p < 0.01. All estimations include year and municipality fixed effects. Standard
errors are clustered at municipality level. Per-capita estimations are weighted by the size of the population. The
number of observations is reduced due to zero values for a small number of municipality/year combinations.
Source: Authors’ calculations using data from GUS local databank (BDL).
The results clearly show that water infrastructure development as reflected in the length of the
water pipe system has been substantially greater inside the Mazovian boundary (Table 3). The
estimates suggest that relative to the municipalities outside the boundary, the change in the total
water pipe network is 25.4% greater in the Mazovian municipalities and the per-capita
difference is as high as 30.2%. The divergence grows over time and the numbers are as high as
33.6% and 38.1% respectively once we analyse the later period, i.e. 2005–12. Moreover, we
find no differences in terms of growth of the water pipe network between the groups of
municipalities that did and did not lie along the former voivodeship boundaries (Table 4),
suggesting that both groups of these Mazovian municipalities benefitted from belonging to the
voivodeship.

11
TABLE 4
RESULTS: MAZOVIAN BOUNDARY AND WATER PIPE NETWORK, A AND B MUNICIPALITIES
Post-reform time frame Length of water pipes
log p.c. log
1999–2012 maz*after (β3) 0.258*** 0.230*
(standard error) (0.0424) (0.125)
maz*after*Bmun (β7) –0.0146 0.195
(standard error) (0.0634) (0.196)
Bmun*after (β5) 0.0436 0.0358
(standard error) (0.0455) (0.116)
N 2,682 2,682
2005–12 maz*after (β3) 0.346*** 0.310**
(standard error) (0.0509) (0.152)
maz*after*Bmun (β7) –0.0273 0.194
(standard error) (0.0760) (0.242)
Bmun*after (β5) 0.0514 0.0525
(standard error) (0.0545) (0.141)
N 1,788 1,788
Notes and source: See Table 3. Bmun (see equation (2)) – an indicator for boundary municipalities that do not lie
along the pre-1999 voivodeship boundaries (‘Boundary municipalities: B’ in Figure 2).
Robustness analysis
Our interpretation of these results is that the administration of the Mazovian voivodeship gave
greater priority to the development of the water pipe system in its municipalities compared with
those in the surrounding regions. The stress on developing this network was highlighted in the
Mazovian development strategy documents (Strzelecki and Mazowieckie Biuro Planowania
Regionalnego, 2006; Struzik, 2018), and our results show that the Mazovian administration did
in fact make it an important priority.
The high level of investment in water pipes was not only focused on the most peripheral
municipalities along the voivodeship boundary. This is reflected in a robustness test where we
repeat the estimation of equation (1) using a placebo boundary within the Mazovian
voivodeship drawn between the Mazovian municipalities along the current official boundary
and the next layer of localities towards the centre of the voivodeship. The results are given in
Table 5. We find no statistically significant differences in the development of the water system
for municipalities within the voivodeship. A graphical representation of the estimates from

12
equation (1) with disaggregated time effects by year for the baseline and placebo estimations is
presented in Figure 5.
TABLE 5
RESULTS: PLACEBO BOUNDARY AND WATER PIPE NETWORK
Post-reform time frame Length of water pipes
log p.c. log
1999–2012 maz*after (β3) –0.0432 0.191
(standard error) (0.0383) (0.117)
N 2,668 2,668
2005–12 maz*after (β3) –0.0599 0.226
(standard error) (0.0450) (0.143)
N 1,779 1,779
Notes and source: See Table 3.
FIGURE 5. Yearly DID estimates for the voivodeship boundary and the placebo boundary estimations
a. Voivodeship boundary:
total length of water pipes, p.c. (log)
b. Placebo boundary:
total length of water pipes, p.c. (log)
Notes: Estimations include municipality fixed effects and are weighted by the size of the population. Standard
errors are clustered at municipality level. The vertical solid line indicates 1999 (the year of the reform) and the
vertical dashed line indicates 2004 (the year Poland joined the EU).
Source: Authors’ calculations using data from GUS local databank (BDL).

13
IV. CONCLUSION
Clear identification of regional public policy priorities in Poland remains a significant challenge
due to mixed responsibilities of different levels of local government and complex decision-
making processes as well as potential endogeneity of regional investment strategies. We
circumvent these challenges using a combination of regional responsibility for public
investments and a major administrative reform implemented in Poland on 1 January 1999.
Using the reform as a natural experiment, we study developments in the water pipe network at
municipal level and identify them as a clear public investment priority in the Mazovian
voivodeship, the largest top-tier administrative district in Poland established as a result of the
reform.
Our approach relies on comparing developments in the water pipe network before and after the
reform in municipalities on both sides of the Mazovian boundary using a difference-in-
differences approach. We find strong and significant differences in the length of the network in
the municipalities that were integrated into the Mazovian voivodeship, with overall network
growth about 25% greater in these municipalities than in the neighbouring municipalities just
outside the Mazovian boundary. Moreover, we find no significant differences between the
border municipalities within the central voivodeship and those further inside, which points
towards across-the-board prioritisation of water network development in the Mazovian
voivodeship.
Effective use of European Union funds available to Polish local governments already prior to
the country’s entry into the EU on 1 May 2004 could have been a factor in the rapid expansion
of the water network in the Mazovian voivodeship. For example, when we consider the
SAPARD programme, and in particular its scheme 3.1 focused on water provision and
purification, the Mazovian voivodeship implemented many more projects than its neighbouring
voivodeships.5
The clear result from our study is that, as far as developing a specific public infrastructure in
the form of a water pipe network is concerned, it was beneficial for municipalities to be included
in the largest central voivodeship. This applies primarily to the peripheral municipalities which,
as the reform took shape, could have ended up on either side of the new voivodeship boundary.
The results stress an important role for regional government policy and the implications of
varying policy priorities for socio-economic developments at the municipal level.

14
ACKNOWLEDGEMENTS
The authors gratefully acknowledge the support of the Polish National Science Centre through
project no. 2016/21/B/HS4/01574. They would like to thank Ronny Freier, Krzysztof
Karbownik and Dariusz Wójcik for comments on earlier drafts of the paper and Monika
Oczkowska for assistance with the regional database. The analysis also benefitted greatly from
comments and suggestions from participants of the Ce2 Workshop (Warsaw, 2017), the
BICEPS/SSE Seminar (Riga, 2018), the S3 Seminar (Wrocław, 2018) and seminars at the
School of Geography and the Environment, University of Oxford (2018) and the Faculty of
Geography and Regional Studies, University of Warsaw (2018). The usual disclaimer applies.
REFERENCES
AGENCJA RESTRUKTURYZACJI I MODERNIZACJI ROLNICTWA (2006). SAPARD -
wybrane efekty realizacji pomocy przedakcesyjnej w Polsce. Warszawa: Agencja
Restrukturyzacji i Modernizacji Rolnictwa.
AIELLO, F., IONA, A. and LEONIDA, L. (2012). Regional infrastructure and firm investment:
theory and empirical evidence for Italy. Empirical Economics, 42, 835-62.
https://doi.org/10.1007/s00181-010-0445-9
BENNETT, D. (2012). Does clean water make you dirty? Water supply and sanitation in the
Philippines. Journal of Human Resources, 47, 146-73.
https://doi.org/10.1353/jhr.2012.0008
BRENDER, A. (2003). The effect of fiscal performance on local government election results
in Israel: 1989–1998. Journal of Public Economics, 87, 2187-205.
https://doi.org/10.1016/S0047-2727(02)00045-2
CAIRNCROSS, S., HUNT, C., BOISSON, S., BOSTOEN, K., CURTIS, V., FUNG, I.C.H. and
SCHMIDT, W.-P. (2010). Water, sanitation and hygiene for the prevention of diarrhoea.
International Journal of Epidemiology, 39, 193-205. https://doi.org/10.1093/ije/dyq035
CAMERON, A.C. and MILLER, D.L. (2015). A practitioner’s guide to cluster-robust
inference. Journal of Human Resources, 50, 317-72.
https://doi.org/10.3368/jhr.50.2.317
DEVOTO, F., DUFLO, E., DUPAS, P., PARIENTÉ, W. and PONS, V. (2012). Happiness on
tap: piped water adoption in urban Morocco. American Economic Journal: Economic
Policy, 4 (4), 68-99. https://doi.org/10.1257/pol.4.4.68
DUFLO, E., GREENSTONE, M., GUITERAS, R. and CLASEN, T. (2015). Toilets can work:
short and medium run health impacts of addressing complementarities and externalities
in water and sanitation. NBER Working Paper 21521.
FERRIE, J.P. and TROESKEN, W. (2008). Water and Chicago’s mortality transition, 1850–
1925. Explorations in Economic History, 45, 1-16.
https://doi.org/10.1016/j.eeh.2007.06.001
GUS (2017). Bank Danych Lokalnych [WWW document]. https://bdl.stat.gov.pl/BDL/start

15
KESZTENBAUM, L. and ROSENTHAL, J.-L. (2017). Sewers’ diffusion and the decline of
mortality: the case of Paris, 1880–1914. Journal of Urban Economics, 98, 174-86.
https://doi.org/10.1016/j.jue.2016.03.001
MARTINUSSEN, P.E. (2004). Government performance and political accountability at
subnational level: the electoral fate of local incumbents in Norway. Scandinavian
Political Studies, 27, 227-59. https://doi.org/10.1111/j.1467-9477.2004.00105.x
MYCK, M. and NAJSZTUB, M. (2019). Implications of the Polish 1999 administrative reform
for regional socio-economic development. CenEA Working Paper 1/2019.
PAWEŁEK, J. (2015). Water management in Poland in view of water supply and sewage
disposal infrastructure development. Infrastruktura i Ekologia Terenów Wiejskich /
Infrastructure and Ecology of Rural Areas, II/2/2015, 367-76.
https://doi.org/10.14597/INFRAECO.2015.2.2.029
PAWEŁEK, J. (2016). Degree of development and functionality of the water supply and sewage
systems in rural Poland. Barometr Regionalny, 14, 142-9.
PEREIRA, A.M. (2000). Is all public capital created equal? Review of Economics and Statistics,
82, 513-18. https://doi.org/10.1162/rest.2000.82.3.513
PEREIRA, A.M. and PEREIRA, R. (2015). Is all infrastructure investment created equal? The
case of Portugal. College of William and Mary, Department of Economics, Working
Paper 156.
REGULSKI, J. (2003). Local Government Reform in Poland: An Insider’s Story. Budapest:
Local Government and Public Service Reform Initiative.
STRUZIK, A. (2018). Realizacja polityki rozwoju województwa mazowieckiego w latach
1998–2018. MAZOWSZE Studia Regionalne, 25, 93-114.
https://doi.org/10.21858/msr.25.06
STRZELECKI, Z. and MAZOWIECKIE BIURO PLANOWANIA REGIONALNEGO (2006).
Strategia rozwoju województwa mazowieckiego do roku 2020 (aktualizacja).
Warszawa: Mazowieckie Biuro Planowania Przestrzennego i Rozwoju Regionalnego.
SWIANIEWICZ, P. (2010). If territorial fragmentation is a problem, is amalgamation a
solution? An East European perspective. Local Government Studies, 36, 183-203.
https://doi.org/10.1080/03003930903560547
NOTES
1 A number of papers focusing on developing countries stress the importance of water supply, though water on its
own—i.e. without improvements in sanitation—may have ambiguous effects on health (Cairncross et al., 2010;
Bennett, 2012). Devoto et al. (2012) show that water provision can have significant implications for welfare, while
Duflo et al. (2015) stress the importance of combining water with sanitation for the reduction of diarrhoea.
2 Around 90% of urban areas were covered by water supply pipes by the beginning of the 1990s (Pawełek, 2015).
Similarly extensive developments happened in the areas of sewage system networks and water treatment. The
proportion of households connected to tertiary water treatment (i.e. final water treatment before discharge of
16
effluent to the receiving environment) in Poland went up from 4.1% in 1995 to 58.9% in 2015, and the proportion
of households with access to either primary, secondary or tertiary treatment grew from 41.5% to 72.6% in this
period (source: Eurostat). Unfortunately, due to lack of availability of a consistent time series of data at the
municipal level, we cannot examine the development of sewage systems using the approach we take for water
pipes.
3 This description of the details of the 1999 reform as well as the process that led to it is based on the detailed
account of Regulski (2003). For an extended summary, see Myck and Najsztub (2019).
4 Changes in TERYT codes (the codes used in the PRG) were included based on a TERYT changes dataset
compiled by Tomasz Żółtak from Warsaw University and made available for download from his personal website
(https://tomek.zozlak.org/inne/podz_teryt/podz_teryt.php), accessed on 20 September 2016.
5 SAPARD—the Special Accession Programme for Agriculture and Rural Development—was initiated in 1999
and operated until 2006. Apart from this programme, Poland benefitted from several other pre-accession funds
(Struzik, 2018), in particular PHARE (promoting socio-economic change in candidate countries) and ISPA (EU
funds for country-level infrastructure investment). The total number of contracts signed within scheme 3.1 of the
SAPARD programme in the Mazovian voivodeship was 453, compared with the following numbers in
neighbouring voivodeships: kujawsko-pomorskie 254; lubelskie 373; łódzkie 263; podlaskie 240; świętokrzyskie
305; and warmińsko-mazurskie 148 (information based on Agencja Restrukturyzacji i Modernizacji Rolnictwa
(2006)).