diatom-inferred trophic history of ijsselmeer (the netherlands)
TRANSCRIPT
PALAEOLIMNOLOGY
Diatom-inferred trophic history of IJsselmeer(The Netherlands)
Holger Cremer Æ Frans P. M. Bunnik ÆEmiliya P. Kirilova Æ Eddy H. R. R. Lammens ÆAndre F. Lotter
Published online: 15 May 2009
� Springer Science+Business Media B.V. 2009
Abstract IJsselmeer was formed in 1932 through the
closure of the Afsluitdijk that separated the artificial
lake from the former Zuiderzee estuary. The palaeo-
ecology of IJsselmeer was studied on a 63-cm-long
sediment core. Lithology and microfossil data, partic-
ularly the diatom flora, clearly show the transition
from the marine Zuiderzee into the freshwater IJssel-
meer. Trophic conditions in IJsselmeer since 1932
have been inferred by qualitative and quantitative
diatom-based approaches: by plotting the distribution
of trophic categories based on published trophic
indicator values, by a canonical correspondence
analysis (CCA) yielding relative total phosphorus (TP)
changes and by applying a transfer function in order to
calculate TP concentrations. All three approaches
indicate that IJsselmeer initially was meso- to eutro-
phic. A first hypertrophic period is indicated for the
mid-1940s, likely due to internal loading. After 1960,
the phosphorus load steadily increased and TP in
IJsselmeer reached highest concentrations (ca.
150 lg l-1) in the 1980s as confirmed by monitoring
data since 1975. The monitored data show that the TP
concentration continuously decreased after 1985 due
to successful environmental protection measures. This
trend is not (or not yet) evidenced by the diatom data
and thus, the diatom-inferred TP concentration.
Keywords Palaeolimnology � Lake sediments �Diatoms � Phosphorus � Eutrophication
Introduction
Lake IJsselmeer is a main target area for the
implementation of the European Union’s (EU’s)
Water Framework Directive (WFD) in the Nether-
lands. As an artificial, so-called heavily modified
water body (HMWB), the lake is exposed to various
man-made pressures including shoreline regulation,
high nutrient loads and overexploitation of fish
(Lammens et al., 2008). The WFD requires that all
European Union member states determine reference
conditions for their aquatic ecosystems to provide a
Guest editors: K. Buczko, J. Korponai, J. Padisak
& S. W. Starratt
Palaeolimnological Proxies as Tools of Environmental
Reconstruction in Fresh Water
H. Cremer (&) � F. P. M. Bunnik
TNO Built Environment and Geosciences, Geological
Survey of the Netherlands, Princetonlaan 6, 3584 CB
Utrecht, The Netherlands
e-mail: [email protected]
E. P. Kirilova � A. F. Lotter
Institute of Environmental Biology, Laboratory of
Palaeobotany and Palynology, Utrecht University,
Budapestlaan 4, 3584 Utrecht, The Netherlands
E. H. R. R. Lammens
Rijkswaterstaat Waterdienst, P. O. Box 17, 8200 Lelystad,
The Netherlands
123
Hydrobiologia (2009) 631:279–287
DOI 10.1007/s10750-009-9816-7
baseline against which the effects of past and present
activities should be measured. EU member states are
obliged to undertake measures to achieve the formu-
lated goals before 2015 (European Union, 2000).
Reference conditions are subsequently used to clas-
sify the ecological status of an aquatic ecosystem
which is defined by the (widely accepted) deviation
from the reference conditions and ranges from ‘good’
through ‘moderate’ and ‘poor’ to ‘bad’. Palaeolim-
nology is able to assists the implementation of the
WFD through the determination of reference condi-
tions for aquatic ecosystems (Bennion & Battarbee,
2007). Through deciphering the natural histories of
ecosystems, reference conditions are indicated by the
apparent ‘natural state’ of a water body, which
prevailed in periods when human pressures were less
drastic than today. Several studies (i.e. Taylor et al.,
2006 and references therein) have demonstrated the
value of palaeolimnology for WFD related issues.
Here, we describe the environmental history of the
past 75 years of IJsselmeer based on a multiproxy
palaeolimnological study with emphasis on the devel-
opment of the trophic state. Various microfossils were
initially used to document the transition from the
former marine Zuiderzee towards the fresh IJsselmeer
in 1932. Changes in trophic state of the past 75 years
are reconstructed using diatoms and three different
approaches. These analyses should reveal distinct
changes of the total phosphorus concentration in
IJsselmeer during the relatively short time span of its
existence. The article also attempts to clarify the
possibilities and limitations of using algae, particu-
larly diatoms, for paleoenvironmental reconstructions
in young and artificial water bodies that, in addition,
are strongly affected by human activities.
Study area
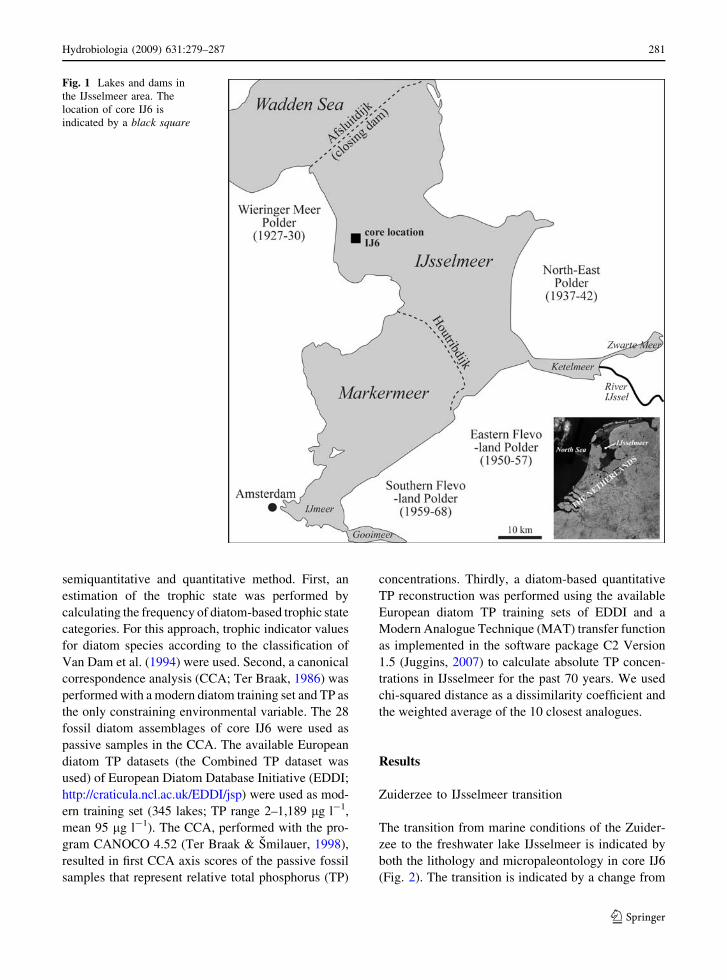
IJsselmeer was created in 1932 by the separation of
the former Zuiderzee estuary from the North Sea
through the construction of a dam, the Afsluitdijk
(Fig. 1). After its formation, IJsselmeer changed
within a few years into a freshwater lake. In the
years subsequent to completion, the size of the lake
was reduced by land reclamation projects through
which a number of border lakes were created. The
construction of another dam, the Houtribdijk, in 1975
divided IJsselmeer into two lakes: IJsselmeer (ca.
1125 km2) to the north and Markermeer (ca.
650 km2) to the south of the newly formed dam
(Fig. 1). The IJssel River, a tributary of the Rhine
River, is the main freshwater source of IJsselmeer.
Today, the IJsselmeer region is a strongly regulated,
multifunctional area with various recreational, indus-
trial, natural, nautical and agricultural interests.
IJsselmeer is a large, buffered and still eutrophic to
hypertrophic lake with moderate chlorinity. The
average and maximum water depths of IJsselmeer
are 4.5 and 7 m, respectively. Regular measurements
of the phosphorus concentration started in the mid-
1970s when the lake was already hypertrophic (total
phosphorus (TP) concentration of 200–300 lg l-1;
Lammens et al., 2008). Since 1985, the phosphorus
load constantly decreased to present-day concentra-
tion of ca. 100 lg l-1 (De Leeuw et al., 2006).
Improvements over the past two decades are also
indicated by changes in total nitrogen and chlorophyll
a (De Leeuw et al., 2006).
Materials and methods
Sediment core IJ6 (Length: 63 cm) was recovered with
a UWITEC gravity corer in spring 2006 in the western
part of IJsselmeer (Fig. 1) at 420 cm water depth. A
total of 45 samples from this core were analyzed for
diatoms and palynological indicators (dinoflagellates,
foraminifera, green algae and pollen).
Sediment samples for diatom analysis were freeze-
dried and 0.5–2 g of this material was treated
consecutively with HCl (30%) and H2O2 (35%) in
order to remove the carbonates and organic matter.
Sedimentation trays (Battarbee, 1973) and the highly
refractive mountant Naphrax (RI = 1.74) were used
to produce permanent slides. Diatom slides were
analyzed at 9459 magnification with a Leica
DM2500 microscope equipped with differential
interference contrast.
Palynological slides were prepared by treating the
samples consecutively with sodium pyrophosphate
(15 g/l), HCl (30%) and acetolysis in order to disperse
the samples and to dissolve carbonates and organic
matter. In a final step, the samples were centrifuged
with heavy liquid to eliminate sand and silt particles
and to concentrate pollen and other microfossils.
Palynological slides were mounted using glycerin.
Diatom-based reconstructions of the trophic history
of IJsselmeer were carried out with a qualitative,
280 Hydrobiologia (2009) 631:279–287
123
semiquantitative and quantitative method. First, an
estimation of the trophic state was performed by
calculating the frequency of diatom-based trophic state
categories. For this approach, trophic indicator values
for diatom species according to the classification of
Van Dam et al. (1994) were used. Second, a canonical
correspondence analysis (CCA; Ter Braak, 1986) was
performed with a modern diatom training set and TP as
the only constraining environmental variable. The 28
fossil diatom assemblages of core IJ6 were used as
passive samples in the CCA. The available European
diatom TP datasets (the Combined TP dataset was
used) of European Diatom Database Initiative (EDDI;
http://craticula.ncl.ac.uk/EDDI/jsp) were used as mod-
ern training set (345 lakes; TP range 2–1,189 lg l-1,
mean 95 lg l-1). The CCA, performed with the pro-
gram CANOCO 4.52 (Ter Braak & Smilauer, 1998),
resulted in first CCA axis scores of the passive fossil
samples that represent relative total phosphorus (TP)
concentrations. Thirdly, a diatom-based quantitative
TP reconstruction was performed using the available
European diatom TP training sets of EDDI and a
Modern Analogue Technique (MAT) transfer function
as implemented in the software package C2 Version
1.5 (Juggins, 2007) to calculate absolute TP concen-
trations in IJsselmeer for the past 70 years. We used
chi-squared distance as a dissimilarity coefficient and
the weighted average of the 10 closest analogues.
Results
Zuiderzee to IJsselmeer transition
The transition from marine conditions of the Zuider-
zee to the freshwater lake IJsselmeer is indicated by
both the lithology and micropaleontology in core IJ6
(Fig. 2). The transition is indicated by a change from
Fig. 1 Lakes and dams in
the IJsselmeer area. The
location of core IJ6 is
indicated by a black square
Hydrobiologia (2009) 631:279–287 281
123
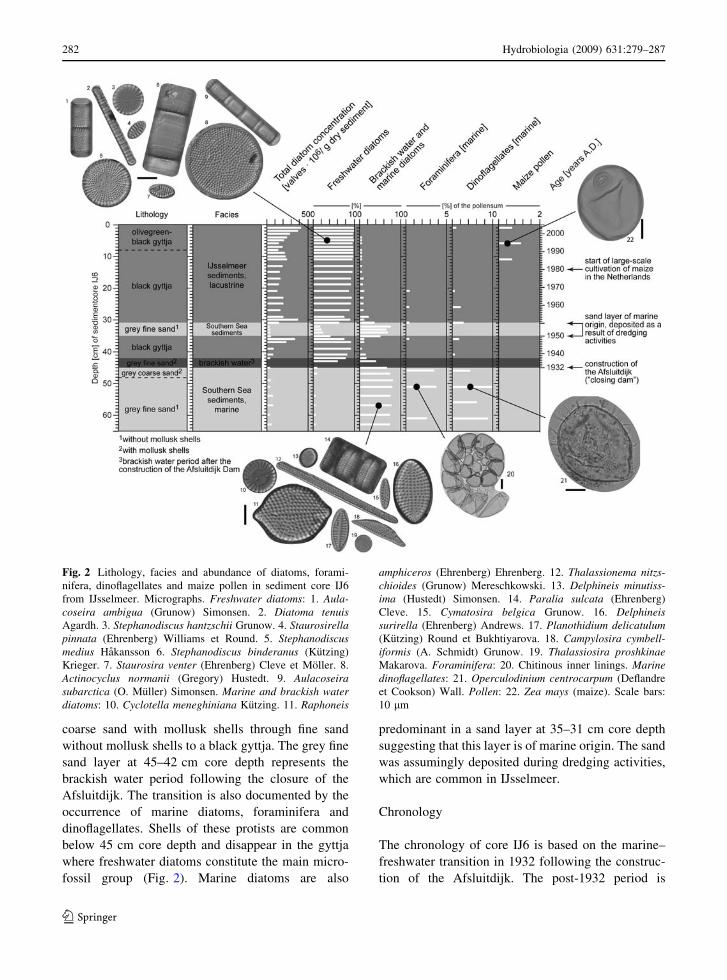
coarse sand with mollusk shells through fine sand
without mollusk shells to a black gyttja. The grey fine
sand layer at 45–42 cm core depth represents the
brackish water period following the closure of the
Afsluitdijk. The transition is also documented by the
occurrence of marine diatoms, foraminifera and
dinoflagellates. Shells of these protists are common
below 45 cm core depth and disappear in the gyttja
where freshwater diatoms constitute the main micro-
fossil group (Fig. 2). Marine diatoms are also
predominant in a sand layer at 35–31 cm core depth
suggesting that this layer is of marine origin. The sand
was assumingly deposited during dredging activities,
which are common in IJsselmeer.
Chronology
The chronology of core IJ6 is based on the marine–
freshwater transition in 1932 following the construc-
tion of the Afsluitdijk. The post-1932 period is
Fig. 2 Lithology, facies and abundance of diatoms, forami-
nifera, dinoflagellates and maize pollen in sediment core IJ6
from IJsselmeer. Micrographs. Freshwater diatoms: 1. Aula-coseira ambigua (Grunow) Simonsen. 2. Diatoma tenuisAgardh. 3. Stephanodiscus hantzschii Grunow. 4. Staurosirellapinnata (Ehrenberg) Williams et Round. 5. Stephanodiscusmedius Hakansson 6. Stephanodiscus binderanus (Kutzing)
Krieger. 7. Staurosira venter (Ehrenberg) Cleve et Moller. 8.
Actinocyclus normanii (Gregory) Hustedt. 9. Aulacoseirasubarctica (O. Muller) Simonsen. Marine and brackish waterdiatoms: 10. Cyclotella meneghiniana Kutzing. 11. Raphoneis
amphiceros (Ehrenberg) Ehrenberg. 12. Thalassionema nitzs-chioides (Grunow) Mereschkowski. 13. Delphineis minutiss-ima (Hustedt) Simonsen. 14. Paralia sulcata (Ehrenberg)
Cleve. 15. Cymatosira belgica Grunow. 16. Delphineissurirella (Ehrenberg) Andrews. 17. Planothidium delicatulum(Kutzing) Round et Bukhtiyarova. 18. Campylosira cymbell-iformis (A. Schmidt) Grunow. 19. Thalassiosira proshkinaeMakarova. Foraminifera: 20. Chitinous inner linings. Marinedinoflagellates: 21. Operculodinium centrocarpum (Deflandre
et Cookson) Wall. Pollen: 22. Zea mays (maize). Scale bars:
10 lm
282 Hydrobiologia (2009) 631:279–287
123
represented in this core by the upper 45 cm of
sediment, which indicates a mean sedimentation rate
of 5.6 mm/year. This estimate is supported by the
occurrence of Zea mais (maize) pollen in the
sediment. In the Netherlands, large scale maize
cultivation started in the 1980s. The first maize
pollen in core IJ6 was found in 11 cm core depth.
Applying a mean sedimentation rate of 5.6 mm/year
this would correspond to the year 1986. Accordingly,
the marine sand layer at 35–31 cm core depth was
deposited in 1950.
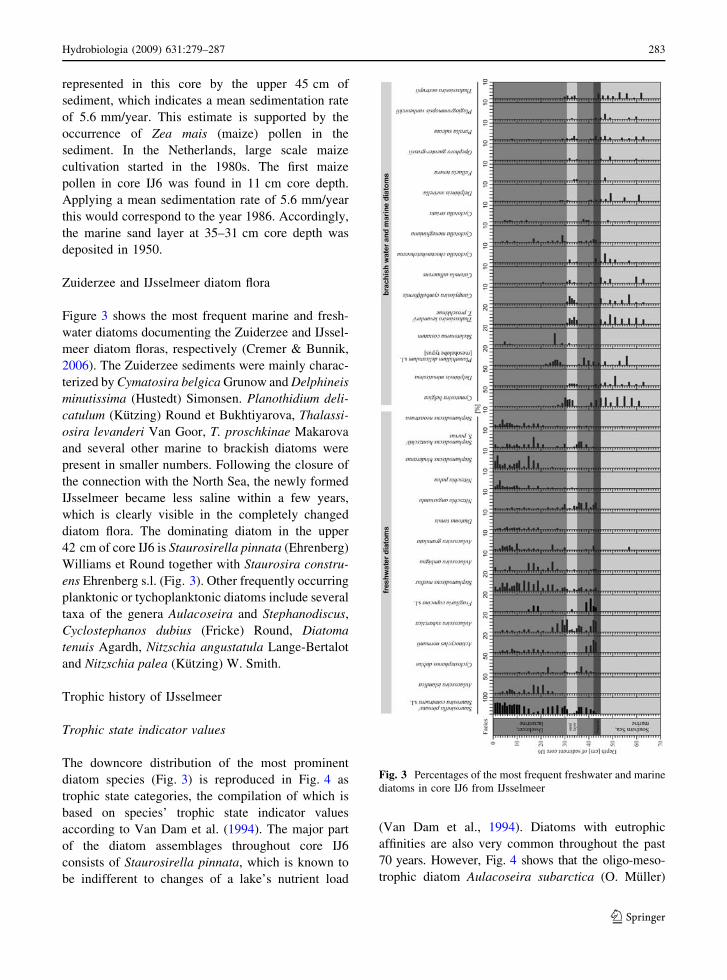
Zuiderzee and IJsselmeer diatom flora
Figure 3 shows the most frequent marine and fresh-
water diatoms documenting the Zuiderzee and IJssel-
meer diatom floras, respectively (Cremer & Bunnik,
2006). The Zuiderzee sediments were mainly charac-
terized by Cymatosira belgica Grunow and Delphineis
minutissima (Hustedt) Simonsen. Planothidium deli-
catulum (Kutzing) Round et Bukhtiyarova, Thalassi-
osira levanderi Van Goor, T. proschkinae Makarova
and several other marine to brackish diatoms were
present in smaller numbers. Following the closure of
the connection with the North Sea, the newly formed
IJsselmeer became less saline within a few years,
which is clearly visible in the completely changed
diatom flora. The dominating diatom in the upper
42 cm of core IJ6 is Staurosirella pinnata (Ehrenberg)
Williams et Round together with Staurosira constru-
ens Ehrenberg s.l. (Fig. 3). Other frequently occurring
planktonic or tychoplanktonic diatoms include several
taxa of the genera Aulacoseira and Stephanodiscus,
Cyclostephanos dubius (Fricke) Round, Diatoma
tenuis Agardh, Nitzschia angustatula Lange-Bertalot
and Nitzschia palea (Kutzing) W. Smith.
Trophic history of IJsselmeer
Trophic state indicator values
The downcore distribution of the most prominent
diatom species (Fig. 3) is reproduced in Fig. 4 as
trophic state categories, the compilation of which is
based on species’ trophic state indicator values
according to Van Dam et al. (1994). The major part
of the diatom assemblages throughout core IJ6
consists of Staurosirella pinnata, which is known to
be indifferent to changes of a lake’s nutrient load
(Van Dam et al., 1994). Diatoms with eutrophic
affinities are also very common throughout the past
70 years. However, Fig. 4 shows that the oligo-meso-
trophic diatom Aulacoseira subarctica (O. Muller)
Fig. 3 Percentages of the most frequent freshwater and marine
diatoms in core IJ6 from IJsselmeer
Hydrobiologia (2009) 631:279–287 283
123
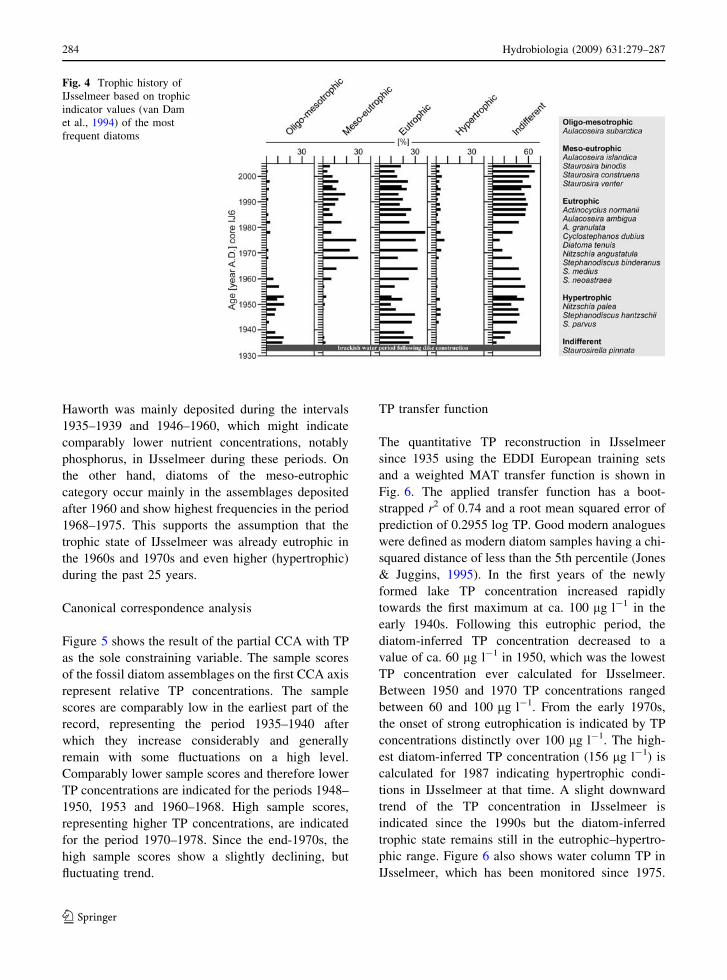
Haworth was mainly deposited during the intervals
1935–1939 and 1946–1960, which might indicate
comparably lower nutrient concentrations, notably
phosphorus, in IJsselmeer during these periods. On
the other hand, diatoms of the meso-eutrophic
category occur mainly in the assemblages deposited
after 1960 and show highest frequencies in the period
1968–1975. This supports the assumption that the
trophic state of IJsselmeer was already eutrophic in
the 1960s and 1970s and even higher (hypertrophic)
during the past 25 years.
Canonical correspondence analysis
Figure 5 shows the result of the partial CCA with TP
as the sole constraining variable. The sample scores
of the fossil diatom assemblages on the first CCA axis
represent relative TP concentrations. The sample
scores are comparably low in the earliest part of the
record, representing the period 1935–1940 after
which they increase considerably and generally
remain with some fluctuations on a high level.
Comparably lower sample scores and therefore lower
TP concentrations are indicated for the periods 1948–
1950, 1953 and 1960–1968. High sample scores,
representing higher TP concentrations, are indicated
for the period 1970–1978. Since the end-1970s, the
high sample scores show a slightly declining, but
fluctuating trend.
TP transfer function
The quantitative TP reconstruction in IJsselmeer
since 1935 using the EDDI European training sets
and a weighted MAT transfer function is shown in
Fig. 6. The applied transfer function has a boot-
strapped r2 of 0.74 and a root mean squared error of
prediction of 0.2955 log TP. Good modern analogues
were defined as modern diatom samples having a chi-
squared distance of less than the 5th percentile (Jones
& Juggins, 1995). In the first years of the newly
formed lake TP concentration increased rapidly
towards the first maximum at ca. 100 lg l-1 in the
early 1940s. Following this eutrophic period, the
diatom-inferred TP concentration decreased to a
value of ca. 60 lg l-1 in 1950, which was the lowest
TP concentration ever calculated for IJsselmeer.
Between 1950 and 1970 TP concentrations ranged
between 60 and 100 lg l-1. From the early 1970s,
the onset of strong eutrophication is indicated by TP
concentrations distinctly over 100 lg l-1. The high-
est diatom-inferred TP concentration (156 lg l-1) is
calculated for 1987 indicating hypertrophic condi-
tions in IJsselmeer at that time. A slight downward
trend of the TP concentration in IJsselmeer is
indicated since the 1990s but the diatom-inferred
trophic state remains still in the eutrophic–hypertro-
phic range. Figure 6 also shows water column TP in
IJsselmeer, which has been monitored since 1975.
Fig. 4 Trophic history of
IJsselmeer based on trophic
indicator values (van Dam
et al., 1994) of the most
frequent diatoms
284 Hydrobiologia (2009) 631:279–287
123
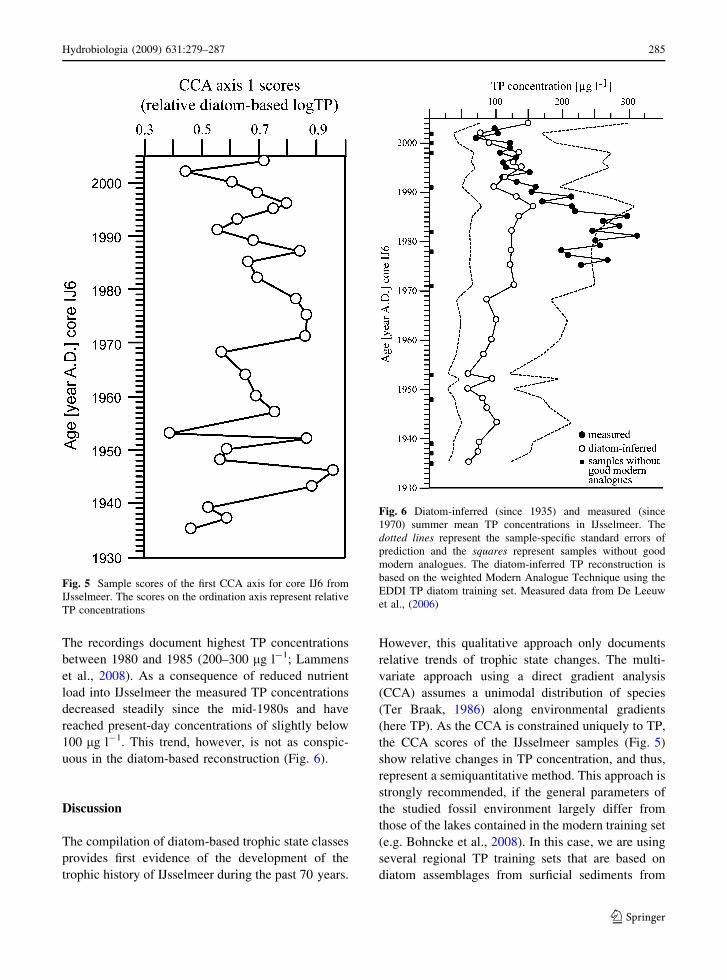
The recordings document highest TP concentrations
between 1980 and 1985 (200–300 lg l-1; Lammens
et al., 2008). As a consequence of reduced nutrient
load into IJsselmeer the measured TP concentrations
decreased steadily since the mid-1980s and have
reached present-day concentrations of slightly below
100 lg l-1. This trend, however, is not as conspic-
uous in the diatom-based reconstruction (Fig. 6).
Discussion
The compilation of diatom-based trophic state classes
provides first evidence of the development of the
trophic history of IJsselmeer during the past 70 years.
However, this qualitative approach only documents
relative trends of trophic state changes. The multi-
variate approach using a direct gradient analysis
(CCA) assumes a unimodal distribution of species
(Ter Braak, 1986) along environmental gradients
(here TP). As the CCA is constrained uniquely to TP,
the CCA scores of the IJsselmeer samples (Fig. 5)
show relative changes in TP concentration, and thus,
represent a semiquantitative method. This approach is
strongly recommended, if the general parameters of
the studied fossil environment largely differ from
those of the lakes contained in the modern training set
(e.g. Bohncke et al., 2008). In this case, we are using
several regional TP training sets that are based on
diatom assemblages from surficial sediments from
Fig. 5 Sample scores of the first CCA axis for core IJ6 from
IJsselmeer. The scores on the ordination axis represent relative
TP concentrations
Fig. 6 Diatom-inferred (since 1935) and measured (since
1970) summer mean TP concentrations in IJsselmeer. The
dotted lines represent the sample-specific standard errors of
prediction and the squares represent samples without good
modern analogues. The diatom-inferred TP reconstruction is
based on the weighted Modern Analogue Technique using the
EDDI TP diatom training set. Measured data from De Leeuw
et al., (2006)
Hydrobiologia (2009) 631:279–287 285
123
small lakes to infer past TP values in the artificially
formed, large lake IJsselmeer. It is assumed here that
the reconstructed TP curve reflects a realistic history
of the trophic state of IJsselmeer for the past few
decades. The curve (Fig. 6) basically shows the same
trends as the CCA-based reconstruction (Fig. 5) of
relative TP changes.
As 93.3% of the fossil diatom flora of IJsselmeer is
represented in the EDDI training set, we feel
confident that a transfer function approach such as
MAT can be applied. However, in situ measurements
made during the period of highest TP concentration
show that diatom-inferred TP concentrations may
underestimate actual TP values. Between 1975 and
1990, the average diatom-inferred TP concentration
is distinctly lower than the measured average summer
values of the same period (Fig. 6). The phenomenon
of over- or underestimation of diatom-inferred com-
pared to measured TP concentrations has been
reported and discussed many times in the literature
(e.g. Bennion et al., 1995; Lotter, 1998; Bradshaw &
Anderson, 2001; Sayer, 2001). The reasons that might
lead to such differences include training set- and
model-inherent problems, e.g. the presence and
number of low, medium and high TP sites in the
training set or the fact that TP measurements
document the situation during a single season (often
summer), whereas the sedimentary diatom sample
represents a larger period (one or several years).
Another important factor might be the dominance of
small, often benthic fragilarioid diatoms (Staurosi-
rella pinnata, Staurosira construens; Figs. 3 and 4) in
the sediment assemblages. These taxa have been
described to react more sensitive to habitat availabil-
ity than to TP concentration and therefore may have a
distorting influence on TP reconstructions (Sayer,
2001). Furthermore, the variability of factors other
than TP, including climate, light conditions, zoo-
plankton grazing and competition between algal
groups and genera, may also have a significant
impact on the composition of fossil diatom assem-
blages and thus, indirectly have an influence on
reconstructed TP concentrations. Spatial and tempo-
ral variabilities in the deposition of inorganic sedi-
ment and biogenic components, including microfossil
remains, particularly in large lakes, may have an
indirect influence on past TP estimates (Blom &
Winkels, 1998). Taking all these factors, as well as
the sample-specific standard errors of prediction into
account, the reconstructed TP concentrations for
IJsselmeer are within the measured TP ranges and
therefore, can be regarded as reliable.
The diatom-inferred reconstruction of absolute TP
concentrations shows two noticeable trends: first, the
eutrophic maximum in the early 1940s, and second,
the weakly declining TP concentrations since 1985
compared to the clearly reduced measured values
(Fig. 6).
The true reasons for the first eutrophic period in
IJsselmeer remain unexplained at the moment. It can
be speculated that the construction of the Afsluitdijk
caused hydrological, hydromorphological, geochem-
ical and sedimentological conditions in the initial
IJsselmeer that led to a massive release of phosphorus
from the ancient sea bottom. Possible, even probable,
triggers include changes in the redox potential and
pH and/or increasing algal blooms (e.g. cyanobacte-
ria) in the meanwhile freshened lake. These processes
have been intensely studied and discussed in recent
literature (e.g. Christophoridis & Fytianos, 2006; Xie
et al., 2003 and references therein). Decrease of the
TP concentration after 1945 might then be interpreted
as a consequence of using up- and rebinding of
phosphorus and reaching a more or less stable
phosphorus budget in IJsselmeer.
There are also some possible reasons for the
consistently relatively high reconstructed TP concen-
trations in the 1990s (TP 100–150 lg l-1) compared
to the previous interval. In contrast, the monitored
measurements show a clear downward trend after
1985 (Fig. 6). The recovery of IJsselmeer from
extreme phosphorus loads is seemingly not (or not
yet) evident from the diatom data. A probable reason
for this observation is that at hypertrophic conditions
(TP C100 lg l-1) phosphorus is not the limiting
factor for diatom growth and particularly the com-
position of the diatom flora. Such overestimation of
diatom-inferred TP concentrations has been also
reported in other studies (e.g. Bradshaw & Anderson,
2001) and indicates that the decreased input of a
single nutrient (e.g. phosphorus) does not necessarily
lead directly to observable changes of the algal
community, which might be a reflection of hysteresis
effects. Moreover, model-inherent factors, such as the
length of the phosphorus gradient covered by the
calibration dataset, have also an effect on the
reconstructed TP. The application of datasets that
are not designed for the region in which it is used in
286 Hydrobiologia (2009) 631:279–287
123
many cases yields reconstructions that tend to either
over- or underestimate the monitored phosphorus
data (Bradshaw & Anderson, 2001). This does not
necessarily mean, however, that such reconstructions
cannot reveal valuable information on the trophic
history of lakes.
The present study demonstrates the value of palae-
olimnological approaches for assessing trophic histo-
ries of artificial lakes. As evidenced by diatom
analysis, IJsselmeer was already meso-trophic within
a few years of its formation in the early 1930s and
underwent the initial eutrophic period in the early
1940s. Since the late 1950s, conditions in IJsselmeer
were strongly eutrophic and increased to hypertrophy
in the early 1970s. The continuous improvement in the
trophic state since 1985 is not yet reflected in the
diatom assemblages and the diatom-inferred TP val-
ues. This suggests that diatom-inferred nutrient recon-
structions should preferably be validated by long-term
monitoring data to reduce misinterpretations.
References
Battarbee, R. W., 1973. A new method for estimation of
absolute microfossil numbers, with reference especially to
diatoms. Limnology and Oceanography 18: 647–653.
Bennion, H. & R. W. Battarbee, 2007. The European Union
Water Framework Directive: opportunities for palaeo-
limnology. Journal of Paleolimnology 38: 285–295.
Bennion, H., S. Wunsam & R. Schmidt, 1995. The validation
of diatom-phosphorus transfer functions: an example from
Mondsee, Austria. Freshwater Biology 34: 271–283.
Blom, G. & H. J. Winkels, 1998. Modelling sediment accu-
mulation and dispersion of contaminants in Lake IJssel-
meer (The Netherlands). Water Science and Technology
37: 17–24.
Bohncke, S. J. P., J. A. A. Bos, S. Engels, O. Heiri & C. Kasse,
2008. Rapid climate events as recorded in Middle
Weichselian thermokarst lake sediments. Quaternary
Science Reviews 27: 162–174.
Bradshaw, E. G. & N. J. Anderson, 2001. Validation of a
diatom–phosphorus calibration set for Sweden. Freshwa-
ter Biology 46: 1035–1048.
Christophoridis, C. & K. Fytianos, 2006. Conditions affecting
the release of phosphorus from surface lake sediments.
Journal of Environmental Quality 35: 1181–1192.
Cremer, H. & F. P. M. Bunnik, 2006. Paleowaterkwaliteit van
het IJsselmeer sinds de aanleg van de Afsluitdijk in 1932.
[Paleo-water quality of Dutch lakes: reconstruction of the
development of the phosphorus content of IJsselmeer base
don fossil diatom assemblages.] TNO report 2006-U-
R0133-B, Utrecht, 45 pp (in Dutch).
De Leeuw, J. J., C. Deerenberg, W. Dekker, R. van Hal & H.
Jansen, 2006. Veranderingen in de visstand van het
IJsselmeergebied: trends en oorzaken. Nederlands Insti-
tuut voor Visserijonderzoek [Paleo-water quality of Dutch
lakes: reconstruction of the development of the phos-
phorus content of IJsselmeer base don fossil diatom
assemblages.] TNO report C022-06, IJmuiden, 33 pp (in
Dutch).
European Union, 2000. Directive 2000/60/EC of the European
Parliament and of the Council of 23 October 2000
establishing a framework for Community action in the
field of water policy. Official Journal of the European
Communities L327: 1–73.
Jones, V. J. & S. Juggins, 1995. The construction of a diatom-
based nutrient transfer function and its application at three
lakes on Signy Island (maritime Antarctic) subject to
differing degrees of nutrient enrichment. Freshwater
Biology 34: 433–445.
Juggins, S., 2007. C2 Version 1.5 User guide. Software for
ecological and palaeoecological data analysis and visual-
isation. Newcastle University, Newcastle upon Tyne, UK:
73.
Lammens, E., F. van Luijn, Y. Wessels, H. Bouwhuis, R.
Noordhuis, R. Portielje & D. van der Molen, 2008.
Towards ecological goals for the heavily modified lakes in
the IJsselmeer area, The Netherlands. Hydrobiologia 599:
239–247.
Lotter, A. F., 1998. The recent eutrophication of Baldeggersee
(Switzerland) as assessed by fossil diatom assemblages.
The Holocene 8: 395–405.
Sayer, C. D., 2001. Problems with the application of diatom-
total phosphorus transfer functions: examples from a
shallow English lake. Freshwater Biology 46: 743–757.
Taylor, D., C. Dalton, M. Leira, P. Jordan, G. Cheng, L. Leon-
Vintro, K. Irvine, H. Bennion & T. Nolan, 2006. Recent
histories of six productive lakes in the Irish Ecoregion
based on multiproxi palaeolimnological evidence.
Hydrobiologia 571: 237–259.
Ter Braak, C. J. F., 1986. Canonical correspondence analysis: a
new eigenvector technique for multivariate direct gradient
analysis. Ecology 67: 1167–1179.
Ter Braak, C. J. F. & P. Smilauer, 1998. CANOCO reference
manual and user’s guide to CANOCO for Windows:
software for canonical community ordination (version 4).
Microcomputer Power Ithaca, New York: 351.
Van Dam, H., A. Mertens & J. Sinkeldam, 1994. A coded
checklist and ecological indicator values of freshwater
diatoms from The Netherlands. Netherlands Journal of
Aquatic Ecology 28: 117–133.
Xie, L. Q., P. Xie & H. J. Tang, 2003. Enhancement of dis-
solved phosphorus release from sediment to lake water by
Microcystis blooms—an enclosure experiment in a hyper-
eutrophic, subtropical Chinese lake. Environmental
Pollution 122: 391–399.
Hydrobiologia (2009) 631:279–287 287
123