diasporas and outsourcing: evidence from odesk and india€¦ · diasporas and outsourcing:...
TRANSCRIPT

1
Diasporas and Outsourcing: Evidence from oDesk and India Ejaz Ghani, William R. Kerr and Christopher Stanton
August 2013
Abstract: We examine the role of the Indian diaspora in the outsourcing of work to
India. Our data are taken from oDesk, the world’s largest online platform for outsourced
contracts. Despite oDesk minimizing many of the frictions that diaspora connections have
traditionally overcome, diaspora connections still matter on oDesk, with ethnic Indians
substantially more likely to choose a worker in India. This higher placement is the result of a
greater likelihood of choosing India for the initial contract and substantial path dependence in
location choices. We further examine wage and performance outcomes of outsourcing as a
function of ethnic connections. Our examination of potential rationales for the greater ethnic-
based placement of contracts assesses taste-based preferences and information differences.
Keywords: Diaspora, ethnicity, outsourcing, oDesk, networks, India, South Asia.
JEL Classification: F15, F22, J15, J31, J44, L14, L24, L26, L84, M55, O32.
Author institutions and contact details: Ghani: World Bank, [email protected];
Kerr: Harvard University, Bank of Finland, and NBER, [email protected]; Stanton: University of
Utah, [email protected].
Acknowledgments: We thank three extremely helpful anonymous referees, the associate
editor, Mihir Desai, John Horton, Francine Lafontaine, Ed Lazear, Ramana Nanda, Paul Oyer,
Kathryn Shaw, and seminar participants for helpful comments on this work. Funding for this
project was provided by World Bank and Multi-Donor Trade Trust Fund. Kerr and Stanton were
short-term consultants of the World Bank for this project. The views expressed here are those of
the authors and not of any institution they may be associated with.

2
1. Introduction
The economic integration of developing countries into world markets is an important stepping
stone for economic transitions and growth. This integration can be quite challenging, however,
due to the many differences across countries in languages, cultural understanding, legal
regulations, etc. As a consequence, business and social networks can be valuable mechanisms for
achieving this integration (Rauch 2001). Ethnicity-based interactions and diaspora connections
are a prominent form of these networks. The benefits typically cited for diaspora networks
include stronger access to information (especially very recent or tacit knowledge), matching and
referral services that link firms together, language skills and cultural sensitivity that improve
interactions, and repeated relationships that embed trust in uncertain environments and provide
sanction mechanisms for misbehavior. Such traits are hard to construct yet crucial for business
success in many developed and emerging economies. The history of these connections stretches
back to the earliest of international exchanges (e.g., Aubet 2001), and studies continue to find
diasporas important for trade flows, foreign investments, and knowledge diffusion.
Over the last two decades, the Internet has become a potent force for global economic
exchanges. The Internet links customers and companies together worldwide, enables labor to be
provided at a distance, provides instant access to information about foreign locations, and much
more. How will the Internet affect the importance of diaspora networks? On one hand, the
substantial improvements in connectivity and reduced frictions of the Internet may weaken the
importance of diasporas. Alternatively, online capabilities may instead provide an effective tool
that complements traditional diaspora connections (e.g., Saxenian 2006), and online platforms
may present new informational obstacles (e.g., Autor 2001) that diaspora can help overcome. To
shed light on the role of the diaspora in online markets, we investigate the role of the Indian
diaspora in outsourcing to India using data from oDesk. oDesk is the world’s largest online labor
market, processing $30 million per month in contracts as of May 2012. It provides a platform for
companies to post job opportunities, interview workers, monitor performance, and pay
compensation. Workers worldwide bid on jobs, complete tasks, and receive public feedback.
India is the largest country destination for outsourced contracts on oDesk, with more than
a third of the worldwide contract volume. We investigate the role of the Indian diaspora using
both descriptive and analytical techniques. A key feature of our data development, described in

3
greater detail below, is that we identify company contacts located anywhere around the world
who are likely of Indian ethnicity using ethnic name matching procedures. Our measures of
diaspora-linked outsourcing to India build upon this identification of ethnic Indians (e.g., those
with the surnames Gupta or Desai) who are using oDesk.
We find that overseas ethnic Indians are more likely to outsource to India than non-ethnic
Indians. In relative terms, the increase in likelihood is 16%. This higher likelihood is evident
among many types of contracts and at different points of time, but its key feature is its
importance in employers’ initial contract placement. These initial contracts are vital because the
location choices of outsourced work for company contacts are very persistent. We then analyze
wage and performance outcomes. These exercises first emphasize that workers in India are paid
wages on diaspora-based contracts that are typical on oDesk for the type of work being
undertaken in India. Likewise, workers’ current performance and career outcomes appear to be
very similar across the contract types. From the hiring company’s perspective, by contrast,
diaspora-based connections to India provide cost advantages relative to the other contracts that
these company contacts form on oDesk. These cost advantages, however, come with some
deteriorations in performance, yielding an ambiguous net consequence.
Beyond the characterization of these patterns, which are interesting in their own right, we
use them to evaluate possible explanations for the source of the bias in ethnic contract placement.
Descriptive features of the data cast doubt on several rationales traditionally given for diaspora
linkages. The ethnic bias does not appear linked to uncertainty during oDesk’s founding period
or to the easier transfer of specialized or tacit knowledge. Likewise, the very similar wage and
performance outcomes for workers in India across the two contract types suggests a limited role
for greater bargaining power of ethnic Indians with workers in their home region or for
productivity advantages that ethnic Indians possess when working with India.
Our attention then turns to distinguishing between taste-based preferences and statistical
discrimination/information differences. The former suggests members of an ethnic group prefer
to work with each other, while the latter suggests ethnic Indians may have informational
advantages that lead them to search out opportunities with workers in India. These two factors
are often quite difficult to disentangle due to researchers being limited to making inference from
data containing only aggregate wages or demand for labor of different types (e.g., Altonji and

4
Blank 1999, Giuliano, Levine, and Leonard 2009). Our task is made somewhat easier, at least in
principle, by the fact that we consider differences across separate types of employers that we can
group in the data. Few other papers have direct measures that link demand for different types of
workers to the identity of employers. We are also aided by the direct observation of performance
outcomes, and thus we do need to solely rely on wage differences to infer productivity
consequences.
Models of statistical discrimination and information differences predict that ethnic Indian
company contacts should be able to exploit situations where little knowledge is publicly
available about a workers’ ability. If ethnic Indian company contacts possess information
advantages, one would expect to detect ethnic Indians hiring a relatively large share of
inexperienced Indian workers while enjoying either productivity or wage advantages precisely
because details about worker ability are sparse. While we find that the ethnic bias is largest for
hiring inexperienced workers in India, consistent with information differences, other predictions
of the information-difference model are not detected.
In particular, there are no detectible productivity or wage differences when an Indian
diaspora company contact hires either inexperienced or experienced Indian workers. In addition,
it does not appear that the Indian diaspora is advantaged in selecting talented workers. Diaspora-
based contracts do not provide future career advantages for ethnic Indian workers and
inexperienced workers on diaspora-based contracts are no more likely to go on to successful
careers on oDesk. With no evidence of mean productivity or wage differences on these
contracts, a model of statistical discrimination has difficulty explaining the initial ethnic bias in
hiring if employers’ beliefs about mean productivity are correct on average.1
These findings push us towards taste-based preferences as a key factor. We are quite
cautious in this conclusion, as multiple factors may exist in such a complex environment. While
we are unable to say whether the taste-based preferences lie more with the ethnic Indians or more
with the comparison groups (e.g., Anglo-Saxon company contacts being less inclined to utilize
some Indian workers), these biases clearly play an important role in initial choices. These
1 As dicussed later in Section 8, we also consider and find evidence against explanations relying on ethnic
Indian and non-ethnic Indian employers having different beliefs about the variance of Indian worker productivity.

5
choices then have lasting consequences, as employers are less likely to experiment with future
workers if past contracts achieve acceptable performance.
These results are quite striking. oDesk’s business model seeks to minimize many frictions
and barriers to outsourcing—for example, providing companies with knowledge of workers for
hire overseas and their qualifications, providing infrastructure for monitoring and payments
between companies and workers, and creating a labor market where workers build reputations
that enable future work and higher wages. These frictions that oDesk seeks to minimize, of
course, are frictions that diaspora networks have historically been used to overcome. Our work
suggests that diasporas continue to be important in an online world—if for no other reason than
preferences or small information differences that shape contract placement. We view our results
as a lower bound on the importance of diasporas in settings where frictions are larger.
At a higher level, the Indian diaspora likely played an important, but modest, role in
India’s rapid development on oDesk. At several points, we provide descriptive evidence of the
magnitudes of these interactions that place upper bounds on how large this role could have been.
For example, ethnic Indians account for 3.9% of oDesk company users in the United States by
contract volume, while 29% of outsourced contracts from the United States go to India. We
likewise find that only 5.7% of workers in India who complete three or more jobs on oDesk had
their initial contract with an overseas ethnic Indian employer. These magnitudes suggest that
diaspora continue to use online platforms in an effective manner, but that they play a modest role
in the overall development of online work, at least for a country of India’s properties, and likely
had limited consequences for the overall market structure of oDesk.
With these results in mind, it is important to place our study of the Indian diaspora in
perspective. We focus on a single ethnicity in this analysis, rather than undertaking a multi-
ethnicity comparison study, to facilitate greater depth around one example. India was the natural
choice given its worldwide importance for outsourcing. India also has operational advantages in
that its common names are fairly distinct from other ethnic groups. Yet it is also important to
consider India’s properties and the generalizability of our results. India’s conditions suggest that
it may be an upper bound in terms of the aggregate impact from these connections. It may also

6
be the case that other ethnic diaspora face a steeper trade-off in terms of wage rates and
performance outcomes than the Indian case that we describe below.2
Our work contributes to a developing literature that explores the operation of online labor
markets and the matching of firms and workers. Agrawal, Lacetera, and Lyons (2012) find that
workers from less-developed countries have greater difficulty contracting work with developed
countries on oDesk. This is especially true for initial contracts, and the disadvantage closes
somewhat with the worker’s platform experience. The authors suggest that some of this difficulty
may be due to challenges that companies in advanced economies encounter when evaluating
workers abroad. Our study suggests that diaspora connections to advanced economies help
workers access these initial contracts, although as noted above this effect is of modest size
relative to the overall development of oDesk in India. Mill (2013) studies statistical
discrimination and employer learning through experience with hiring in particular countries. We
find patterns similar to those in Mill’s work that are consistent with employer learning about
groups of workers. Our work on ethnic connections provides an important foundation for
understanding how this learning process commences while locating its boundaries. In this spirit,
our work relates to two other studies that utilize oDesk to consider the development of
information about employees on oDesk. Using a creative experimental study, Pallais (2011) finds
that employers experiment with inexperienced workers too infrequently from a social-welfare
perspective (e.g., Tervio 2009). Our path dependency results offer a related message to Pallais,
demonstrating there is limited experimentation if initial selections are performing at an
acceptable level. Finally, Stanton and Thomas (2011) also document that intermediation has
arisen in the oDesk market to overcome information problems about worker quality.3
2 First, India’s wage rate is low enough that it can be very attractive for outsourcing, and such gains would
be weaker for higher-wage locations (e.g., the European diaspora). Second, India possesses several attractive traits
needed for oDesk to operate effectively: English language proficiency, Internet penetration, available banking
facilities, etc. Without these necessary ingredients, it may be harder for diaspora connections to emerge around
online labor outsourcing. Third, and most speculatively, there may be required levels of critical mass, in terms of the
diaspora abroad and the potential workers in the country. Future research needs to analyze these traits more broadly. 3 Autor (2001) and Horton (2010) review online labor markets. Montgomery (1991) models social
networks in labor markets. Beyond labor markets, Forman, Ghose, and Goldfarb (2009) study the interplay between
local and online consumer options. Freedman and Jin (2008) and Agrawal, Catalini, and Goldfarb (2012) study
social networks in online lending. An example of off-line work in this regard is Fisman, Paravisini, and Vig (2012).

7
The findings in this paper also relate to research investigating the outsourcing of work
from advanced economies, the emergence of incremental innovation in developing countries, and
connections between immigration and outsourcing.4 More broadly, these findings contribute to
understanding the role of diaspora and ethnic networks in economic exchanges across countries.
Ethnic networks have been shown to play important roles in promoting international trade,
investment, and cross-border financing activity, with recent work particularly emphasizing the
role of educated or skilled immigrants.5 This work has further emphasized the role of diaspora
connections in technology transfer.6 Our analysis is among the first to be able to study
outsourcing as a channel, and we derive evidence that links diaspora to both greater use of oDesk
by ethnic Indians in a country and greater flows of outsourced work to India.7
These findings are important for managers. Generally, the development and growth of
online labor markets represents an enormous change in terms of human resource decisions that
firms make. Labor has traditionally been among the most localized of resources to a firm, and the
ability of managers to use platforms like oDesk to globally outsource work effectively and
cheaply will influence how competitive their firms are going forward. This lesson will more
4 For example, Feenstra and Hanson (2005), Liu and Trefler (2008, 2011), Amiti and Wei (2009), Blinder
and Krueger (2009), Ebenstein et al. (2009), Puga and Trefler (2010), Ottaviano, Peri, and Wright (2010), Mithas
and Lucas (2010), Harrison and McMillan (2011), and Tambe and Hitt (2012). Banerjee and Duflo (2000), Khanna
(2008), and Ghani (2010) consider aspects of these phenomena for India specifically. Wang, Barron, and Seidmann
(1997), Cachon and Harker (2002), and Novak and Stern (2008) provide related models of the sourcing choice. 5 Broad reviews of diaspora effects include Rauch (2001), Freeman (2006), Clemens (2011), Docquier and
Rapoport (2011), and Gibson and MacKenzie (2011). Evidence on foreign direct investment includes Saxenian
(1999, 2002, 2006), Arora and Gambardella (2005), Buch, Kleinert, and Toubal (2006), Kugler and Rapoport (2007,
2011), Bhattacharya and Groznik (2008), Docquier and Lodigiani (2010), Iriyama, Li, and Madhavan (2010),
Huang, Jin, and Qian (2011), Nachum (2011), Hernandez (2011), Javorcik et al. (2011), Rangan and Drummond
(2011), and Foley and Kerr (2013). Evidence on trade includes Gould (1994), Head and Ries (1998), Rauch (1999),
Rauch and Trindade (2002), Kerr (2009), Rangan and Sengul (2009), and Hatzigeorgiou and Lodefalk (2011). 6 Recent work includes Kapur (2001), Kapur and McHale (2005a,b), Agrawal, Cockburn, and McHale
(2006), MacGarvie (2006), Nanda and Khanna (2010), Oettl and Agrawal (2008), Kerr (2008), Agrawal et al.
(2011), and Foley and Kerr (2013). Singh (2005), Obukhova (2009), Choudhury (2010), and Hovhannisyan and
Keller (2010) study related forms of international labor mobility and technology diffusion, and Keller (2004)
provides a review. Marx and Singh (2012) consider knowledge flows and borders versus distance. 7 Our working paper contains gravity-model analyses that link a larger general Indian diaspora in nations to
greater oDesk use by ethnic Indians located in those countries. This analysis connects studies that consider diasporas
from a macro perspective (e.g., linking trade flows to diaspora shares by country) with studies that consider micro
evidence (e.g., that patent citations are more likely among inventors of the same ethnicity).

8
broadly apply to many other forms of trade in services as well. With respect to innovation and
entrepreneurship, many companies are already using platforms like oDesk to outsource
technological work to cheaper locations. Blinder and Krueger (2009) estimate that 34% to 58%
of jobs in the professional, scientific and technical services industry can be offshored from the
United States, two or three times higher than the national average. This outsourcing has become
especially common among cash-strapped start-up companies for website development and
mobile apps (e.g., Kerr and Brownell 2013). We provide new insights about how diaspora
connections shape these contract flows and the biases that managers may have in their choices.
Our work also provides insights on the overall effectiveness of outsourcing contracts to India.
2. oDesk Outsourcing Platform and Ethnicity Assignments
oDesk is an online platform that connects workers who supply services with buyers who pay for
and receive these services from afar. Examples include data-entry and programming tasks. The
platform began operating in 2005. oDesk is now the world’s largest platform for online
outsourcing.8 The oDesk market is a unique setting to study the diaspora’s impact on economic
exchanges due to its recent emergence and exceptionally detailed records. One important feature
is that any worker can contract with any firm directly, and all work takes place and is monitored
via a proprietary online system. In exchange for a 10% transaction fee, oDesk provides a
comprehensive management and billing system that records worker time on the job, allows easy
communication between workers and employers about scheduled tasks, and takes random
screenshots of workers’ computer terminals to allow monitoring electronically. These features
facilitate easy, standardized contracting, and any company and any worker can form electronic
employment relationships with very little effort.
A worker who wants to provide services on oDesk fills out an online profile describing
his/her skills, education, and experience. A worker’s entire history of oDesk employment,
8 oDesk’s expansion mainly reflects increasing demand for online labor services over time. Statistics from
compete.com, a company that tracks Internet traffic, show that unique visits to oDesk and its four largest
competitors (some of which pre-date oDesk) increased simultaneously in recent years. Overall growth of online
outsourcing slowed with the financial crisis, but oDesk has continued to grow rapidly.
9
including wages and hours, is publicly observable. For jobs that have ended, a feedback measure
from previous work is publicly displayed. Figure 1 provides an example of a worker profile.
Companies and individuals looking to hire on oDesk fill out a job description, including
the skills required, the expected contract duration, and some preferred worker characteristics.
After oDesk’s founding, most of the jobs posted were hourly positions for technology-related or
programming tasks (e.g., web development), but postings for administrative assistance, data
entry, graphic design, and smaller categories have become more prevalent as the platform has
grown. After a company posts a position opening, workers apply for the job and bid an hourly
rate. Firms can interview workers via oDesk, followed by an ultimate contract being formed.
We study the role of the Indian diaspora in facilitating oDesk contracts to India. Our data
begin at oDesk’s founding in 2005 and run through August of 2010. The data were obtained
directly from oDesk with the stipulation that they be used for research purposes and not reveal
information about individual companies or workers. oDesk does not collect a person’s ethnicity
or country of birth, so we use the names of company contacts to probabilistically assign
ethnicities. This matching approach exploits the fact that individuals with surnames like
Chatterjee or Patel are significantly more likely to be ethnically Indian than individuals with
surnames like Wang, Martinez, or Johnson. Our matching procedure exploits two databases
originally developed for marketing purposes, common naming conventions, and hand-collected
frequent names from multiple sources like population censuses and baby registries. The process
assigns individuals a likelihood of being Indian or one of eight other ethnic groups.9
Several features of this work should be noted. First, some records cannot be matched to
an ethnicity, either due to incomplete records for listed ethnicities (e.g., very obscure names) or
to uncovered ethnic groups (e.g., African ethnicities). Second, this approach can describe ethnic
origins, but it cannot ascertain immigration status. For example, a U.S.-based company contact
with the surname Singh is assigned to be of ethnic Indian origin, but the approach cannot say
whether the individual is a first- or later-generation immigrant. Third, while we focus on the
Indian ethnicity, attempting to match on all nine ethnic groups is important given that some
9 The ethnic groups are Anglo-Saxon, Chinese, European, Hispanic, Indian, Japanese, Korean, Russian, and
Vietnamese. Kerr (2007, 2008) and Kerr and Lincoln (2010) provide extended details on the matching process, list
frequent ethnic names, and provide descriptive statistics and quality assurance exercises. Stanton and Thomas
(2011) further describe the oDesk platform.

10
names overlap across ethnicities (e.g., D’Souza in the Indian context due to past colonization).
Finally, while we use the terminology “Indian” for our ethnic assignment, it is worth noting that
the procedure more broadly captures South Asian ethnic origin.10
We assign ethnicities to company contacts undertaking hiring on oDesk, with a match
rate of 88%.11
The company contact is the individual within each firm that hires and pays for the
service. In most cases, this company contact is the decision maker for a hire. This is good for our
study in that we want to evaluate the role of ethnic connections in outsourcing decisions, and this
structure illuminates for us the person within the larger firm making the hiring choice.12
It is important to note that during our sample period job postings only list the company
location, not the company contact’s name. We know the contact’s identity through oDesk’s
administrative records, but potential job seekers do not observe the names of individuals. This
asymmetry removes much of the potential sorting of job applicants across contract opportunities
in terms of company contact ethnicity (e.g., workers in India bidding more frequently for
postings from ethnic Indians in the United States). We cannot rule out, however, that some
inference is made through company names, for example. In coming analyses, we will control
directly for share the share of applications coming from India as a robustness check.13
10
Names originating from India, Pakistan, Bangladesh, etc. overlap too much to allow strict parsing. We do
not believe this name overlap has material consequences. The imprecision will lead to our descriptive estimates
being slightly off in terms of their levels, but not by much given that India has by far the largest South Asian
diaspora. For regressions, measurement error would typically result in the estimates of network effects being
downward biased, but even here this is not clear to the extent that other South Asians more likely to work with India. 11
This match rate rises somewhat when removing records that are either missing names or have non-name
entries in the name field (e.g., either the company is listed in the name field or a bogus name like “test”). The four
most common surnames linked with the Indian ethnicity are Kumar, Singh, Ahmed, and Sharma. 12
A related limitation, however, is that the oDesk data do not easily link company contacts into larger
firms. This structure limits our ability to describe the firm size distribution on oDesk, but for most applications this
has limited consequence. For researchers, this structure is operationally quite similar to patent assignee codes/names. 13
Conditional on the year x job type x country of the company contact, there are only very small
differences in the rate at which workers in India apply for the jobs posted by ethnic Indians versus other ethnic
groups. Regressions find a 0.016 (0.009)* higher share of applicants from India on contracts listed by ethnic Indians
who do not actively use the search feature. This higher share comes from companies’ subsequent contracts [0.021
(0.011)*] compared to initial contracts [-0.002 (0.014)]. As an additional note, our data do not indicate whether side
arrangments form between companies and workers. We suspect, but cannot verify, that the number of cases where
an employer asks a pre-arranged contact to enlist on oDesk in order to employ them is low due to the fees that
oDesk charges. It is more likely that successful employment relationships move offline and into side arrangements
to circumvent oDesk fees. This would potentially impact our analysis to the extent that the likelihood of moving

11
3. Descriptive Features
Table 1 presents the top 20 countries outsourcing work to India on oDesk. The United States is
by far the largest source of oDesk contracts going to India, with 31,261 contracts over the five-
year period. A majority of all contracts on oDesk originate from the United States. The
distribution of contract counts has a prominent tail. The United States is followed by Australia,
the United Kingdom, and Canada, which combined equal about a third of the U.S. volume.
Spain, the 10th largest country in terms of volume, has less than 1% of the U.S. volume. Column
4 shows a very close correspondence of contract counts to distinct outsourcing spells, where the
latter definition groups repeated, sequential contracts between the same worker and employee.
Columns 5 and 6 show the share of contracts originating from each country that go to
India, both in total and relative to cross-border contracts only (i.e., excluding oDesk contracts
formed with workers in the source country). Contracts to India represent a 29% share of all
contracts originating from the United States and a 33% share of cross-border contracts. Across
the top 20 countries, India’s share of a country’s contract total volume ranges from 18% in
Switzerland to 55% in the United Arab Emirates (UAE). The unweighted average of the top 20
countries is 28%. The UAE is an exceptional case that we describe further below.
Column 7 documents the share of company contacts in each country with an ethnically
Indian name, regardless of how they use oDesk, while Column 8 provides the ethnic Indian
percentage of company contacts on contracts that are being outsourced to India. For the United
States, 3.9% of all company contacts who use oDesk are ethnically Indian, while the share is
4.6% for work outsourced to India.14
This higher use for India specifically can be conveniently
offline was greater for diaspora-based connections. We have not seen evidence to suspect that side arrangements
have an ethnic bias to them; rates of continuing to use oDesk do not differ substantially across contract types. 14
To put these figures in perspective, 0.9% of the U.S. population in the 2010 Census of Populations was
born in India. These numbers are not exactly comparable, as our measure is based off of ethnicity, rather than
country of birth, and includes South Asia more generally. Nonetheless, even after taking these features into account,
the role of Indians on oDesk is perhaps twice as strong as the overall Indian population share. As a second
comparison point, Kerr and Lincoln (2010) estimate the ethnic Indian share of U.S. inventors to be about 5% in
2005 using patent records from the United States Patent and Trademark Office. This second comparison point uses
the same name matching approach as the current project. It thus suggests that Indians may use oDesk somewhat less
as a share of total users compared to their general presence in high-tech sectors.

12
expressed as a ratio of 1.18 between the two shares. The average ratio across all 20 countries is
1.30, with 13 nations having a ratio greater than one. Finally, Column 9 of Table 1 lists the
average hourly wage paid to Indian workers on outsourced contracts. The range across the top 20
countries is from $7 to $12, with an average of $10. As the average wage on oDesk for data entry
and administrative support jobs is below $3 per hour, the contracts being outsourced to India
represent relatively skilled work that involves programming and technical skills.
Thus, the descriptive data suggest a special role for diaspora connections in sending work
to India. The next sections more carefully quantify this role when taking into account potential
confounding factors (e.g., the types of projects being outsourced), finding that this special role
persists. But we also should not lose sight of the absolute quantity of the shares. Ethnic Indians
in the United States account for about 5% of the U.S.’s outsourced work to India. The average
across the top 20 countries is 7%, falling to 3% when excluding the UAE. While ethnic Indians
are more likely to send work to India, the rise of India to be the top worker source on oDesk also
appears to have much broader roots than diaspora connections.
The unpublished App. Tables 1a-2 provide additional descriptive statistics. The top
company contacts that send work to India display significant heterogeneity in terms of their
geographic location and the overall degree to which they rely on India for outsourcing work.
These company lists also highlight that, while much of the diaspora’s effect comes through the
small actions of many individuals, the actions of a few can have an enormous impact. In
particular, there is one company contact in the UAE that accounted for 906 of the UAE’s 989
contracts to India. This outlier is an ethnic Indian entrepreneur who uses oDesk for placing and
managing outsourcing work, much of which is sent to India. Studies of diaspora networks often
speculate about the concentrated importance of single individuals (e.g., Kuznetsov 2009), and
oDesk provides some of the first quantifiable evidence of this concentration. This individual
accounts for 7.7 times more contracts being sent to India than the next highest company contact
and 2.4 times the volume from the Netherlands, the sixth-ranked country in Table 1.

13
4. Ethnicity and Persistence in Outsourcing Patterns
This section describes the persistence in the geographic placement of contracts by company
contacts. This persistence emphasizes the important role of initial contracts, which we analyze in
greater detail in Section 5. Sections 6-8 then consider wage and performance outcomes.
Table 2 describes the key path dependency that company contacts display in the way they
engage with India on oDesk. The sample includes all first and second contracts formed by
company contacts located outside of India. The first row documents that 39% of ethnic Indians
choose India for their initial outsourcing contract. This rate compares to 32% for non-ethnic
Indians, and the 7% difference between these shares is statistically significant at the 1% level.
The next two rows show a strong contrast when looking at second contracts. Differences across
ethnicities no longer link to differences in propensities to choose India; the more critical factor is
whether the initial contract outsourced by the company contact went to India. Subsequent
contracts have similar properties to the second contract, and the same pattern is evident when
considering unique outsourcing employment spells. This pattern continues to hold when unique
worker-company spells are used as the unit of analysis to assess the sensitivity of results to re-
contracting and simultaneous auditions by employers. Thus, with all the caveats that need to be
applied to sample averages, these simple descriptives suggest that ethnicity could play an
important role in initial contract placements, with path dependency then taking on a larger role.
What drives this strong persistence in geographic choices? A very likely candidate is
whether or not the company contact has a good experience on the first contract. Good
experiences can create inertia where other options are not considered or adequately tested. Table
3 examines this possibility with linear probability models of the location choice of second
contracts or outsourcing spells. The estimating equation takes the form
,iii
iitjci
IndiantactEthnicCompanyConfulactSuccessFirstContr
IndiantactEthnicCompanyConfulactSuccessFirstContrOutcome
where contracts or spells are indexed by i. In the first column, the dependent variable is an
indicator variable that takes the value of one if the company contact chooses India again. The
primary independent variables are an indicator variable for the first project being a success
(“good” performance rating or higher on the public feedback score or a successful evaluation in
14
the private post-employment survey), the probability that the company contact is of ethnic Indian
origin,15
and their interaction. To control for many potential confounding factors, regressions
include fixed effects for the (year t) x (job category j) x (country c) of each company contract.
Thus, the analysis compares, for example, ethnic Indians and non-ethnic Indians outsourcing
web development work from the United Kingdom in 2009.
The results in the first column speak very strongly for how good experiences on initial
contracts generate persistence. Success on the first contract raises the likelihood of staying in
India by 6.6% compared to a baseline of 57%. Ethnic Indians are somewhat more likely to
choose India again, conditional on the rating of the first project, but these differences are
marginally significant. Columns 2 and 3 show similar results when requiring a one-day gap
between contracts (e.g., to remove very rapid assignments or recruitment auditions) or when
considering employment spells, respectively. Columns 4-6 show that this effect is tightly linked
with whether or not the company contact continues at all with outsourcing on oDesk. In total,
58% of company contracts post more than one contract on oDesk, and this return to the platform
is closely connected to how well the first experience went. This return probability is not linked to
the ethnicity of the company contact. A mirror image effect exists for company contacts that
outsourced their initial contracts outside of India. A successful first experience for a company
contact outside of India lowers the likelihood of India being selected for later work.
Table 4 extends these insights by estimating across the full oDesk sample the likelihood
of selecting India by experience levels of company contacts. These estimations take the form
iitjci IndiantactEthnicCompanyConIndiaContractTo .
The dependent variable is an indicator variable for selecting a worker in India. Regressions are
unweighted and include fixed effects for year x job type x country of company contact.16
15
This probability is assigned from the name matching algorithm. Indian names are linked to 5.3% of
company contacts. Indian names are fairly distinct, so that in 90% of these cases the ethnic assignment is unique to
the Indian ethnicity. Where the Indian assignment overlaps with another ethnic group due to a shared name, the
regressor takes a proportionate value between zero and one. Table 2 excluded fractional values for convenience. By
comparison, about 0.2% of contracts to India have a common surname for workers and company contacts, indicating
the broader foundation of these ethnic connections than that likely due to family-based connections or similar. 16
We report standard errors that are two-way clustered by company and worker. This clustering strategy
takes into account the repeated nature of our data for both companies and workers. It is important to note that the

15
Panel A includes the full sample of contracts, excluding firms located in India. The first
column is for all contracts regardless of type. In the full sample, we find a significant increase in
the likelihood of selecting India as a destination for outsourcing contracts when the company
contact is of ethnic Indian origin. An ethnic Indian is 4.7% more likely to select India as an
outsourcing destination than other ethnicities. This represents a 16% increase in the likelihood of
selecting India relative to the sample mean of 29%. If conditioning on year x job type fixed
effects, rather than year x job type x country of company contact fixed effects, the effect is 8% in
absolute terms and about 30% relative to the sample mean.
This remarkable increase in ethnic placement could result from many factors, and our
subsequent analyses discern the most likely interpretations. Panel B starts by isolating cases
where a worker from India applies for the position before the contract is awarded. This is a
natural first check against explanations that center on ethnic Indians posting job opportunities
that are simply a better fit for Indian workers. For example, there may be distinct skills that
Indians worldwide specialize in that our fixed effects do not adequately control for. The ethnicity
bias in Panel B is comparable in absolute terms to what is observed in Panel A, and it represents
a 6% increase on the restricted sample’s mean. These results show that the effect is quite similar
when isolating contracts where the company contact has a known option of choosing India.
A similar conclusion is also reached in Panel C when we instead control for the share of
worker-initiated applications for the job posting that came from India. The coefficient is 12% in
relative terms, compared to 16% in Panel A. This may indicate some modest sorting by
applicants in response to the company name or other observable feature of the job posting, or
perhaps that there are deeper technology specializations for workers in India that our base
technology controls are not capturing. Either way, the ethnic placement effect persists when
including this control. Unreported analyses using outsourcing spells are also very similar.
Columns 2-4 split the sample by initial versus subsequent contracts, in the spirit of Table
2’s descriptive tabulations. We again see a very prominent role for ethnicity in the location
choice of the first contract placements. The estimates in Column 2 for initial contracts are very
likelihood of being ethnically Indian is not a generated regressor from the data. It is a metric based off of the
individual’s names and external classifications of names. As the contact names are exactly known, this metric is the
same as any other known trait of the person like gender or location.
16
similar in magnitude to the 7% differential in sample means in Table 2, with the regression fixed
effects now removing many potential confounding variables. Ethnicity’s role in the placement of
subsequent contracts is again lower in point estimate than the initial contracts. Unlike Table 2,
these estimates do not condition on the first contract being in India, so a more substantial ethnic
role emerges because of the lack of accounting for path dependency off of the initial contract.17
Columns 5-8 further examine the third and later contracts of company contacts. Column 5
shows that the ethnic bias in this group, along with the means of the dependent variables, is quite
similar to Column 4. Columns 6-8 separate these subsequent contracts into three groups based
upon their prior experiences. The reported means of the dependent variables are critically
important. In Panel A, India is selected 35% of the time when the company contacts have had
prior success outsourcing to India, 27% of the time when they have prior experience but no
success, and only 13% of the time if they have not utilized India before. Thus, path dependency
plays a key role. With the die so strongly cast, ethnicity is second order in importance compared
to initial contract choices, while sometimes retaining statistical significance. We obtain very
similar results when instead using six months of oDesk experience to group experience levels.
5. Ethnic Diaspora Placements and Initial Contracts
The previous section emphasizes the persistence in geographical placements of outsourcing
contracts, and thus the lasting importance of initial contract choices. It is in these initial decisions
that much of the ethnic effect occurs. Continuing with the regression framework of Table 4,
Table 5 analyzes these initial contracts to learn more about the role of ethnicity. Table 1 repeats
the base specification for initial contracts. The next columns split the initial contracts in various
ways to look for clues within oDesk itself for what may be behind the ethnic bias.18
17
When estimating pooled regressions over Columns 3 and 4 with fixed effects for (year t) x (job category
j) x (country c) x (subsequent contract), the effects are statistically different at a 5% level in Panels B and C.
Specifically, the linear differences for Panels A-C between initial and subsequent contracts among repeat users are -
0.027 (0.018), -0.068 (0.023)***, and -0.033 (0.014)**, respectively. 18
A limit exists for how well internal variations can represent use of the platform as a whole. That is, we
can understand more about the role of diaspora connections for overcoming uncertainty by comparing settings in
oDesk characterized by more or less uncertainty. This internal variation, however, only imperfectly captures the
extent to which diaspora overcome overall uncertainty regarding online outsourcing and oDesk.

17
A starting point is evaluating whether the ethnicity bias is connected to the very early
days of oDesk’s founding and the development of online outsourcing. Many accounts of diaspora
connections suggest that they provide stability and structure in settings where formal institutions
are weak, and perhaps the initial contract ethnicity bias stems from a similar environment during
oDesk’s emergence. Columns 2 and 3 split the sample by contracts formed during 2008 and
earlier versus contracts formed during 2009 and after. This partition suggests that the Indian
placement effect is growing over time. The means of the dependent variables, moreover,
highlight that India’s share of initial oDesk contracts is declining from its level in 2008. These
patterns suggest that the differences seen in initial contracts are not due to diaspora overcoming
initial uncertainty about oDesk. These patterns do not completely rule out a role for uncertainty,
however, as one could imagine a growing pool of heterogeneous workers in India increasing
uncertainty about quality in the later period, leading to fewer contracts and a larger ethnic bias.
A second group of explanations for diaspora connections emphasize enhanced
communication across places. One form of this argument focuses on language barriers, while a
second emphasizes the ability of these networks to transfer specialized or tacit knowledge.
Language barriers appear to play a minimal role. App. Tables 3a-3c present tabulations of hired
worker characteristics, either generally across foreign countries or in India specifically, by the
ethnicity of the hiring company contact. These tabulations show that English proficiency scores
are no different, or even higher, for the workers hired by ethnic Indian company contacts
compared to peers. In general, English proficiency scores are higher for workers in India than
outside (4.88 vs. 4.72 on a five-point scale). With respect to the second form, India represents a
large share of high-end contract work on oDesk. It could be that the bias is due to the facilitation
of this high-end work, where communication must be even more subtle than general language
proficiency. Columns 4 and 5 of Table 5 split the sample by whether the job type is high-end.19
The ethnic bias is present in both categories, but it is bigger in low-end jobs. This suggests that
while specialized knowledge transfer may play a role, it is not the primary driver either.
19
High-end contracts include networking and information systems, software development, and web
development. App. Table 2 shows that these categories have the highest wages on oDesk.

18
Columns 6 and 7 provide some of our most important results. Our data indicate whether
the hiring employer used the search feature of oDesk while recruiting workers. This search
feature allows company contacts to select regions in which to search, and they can also utilize
search strings like “SQL programmer India.” Unfortunately, our data only record if the company
contact contacted individual workers prior to an organic job application initiated by the worker,
not the details of the search. Column 6 isolates initial contracts where employers did not utilize
this capability, while Column 7 considers where employer searches were used. The composition
of potential hires in the first sample is dictated purely by the workers who respond to the job
posting; employers actively shape the composition of their candidate pool in the latter case. The
difference between the two groups is striking—the ethnicity bias among initial contracts built
upon employer searches is several times stronger, a feature we return to below.
We close Table 5 with two important robustness checks. Column 8 shows that the results
in the total sample are robust to dropping the outlier UAE firm noted earlier (which by definition
only accounts for one initial contract). Column 9 shows similar patterns when looking at fixed-
price contracts. Contracts on oDesk allow for hourly wages or a fixed-price deliverable. We
focus on hourly contracts given that wage rates are defined and negotiated for these workers. It is
nevertheless helpful to see that a similar ethnic bias exists in fixed-price work, too.
In summary, the patterns in Tables 4-5 suggest the ethnicity bias is likely not due to
uncertainty in the oDesk environment or communication barriers. By contrast, we have found a
special role for employer search. At a minimum, these results leave several possibilities for why
ethnic Indians would disproportionately outsource initial contracts to India: 1) taste-based
preferences, 2) information advantages that ethnic Indians possess, 3) greater bargaining power
of ethnic Indians with workers in their home region, and 4) productivity advantages that ethnic
Indians possess when working with India.
6. Wage and Performance Effects of Ethnic-Based Contracts – Base Analysis
To evaluate the remaining candidate explanations for the ethnic bias, we turn to analyses of wage
rates and performance effects. This section begins with a particularly intuitive form of these tests
by simply isolating variation in outcomes among workers in India. Conceptually, this analysis
provides the workers’ perspectives about the gain or loss from taking on a contract with an

19
overseas Indian company contact. This test provides many basic insights that we build upon in
the next two sections with a more complicated framework. Table 6 reports regression results for
wage and performance outcomes, with the four panels considering different dependent variables.
The regression format is similar to that described for the analyses in Table 4, and column headers
provide additional details about each estimation approach.
Panel A analyzes the log wage rate paid on the contract, and Panel B compares the wage
rate paid to the hired worker to the median proposal made by other workers that bid on the same
job opportunity. This latter approach provides an attractive baseline of comparison as the bids
made by other workers are informative about the work opportunity and its technical difficulty.
The estimates suggest very limited wage effects from the perspective of the worker in India.
Most variations find that diaspora-based contracts pay the worker about 1% less than comparable
outsourcing contracts (i.e., same year x job type x country of company contact).20
App. Table 4
shows that this holds under further sample splits and variations. We also find very similar results
when considering outsourcing spells.
Panels C and D consider performance outcomes. Panel C considers an indicator variable
that takes a value of one if the public feedback reported about the contract is “good” or better.
Panel D is constructed similarly, but it is instead taken from a private post-job survey conducted
for oDesk company contacts. The results in both panels indicate that there are no performance
differences for diaspora-based contracts relative to their peers. Effects are very small in
economic magnitude and not statistically significant. The last column shows that the null
performance results hold when conditioning on worker wage, and a very similar result is
obtained when conditioning on total worker salary. These results again hold under the many
sample splits and variations shown in the appendix. More important, App. Table 5 also shows
that this null result holds when using four other measures of performance: obtaining a wage rate
increase on the contract, being hired again on oDesk, being rehired by the same company
contact, and the worker’s wage rate on the next contract that he or she signs.
20
Computational issues require that we report bootstrapped standard errors with re-sampling over workers
for estimates with worker fixed effects. The comparable estimate for Column 1 is -0.029 (0.013).

20
We interpret these results as suggesting that workers in India operate in a competitive
environment where they are paid market rates, regardless of whether or not a contract is
diaspora-based. These results have strong implications for our four remaining hypotheses of
what determines initial location choice. First, they are potentially consistent with taste-based
preferences existing on the part of company contacts, but they are not consistent with significant
levels of taste-based preferences among workers in India. Second, the null results for
performance and wages—especially the lack of rehiring of workers—do not align with stories
about ethnic Indians having special match-specific productivity advantages from employing
workers in India. Similar to observable traits at the time of hire, the future performances of the
hired workers are not different for ethnic Indians. Third, the very small wage declines suggest
that bargaining power by ethnic Indians in their home region is not likely.21
7. A Framework of the Ethnic Outsourcing Bias
This section sketches a simple framework of ethnic outsourcing that builds upon the empirical
results derived thus far. This framework organizes our remaining inquiries by showing in
particular where our current results are observationally similar across accounts. This simple
framework then motivates a more nuanced test to evaluate the taste- versus information-based
hypotheses. The basic idea is to identify a particular group of workers in India—inexperienced
workers—where the ethnic bias is especially strong and compare the diaspora-based differentials
in their wage and performance outcomes to those of a second group of workers in India—
experienced workers—where the bias is weak. While these tests are more cumbersome than our
prior analyses, they provide even sharper insights about the origins of the diaspora bias given
that both groups are located within India.
We model that there are an exogenous number of similar contracts to be filled in each
year by oDesk workers. Outsourcing contracts are characterized by wages w and worker quality
21
App. Tables 6 and 7 repeat this analysis using instead variation across contracts initiated by ethnic
Indians living outside of India. Conceptually, this analysis shifts from the worker’s perspective to that of the hiring
ethnic Indian. This analysis identifies that ethnic Indians pay about 7.5% less when outsourcing to India than to
other locations. We also see some suggestive evidence of performance declines compared to other locations. As
these results are embedded in the framework below and do not shed substantial light on the questions of the ethnic
bias’ origin, we conserve space and do not report them in the main text.

21
q. There are four types of workers who can be employed for outsourcing work: experienced
workers in India, inexperienced workers in India, experienced workers outside of India, and
inexperienced workers outside of India. There are also two types of firm contacts: ethnic Indians
living outside of India and everyone else outside of India.22
A firm f has linear preferences of the form, , where β captures the
trade-off that exists in the market between wages and the quality of workers of type i. Our results
later show this linear trade-off across quality and wages in the market overall holds reasonably
well. The parameter γ, indexed by worker and firm type, is either a match-specific productivity
component, an information component, or a taste-based component, as described below. Finally,
the ε term is a mean-zero idiosyncratic benefit to a worker-firm match.
Firms post a job opportunity and receive an exogenous draw of candidates from which to
choose. Labor demand for a firm of type f is given by maximizing over candidates according to
the above preferences. If all we had was data on labor demand, it would be impossible to
distinguish among these components, which is the origin of the common ambiguity between
taste- and information-based preferences. Our data on productivity, however, afford sharper
assessments. In particular, if reflects taste-based preferences rather than match-specific
complementarity or information differences, then observed productivity should only be a
function of worker type i and not be a function of the interaction of worker and firm types. This
is because the parameters shape selection but not the productivity afforded to various worker
qualities. On the other hand, parameters related to added insights about workers or better
systematic match qualities would be expected to be visible in the form of wages, productivity, or
both, with one exception outlined below.
Perhaps an even more realistic possibility is that only a subset of ethnic Indian company
contacts have a comparative advantage in identifying talented inexperienced Indian workers. In
22
Our framework thus abstracts from the fact that outsourcing firms compare oDesk with offline
opportunities or with competing online platforms. We also assume that all contracts have the same basic needs,
reflecting our empirical strategy to look at variation within each year x job type x country of company contact. We
reported earlier that ethnic Indians are a modest share of the total pool of company contacts and reflective for the
United States of ethnic Indian involvement in technology fields generally. We thus assume that this ethnic Indian
group’s share of company contacts in the contract pool is exogenous and not overly influencing market structure.

22
this case, differences in aggregate demand for inexperienced workers come from only a small
number of firms. A test of the statistical discrimination hypothesis is still possible: so long as
there is variation in hiring within firm, productivity and wage regressions with firm fixed effects
should differ from pooled OLS regressions because the fixed effects remove firm-specific
advantages in selecting inexperienced Indian workers. In wage and productivity OLS regressions
and regressions with firm fixed effects, a null finding would suggest that information differences
and ethnicity-specific complementarities are not detectible.
8. Wage and Performance Effects of Ethnic-Based Contracts – Redux
Building upon Section 7’s framework, Table 7 first revisits the initial outsourcing choice
regressions in Table 4. We redefine the outcome variable in Columns 1-6 to be the hiring of a
worker in India with five or fewer prior jobs, which we define to be an inexperienced worker.
We define the outcome variable in Columns 7-12 to be the hiring of an experienced worker in
India with six or more prior jobs. The means of the dependent variables across the two groups
are similar, showing that overall hiring of inexperienced and experienced workers in India is
comparable. The ethnic placement effect is concentrated, however, in the former group of
inexperienced workers. We obtain similar results when using multinomial logit models that
allow selection over countries and experience levels. This provides the ethnic hiring differences
needed to exploit the variation in Section 7’s framework.23
These results could be quite consistent with an information-based story where ethnic
Indians are better able to evaluate and screen inexperienced workers in India. Some earlier
evidence surround the higher English-language proficiency among workers in India and their
other observable traits at the time of hire did not indicate a special role for worker screening, but
23
This experience pattern relates to evidence from Agrawal, Lacetera, and Lyons (2012) that workers in
developing countries have an initial disadvantage on oDesk—one may have expected that diaspora-based links
could have provided a fruitful opportunity to overcome the initial uncertainty about workers. In general for India, the
ethnic diaspora appears to have played a limited role in “unlocking careers” by giving workers in India a start. In
simple descriptive terms, 9.4% of workers in India start with an ethnic Indian employer from outside of India. Of
workers in India who complete three or more jobs on oDesk, 5.7% of these workers started with an ethnic Indian
employer, as noted above. In our sample, a little over 5% of our company contacts are ethnic Indian. Given the
ethnic-based relative effect for selecting an inexperienced worker in Column 2 is about 40%, these estimations are
showing a similar magnitude to these descriptive features in a more rigorous format, predicing roughly 7% of initial
starts.

23
such tests may be inaccurate if true informational advantages come from discerning qualities not
quantified on the oDesk platform at the time of hire. As described when developing our
framework, we now also use this variation to assess performance outcomes.
Tables 9 and 10 complete our analysis by considering broader variations across ethnic
Indian and non-ethnic Indian company contacts with the specification
.3
2
1
0
210
iiii
ii
ii
i
iiiidtjci
NewIndiaIndiantactEthnicCompanyCon
NewIndiantactEthnicCompanyCon
IndiaIndiantactEthnicCompanyCon
IndiantactEthnicCompanyCon
NewIndiaNewIndiaOutcome
Our outcome variables are the wages and performance ratings on contracts, as indicated in the
column headers. We also consider whether a worker is hired again on oDesk and the worker’s
future wages. Our base specifications include fixed effects for year x job type x country of
company contact and for expected project duration. We then use indicator variables to identify
three worker traits: location in India, new/inexperienced worker status, and their interaction. The
β coefficients give the broad implications for non-ethnic Indian contacts. We then include the
probability that the hiring contact is of ethnic Indian origin and its interaction with these three
traits. The γ coefficients describe the differences observed for ethnic Indian company contacts.
The first row of Table 8 shows that workers in India are generally paid lower wages and
receive weaker performance reviews than workers outside of India. They are also less likely to
be rehired and receive lower future wages. This pattern is indicative of firms facing a trade-off in
choosing India as a destination. The second row shows that inexperienced workers receive lower
wages and worse unconditional performance ratings than experienced workers. Columns 4 and 6,
which also include the wage as a control variable, find some evidence of inexperienced workers
having comparable conditional performance ratings, broadly in line with our framework’s
structure. This is also true when using total salary as a control variable. Finally, the third row
shows that inexperienced workers in India regain some of the wage reductions evident in the first
two rows, but not all. They also show some better performance with respect to future hiring.
The second set of coefficients is our key finding. The γ coefficients on the interaction
terms deliver null results in almost every specification. This pattern says that all of the

24
consequences (good and bad) from outsourcing to India come through greater engagement with
the country, not from being an ethnic Indian. This is true for both experienced and inexperienced
workers, as shown in the interaction variables, and we find similar results when including
company contact fixed effects in Table 9. The similarity of Tables 8 and 9 suggests that the
variation in outcomes is not due to some unobserved comparative advantage in working with
India or in finding relatively productive Indian workers in low-information environments. We
also find very similar results when considering outsourcing spells, and App. Table 8 shows these
same patterns when we consider each firm as a unit of observation and aggregate up all of their
contracts into a single set of wage and performance metrics. The pattern always remains the
same—that the higher frequency of ethnic-based contracts to India by overseas ethnic Indians
has its impact only through greater general engagement with India.
This stark set of results is consistent with a taste-based preferences account, and it is less
consistent with most other accounts of why ethnic Indians are placing work into India. The most
prominent candidate that has remained through the discussions so far is an information
advantage or statistical discrimination role that the Indian diaspora possess. Models of statistical
discrimination or information advantages can account for the initial ethnic bias in hiring that
dissipates with worker experience, but they struggle to explain why the ethnic Indian contracts
with inexperienced workers do not display detectible wage or performance advantages. The
performance results also cast doubt on persistent differences in prior beliefs for ethnic and non-
ethnic Indian company contacts.24
From these and prior results, we conclude that taste-based
24
There is a distinction between beliefs about the mean of the distribution and beliefs about the variance.
Consider the first case where the mean of the distribution of prior beliefs about Indian worker quality is the same for
all employers but ethnic Indian company contacts have a more precise prior. Standard search theory implies that, for
employer who repeatedly use oDesk, the option value of sampling Indian workers is higher for non-ethnic Indians.
This case would produce an ethnicity bias in the opposite direction of the result. In addition, this case suggests that
posterior beliefs about Indian workers’ productivity change least in response to new information for ethnic Indian
employers because of their relatively precise priors. Thus, we would expect to observe different responses to prior
success in India. We find limited difference in success dependence across employer types, suggesting that the
learning process is similar for both employer types. We cannot rule out the second case, that the means of the prior
distributions differ. However, this case seems unlikely because ethnic Indian employers do not pay more than non-
ethnic Indian employers when hiring workers in India and performance metrics are similar for both types.

25
preferences among oDesk actors in the originating countries is likely the most important (but
perhaps not exclusive) driver of the ethnic bias observed in outsourcing to India.25
We do not have a strong empirical reason for the bias towards inexperienced Indian
workers, except to note that it does not carry detectable performance consequences. The oDesk
marketplace appears to contain a fairly sturdy trade-off between wages and worker quality,
within and across countries, and this limits the scope for a special ethnic-based relationship.
Taste-based rationales provide the most consistent explanation for this feature.
9. Conclusion
Diaspora-based exchanges have been important for centuries, but the online world reduces many
of the frictions these networks solved. This study investigates the importance of Indian diaspora
connections on the oDesk platform for outsourcing. We find strong evidence that diaspora still
matter and influence economic exchanges, even when many frictions are minimized. While
diaspora connections may not have been the driving force in India becoming the top destination
for oDesk contracts, they remain important for shaping the flow of outsourcing contracts. In fact,
our case study suggests that the Indian diaspora’s use of the platform is increasing with time.
Our study suggests that this importance comes from path dependency in location choices
and a greater likelihood of overseas ethnic Indians selecting India for their first contract. Initial
contracts are a very important, almost experimental, period where long-term habits form, and
25
There is one form of information advantages that could persist and explain these results. In Section 7’s
framework, one can define the γ parameters such that they are a binary representation of the company contact
knowing the worker is qualified, with ethnic Indians having a higher likelihood of being able to vet an inexperienced
worker in India. Assuming the ε parameters are sufficiently small in variance, the γ parameters could completely
define a restricted choice set of vetted candidates. In this case, workers could be chosen according to market-based
wages and productivity and idiosyncratic match qualities, with ethnic Indians possessing a naturally larger set of
vetted inexperienced Indian candidates, and thus a larger set of chosen workers. Because the information advantage
does not influence productivity if the worker is in the set of known qualified workers, it would be observationally
the same as taste-based preferences, and it would also look the same using variation across and within company
contacts. It is important to stress, however, the particular nature of these conditions. Most important, this explanation
requires an almost knife-edge property such that the information content conferred to an ethnic Indian company
contact for inexperienced Indian workers needs to have the exact same statistical properties as that afforded to a
non-ethnic Indian company contact when evaluating an experienced Indian worker and an ethnic Indian company
contact when evaluating an experienced Indian worker; otherwise, performance consequences would become
evident due to differences in signal quality.

26
ethnic Indians are more likely to choose India initially. Our analysis suggests that taste-based
preferences play the largest role for these initial choices. This preference may be on the part of
the ethnic Indians, or it could reflect non-ethnic Indians being more reluctant to select India for
work. Other factors such as better trust in uncertain environments or information advantages
could also exist—and in such a complex environment as outsourcing to India are likely to be true
in certain pockets of activity—but our analyses suggest that these alternatives are less important
for explaining the overall patterns of ethnic-based outsourcing than taste-based preferences.
These findings have important managerial consequences. The initial biases of managers
can result in imperfect long-term arrangements, as path dependence and contentment with the
status quo produce inertia in further experimentation. As online markets increase competition—
in oDesk’s case by breaking down the strong spatial partitions that have traditionally existed with
labor markets—these biases may hurt firm performance in significant ways. Innovation and
entrepreneurship will be particularly sensitive to these pressures given the high potential for
outsourcing technical and scientific work and the globalization of this field’s labor force.
References
Agrawal, Ajay, Christian Catalini, and Avi Goldfarb, “Friends, Family, and the Flat World: The Geography of
Crowdfunding”, NBER Working Paper 16820 (2012).
Agrawal, Ajay, Iain Cockburn, and John McHale, “Gone But Not Forgotten: Knowledge Flows, Labor
Mobility, and Enduring Social Relationships”, Journal of Economic Geography 6:5 (2006), 571-591.
Agrawal, Ajay, Devesh Kapur, John McHale, and Alexander Oettl, “Brain Drain or Brain Bank? The Impact of
Skilled Emigration on Poor-Country Innovation”, Journal of Urban Economics 69 (2011), 43-55.
Agrawal, Ajay, Nicola Lacetera, and Elizabeth Lyons, “How Do Online Platforms Flatten Markets for
Contract Labor?”, Working Paper (2012).
Altonji, Joseph, and Rebecca Blank, “Race and Gender in the Labor Market”, in Ashenfelter, Orley, and David
Card (eds.) Handbook of Labor Economics Volume 3c (Amsterdam: Elsevier, 1999), 3143-3259.
Amiti, Mary, and Shang-Jin Wei, “Offshoring of Services and Productivity: Evidence from the US”, The
World Economy 32:2 (2009), 203-220.
Arora, Ashish, and Alfonso Gambardella, From Underdogs to Tigers? The Rise and Growth of the Software
Industry in Brazil, China, India, Ireland, and Israel, (Oxford, UK: Oxford University Press, 2005).
Aubet, Maria, The Phoenicians and the West: Politics, Colonies, and Trade (Cambridge, UK: Cambridge
University Press, 2001).
Autor, David, “Wiring the Labor Market”, Journal of Economic Perspectives 15:1 (2001), 25-40.
Banerjee, Abhijit, and Esther Duflo, “Reputation Effects and the Limits of Contracting: A Study of the Indian
Software Industry”, Quarterly Journal of Economics 115:3 (2000), 989-1017.
Blinder, Alan, and Alan Krueger, “Alternative Measures of Offshorability: A Survey Approach”, Working Paper (2009).

27
Bhattacharya, Utpal, and Peter Groznik, “Melting Pot or Salad Bowl: Some Evidence from U.S. Investments
Abroad”, Journal of Financial Markets 11:3 (2008), 228-258.
Buch, Claudia, Jörn Kleinert, and Farid Toubal, “Where Enterprises Lead, People Follow? Links Between
Migration and German FDI”, European Economic Review 50:8 (2006), 2017-2036.
Cachon, Gérard, and Patrick Harker, “Competition and Outsourcing with Scale Economies”, Management
Science 48 (2002), 1314-1333.
Choudhury, Prithwiraj, “Internal Labor Markets and Knowledge Creation in Multinationals”, Working Paper
(2010).
Clemens, Michael, “Economics and Emigration: Trillion-Dollar Bills on the Sidewalk?”, Journal of Economic
Perspectives 25:3 (2011), 83-106.
Docquier, Frédéric, and Elisabetta Lodigiani, “Skilled Migration and Business Networks”, Open Economies
Review 21:4 (2010), 565-588.
Docquier, Frédéric, and Hillel Rapoport, “The Economics of the Brain Drain”, Journal of Economic Literature,
forthcoming (2011).
Ebenstein, Avraham, Ann Harrison, Margaret McMillan, and Shannon Phillips, “Estimating the Impact of
Trade and Offshoring on American Workers Using the Current Population Surveys”, NBER Working
Paper 15107 (2009).
Feenstra, Robert, and Gordon Hanson, “Ownership and Control in Outsourcing to China: Estimating the
Property Rights Theory of the Firm”, Quarterly Journal of Economics 120:2 (2005), 729-762.
Fisman, Raymond, Daniel Paravisini, and Vikrant Vig, “Cultural Proximity and Loan Outcomes”, Working
Paper (2012).
Foley, Fritz, and William Kerr, “Ethnic Innovation and U.S. Multinational Firm Activity”, Management
Science 59:7 (2013), 1529-1544.
Forman, Chris, Anindya Ghose, and Avi Goldfarb, “Competition Between Local and Electronic Markets: How
the Benefit of Buying Online Depends on Where You Live”, Management Science 55:1 (2009), 47-
57.
Freedman, Seth, and Ginger Zhe Jin, “Do Social Networks Solve Information Problems for Peer-to-Peer
Lending? Evidence from Prosper.com”, Working Paper (2008).
Freeman, Richard, “People Flows in Globalization”, Journal of Economic Perspectives 20:2 (2006), 145-170.
Ghani, Ejaz (ed.) The Services Revolution (Oxford, UK: Oxford University Press, 2010).
Gibson, John, and David McKenzie, “Eight Questions about Brain Drain”, Journal of Economic Perspectives
25:3 (2011), 107-128.
Giuliano, Laura, David Levine, and Jonathan Leonard, “Manager Race and the Race of New Hires”, Journal of
Labor Economics 27:4 (2009), 589-631.
Gould, David, “Immigrant Links to the Home Country: Empirical Implications for U.S. Bilateral Trade
Flows”, Review of Economics and Statistics 76 (1994), 302-316.
Harrison, Ann, and Margaret McMillan, “Offshoring Jobs? Multinationals and U.S. Manufacturing
Employment,” Review of Economics and Statistics 93:3 (2011), 857-875.
Hatzigeorgiou, Andreas, and Magnus Lodefalk, “Trade and Migration: Firm-Level Evidence”, Working Paper
(2011).
Head, Keith, and John Ries, “Immigration and Trade Creation: Econometric Evidence from Canada”,
Canadian Journal of Economics 31:1 (1998), 47-62.
Hernandez, Exequiel, “Immigrant Social Capital and Firm Strategic Heterogeneity: Effects on Foreign Entry
and Firm Performance”, Working Paper (2011).
Horton, John, “Online Labor Markets”, Working Paper (2010).
Hovhannisyan, Nune, and Wolfgang Keller, “International Business Travel: An Engine of Innovation?”,
Working Paper (2010).

28
Huang, Yasheng, Li Jin, and Yi Qian, “Does Ethnicity Pay? Evidence from Overseas Chinese FDI in China”,
Review of Economics and Statistics, forthcoming (2011).
Iriyama, Akie, Yong Li, and Ravi Madhavan, “Spiky Globalization of Venture Capital Investments: The
Influence of Prior Human Networks”, Strategic Entrepreneurship Journal 4 (2010), 128-145.
Javorcik, Beata, Çağlar Özden, Mariana Spatareanu, and Cristina Neagu, “Migrant Networks and Foreign
Direct Investment”, Journal of Development Economics 94:2 (2011), 231-241.
Kapur, Devesh, “Diasporas and Technology Transfer”, Journal of Human Development 2:2 (2001), 265-286.
Kapur, Devesh, and John McHale, “Sojourns and Software: Internationally Mobile Human Capital and High
Tech Industry Development in India, Ireland and Israel”, in Arora, Ashish, and Alfonso Gambardella
(eds.) Underdogs to Tigers: The Rise and Growth of the Software Industry in Some Emerging
Economies, (Oxford, UK: Oxford University Press, 2005a).
Kapur, Devesh, and John McHale, Give Us Your Best and Brightest: The Global Hunt for Talent and the
Developing World (Washington, DC: Center for Global Development/Brookings Institution Press,
2005b).
Keller, Wolfgang, “International Technology Diffusion”, Journal of Economic Literature 42:3 (2004), 752-
782.
Kerr, William, “The Ethnic Composition of US Inventors”, HBS Working Paper 08-006 (2007).
Kerr, William, “Ethnic Scientific Communities and International Technology Diffusion”, Review of
Economics and Statistics 90:3 (2008), 518-537.
Kerr, William, “Heterogeneous Technology Diffusion and Ricardian Trade Patterns”, Working Paper (2009).
Kerr, William, and Alexis Brownell, “EverTrue: Mobile Technology Development (A)”, HBS Case 813-122
(2013).
Kerr, William, and William Lincoln, “The Supply Side of Innovation: H-1B Visa Reforms and U.S. Ethnic
Invention”, Journal of Labor Economics 28:3 (2010), 473-508.
Khanna, Tarun, Billions of Entrepreneurs: How China and India Are Reshaping Their Futures—and Yours
(Boston, MA: Harvard University Press, 2008).
Kugler, Maurice, and Hillel Rapoport, “International Labor and Capital Flows: Complements or Substitutes?”,
Economics Letters 92:2 (2007), 155-162.
Kugler, Maurice, and Hillel Rapoport, “Migration, FDI and the Margins of Trade”, Working Paper (2011).
Kuznetsov, Yevgeny, “Why is Diaspora Potential so Elusive? Towards a New Generation of Initiatives to
Leverage Countries’ Talent Abroad”, Working Paper (2009).
Liu, Runjuan, and Daniel Trefler, “Much Ado About Nothing: American Jobs and the Rise of Service
Outsourcing to China and India”, NBER Working Paper 14061 (2008).
Liu, Runjuan, and Daniel Trefler, “A Sorted Tale of Globalization: White Collar Jobs and the Rise of Service
Offshoring”, NBER Working Paper 17559 (2011).
MacGarvie, Megan, “Foreign Students and the Diffusion of Scientific and Technological Knowledge to and
from American Universities”, Working Paper (2006).
Marx, Matt, and Jasjit Singh, “Geographic Constraints on Knowledge Spillovers: Political Borders vs. Spatial
Proximity”, Management Science (2012), forthcoming.
Mill, Roy, “Hiring and Learning in Online Global Labor Markets”, Working Paper (2013).
Mithas, Sunil, and Henry Lucas, “Are Foreign IT Workers Cheaper? U.S. Visa Policies and Compensation of
Information Technology Professionals”, Management Science 56 (2010), 745-765.
Montgomery, James, “Social Networks and Labor-Market Outcomes: Towards and Economic Analysis”,
American Economic Review 81:5 (1991), 1408-1418.
Nachum, Lilach, “But How Does Distance Affect FDI? And Why Does It Matter?”, Working Paper (2011).
Nanda, Ramana, and Tarun Khanna, “Diasporas and Domestic Entrepreneurs: Evidence from the Indian
Software Industry”, Journal of Economics and Management Strategy 19:4 (2010), 991-1012.

29
Novak, Sharon, and Scott Stern, “How Does Outsourcing Affect Performance Dynamics? Evidence from the
Automobile Industry”, Management Science 54 (2008), 1963-1979.
Obukhova, Elena, “Does Brain Circulation Promote International Development? High-Skilled Migration and
Organizational Performance”, MIT Working Paper (2009).
Oettl, Alexander, and Ajay Agrawal, “International Labor Mobility and Knowledge Flow Externalities”,
Journal of International Business Studies 39:8 (2008), 1242-1260.
Ottaviano, Gianmarco, Giovanni Peri, and Greg Wright, “Immigration, Offshoring, and American Jobs”,
NBER Working Paper 16439 (2010).
Pallais, Amanda, “Inefficient Hiring in Entry-Level Labor Markets”, Working Paper (2011).
Puga, Diego, and Daniel Trefler, “Wake Up and Smell the Ginseng: The Rise of Incremental Innovation in
Low-Wage Countries”, Journal of Development Economics 91:1 (2010), 64-76.
Rangan, Subramanian, and Aldemir Drummond, “The Problem of Control and the Role of Home--Host Ties in
Explaining Multinationals' Foreign Operations, Competitiveness, and Performance”, Global Strategy
Journal 1 (2011), 362-376.
Rangan, Subramanian, and Metin Sengul, “The Influence of Macro Structure on the Foreign Market
Performance of Transnational Firms: The Value of IGO Connections, Export Dependence, and
Immigration Links”, Administrative Science Quarterly 54 (2009), 229-267.
Ratha, Dilip, and William Shaw, “South-South Migration and Remittances”, World Bank Working Paper 102
(2007).
Rauch, James, “Networks Versus Markets in International Trade”, Journal of International Economics 48:1
(1999), 7-35.
Rauch, James, “Business and Social Networks in International Trade”, Journal of Economic Literature 39:4
(2001), 1177-1203.
Rauch, James, and Vitor Trindade, “Ethnic Chinese Networks in International Trade”, Review of Economics
and Statistics 84:1 (2002), 116-130.
Saxenian, AnnaLee, Silicon Valley's New Immigrant Entrepreneurs (San Francisco, CA: Public Policy
Institute of California, 1999).
Saxenian, AnnaLee, The New Argonauts (Cambridge, MA: Harvard University Press, 2006).
Saxenian, AnnaLee, with Yasuyuki Motoyama and Xiaohong Quan, Local and Global Networks of Immigrant
Professionals in Silicon Valley (San Francisco, CA: Public Policy Institute of California, 2002).
Singh, Jasjit, “Collaborative Networks as Determinants of Knowledge Diffusion Patterns”, Management
Science 51:5 (2005), 756-770.
Stanton, Christopher, and Catherine Thomas, “Landing the First Job: The Value of Intermediaries in Online
Hiring”, Working Paper (2011).
Tambe, Prasanna, and Lorin Hitt, “Now IT's Personal: Offshoring and the Shifting Skill Composition of the
U.S. Information Technology Workforce”, Management Science 58 (2012), 678-695.
Tervio, Marko, “Superstars and Mediocrities: Market Failure in the Discovery of Talent”, Review of Economic
Studies 76:2 (2009), 829-850.
Wang, Eric, Terry Barron, and Abraham Seidmann, “Contracting Structures for Custom Software
Development: The Impacts of Informational Rents and Uncertainty on Internal Development and
Outsourcing”, Management Science 43 (1997), 1726-1744.

Figure 1: Example of a worker profile in oDesk

(1) (2) (3) (4) (5) (6) (7) (8) (9)
1 United States 31,261 28,233 0.285 0.329 0.039 0.046 10.28
2 Australia 4,162 3,793 0.287 0.293 0.033 0.029 10.04
3 United Kingdom 3,583 3,304 0.280 0.290 0.065 0.079 9.75
4 Canada 2,921 2,632 0.285 0.294 0.065 0.082 9.87
5 UAE 989 884 0.545 0.546 0.906 0.941 11.71
6 Netherlands 384 345 0.297 0.299 0.026 0.013 9.68
7 Germany 360 333 0.227 0.230 0.020 0.024 10.35
8 France 310 289 0.264 0.270 0.017 0.018 10.23
9 Ireland 305 290 0.300 0.301 0.029 0.059 11.41
10 Spain 269 235 0.237 0.243 0.010 0.019 11.93
11 Italy 232 213 0.375 0.387 0.010 0.011 11.25
12 Sweden 219 193 0.270 0.275 0.026 0.014 12.03
13 Israel 216 193 0.229 0.233 0.035 0.079 8.90
14 Belgium 170 158 0.276 0.278 0.023 0.038 10.33
15 Switzerland 170 156 0.184 0.184 0.008 0.024 10.41
16 New Zealand 165 149 0.198 0.198 0.038 0.012 7.17
17 Singapore 159 137 0.212 0.215 0.068 0.038 7.43
18 Denmark 149 130 0.246 0.247 0.004 0.017 9.70
19 Norway 135 123 0.325 0.325 0.010 0.000 10.00
20 Hong Kong 125 110 0.282 0.286 0.014 0.000 9.43
Notes: Table describes the country distribution and traits of companies hiring workers in India. Outsourcing spells group repeated, sequential contracts
between the same company and worker. Ethnicities are estimated through individuals' names using techniques described in the text.
Table 1: Country distribution of companies hiring workers in India
N Country
Number of
contracts
with worker
in India
India's share of
total contracts
originating
from country
India's share of
total cross-
border contracts
originating
from country
Share of
company
contacts with
Indian ethnic
name
Share of
company
contacts hiring
in India with
Indian ethnic
name
Average wage
in US dollars
paid on
contracts with
worker in India
Number of
distinct
outsourcing
spells with
worker in
India
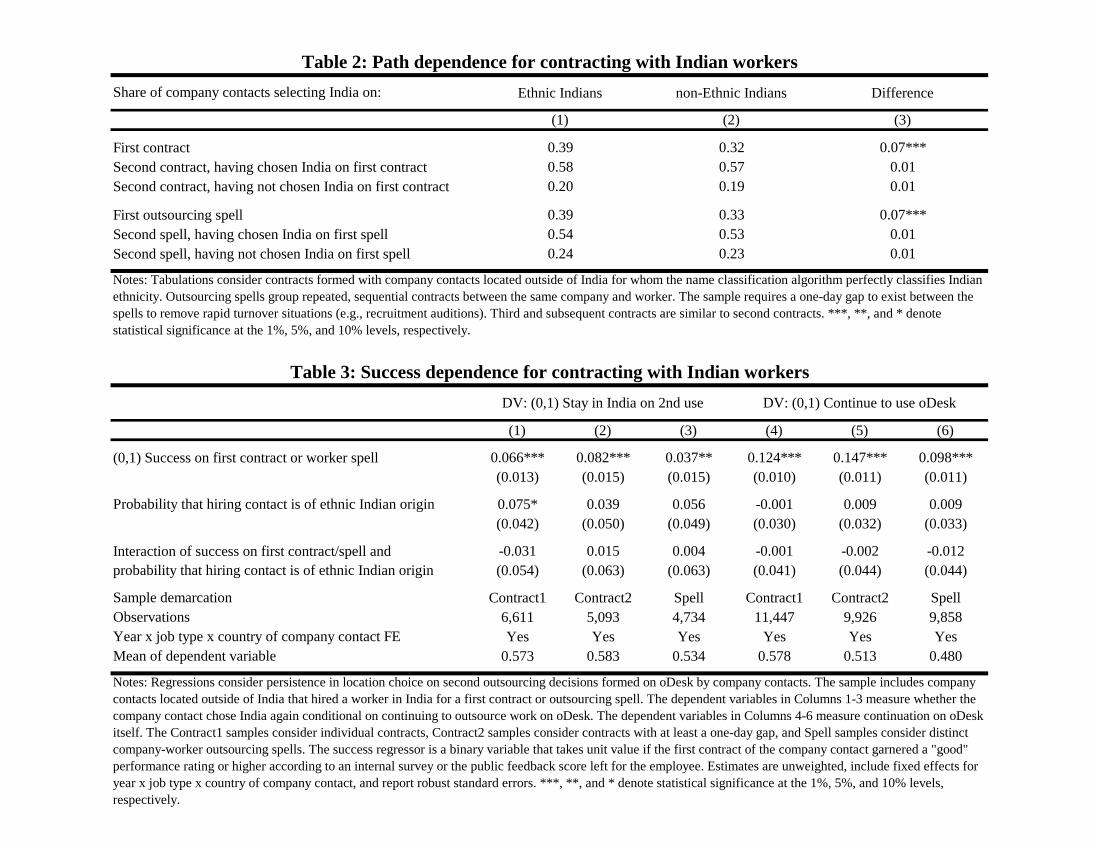
Share of company contacts selecting India on:
First contract
Second contract, having chosen India on first contract
Second contract, having not chosen India on first contract
First outsourcing spell
Second spell, having chosen India on first spell
Second spell, having not chosen India on first spell
(1) (2) (3) (4) (5) (6)
(0,1) Success on first contract or worker spell 0.066*** 0.082*** 0.037** 0.124*** 0.147*** 0.098***
(0.013) (0.015) (0.015) (0.010) (0.011) (0.011)
Probability that hiring contact is of ethnic Indian origin 0.075* 0.039 0.056 -0.001 0.009 0.009
(0.042) (0.050) (0.049) (0.030) (0.032) (0.033)
Interaction of success on first contract/spell and -0.031 0.015 0.004 -0.001 -0.002 -0.012
probability that hiring contact is of ethnic Indian origin (0.054) (0.063) (0.063) (0.041) (0.044) (0.044)
Sample demarcation Contract1 Contract2 Spell Contract1 Contract2 Spell
Observations 6,611 5,093 4,734 11,447 9,926 9,858
Year x job type x country of company contact FE Yes Yes Yes Yes Yes Yes
Mean of dependent variable 0.573 0.583 0.534 0.578 0.513 0.480
0.01
0.07***
0.01
0.01
0.20
0.39
0.54
0.24
0.33
0.53
0.23
0.19
Notes: Regressions consider persistence in location choice on second outsourcing decisions formed on oDesk by company contacts. The sample includes company
contacts located outside of India that hired a worker in India for a first contract or outsourcing spell. The dependent variables in Columns 1-3 measure whether the
company contact chose India again conditional on continuing to outsource work on oDesk. The dependent variables in Columns 4-6 measure continuation on oDesk
itself. The Contract1 samples consider individual contracts, Contract2 samples consider contracts with at least a one-day gap, and Spell samples consider distinct
company-worker outsourcing spells. The success regressor is a binary variable that takes unit value if the first contract of the company contact garnered a "good"
performance rating or higher according to an internal survey or the public feedback score left for the employee. Estimates are unweighted, include fixed effects for
year x job type x country of company contact, and report robust standard errors. ***, **, and * denote statistical significance at the 1%, 5%, and 10% levels,
respectively.
Table 3: Success dependence for contracting with Indian workers
DV: (0,1) Stay in India on 2nd use DV: (0,1) Continue to use oDesk
Notes: Tabulations consider contracts formed with company contacts located outside of India for whom the name classification algorithm perfectly classifies Indian
ethnicity. Outsourcing spells group repeated, sequential contracts between the same company and worker. The sample requires a one-day gap to exist between the
spells to remove rapid turnover situations (e.g., recruitment auditions). Third and subsequent contracts are similar to second contracts. ***, **, and * denote
statistical significance at the 1%, 5%, and 10% levels, respectively.
Table 2: Path dependence for contracting with Indian workers
Ethnic Indians
(1)
0.39
0.58
Difference
(3)
0.07***
0.01
non-Ethnic Indians
0.32
0.57
(2)
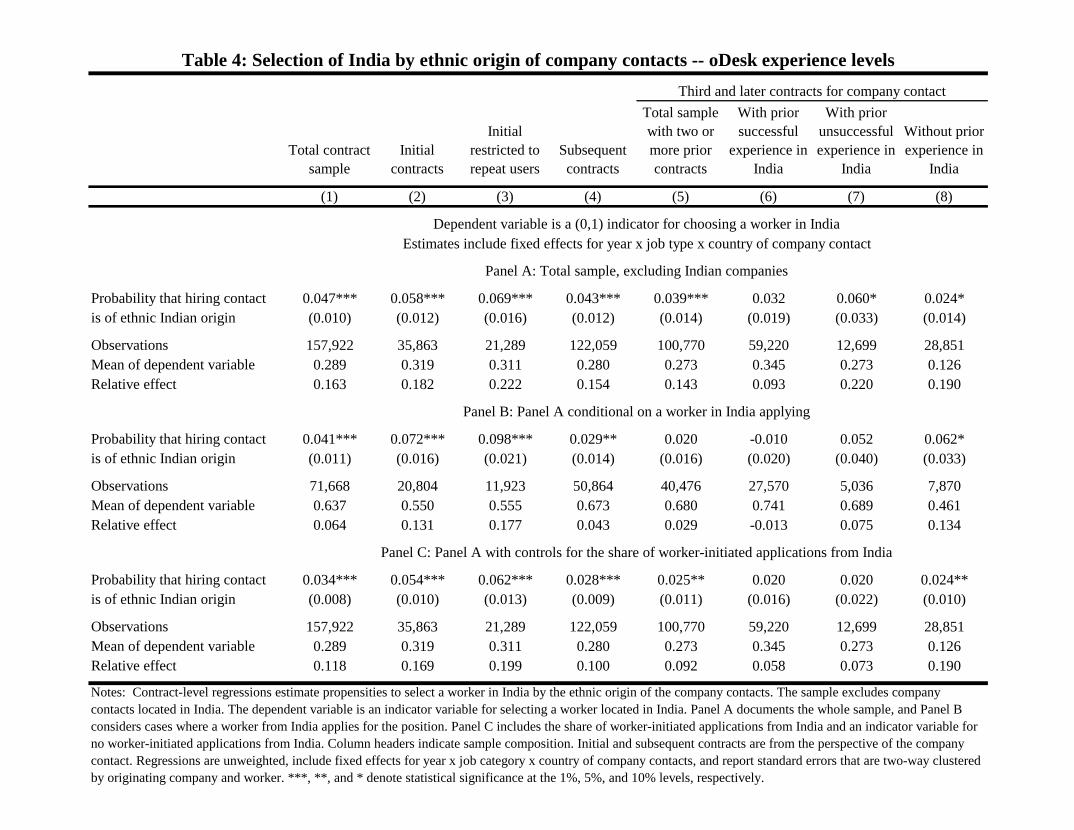
Total contract
sample
Initial
contracts
Initial
restricted to
repeat users
Subsequent
contracts
Total sample
with two or
more prior
contracts
With prior
successful
experience in
India
With prior
unsuccessful
experience in
India
Without prior
experience in
India
(1) (2) (3) (4) (5) (6) (7) (8)
Probability that hiring contact 0.047*** 0.058*** 0.069*** 0.043*** 0.039*** 0.032 0.060* 0.024*
is of ethnic Indian origin (0.010) (0.012) (0.016) (0.012) (0.014) (0.019) (0.033) (0.014)
Observations 157,922 35,863 21,289 122,059 100,770 59,220 12,699 28,851
Mean of dependent variable 0.289 0.319 0.311 0.280 0.273 0.345 0.273 0.126
Relative effect 0.163 0.182 0.222 0.154 0.143 0.093 0.220 0.190
Probability that hiring contact 0.041*** 0.072*** 0.098*** 0.029** 0.020 -0.010 0.052 0.062*
is of ethnic Indian origin (0.011) (0.016) (0.021) (0.014) (0.016) (0.020) (0.040) (0.033)
Observations 71,668 20,804 11,923 50,864 40,476 27,570 5,036 7,870
Mean of dependent variable 0.637 0.550 0.555 0.673 0.680 0.741 0.689 0.461
Relative effect 0.064 0.131 0.177 0.043 0.029 -0.013 0.075 0.134
Probability that hiring contact 0.034*** 0.054*** 0.062*** 0.028*** 0.025** 0.020 0.020 0.024**
is of ethnic Indian origin (0.008) (0.010) (0.013) (0.009) (0.011) (0.016) (0.022) (0.010)
Observations 157,922 35,863 21,289 122,059 100,770 59,220 12,699 28,851
Mean of dependent variable 0.289 0.319 0.311 0.280 0.273 0.345 0.273 0.126
Relative effect 0.118 0.169 0.199 0.100 0.092 0.058 0.073 0.190
Table 4: Selection of India by ethnic origin of company contacts -- oDesk experience levels
Third and later contracts for company contact
Notes: Contract-level regressions estimate propensities to select a worker in India by the ethnic origin of the company contacts. The sample excludes company
contacts located in India. The dependent variable is an indicator variable for selecting a worker located in India. Panel A documents the whole sample, and Panel B
considers cases where a worker from India applies for the position. Panel C includes the share of worker-initiated applications from India and an indicator variable for
no worker-initiated applications from India. Column headers indicate sample composition. Initial and subsequent contracts are from the perspective of the company
contact. Regressions are unweighted, include fixed effects for year x job category x country of company contacts, and report standard errors that are two-way clustered
by originating company and worker. ***, **, and * denote statistical significance at the 1%, 5%, and 10% levels, respectively.
Dependent variable is a (0,1) indicator for choosing a worker in India
Estimates include fixed effects for year x job type x country of company contact
Panel A: Total sample, excluding Indian companies
Panel C: Panel A with controls for the share of worker-initiated applications from India
Panel B: Panel A conditional on a worker in India applying

Initial
contract
sample
2008 and
prior
2009 and
later
High-end
contracts
Low-end
contracts
Excluding
employer
searches
Only
employer
searches
(1) (2) (3) (4) (5) (6) (7) (8) (9)
Probability that hiring contact 0.058*** 0.033 0.069*** 0.038** 0.087*** 0.023 0.124*** 0.046*** 0.042***
is of ethnic Indian origin (0.012) (0.024) (0.014) (0.017) (0.018) (0.015) (0.021) (0.010) (0.010)
Observations 35,863 10,888 24,975 19,768 16,095 23,979 11,884 156,507 138,315
Mean of dependent variable 0.319 0.402 0.283 0.442 0.168 0.328 0.301 0.287 0.234
Relative effect 0.182 0.082 0.244 0.086 0.518 0.070 0.412 0.160 0.179
Probability that hiring contact 0.072*** 0.039 0.086*** 0.043** 0.126*** 0.045** 0.110*** 0.038*** 0.068***
is of ethnic Indian origin (0.016) (0.028) (0.019) (0.019) (0.027) (0.019) (0.026) (0.011) (0.015)
Observations 20,804 6,293 14,511 13,157 7,647 15,452 5,352 70,821 58,302
Mean of dependent variable 0.550 0.695 0.487 0.665 0.353 0.509 0.668 0.633 0.555
Relative effect 0.131 0.056 0.177 0.065 0.357 0.088 0.165 0.060 0.123
Probability that hiring contact 0.054*** 0.043** 0.059*** 0.041*** 0.067*** 0.015 0.119*** 0.032*** 0.024***
is of ethnic Indian origin (0.010) (0.019) (0.012) (0.014) (0.014) (0.010) (0.021) (0.008) (0.007)
Observations 35,863 10,888 24,975 19,768 16,095 23,979 11,884 156,507 138,315
Mean of dependent variable 0.319 0.402 0.283 0.442 0.168 0.328 0.301 0.287 0.234
Relative effect 0.169 0.107 0.208 0.093 0.399 0.046 0.395 0.111 0.103
Panel A: Total sample, excluding Indian companies
Panel C: Panel A with controls for the share of worker-initiated applications from India
Notes: See Table 4.
Estimates include fixed effects for year x job type x country of company contact
Panel B: Panel A conditional on a worker in India applying
Table 5: Selection of India by ethnic origin of company contacts -- base traits of initial contracts
Sample of initial hourly contracts made by company contacts Total sample
dropping
UAE outlier
firm
Sample of
fixed-price
contracts
Dependent variable is a (0,1) indicator for choosing a worker in India
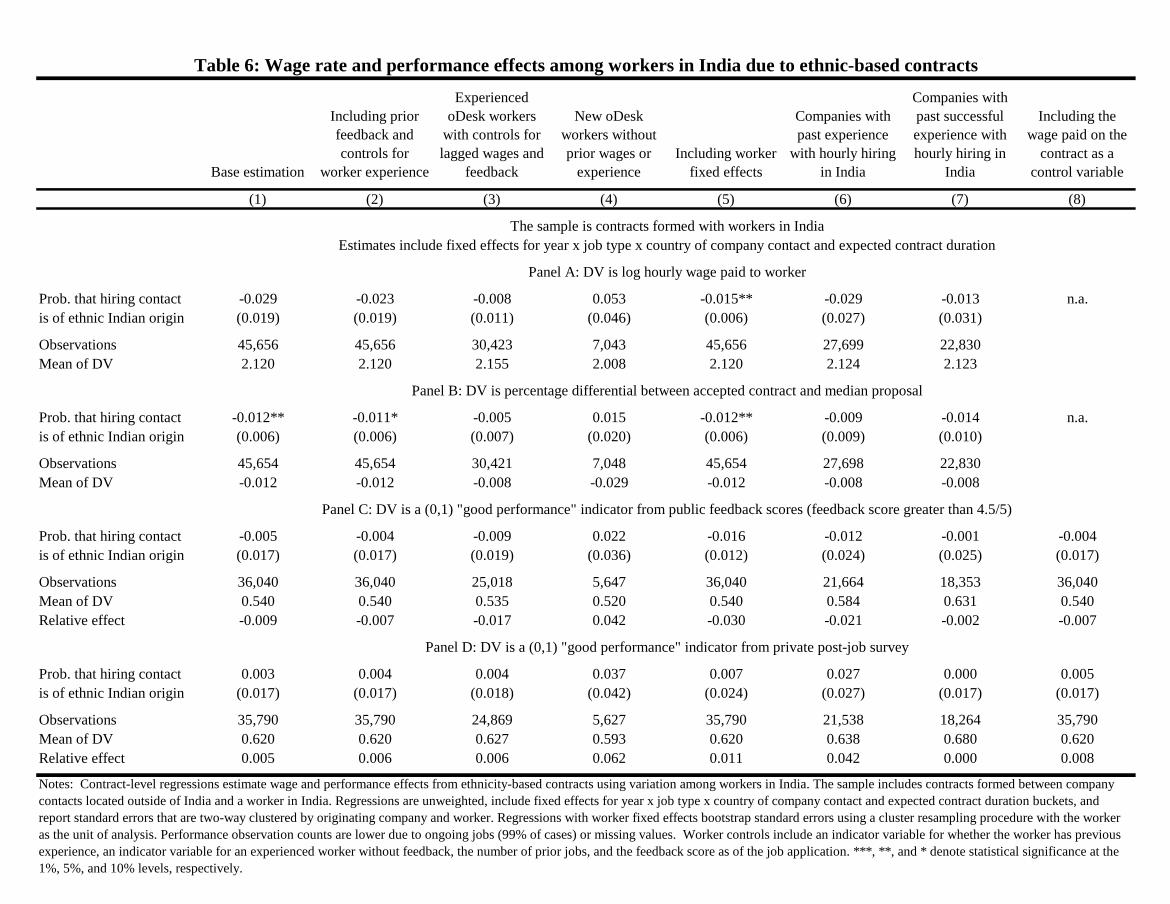
Base estimation
Including prior
feedback and
controls for
worker experience
Experienced
oDesk workers
with controls for
lagged wages and
feedback
New oDesk
workers without
prior wages or
experience
Including worker
fixed effects
Companies with
past experience
with hourly hiring
in India
Companies with
past successful
experience with
hourly hiring in
India
Including the
wage paid on the
contract as a
control variable
(1) (2) (3) (4) (5) (6) (7) (8)
Prob. that hiring contact -0.029 -0.023 -0.008 0.053 -0.015** -0.029 -0.013 n.a.
is of ethnic Indian origin (0.019) (0.019) (0.011) (0.046) (0.006) (0.027) (0.031)
Observations 45,656 45,656 30,423 7,043 45,656 27,699 22,830
Mean of DV 2.120 2.120 2.155 2.008 2.120 2.124 2.123
Prob. that hiring contact -0.012** -0.011* -0.005 0.015 -0.012** -0.009 -0.014 n.a.
is of ethnic Indian origin (0.006) (0.006) (0.007) (0.020) (0.006) (0.009) (0.010)
Observations 45,654 45,654 30,421 7,048 45,654 27,698 22,830
Mean of DV -0.012 -0.012 -0.008 -0.029 -0.012 -0.008 -0.008
Prob. that hiring contact -0.005 -0.004 -0.009 0.022 -0.016 -0.012 -0.001 -0.004
is of ethnic Indian origin (0.017) (0.017) (0.019) (0.036) (0.012) (0.024) (0.025) (0.017)
Observations 36,040 36,040 25,018 5,647 36,040 21,664 18,353 36,040
Mean of DV 0.540 0.540 0.535 0.520 0.540 0.584 0.631 0.540
Relative effect -0.009 -0.007 -0.017 0.042 -0.030 -0.021 -0.002 -0.007
Prob. that hiring contact 0.003 0.004 0.004 0.037 0.007 0.027 0.000 0.005
is of ethnic Indian origin (0.017) (0.017) (0.018) (0.042) (0.024) (0.027) (0.017) (0.017)
Observations 35,790 35,790 24,869 5,627 35,790 21,538 18,264 35,790
Mean of DV 0.620 0.620 0.627 0.593 0.620 0.638 0.680 0.620
Relative effect 0.005 0.006 0.006 0.062 0.011 0.042 0.000 0.008
Panel C: DV is a (0,1) "good performance" indicator from public feedback scores (feedback score greater than 4.5/5)
Notes: Contract-level regressions estimate wage and performance effects from ethnicity-based contracts using variation among workers in India. The sample includes contracts formed between company
contacts located outside of India and a worker in India. Regressions are unweighted, include fixed effects for year x job type x country of company contact and expected contract duration buckets, and
report standard errors that are two-way clustered by originating company and worker. Regressions with worker fixed effects bootstrap standard errors using a cluster resampling procedure with the worker
as the unit of analysis. Performance observation counts are lower due to ongoing jobs (99% of cases) or missing values. Worker controls include an indicator variable for whether the worker has previous
experience, an indicator variable for an experienced worker without feedback, the number of prior jobs, and the feedback score as of the job application. ***, **, and * denote statistical significance at the
1%, 5%, and 10% levels, respectively.
Table 6: Wage rate and performance effects among workers in India due to ethnic-based contracts
The sample is contracts formed with workers in India
Estimates include fixed effects for year x job type x country of company contact and expected contract duration
Panel B: DV is percentage differential between accepted contract and median proposal
Panel A: DV is log hourly wage paid to worker
Panel D: DV is a (0,1) "good performance" indicator from private post-job survey

Total contract
sample
Initial
contracts
Initial
restricted to
repeat users
Subsequent
contracts
Not utilizing
search
functionality
Utilizing
search
functionality
Total contract
sample
Initial
contracts
Initial
restricted to
repeat users
Subsequent
contracts
Not utilizing
search
functionality
Utilizing
search
functionality
(1) (2) (3) (4) (5) (6) (7) (8) (9) (10) (11) (12)
Probability that hiring contact 0.036*** 0.052*** 0.061*** 0.030*** 0.027*** 0.043*** 0.012* 0.006 0.009 0.013* -0.001 0.025***
is of ethnic Indian origin (0.008) (0.010) (0.013) (0.010) (0.010) (0.010) (0.006) (0.011) (0.014) (0.007) (0.008) (0.009)
Observations 157,922 35,863 21,289 122,059 77,502 80,420 157,922 35,863 21,289 122,059 77,502 80,420
Mean of dependent variable 0.132 0.132 0.131 0.132 0.113 0.150 0.157 0.187 0.180 0.148 0.161 0.154
Relative effect 0.273 0.394 0.466 0.227 0.239 0.287 0.076 0.032 0.050 0.088 0.000 0.162
Probability that hiring contact 0.049*** 0.077*** 0.097*** 0.037** 0.049*** 0.040** -0.008 -0.005 0.001 -0.008 -0.008 -0.005
is of ethnic Indian origin (0.012) (0.015) (0.020) (0.015) (0.016) (0.016) (0.011) (0.016) (0.021) (0.014) (0.014) (0.015)
Observations 71,668 20,804 11,923 50,864 37,440 34,228 71,668 20,804 11,923 50,864 37,440 34,228
Mean of dependent variable 0.291 0.228 0.233 0.316 0.234 0.352 0.346 0.323 0.321 0.356 0.333 0.361
Relative effect 0.168 0.338 0.416 0.117 0.209 0.114 0.000 0.000 0.003 0.000 0.000 0.000
Probability that hiring contact 0.030*** 0.050*** 0.057*** 0.024*** 0.020*** 0.038*** 0.004 0.004 0.005 0.004 -0.010 0.020**
is of ethnic Indian origin (0.007) (0.009) (0.013) (0.008) (0.008) (0.010) (0.006) (0.010) (0.013) (0.007) (0.007) (0.009)
Observations 157,922 35,863 21,289 122,059 77,502 80,420 157,922 35,863 21,289 122,059 77,502 80,420
Mean of dependent variable 0.132 0.132 0.131 0.132 0.113 0.150 0.157 0.187 0.180 0.148 0.161 0.154
Relative effect 0.227 0.379 0.435 0.182 0.177 0.253 0.025 0.021 0.028 0.027 -0.062 0.130
Table 7: Selection of India by ethnic origin of company contacts -- worker experience levels
DV: (0,1) indicator for choosing a worker in India with more than 5 prior jobs
Panel C: Panel A with controls for the share of worker-initiated applications from India
Notes: See Table 4.
DV: (0,1) indicator for choosing a worker in India with five or fewer prior jobs
Estimates include fixed effects for year x job type x country of company contact
Panel A: Total sample, excluding Indian companies
Panel B: Panel A conditional on a worker in India applying

DV is log hourly
wage paid to
worker
DV is percentage
differential between
accepted contract
and median
proposal
DV is a (0,1) "good
performance"
indicator from
public feedback
scores
DV is a (0,1) "good
performance"
indicator from
public feedback
scores
DV is a (0,1) "good
performance"
indicator from
private post-job
survey
DV is a (0,1) "good
performance"
indicator from
private post-job
survey
DV is indicator
variable for worker
being hired again
on oDesk
DV is log wage
of worker's
NEXT oDesk
contract
(1) (2) (3) (4) (5) (6) (7) (8)
Baseline worker traits:
(0,1) indicator that worker is in India -0.147*** -0.078*** -0.022*** -0.017** -0.015** -0.008 -0.011*** -0.162***
(0.014) (0.006) (0.008) (0.007) (0.007) (0.007) (0.004) (0.015)
(0,1) worker has completed <= 5 jobs -0.284*** -0.039*** -0.014*** -0.004 -0.024*** -0.010** -0.218*** -0.262***
(0.012) (0.003) (0.005) (0.005) (0.004) (0.004) (0.003) (0.011)
(0,1) indicator that worker is in India 0.109*** 0.012** 0.005 0.002 0.007 0.002 0.059*** 0.110***
x (0,1) worker has completed <= 5 jobs (0.014) (0.005) (0.008) (0.008) (0.008) (0.008) (0.006) (0.014)
Ethnic Indian interactions with worker traits:
Prob. that hiring contact is of ethnic Indian origin -0.045 -0.017** -0.020 -0.018 -0.011 -0.009 0.006 -0.017
(0.035) (0.007) (0.015) (0.015) (0.014) (0.013) (0.010) (0.028)
Prob. that hiring contact is of ethnic Indian origin -0.009 0.005 0.026 0.027 0.029 0.029 0.016 -0.036
x (0,1) indicator that worker is in India (0.026) (0.010) (0.022) (0.022) (0.022) (0.022) (0.012) (0.028)
Prob. that hiring contact is of ethnic Indian origin 0.058 0.000 -0.019 -0.021 0.006 0.004 0.010 -0.002
x (0,1) worker has completed <=5 jobs (0.086) (0.009) (0.019) (0.019) (0.018) (0.017) (0.012) (0.060)
Prob. that hiring contact is of ethnic Indian origin -0.039 0.012 0.011 0.012 -0.019 -0.017 -0.074** 0.053
x (0,1) indicator that worker is in India (0.075) (0.014) (0.029) (0.030) (0.028) (0.028) (0.037) (0.043)
x (0,1) worker has completed <=5 jobs
Additional control for log wage on contract No No No Yes No Yes No No
Observations 157,812 157,809 121,835 121,835 121,131 121,131 157,812 121,509
Mean of dependent variable 1.928 0.0117 0.578 0.578 0.646 0.646 0.770 1.987
Notes: Contract-level regressions estimate wage and performance effects with interactions for worker experience, company contact ethnicity, and whether a worker is in India. The sample includes all contracts formed on oDesk where the company
contact is located outside of India. Regressions are unweighted, include fixed effects for year x job type x country of company contact and expected project duration, and report standard errors that are two-way clustered by originating company and
worker. Additional controls include an indicator variable for whether the worker has previous experience, an indicator variable for an experienced worker without feedback, the number of prior jobs, and the feedback score as of the job application.
***, **, and * denote statistical significance at the 1%, 5%, and 10% levels, respectively.
Table 8: Tests of information, performance, and wage differences by workers' experience levels
The sample is all contracts where the company contact is located outside of India
Estimates include fixed effects for year x job type x country of company contact
Estimates also include fixed effects for expected project duration and controls for the share of worker-initiated applicants from India

DV is log hourly
wage paid to
worker
DV is percentage
differential between
accepted contract
and median
proposal
DV is a (0,1) "good
performance"
indicator from
public feedback
scores
DV is a (0,1) "good
performance"
indicator from
public feedback
scores
DV is a (0,1) "good
performance"
indicator from
private post-job
survey
DV is a (0,1) "good
performance"
indicator from
private post-job
survey
DV is indicator
variable for worker
being hired again
on oDesk
DV is log wage
of worker's
NEXT oDesk
contract
(1) (2) (3) (4) (5) (6) (7) (8)
Baseline worker traits:
(0,1) indicator that worker is in India -0.099*** -0.063*** -0.043*** -0.037*** -0.018* -0.013 -0.023*** -0.127***
(0.011) (0.007) (0.010) (0.010) (0.010) (0.010) (0.007) (0.015)
(0,1) worker has completed <= 5 jobs -0.155*** -0.023*** -0.005 0.005 -0.007 0.001 -0.189*** -0.165***
(0.008) (0.004) (0.006) (0.007) (0.006) (0.006) (0.005) (0.010)
(0,1) indicator that worker is in India 0.058*** 0.009 -0.001 -0.005 0.001 -0.002 0.051*** 0.066***
x (0,1) worker has completed <= 5 jobs (0.011) (0.006) (0.011) (0.011) (0.011) (0.011) (0.009) (0.015)
Ethnic Indian interactions with worker traits:
Prob. that hiring contact is of ethnic Indian origin -0.017 0.008 0.022 0.023 0.006 0.008 -0.009 -0.011
x (0,1) indicator that worker is in India (0.036) (0.023) (0.033) (0.033) (0.045) (0.046) (0.025) (0.049)
Prob. that hiring contact is of ethnic Indian origin 0.145 -0.006 -0.013 -0.022 0.012 0.004 -0.026 0.075
x (0,1) worker has completed <=5 jobs (0.136) (0.015) (0.025) (0.026) (0.028) (0.027) (0.021) (0.116)
Prob. that hiring contact is of ethnic Indian origin -0.140 0.024 0.013 0.020 -0.018 -0.012 -0.080 -0.030
x (0,1) indicator that worker is in India (0.111) (0.023) (0.042) (0.045) (0.041) (0.041) (0.050) (0.064)
x (0,1) worker has completed <=5 jobs
Additional control for log wage on contract No No No Yes No Yes No No
Observations 157,812 157,809 121,835 121,835 121,131 121,131 157,812 121,509
Mean of dependent variable 1.928 0.0117 0.578 0.578 0.646 0.646 0.770 1.987
Notes: See Table 8. Estimations include fixed effects for year x job type x country of company contact x company contact.
Table 9: Tests of information, performance, and wage differences by workers' experience levels -- variation within employers
The sample is all contracts where the company contact is located outside of India
Estimates include fixed effects for year x job type x country of company contact x company contact
Estimates also include fixed effects for expected project duration and controls for the share of worker-initiated applicants from India

Online Appendix to Ghani, Kerr and Stanton (2013)

N
Number of contracts
with worker in India
India's share of total
contracts originating
from company
Company contact has
ethnic Indian name US state
(1) (2) (3) (4) (5)
1 118 1.00 No Virginia
2 94 0.98 No California
3 73 0.26 No Florida
4 62 0.93 No Virginia
5 53 1.00 No Connecticut
6 51 0.98 No Wisconsin
7 46 0.38 No Florida
8 45 0.68 Yes New York
9 44 0.39 No California
10 42 0.36 No Nevada
11 40 0.56 No Arizona
12 40 0.63 No California
N
Number of contracts
with worker in India
India's share of total
contracts originating
from company
Company contact has
ethnic Indian name Primary country
(1) (2) (3) (4) (5)
1 906 0.58 Yes United Arab Emirates
2 68 0.36 No United Kingdom
3 58 0.53 No United Kingdom
4 46 0.84 No Italy
5 45 0.34 No Australia
6 44 1.00 No Netherlands
7 42 0.14 No Spain
8 40 0.38 No Australia
9 39 0.87 No United Kingdom
10 29 0.31 No Australia
11 29 0.32 No United Kingdom
12 29 0.63 No Denmark
App. Table 1b: Largest non-US companies hiring workers in India
App. Table 1a: Largest US companies hiring workers in India

Job category Total
Ethnic Indians
who are hiring
abroad
Non-ethnic
Indians who
are hiring
abroad
Ethnic Indians
who are hiring
in India
Non-ethnic
Indians who
are hiring in
India Total
Ethnic Indians
who are hiring
in India
Non-ethnic
Indians who
are hiring in
India
(1) (2) (3) (4) (5) (6) (7) (8) (9)
Total count 102,819 3,333 85,151 1,296 28,394 55,122 1,590 14,155
Networking & inform. systems 2% 2% 2% 2% 1% 2% 1% 2%
Software development 7% 9% 7% 8% 8% 8% 37% 7%
Web development 40% 42% 42% 57% 63% 38% 41% 62%
Design & multimedia 9% 8% 9% 6% 6% 10% 4% 7%
Writing & translation 10% 9% 8% 6% 3% 11% 2% 4%
Business services 2% 1% 2% 1% 1% 2% 2% 1%
Customer service 1% 1% 1% 0% 0% 1% 3% 0%
Sales & marketing 10% 11% 10% 9% 7% 10% 4% 8%
Administrative support 20% 16% 20% 10% 10% 18% 6% 9%
Total 8.6 8.6 8.4 9.3 9.6 8.7 9.7 9.5
Networking & inform. systems 16.7 13.9 16.7 11.1 12.2 16.7 10.6 12.4
Software development 15.0 15.6 15.0 12.2 13.4 15.0 10.5 13.3
Web development 12.2 11.1 12.0 11.1 11.1 12.0 11.0 11.1
Design & multimedia 11.1 10.0 10.0 11.1 11.0 11.0 10.0 10.0
Writing & translation 5.6 5.6 4.4 5.3 5.0 5.6 4.4 4.4
Business services 5.0 3.5 3.3 5.5 4.4 5.6 6.0 5.6
Customer service 3.3 2.2 3.3 3.3 4.4 5.6 10.0 3.5
Sales & marketing 3.3 4.0 3.3 4.5 4.4 3.9 3.9 4.4
Administrative support 2.2 2.2 2.2 2.2 2.2 2.2 2.8 2.2
App. Table 2: Distribution of oDesk job types and wage rates paid
Panel A. Observation counts
Panel C. Median hourly wage paid to worker
Notes: Wage rates are calculated as the median wage paid to workers and are expressed in dollars. Sample includes contracts with ethnic name matches and identified job
category classifications. Sample splits in columns 3-6 and 8-9 exclude company contacts for which a partial Indian ethnicity assignment is made.
Companies in United States
Companies outside of the United States,
excluding India
Panel B. Distribution of job types (ordered by median wage as shown in Panel C)
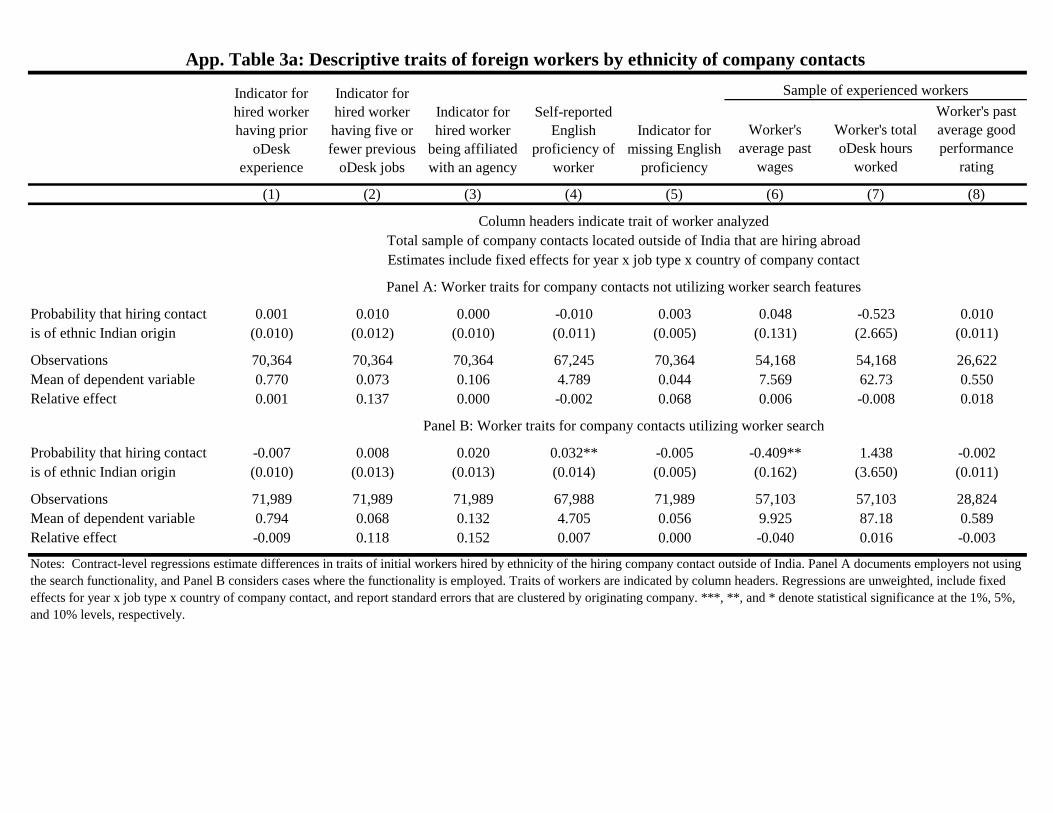
Worker's
average past
wages
Worker's total
oDesk hours
worked
Worker's past
average good
performance
rating
(1) (2) (3) (4) (5) (6) (7) (8)
Probability that hiring contact 0.001 0.010 0.000 -0.010 0.003 0.048 -0.523 0.010
is of ethnic Indian origin (0.010) (0.012) (0.010) (0.011) (0.005) (0.131) (2.665) (0.011)
Observations 70,364 70,364 70,364 67,245 70,364 54,168 54,168 26,622
Mean of dependent variable 0.770 0.073 0.106 4.789 0.044 7.569 62.73 0.550
Relative effect 0.001 0.137 0.000 -0.002 0.068 0.006 -0.008 0.018
Probability that hiring contact -0.007 0.008 0.020 0.032** -0.005 -0.409** 1.438 -0.002
is of ethnic Indian origin (0.010) (0.013) (0.013) (0.014) (0.005) (0.162) (3.650) (0.011)
Observations 71,989 71,989 71,989 67,988 71,989 57,103 57,103 28,824
Mean of dependent variable 0.794 0.068 0.132 4.705 0.056 9.925 87.18 0.589
Relative effect -0.009 0.118 0.152 0.007 0.000 -0.040 0.016 -0.003
App. Table 3a: Descriptive traits of foreign workers by ethnicity of company contacts
Indicator for
hired worker
having prior
oDesk
experience
Self-reported
English
proficiency of
worker
Indicator for
missing English
proficiency
Sample of experienced workersIndicator for
hired worker
having five or
fewer previous
oDesk jobs
Indicator for
hired worker
being affiliated
with an agency
Column headers indicate trait of worker analyzed
Estimates include fixed effects for year x job type x country of company contact
Panel B: Worker traits for company contacts utilizing worker search
Notes: Contract-level regressions estimate differences in traits of initial workers hired by ethnicity of the hiring company contact outside of India. Panel A documents employers not using
the search functionality, and Panel B considers cases where the functionality is employed. Traits of workers are indicated by column headers. Regressions are unweighted, include fixed
effects for year x job type x country of company contact, and report standard errors that are clustered by originating company. ***, **, and * denote statistical significance at the 1%, 5%,
and 10% levels, respectively.
Panel A: Worker traits for company contacts not utilizing worker search features
Total sample of company contacts located outside of India that are hiring abroad

Worker's
average past log
wages
Worker's total
past oDesk
hours worked
Worker's past
average good
performance
rating
(1) (2) (3) (4) (5) (6) (7) (8)
Probability that hiring contact -0.025 0.058*** 0.007 -0.011 0.002 -0.023 4.869 0.009
is of ethnic Indian origin (0.017) (0.022) (0.017) (0.013) (0.007) (0.024) (5.253) (0.020)
Observations 21,239 21,239 21,239 20,294 21,239 17,163 17,163 8,923
Mean of dependent variable 0.808 0.413 0.490 4.888 0.0445 1.968 71.12 0.503
Relative effect -0.031 0.140 0.014 -0.002 0.045 -0.012 0.068 0.018
Probability that hiring contact -0.028* 0.032* -0.023 0.016 -0.008 -0.047* -1.833 0.017
is of ethnic Indian origin (0.016) (0.019) (0.020) (0.013) (0.009) (0.026) (5.723) (0.017)
Observations 24,417 24,417 24,417 22,694 24,417 19,171 19,171 9,948
Mean of dependent variable 0.785 0.494 0.622 4.872 0.0706 2.175 102.7 0.541
Relative effect -0.036 0.065 -0.032 0.003 -0.114 -0.022 -0.018 0.031
Notes: See App. Table 3a. Contract-level regressions estimate differences in traits of workers in India hired by ethnicity of the hiring company contact outside of India.
App. Table 3b: Descriptive traits of workers in India by ethnicity of company contacts
Indicator for
hired worker
having prior
oDesk
experience
Self-reported
English
proficiency of
worker
Indicator for
missing English
proficiency
Sample of experienced workers
Column headers indicate trait of worker analyzed
Total sample of company contacts located outside of India that are hiring in India
Estimates include fixed effects for year x job type x country of company contact
Panel A: Worker traits for company contacts not utilizing worker search features
Panel B: Worker traits for company contacts utilizing worker search
Indicator for
hired worker
having five or
fewer previous
oDesk jobs
Indicator for
hired worker
being affiliated
with an agency
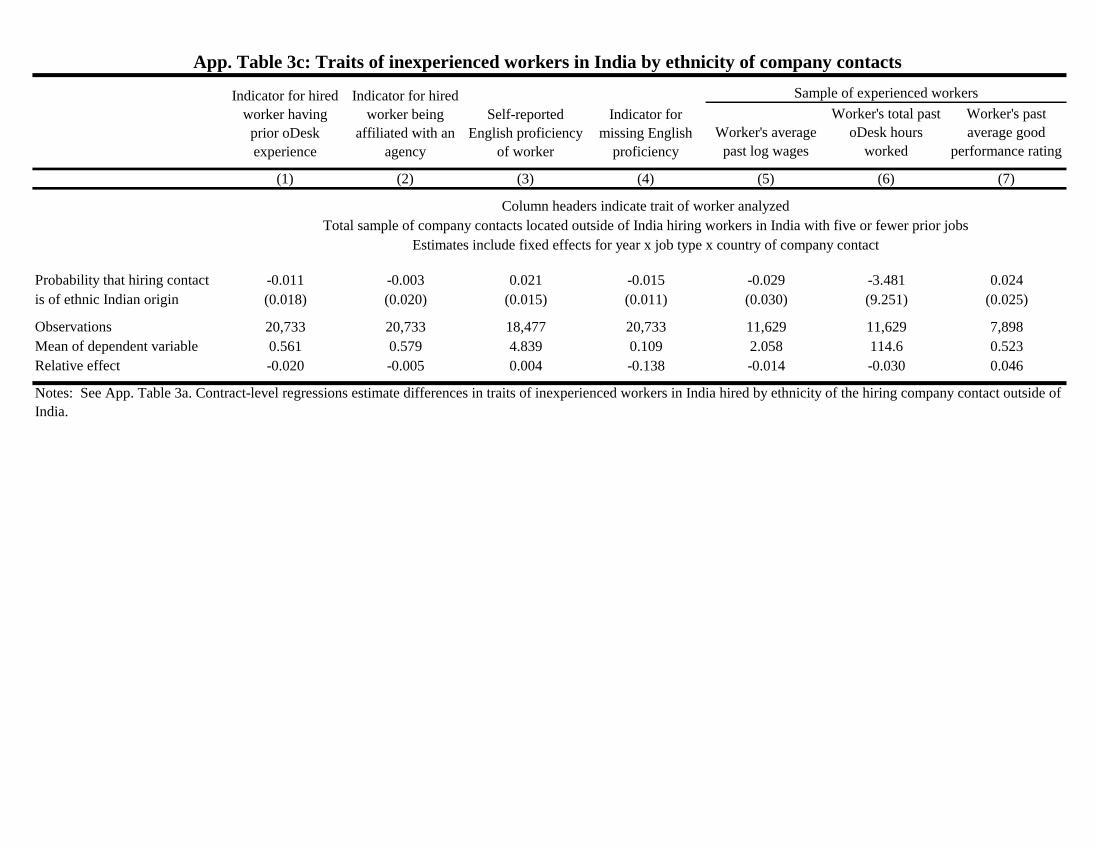
Worker's average
past log wages
Worker's total past
oDesk hours
worked
Worker's past
average good
performance rating
(1) (2) (3) (4) (5) (6) (7)
Probability that hiring contact -0.011 -0.003 0.021 -0.015 -0.029 -3.481 0.024
is of ethnic Indian origin (0.018) (0.020) (0.015) (0.011) (0.030) (9.251) (0.025)
Observations 20,733 20,733 18,477 20,733 11,629 11,629 7,898
Mean of dependent variable 0.561 0.579 4.839 0.109 2.058 114.6 0.523
Relative effect -0.020 -0.005 0.004 -0.138 -0.014 -0.030 0.046
Column headers indicate trait of worker analyzed
Total sample of company contacts located outside of India hiring workers in India with five or fewer prior jobs
Estimates include fixed effects for year x job type x country of company contact
Notes: See App. Table 3a. Contract-level regressions estimate differences in traits of inexperienced workers in India hired by ethnicity of the hiring company contact outside of
India.
App. Table 3c: Traits of inexperienced workers in India by ethnicity of company contacts
Indicator for hired
worker having
prior oDesk
experience
Self-reported
English proficiency
of worker
Indicator for
missing English
proficiency
Sample of experienced workersIndicator for hired
worker being
affiliated with an
agency
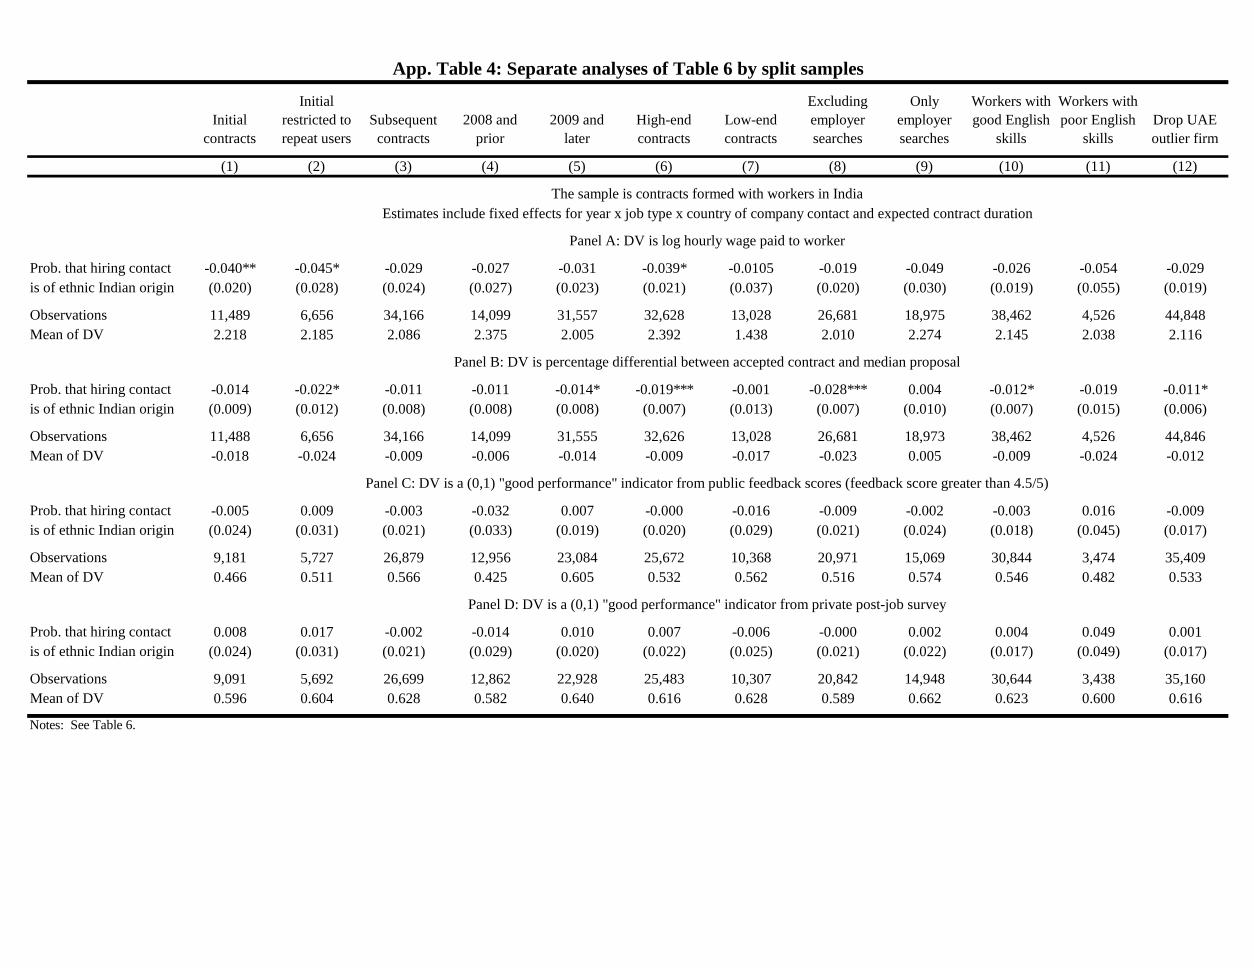
Initial
contracts
Initial
restricted to
repeat users
Subsequent
contracts
2008 and
prior
2009 and
later
High-end
contracts
Low-end
contracts
Excluding
employer
searches
Only
employer
searches
Workers with
good English
skills
Workers with
poor English
skills
Drop UAE
outlier firm
(1) (2) (3) (4) (5) (6) (7) (8) (9) (10) (11) (12)
Prob. that hiring contact -0.040** -0.045* -0.029 -0.027 -0.031 -0.039* -0.0105 -0.019 -0.049 -0.026 -0.054 -0.029
is of ethnic Indian origin (0.020) (0.028) (0.024) (0.027) (0.023) (0.021) (0.037) (0.020) (0.030) (0.019) (0.055) (0.019)
Observations 11,489 6,656 34,166 14,099 31,557 32,628 13,028 26,681 18,975 38,462 4,526 44,848
Mean of DV 2.218 2.185 2.086 2.375 2.005 2.392 1.438 2.010 2.274 2.145 2.038 2.116
Prob. that hiring contact -0.014 -0.022* -0.011 -0.011 -0.014* -0.019*** -0.001 -0.028*** 0.004 -0.012* -0.019 -0.011*
is of ethnic Indian origin (0.009) (0.012) (0.008) (0.008) (0.008) (0.007) (0.013) (0.007) (0.010) (0.007) (0.015) (0.006)
Observations 11,488 6,656 34,166 14,099 31,555 32,626 13,028 26,681 18,973 38,462 4,526 44,846
Mean of DV -0.018 -0.024 -0.009 -0.006 -0.014 -0.009 -0.017 -0.023 0.005 -0.009 -0.024 -0.012
Prob. that hiring contact -0.005 0.009 -0.003 -0.032 0.007 -0.000 -0.016 -0.009 -0.002 -0.003 0.016 -0.009
is of ethnic Indian origin (0.024) (0.031) (0.021) (0.033) (0.019) (0.020) (0.029) (0.021) (0.024) (0.018) (0.045) (0.017)
Observations 9,181 5,727 26,879 12,956 23,084 25,672 10,368 20,971 15,069 30,844 3,474 35,409
Mean of DV 0.466 0.511 0.566 0.425 0.605 0.532 0.562 0.516 0.574 0.546 0.482 0.533
Prob. that hiring contact 0.008 0.017 -0.002 -0.014 0.010 0.007 -0.006 -0.000 0.002 0.004 0.049 0.001
is of ethnic Indian origin (0.024) (0.031) (0.021) (0.029) (0.020) (0.022) (0.025) (0.021) (0.022) (0.017) (0.049) (0.017)
Observations 9,091 5,692 26,699 12,862 22,928 25,483 10,307 20,842 14,948 30,644 3,438 35,160
Mean of DV 0.596 0.604 0.628 0.582 0.640 0.616 0.628 0.589 0.662 0.623 0.600 0.616
Panel C: DV is a (0,1) "good performance" indicator from public feedback scores (feedback score greater than 4.5/5)
Panel D: DV is a (0,1) "good performance" indicator from private post-job survey
Notes: See Table 6.
App. Table 4: Separate analyses of Table 6 by split samples
The sample is contracts formed with workers in India
Estimates include fixed effects for year x job type x country of company contact and expected contract duration
Panel A: DV is log hourly wage paid to worker
Panel B: DV is percentage differential between accepted contract and median proposal

DV is indicator variable for
wage rate increase on current
oDesk contract
DV is indicator variable for
worker being hired again on
oDesk
DV is indicator variable for
worker being rehired by
company
DV is log wage of worker's
NEXT oDesk contract
(1) (2) (3) (4)
Prob. that hiring contact -0.003 -0.002 0.004 -0.035*
is of ethnic Indian origin (0.003) (0.010) (0.005) (0.018)
Observations 45,656 45,656 45,656 36,339
Mean of DV 0.022 0.796 0.039 2.156
Prob. that hiring contact -0.002 -0.015 -0.000 0.028
is of ethnic Indian origin (0.008) (0.027) (0.011) (0.038)
Observations 9,311 9,311 9,311 5,811
Mean of DV 0.035 0.624 0.062 2.051
Prob. that hiring contact -0.006 0.005 0.006 -0.010
is of ethnic Indian origin (0.005) (0.016) (0.008) (0.025)
Observations 20,733 20,733 20,733 14,803
Mean of DV 0.027 0.714 0.051 2.117
Notes: See Table 6.
App. Table 5: Table 6's analysis with additional outcome variables
Panel A: The sample is contracts formed with workers in India
Estimates include fixed effects for year x job type x country of company contact and expected contract duration
Panel B: The sample is contracts formed with workers in India on their first hourly contract
Panel C: The sample is contracts formed with workers in India with five or fewer prior contracts

Base estimation
Including prior
feedback and
controls for
worker experience
Experienced
oDesk workers
with controls for
lagged wages and
feedback
New oDesk
workers without
prior wages or
experience
Including
company fixed
effects
Companies with
past experience
with hourly hiring
in India
Companies with
past successful
experience with
hourly hiring in
India
Including the
wage paid on the
contract as a
control variable
(1) (2) (3) (4) (5) (6) (7) (8)
(0,1) indicator that -0.152*** -0.146*** -0.054*** -0.252 -0.166*** -0.147** -0.163** n.a.
worker is in India (0.041) (0.042) (0.020) (0.165) (0.059) (0.068) (0.069)
Observations 7,640 7,640 4,519 1,528 7,640 4,334 3,685
Mean of DV 2.013 2.013 2.023 2.001 2.013 2.045 2.094
(0,1) indicator that -0.023** -0.022** -0.017* -0.004 -0.017 -0.009 -0.008 n.a.
worker is in India (0.010) (0.010) (0.009) (0.023) (0.010) (0.011) (0.013)
Observations 7,640 7,640 4,538 1,528 7,640 4,348 3,686
Mean of DV 0.000 0.000 0.003 0.000 0.000 0.001 0.001
(0,1) indicator that -0.012 -0.009 -0.014 -0.003 -0.005 0.001 0.004 -0.002
worker is in India (0.017) (0.016) (0.021) (0.031) (0.016) (0.019) (0.018) (0.017)
Observations 5,935 5,935 3,642 1,245 5,935 3,347 2,883 5,935
Mean of DV 0.623 0.623 0.592 0.660 0.623 0.679 0.679 0.623
Relative effect -0.019 -0.014 -0.024 -0.005 -0.008 0.001 0.006 -0.003
(0,1) indicator that -0.032* -0.032* -0.015 -0.054* -0.036 0.003 0.014 -0.022
worker is in India (0.018) (0.018) (0.021) (0.029) (0.023) (0.019) (0.020) (0.019)
Observations 5,900 5,900 3,619 1,244 5,900 3,338 2,879 5,900
Mean of DV 0.677 0.677 0.665 0.700 0.677 0.700 0.700 0.677
Relative effect -0.047 -0.047 -0.023 -0.077 -0.053 0.004 0.020 -0.032
Panel C: DV is a (0,1) "good performance" indicator from public feedback scores (feedback score greater than 4.5/5)
Notes: Contract-level regressions estimate wage and performance effects from ethnicity-based contracts using variation among ethnic Indian company contacts located outside of India. Regressions
are unweighted, include fixed effects for year x job type x country of company contact and expected contract duration buckets, and report standard errors that are two-way clustered by originating
company and worker. Regressions with worker fixed effects bootstrap standard errors using the procedure described in Table 6. Performance observation counts are lower due to ongoing jobs (99%
of cases) or missing values. Worker controls are those listed in Table 6. ***, **, and * denote statistical significance at the 1%, 5%, and 10% levels, respectively.
App. Table 6: Wage rate and performance effects among ethnic Indian company contacts due to contracts with India
The sample is contracts formed with ethnic Indian company contacts
Estimates include fixed effects for year x job type x country of company contact and expected contract duration
Panel A: DV is log hourly wage paid to worker
Panel B: DV is percentage differential between accepted contract and median proposal
Panel D: DV is a (0,1) "good performance" indicator from private post-job survey

Initial
contracts
Initial
restricted to
repeat users
Subsequent
contracts
2008 and
prior
2009 and
later
High-end
contracts
Low-end
contracts
Excluding
employer
searches
Only
employer
searches
Workers with
good English
skills
Workers with
poor English
skills
Drop UAE
outlier firm
(1) (2) (3) (4) (5) (6) (7) (8) (9) (10) (11) (12)
(0,1) indicator that -0.132*** -0.137** -0.158*** -0.098** -0.166*** -0.181*** -0.103** -0.132*** -0.191*** -0.112*** -0.182*** -0.110***
worker is in India (0.037) (0.055) (0.050) (0.039) (0.047) (0.047) (0.047) (0.039) (0.059) (0.028) (0.060) (0.029)
Observations 1,687 957 5,953 1,447 6,193 4,180 3,460 4,463 3,177 5,642 1,321 5,883
Mean of DV 2.103 2.019 1.990 2.200 1.970 2.444 1.492 1.903 2.167 1.989 1.995 1.896
(0,1) indicator that -0.046*** -0.032* -0.014 -0.038*** -0.021** -0.030** -0.016 -0.046*** 0.009 -0.024** -0.034* -0.031***
worker is in India (0.016) (0.019) (0.010) (0.014) (0.011) (0.012) (0.015) (0.012) (0.012) (0.012) (0.017) (0.010)
Observations 1,687 957 5,953 1,447 6,193 4,180 3,460 4,463 3,178 5,642 1,321 5,883
Mean of DV -0.004 -0.027 0.000 0.006 -0.020 -0.006 0.007 -0.010 0.013 0.003 -0.012 -0.00129
(0,1) indicator that -0.048 -0.053 -0.003 -0.070* 0.006 -0.022 0.005 -0.030 0.010 0.001 -0.067 -0.015
worker is in India (0.034) (0.044) (0.018) (0.037) (0.017) (0.023) (0.026) (0.022) (0.023) (0.019) (0.042) (0.021)
Observations 1,344 816 4,591 1,350 4,585 3,247 2,688 3,379 2,556 4,463 1,021 4,578
Mean of DV 0.529 0.576 0.651 0.442 0.677 0.657 0.583 0.601 0.653 0.612 0.593 0.536
(0,1) indicator that -0.066*** -0.073* -0.019 -0.059 -0.024 -0.040* -0.018 -0.053** -0.011 -0.020 -0.063 -0.038*
worker is in India (0.033) (0.043) (0.019) (0.037) (0.019) (0.023) (0.026) (0.021) (0.023) (0.018) (0.044) (0.021)
Observations 1,326 810 4,576 1,333 4,567 3,229 2,671 3,362 2,538 4,432 1,016 4,544
Mean of DV 0.655 0.671 0.683 0.617 0.694 0.699 0.651 0.658 0.703 0.667 0.674 0.636
Notes: See App. Table 6.
App. Table 7: Separate analyses of App. Table 6 by split samples
The sample is contracts formed with ethnic Indian company contacts
Estimates include fixed effects for year x job type x country of company contact and expected contract duration
Panel A: DV is log hourly wage paid to worker
Panel B: DV is percentage differential between accepted contract and median proposal
Panel C: DV is a (0,1) "good performance" indicator from public feedback scores (feedback score greater than 4.5/5)
Panel D: DV is a (0,1) "good performance" indicator from private post-job survey

DV is log average
wage rate paid on
oDesk
DV is cumulative
percentage
differential between
contracts and median
proposals
DV is average "good
performance" ratings
over contracts from
feedback
DV is average "good
performance" ratings
over contracts from
private success survey
DV is number of
workers hired divided
by total number of
contracts
(1) (2) (3) (4) (5)
Share of contracts that are -0.091*** -0.073*** -0.064*** -0.068*** 0.019***
formed with workers in India (0.008) (0.004) (0.007) (0.007) (0.002)
Prob. that hiring contact -0.042* -0.025*** -0.001 -0.000 0.007
is of ethnic Indian origin (0.024) (0.010) (0.016) (0.015) (0.005)
Share of contracts that are 0.006 0.022 -0.001 0.015 -0.002
formed with workers in India (0.035) (0.015) (0.030) (0.030) (0.009)
x Prob. that hiring contact
is of ethnic Indian origin
Observations 35,863 35,862 30,097 29,899 35,863
Mean of dependent variable 2.088 0.026 0.510 0.637 0.935
Notes: Company contact-level regressions estimate wage and performance effects from ethnicity-based contracts using variation among company contacts located
outside of India. Regressions are unweighted, include fixed effects for first year x modal job type x country of company contact, and report robust standard errors.
Performance observation counts are lower due to ongoing jobs (99% of cases) or missing values. ***, **, and * denote statistical significance at the 1%, 5%, and 10%
levels, respectively.
App. Table 8: Analysis of bundled contract attributes at company level
Each observation is a unique company contact located outside of India
Estimates include fixed effects for company's first year x modal job type x country of company contact