diamond sensors laboratory 3d micro-structuring of diamond for radiation detector applications...
TRANSCRIPT

Diamond Sensors Laboratory
3D micro-structuring of diamond for radiation detector applications
B.Caylar, M.Pomorski, P.BergonzoDiamond Sensors Laboratory CEA-LIST, Gif-Sur-Yvette, France
José AlvarezLaboratoire de génie électrique de Paris (LGEP), Gif-sur-Yvette, France
Alexander OhUniversity of Manchester, School of Physics and Astronomy, Manchester, United Kingdom
Thorsten WenglerCERN, Geneva, Switzerland

Diamond Sensors Laboratory
Advantages1: Higher electric field for a given applied bias voltage Shorter drift path thus drift time Lower probability of trapping
2
Context – Why using 3D electrodes?
[1] J.Morse, C.J. Kenney, E.M. Westbrook et al. / Nuclear Instruments and Methods in Physics Research Section A, 524 (2004) 236.
2DElectrodes
3DElectrodes
Ionizing particle

Diamond Sensors Laboratory
3
Context – Why using 3D electrodes?
Planar 3D
0 2 4 6 80.0
3.0x10⁻⁶
6.0x10⁻⁶
9.0x10⁻⁶
1.2x10⁻⁵
1.5x10⁻⁵
Perfect cristal
= 250ns
= 2ns
Cur
rent
(A
)
Time (ns)0 2 4 6 8
0.0
3.0x10⁻⁶
6.0x10⁻⁶
9.0x10⁻⁶
1.2x10⁻⁵
1.5x10⁻⁵
Perfect Cristal
= 250ns
= 2ns
Cur
rent
(A
)Time (ns)
Analytically calculated currents generated by a MIP

Diamond Sensors Laboratory
4
NIEL induces bulk defects
When flux increases :
Defects number increases Carrier lifetime reduction CCE decreases
[2] Michal Pomorski – PhD debate, Frankfurt University 07/08/2008
0 5 10 15 20 250
1
Nor
mal
ized
cou
nts
Collected charge [ke]
before irradiation after 1.2 x 10¹⁴ 20MeV n.cm-2
after 1.97 x 10¹⁴ 20MeV n.cm-2
Signal decrease
Context – Why using 3D electrodes?

Diamond Sensors Laboratory
5
3D geometry is faster : 8ns vs 208ps. 3D geometry makes the detector more radiation hard
0 2 4 6 80.0
0.5
1.0
1.5
2.0
2.5
3.0
99.99%
Col
lect
ed c
harg
e (f
C)
Time (ns)
Perfect cristal
= 250ns
= 2ns
95%
0 2 4 6 80.0
0.5
1.0
1.5
2.0
2.5
3.0
Perfect cristal
= 250ns
= 2ns
Col
lect
ed c
harg
e (f
C)
Time (ns)
47%
99.6%
Context – Why using 3D electrodes?
Planar 3D

Diamond Sensors Laboratory
• Burried electrodes Laser setup & Fabrication Structural characterization Electrical characterization
• pc-CVD Detector (e6 detector grade) Electrical characterization Characterization under alpha particles
• sc-CVD Detector (e6 electronic grade) Optical characterization Electrical characterization Transient current measurements
• Conclusion
6
Outline

Diamond Sensors Laboratory
BURRIED ELECTRODESLASER SETUP & FRABRICATION
7

Diamond Sensors Laboratory
8
Burried electrodes – Laser setup
Tunable parameters Scan velocity 1-1000 µm/s Laser power 0-160µJ/pulse Repetition rate 1-30 Hz
Sample holder
Nitrogen laser λ = 337nm
τ = 3ns
XYZMotorized stage
Webcam
20x Lens

Diamond Sensors Laboratory
9
Burried electrodes – Fabrication
997000 997500 998000 998500 9990000.00020
0.00021
0.00022
0.00023
0.00024
0.00025
0.00026
Am
plitu
de (
V)
Time (ms)
XYZMotorized stage
Photoluminescence during laser processing
Translation
Graphitization

Diamond Sensors Laboratory
10
BURRIED ELECTRODESSTRUCTURAL CHARACTERIZATION

Diamond Sensors Laboratory
11
Clean surface (Where graphitization starts)
Cracked Surface (Where graphitization ends)
Tilted sample
150 µm
Optical grade sc-CVD sample
Structural characterization – Optical microscopy
10µm diameter
20-100 µm diameter
700µm depth

Diamond Sensors Laboratory
12
Structural characterization – 2D Raman mapping
2D Raman depth mapping obtained by integrating diamond peak
No micro-channel Micro-channel with cracks
1000 CCD cts
0 CCD cts
1000 CCD cts
0 CCD cts10µm 10µm
Depth
Diamond Sensors Laboratory
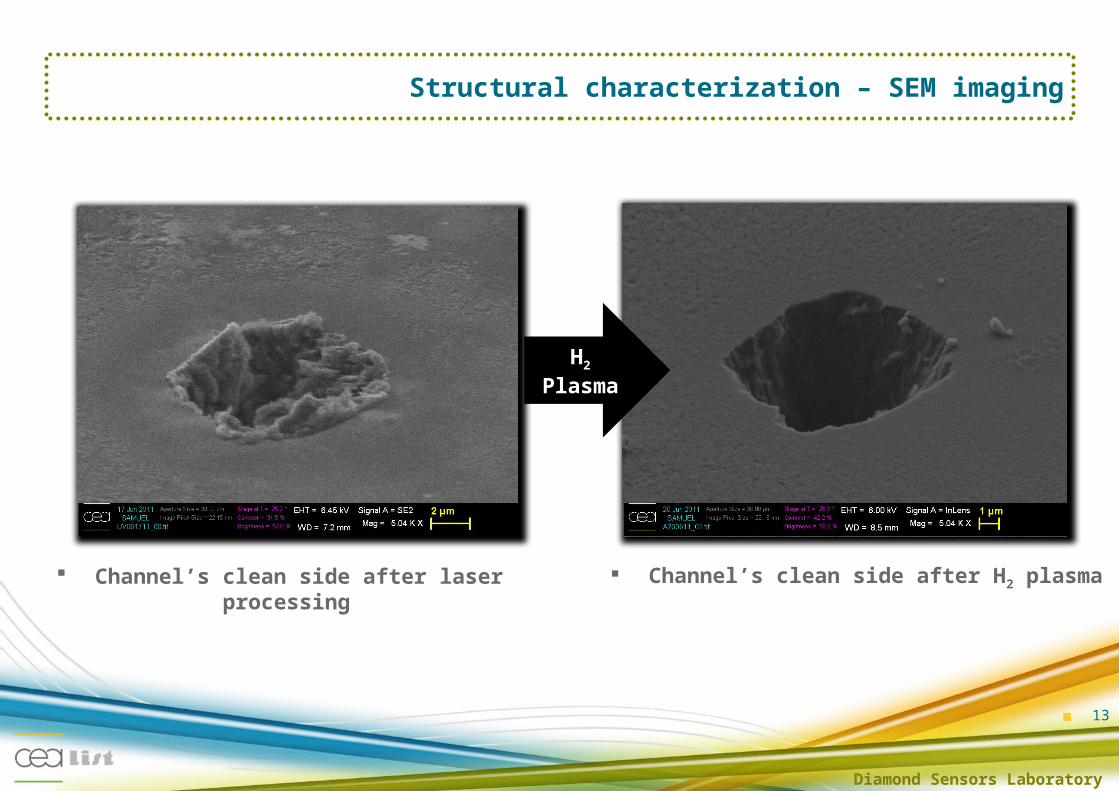
13
Structural characterization – SEM imaging
Channel’s clean side after laser processing
Channel’s clean side after H2 plasma
H2
Plasma

Diamond Sensors Laboratory
14
BURRIED ELECTRODESELECTRICAL CHARACTERIZATION

Diamond Sensors Laboratory
15
Electrical characterization – I(V) measurements
Graphite’s channel resitivity
[3] T.Ohana, T.Nakamura, A.Goto et al. / Diamond and Related Materials, 12 (2003) 2011
ρ(average) = 5.7x10⁻¹ Ω.cm
R(500µm) ~ 2kΩ
-2 0 2 4 6 8 10-1
0
1
2
3
4
5
6
Voltage (V)
Cur
rent
(m
A)
Match with nanocrystalline graphite given in literature3
A

Diamond Sensors Laboratory
16
PC-CVD DETECTORELECTRICAL CHARACTERIZATION
E6 detector grade10 x 10 x 0.7 mm3
Sample courtesy Alexander Oh

Diamond Sensors Laboratory
0 200 400 6001E-14
1E-13
1E-12
1E-11
Cu
rre
nt (
A)
Voltage (V)
17
Electrical characterization – Device leakage current
0 200 400 6001E-14
1E-13
1E-12
1E-11
Planar 3D
Cur
rent
(A
)
Voltage (V)
A
Comparison between planar and 3D geometry
Planar 3D

Diamond Sensors Laboratory
18
PC-CVD DETECTORCHARACTERIZATION UNDER ALPHA
PARTICLES

Diamond Sensors Laboratory
19
α
Al front contact
Al backcontact
Am-241 Source5.486MeV
R
Vbias = ±500V
Characterization under alpha particles – Experimental setup
FCSA
Fast Charge Sensitive Amplifier M.Ciobanu, GSI, Germany
Signal
Scope
Collimator

Diamond Sensors Laboratory
0 200 400 600 800 10000
20
40
60
80
100
Single hit Trend
Hit number
CC
E (%
)
0 200 400 600 800 10000
10
20
30
40
50
60
70
80
90
100
Single hit Trend
CC
E (%
)
Hit number
20
Characterization under alpha particles - Results
Polarization study – Holes drift (pc-CVD sample)
Planar 3D

Diamond Sensors Laboratory
0 500 1000 1500 20000
10
20
30
40
50
60
70
80
90
100
Single hit Trend
CC
E (%
)
Hit number0 500 1000 1500 2000
0
10
20
30
40
50
60
70
80
90
100
Single hit Trend
CC
E (%
)
Hit number
21
Characterization under alpha particles - Results
Polarization study – Electrons drift (pc-CVD sample)
Planar 3D

Diamond Sensors Laboratory
0 20 40 60 80 1001
10
100
Cou
nts
CCE (%)
Planar 3D
0 20 40 60 80 1001
10
100
Cou
nts
CCE (%)
Planar 3D
22
Characterization under alpha particles - Results
Holes drift (pc-CVD sample)
αα
Amplitude has been normalized with the signal of a sc-CVD « e6 electronic grade » diamond

Diamond Sensors Laboratory
23
Characterization under alpha particles - Results
Electrons drift (pc-CVD sample)
0 20 40 60 80 1001
10
100
Cou
nts
CEE (%)
Planar 3D
0 20 40 60 80 1001
10
100
Cou
nts
CCE (%)
Planar 3D
αα
Amplitude has been normalized with the signal of a sc-CVD « e6 electronic grade » diamond
Diamond Sensors Laboratory
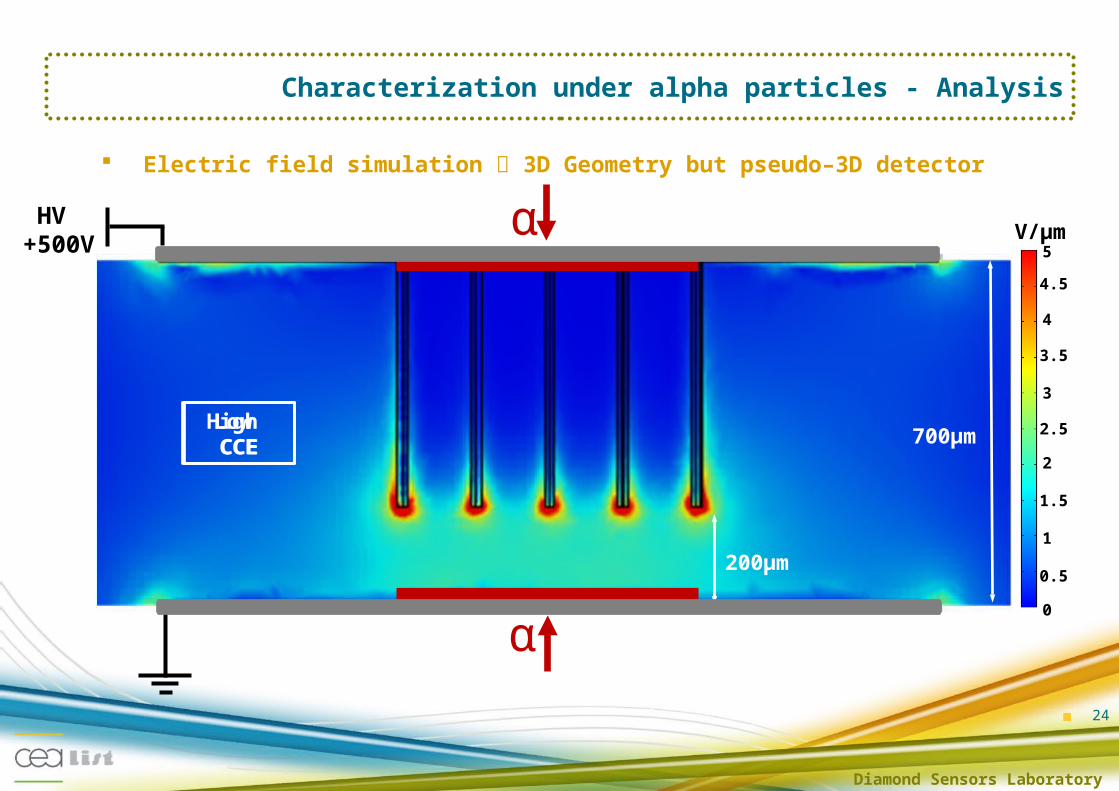
24
Characterization under alpha particles - Analysis
α
α
Low CCE
High CCE
Electric field simulation 3D Geometry but pseudo–3D detector
700µm
200µm
HV +500V
V/µm5
4.5
4
3.5
3
2.5
2
1.5
1
0.5
0

Diamond Sensors Laboratory
25
SC-CVD DETECTOR
E6 electronic grade - <100> oriented3 x 3 x 0.3 mm3
Sample courtesy Eleni Berdermann

Diamond Sensors Laboratory
26
SC-CVD DETECTOROPTICAL CHARACTERIZATION
Diamond Sensors Laboratory
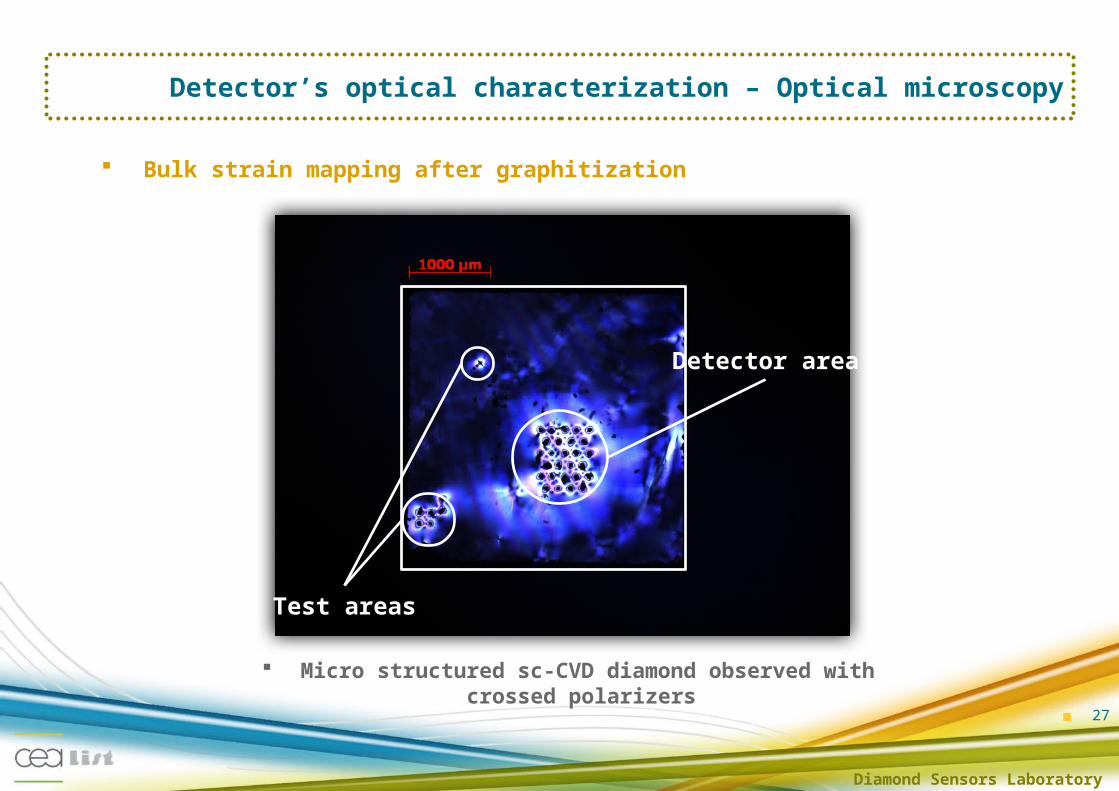
27
Bulk strain mapping after graphitization
Micro structured sc-CVD diamond observed with crossed polarizers
Test areas
Detector area
Detector’s optical characterization – Optical microscopy

Diamond Sensors Laboratory
28
Detector’s optical characterization – Optical microscopy
Detector after metallization

Diamond Sensors Laboratory
29
SC-CVD DETECTORELECTRICAL CHARACTERIZATION

Diamond Sensors Laboratory
30
Electrical characterization – Device leakage current
sc-CVD sample after plasma O2 etching
HV on cracked surface HV on clean surface
-200 -100 0 100 2001E-11
1E-10
1E-9
1E-8
1E-7
1E-6
1E-5
1E-4 Increasing Voltage Decreasing Voltage
Cur
rent
(A
)Voltage (V)
-200 -100 0 100 2001E-11
1E-10
1E-9
1E-8
1E-7
1E-6
1E-5
1E-4 Increasing Voltage Decreasing Voltage
Cur
rent
(A
)
Voltage (V)

Diamond Sensors Laboratory
31
SC-CVD DETECTORTRANSIENT CURRENT
MEASUREMENTS
Diamond Sensors Laboratory
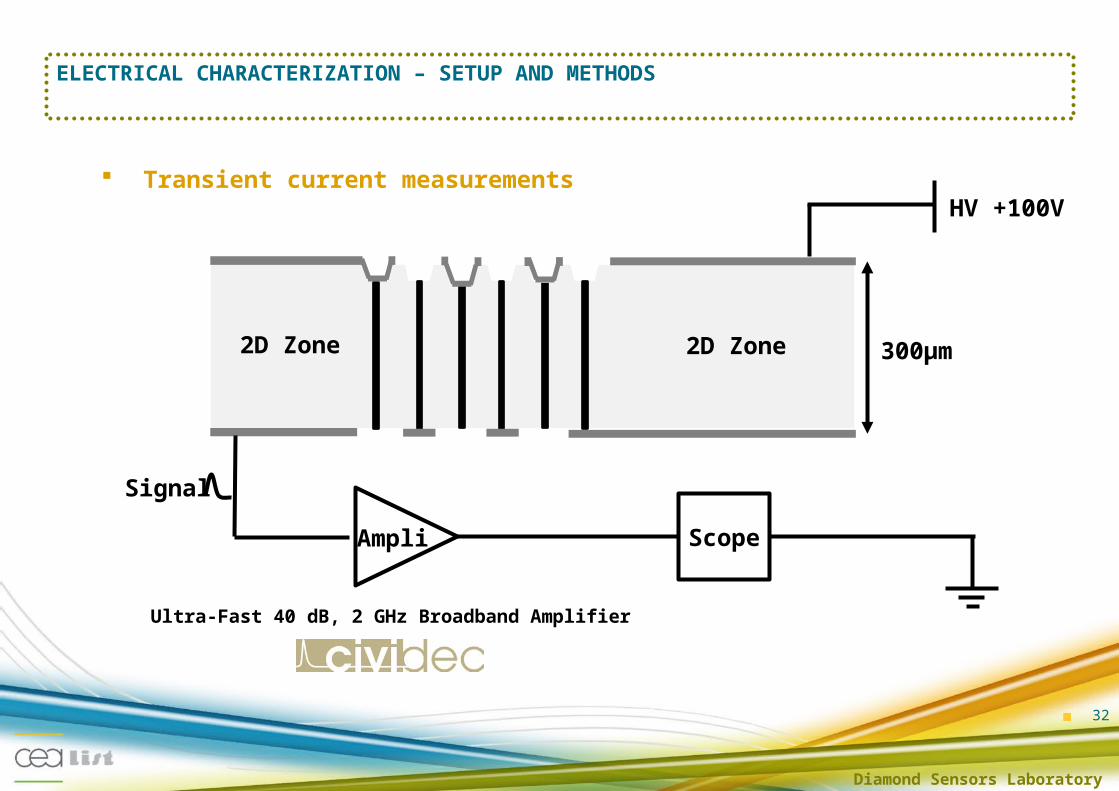
32
2D Zone
HV +100V
ELECTRICAL CHARACTERIZATION – SETUP AND METHODS
2D Zone
Signal
ScopeAmpli
Transient current measurements
300µm
Ultra-Fast 40 dB, 2 GHz Broadband Amplifier

Diamond Sensors Laboratory
Signal 3D~500mV
Electrons drift
Mixed e/h drift
Signal 2D~100mV
Signal 2D~80mV
Holes drift
33
TRANSIENT CURRENT MEASUREMENTS - RESULTS
Without collimator
Alphas’ injection on cracked side Alphas’ injection on clean side
1 ns

Diamond Sensors Laboratory
34
TRANSIENT CURRENT MEASUREMENTS - RESULTS
With collimator
1 nsMixed e/h drift
Alphas’ injection on cracked side

Diamond Sensors Laboratory
V/µm
35
TRANSIENT CURRENT MEASUREMENTS - ANALYSIS
Electric field simulation
3
2.5
2
1.5
1
0.5
0
300µm
+100 Vα
α
Planar+3D signal
Planar signal only

Diamond Sensors Laboratory
36
TRANSIENT CURRENT MEASUREMENTS - RESULTS
Experimental results
-2 0 2 4 6 8 100.0
0.1
0.2
0.3
0.4
0.5
0.6
Planar 3D
Sig
nal a
mpl
itude
(V
)
Time (ns) Selection of relevant events
Amplitude ratio = 6

Diamond Sensors Laboratory
-2 0 2 4 6 8 100,0
5,0x10⁻⁵
1,0x10⁻⁴
1,5x10⁻⁴
2,0x10⁻⁴
2,5x10⁻⁴
Ana
lytic
ally
cal
ulat
ed s
igna
ls (
A)
Time (ns)
Planar 3D
Amplitude ratio = 23.8
2GHz low pass filter
37
TRANSIENT CURRENT MEASUREMENTS - RESULTS
Analytically calculated signals
-2 0 2 4 6 8 100,0
5,0x10⁻⁵
1,0x10⁻⁴
1,5x10⁻⁴
2,0x10⁻⁴
2,5x10⁻⁴
An
aly
tica
lly c
alu
late
d s
ign
als
(A
)
Time (ns)
Planar 3D
Theoritical response
Amplitude ratio = 22

Diamond Sensors Laboratory
Amplitude’s ratio = 6.2
38
TRANSIENT CURRENT MEASUREMENTS - RESULTS
Analytically calculated signals
350 MHz low pass filter
Ampli + device bandwith ~350MHz
Rdevice ~ 520Ω
12 channels connected
Rchannel ~ 6 kΩ
-2 0 2 4 6 8 100,0
5,0x10⁻⁵
1,0x10⁻⁴
1,5x10⁻⁴
2,0x10⁻⁴
2,5x10⁻⁴
Ana
lytic
ally
cal
ulat
ed s
igna
ls (
A)
Time (ns)
Planar 3D

Diamond Sensors Laboratory
39
Conclusion
• Conductive graphitic structures has been achieved on both pc- and sc-CVD sample
• These structures are suitable for detectors applications
• Two dectetors using 3D-geometry electrodes has been produced
• A real improvement between planar and 3D geometry has ben observed Higher signal Faster response « Polarization effect » decrease on pc-CVD detector
But real 3D detector hasn’t been achieved yet…

Diamond Sensors Laboratory
40
Thanks for your attention !