diamond dollars 2015 presentation
TRANSCRIPT

THE PERFECT COLE HAMELS TRADE Diamond Dollars Case Competition
SABR Analytics Conference
Greg Ackerman, Colby Conetta, Ray Garzia, Justin Mattingly, Joey Weinberg
Syracuse University

PLAYER PROFILE: COLE HAMELS Position: SP
Age: 31 (Born December 27, 1983)
Bats/Throws: L/L
Height/Weight: 6’3”/200 lbs
Drafted: 1st Round (17th Pick), 2002
Service Time: 8.143 years
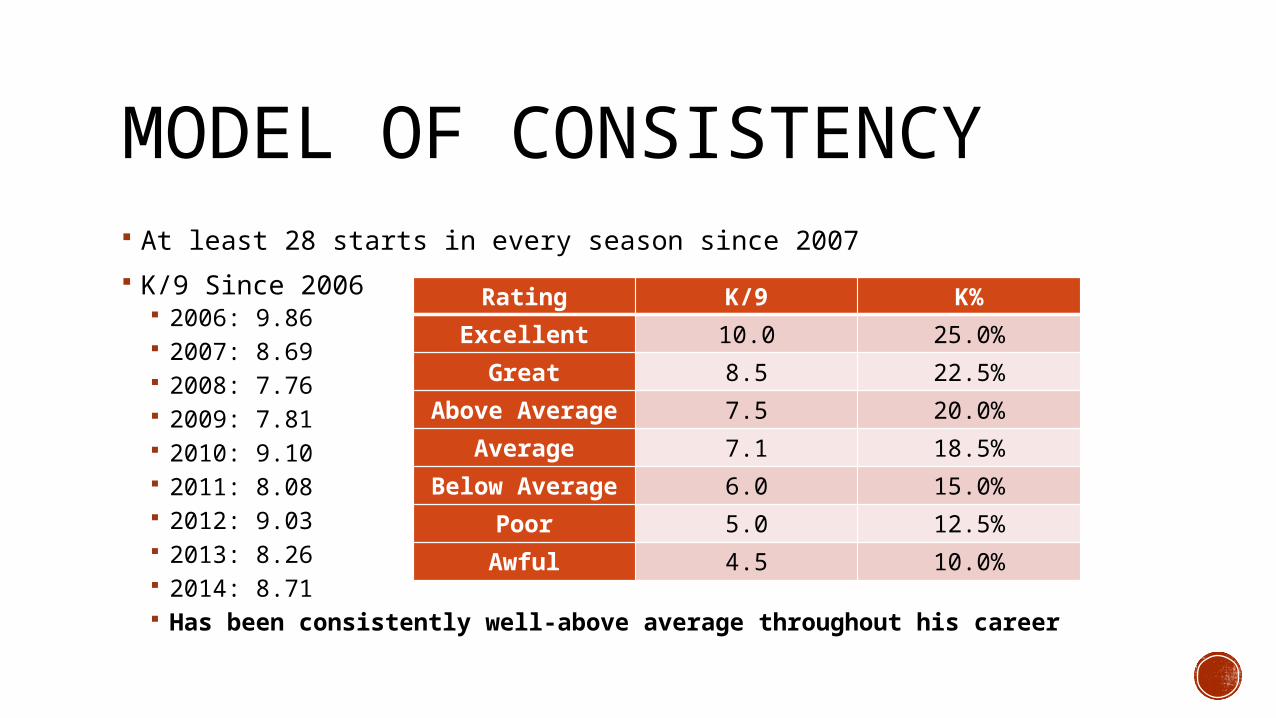
MODEL OF CONSISTENCY At least 28 starts in every season since 2007
K/9 Since 2006 2006: 9.86 2007: 8.69 2008: 7.76 2009: 7.81 2010: 9.10 2011: 8.08 2012: 9.03 2013: 8.26 2014: 8.71 Has been consistently well-above average throughout his career
Rating K/9 K%
Excellent 10.0 25.0%
Great 8.5 22.5%
Above Average 7.5 20.0%
Average 7.1 18.5%
Below Average 6.0 15.0%
Poor 5.0 12.5%
Awful 4.5 10.0%

MODEL OF CONSISTENCY HR/9 Amongst Starting Pitchers (NL)
2006: 1.29 63rd of 82 (35th of 41)
2007: 1.23 65th of 79 (32nd of 42)
2008: 1.11 59th of 86 (28th of 44)
2009: 1.12 54th of 75 (35th of 43)
2010: 1.12 72nd of 91(36th of 44)
2011: 0.79 30th of 90 (19th of 48) Really turning it on since 2011.
2012: 1.00 43rd of 85 (25th of 44)
2013: 0.86 38th of 79 (24th of 43)
2014: 0.62 15th of 87 (6th of 42)

MODEL OF CONSISTENCYPitch Count By Season (% increase or decrease)
2006: 2,178
2007: 2,791 +28.2%
2008: 3,427 +22.8 %
2009: 3,116 -9.1%
2010: 3,368 +8.1%
2011: 3,132 -7.0%
2012: 3,316 +5.9%
2013: 3,423 +3.2%
2014: 3,136 -8.4%
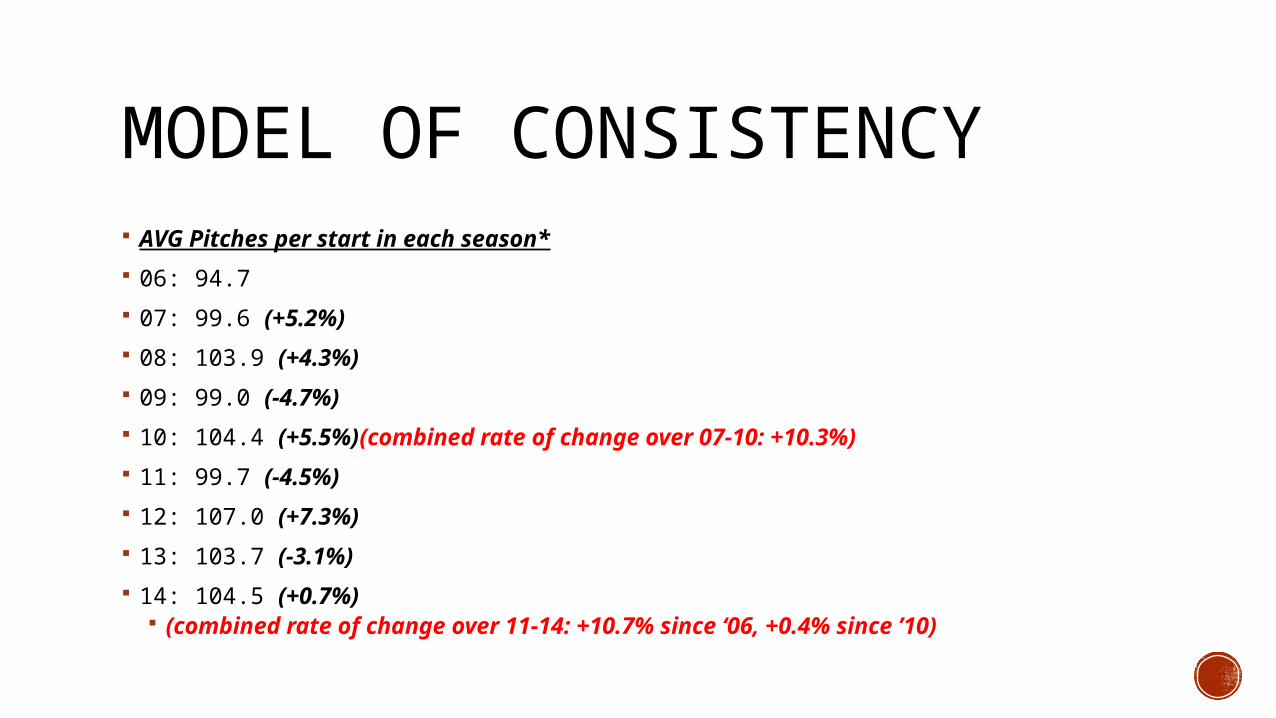
MODEL OF CONSISTENCY AVG Pitches per start in each season*
06: 94.7
07: 99.6 (+5.2%)
08: 103.9 (+4.3%)
09: 99.0 (-4.7%)
10: 104.4 (+5.5%) (combined rate of change over 07-10: +10.3%)
11: 99.7 (-4.5%)
12: 107.0 (+7.3%)
13: 103.7 (-3.1%)
14: 104.5 (+0.7%) (combined rate of change over 11-14: +10.7% since ‘06, +0.4% since ’10)

REMAINING CONTRACTYear Base Salary Signing Bonus Total Salary
2015 $22,500,000 $1,000,000 $23,500,000
2016 $22,500,000 $1,000,000 $23,500,000
2017 $22,500,000 $1,000,000 $23,500,000
2018 $22,500,000 $1,000,000 $23,500,000
2019 *$20M Club Option ($6M buyout)
-- $20,000,000 (Option)$6,000,000 (Buyout)
TOTAL $110,000,000 (Option)$96,000,000 (Buyout)
$4,000,000 $114,000,000 (Option)$100,000,000 (Buyout)
*2019 option guaranteed if Hamels 1) has 400 IP in 2017-18, including 200 IP in 2018, and 2) is not on the disabled list with a shoulder or elbow injury at the end of the 2018 season
*Cots Baseball Contracts

REPERTOIRE
FA103633%
SI19%
CH23%
CU9%
FC16%
2014 Pitch Frequency
Pitch Type
Count
Velo (mph)
pfx HMov (in.)
pfx VMov (in.)
H. Rel (ft.)
V. Rel (ft.)
Fourseam
1036 93.09 5.94 10.81 2.46 6.53
Sinker 585 93.05 9.79 8.14 2.48 6.41
Change 703 84.95 9.16 6.18 2.60 6.38
Curve 295 79.01 -3.24 -6.19 2.72 6.22
Cutter 505 89.52 1.51 6.29 2.61 6.39
*BrooksBaseball.net
HAMELS’ PROJECTION METHODOLOGY Used PECOTA projections to calculate future SIERA
Used FanGraph’s formula for calculating WAR with SIERA in place of FIP (sWAR)
Adjusted run environment for league and ballpark; then used teammate Kyle Kendrick’s 2007-2011 seasons and 2014 season as method of comparison and got results of 4.73 and 4.74 respectively.

WHY KYLE KENDRICK? Kendrick works well as replacement level (for Hamels):
Average fWAR of 0.2 per year spanning parts of 6 seasons in sample used. Large sample: 797.1 IP over sample used. Batted ball profile of typical replacement level. GB% within 0.2% of league average in 2014. Career 4.92 K/9 and 11.2 % HR/FB in line with expectations for replacement level. Same defense and home ballpark as Hamels for entire career.

PERFORMANCE FORECASTYear
Age
K/PA SIERA
sWAR
Value* Salary
2015
31 22.7%
3.29 3.3 $21,395,979
$23,500,000
2016
32 20.9%
3.58 2.4 $15,560,712
$23,500,000
2017
33 20.6%
3.63 1.7 $11,022,171
$23,500,000
2018
34 20.3%
3.67 1.5 $9,725,445 $23,500,000
2019
35 20.8%
3.59 1.4 $8,428,719 $20,000,000
• 2015-2019 Value: $66,133,626; Salary: $114,000,000• 2015-19 sWAR: 10.3• *Value = sWAR * Market Value of a Win (calculated at $6,483,630)
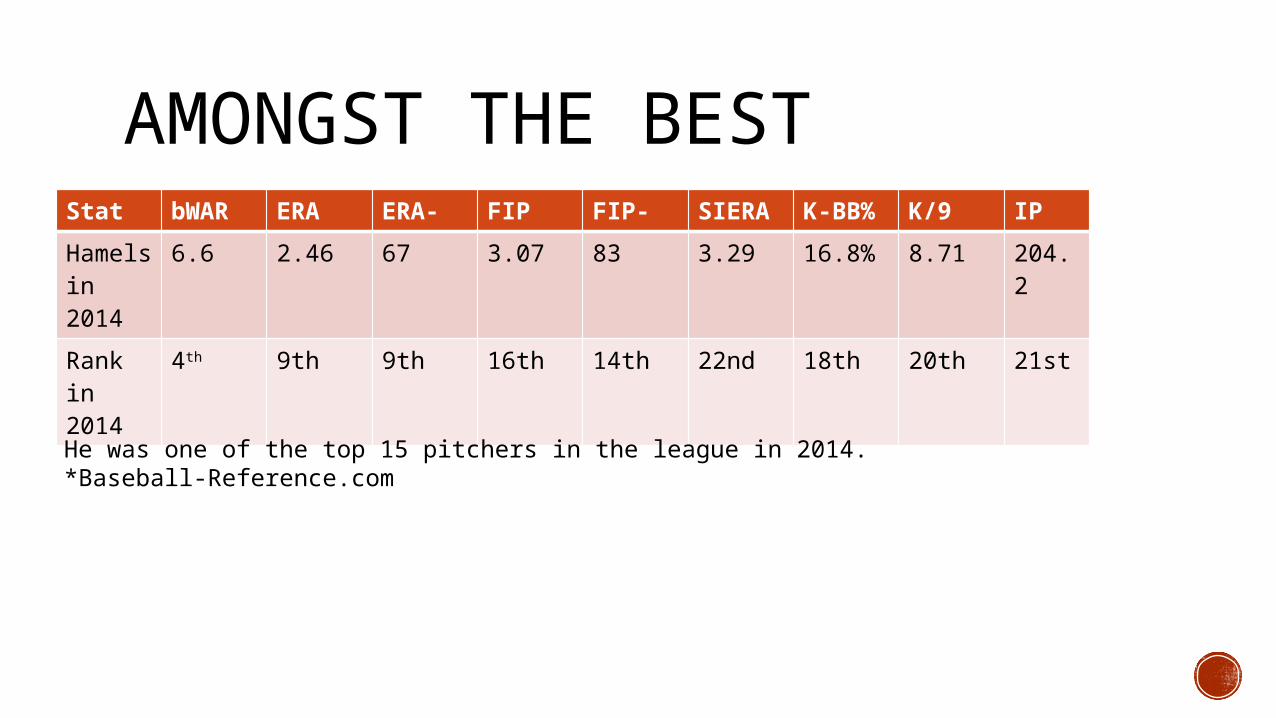
AMONGST THE BESTStat bWAR ERA ERA- FIP FIP- SIERA K-BB
%K/9 IP
Hamels in 2014
6.6 2.46 67 3.07 83 3.29 16.8% 8.71 204.2
Rank in 2014
4th 9th 9th 16th 14th 22nd 18th 20th 21st
He was one of the top 15 pitchers in the league in 2014.*Baseball-Reference.com
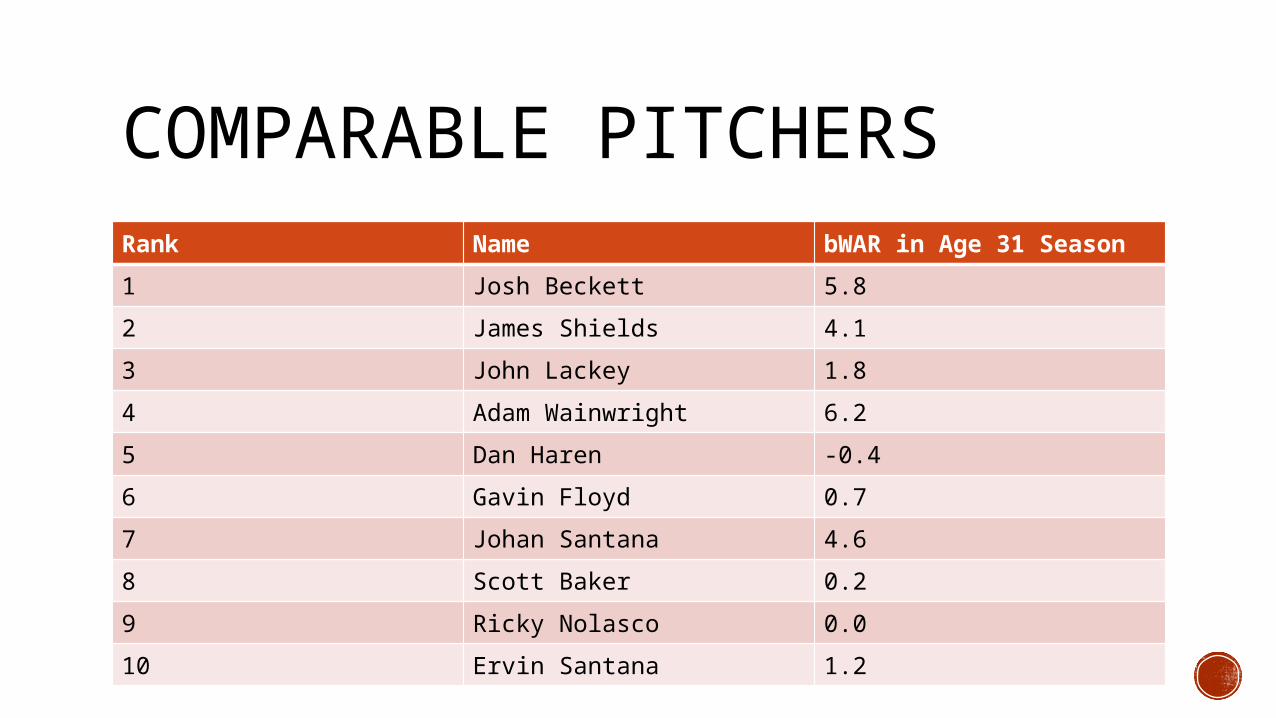
COMPARABLE PITCHERSRank Name bWAR in Age 31 Season
1 Josh Beckett 5.8
2 James Shields 4.1
3 John Lackey 1.8
4 Adam Wainwright 6.2
5 Dan Haren -0.4
6 Gavin Floyd 0.7
7 Johan Santana 4.6
8 Scott Baker 0.2
9 Ricky Nolasco 0.0
10 Ervin Santana 1.2
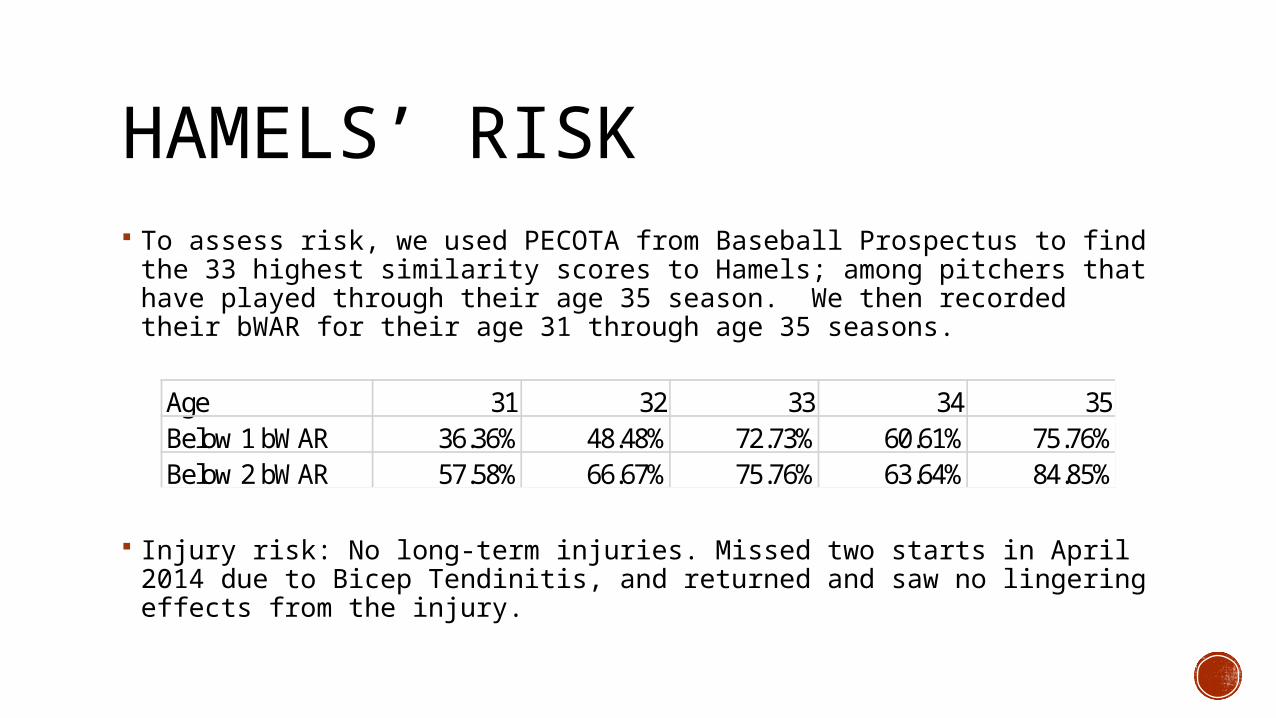
HAMELS’ RISK To assess risk, we used PECOTA from Baseball Prospectus to find the 33
highest similarity scores to Hamels; among pitchers that have played through their age 35 season. We then recorded their bWAR for their age 31 through age 35 seasons.
Injury risk: No long-term injuries. Missed two starts in April 2014 due to Bicep Tendinitis, and returned and saw no lingering effects from the injury.
Age 31 32 33 34 35Below 1 bWAR 36.36% 48.48% 72.73% 60.61% 75.76%Below 2 bWAR 57.58% 66.67% 75.76% 63.64% 84.85%

REALISTIC SUITORSRed Sox Dodgers Cubs
Win Projection: 86 (1st) Win Projection: 91 (1st) Win Projection: 84 (3rd)
Need ace starting pitcher Upgrade over Brett Anderson
Uncertainty behind Jon Lester
Offered Jon Lester $135M contract during offseason
Hanley Ramirez and Matt Kemp Contracts Off the Books
Cheap Talent to offset Hamels’ contract
Great Depth, Surplus OF High end prospects to trade
Wealth of young talent to trade
#6 Rated Farm (BP) #3 Rated Farm (BP) #1 Rated Farm (BP)
*Win projections from Steamer
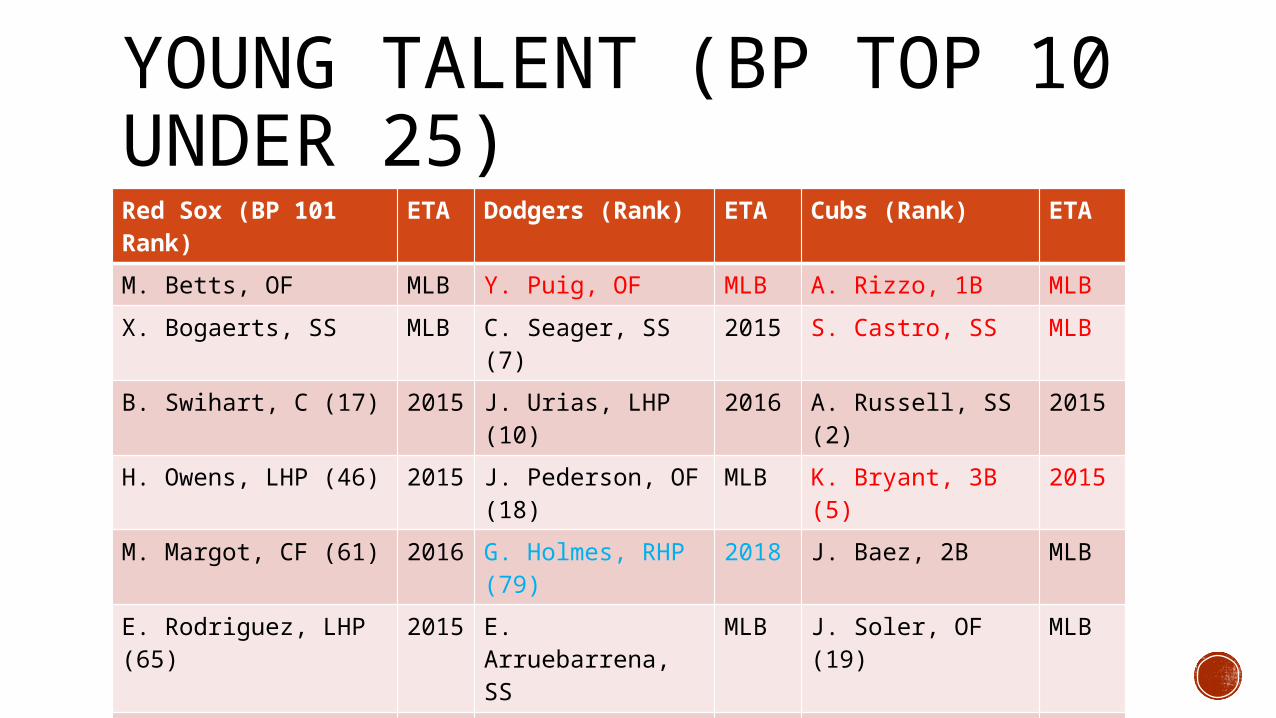
YOUNG TALENT (BP TOP 10 UNDER 25)Red Sox (BP 101 Rank)
ETA Dodgers (Rank) ETA Cubs (Rank) ETA
M. Betts, OF MLB Y. Puig, OF MLB A. Rizzo, 1B MLB
X. Bogaerts, SS MLB C. Seager, SS (7) 2015 S. Castro, SS MLB
B. Swihart, C (17) 2015
J. Urias, LHP (10) 2016 A. Russell, SS (2) 2015
H. Owens, LHP (46) 2015
J. Pederson, OF (18)
MLB K. Bryant, 3B (5) 2015
M. Margot, CF (61) 2016
G. Holmes, RHP (79)
2018 J. Baez, 2B MLB
E. Rodriguez, LHP (65)
2015
E. Arruebarrena, SS
MLB J. Soler, OF (19) MLB
R. Devers, 3B (90) 2019
J. Wieland, RHP MLB A. Alcantara, 2B/OF
MLB
C. Vazquez, C MLB Z. Lee, RHP 2015 A. Almora, OF (38)
2016
M. Chavis, INF 2018
C. Anderson, RHP 2016 K. Hendricks, RHP MLB
M. Barnes, RHP MLB J. De Leon, RHP 2018 N. Ramirez, RHP MLB
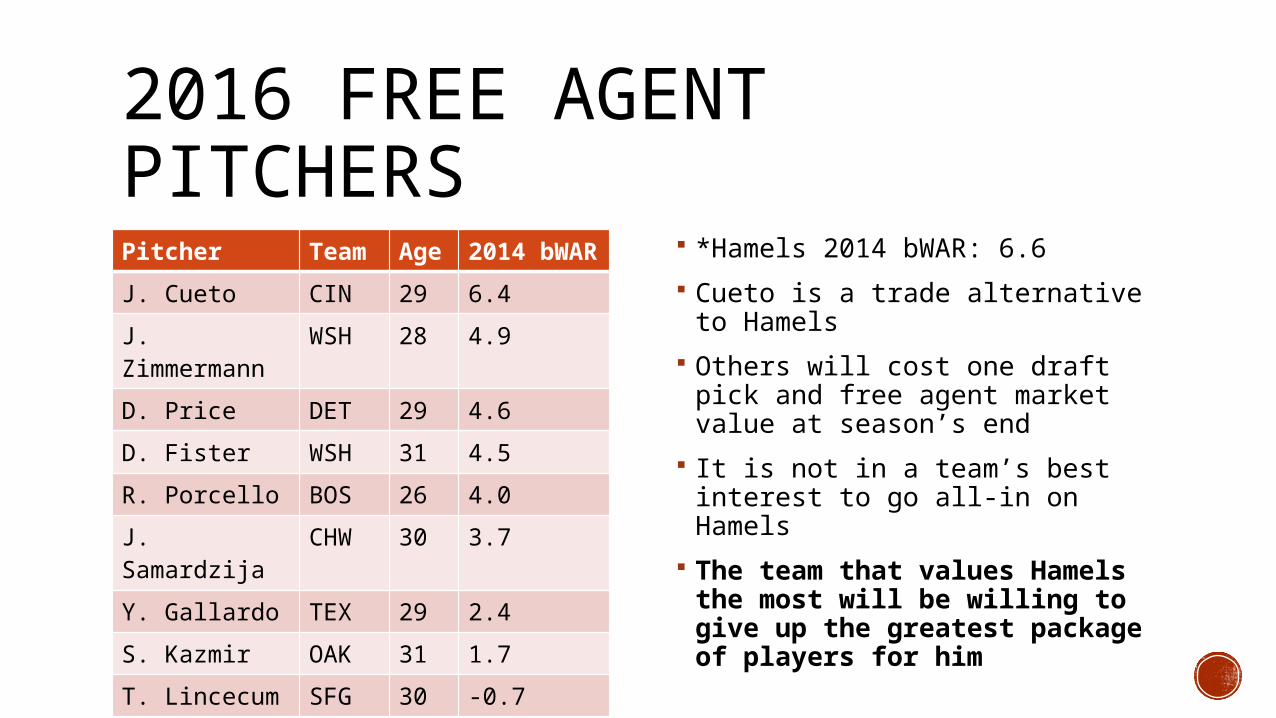
2016 FREE AGENT PITCHERSPitcher Team Ag
e2014 bWAR
J. Cueto CIN 29 6.4
J. Zimmermann
WSH 28 4.9
D. Price DET 29 4.6
D. Fister WSH 31 4.5
R. Porcello BOS 26 4.0
J. Samardzija CHW 30 3.7
Y. Gallardo TEX 29 2.4
S. Kazmir OAK 31 1.7
T. Lincecum SFG 30 -0.7
*Hamels 2014 bWAR: 6.6
Cueto is a trade alternative to Hamels
Others will cost one draft pick and free agent market value at season’s end
It is not in a team’s best interest to go all-in on Hamels
The team that values Hamels the most will be willing to give up the greatest package of players for him

INTRODUCTION TO TRADE BENEFIT FACTOR To measure the mutual benefit of both teams involved, we developed Trade
Benefit Factor (TBF) and Mutual Trade Benefit Factor (MTBF): Non Phillies TBF = Hamels’ Value – Hamels’ Contract + Playoff Bump + WS Bump –
Prospects’ Value Phillies TBF = Hamels’ Contract Relief – Hamels’ Value + Prospects’ Value Mutual TBF =

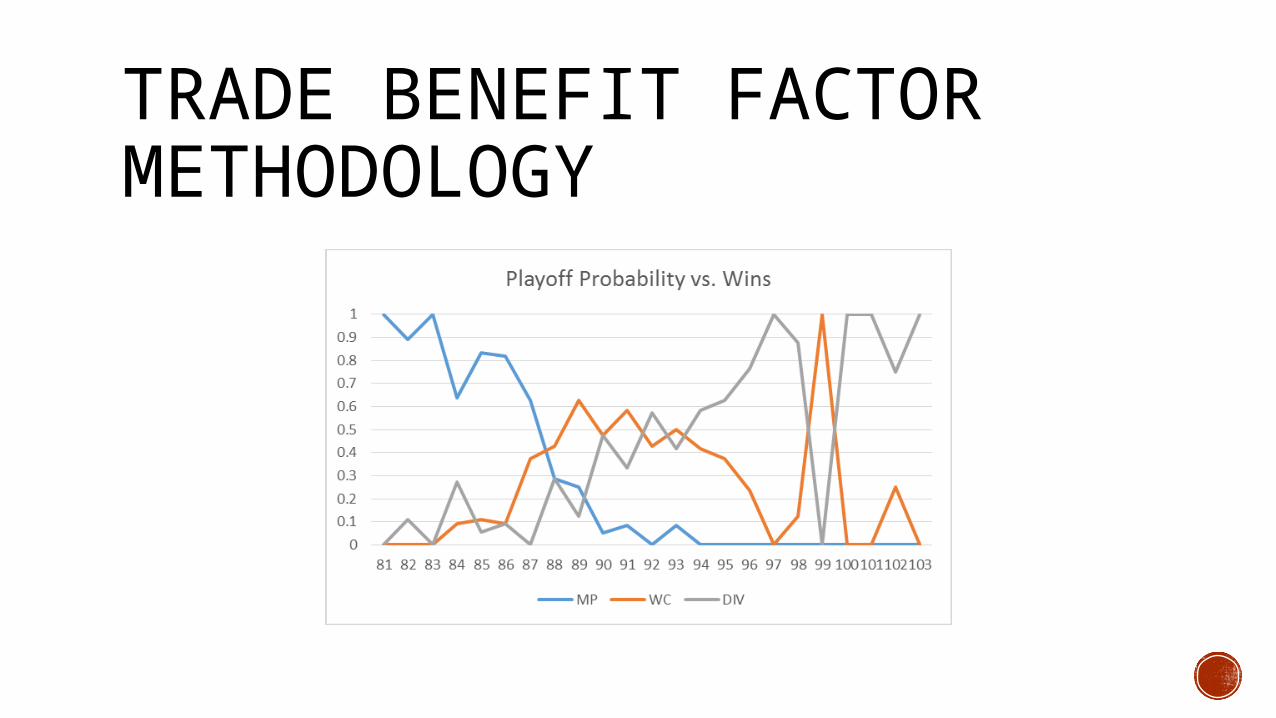
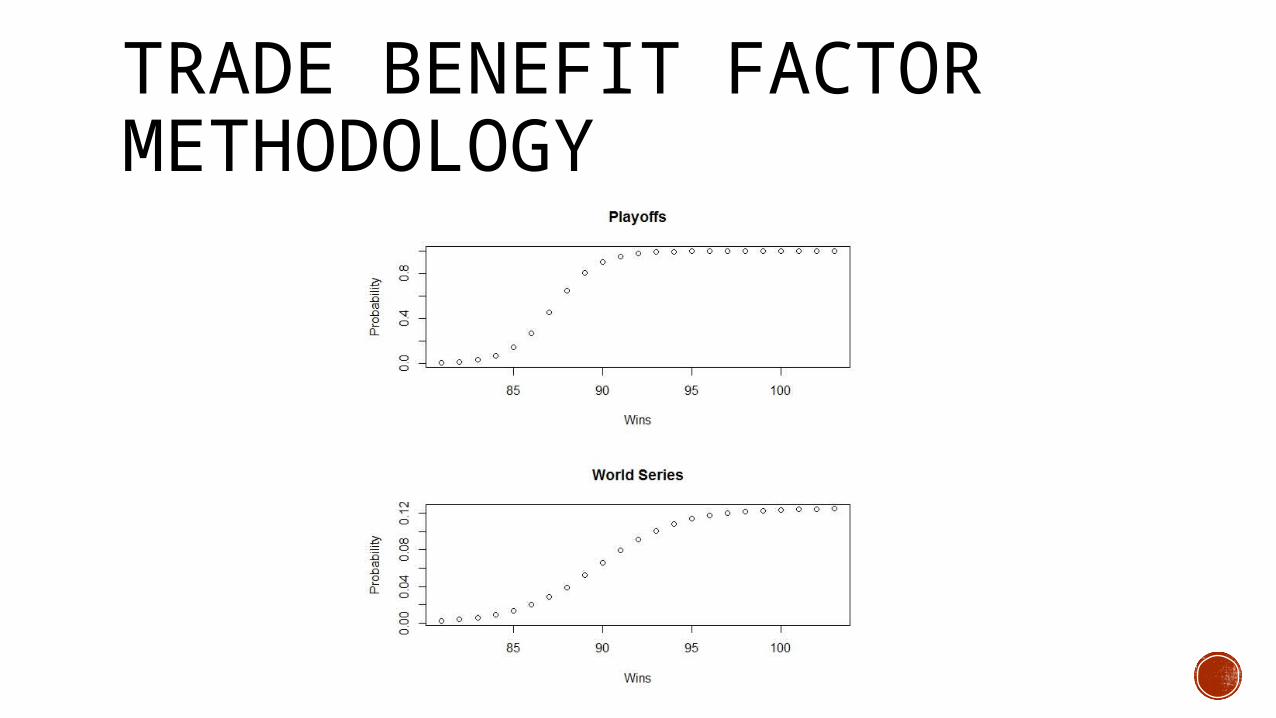
TRADE BENEFIT FACTOR METHODOLOGY Used data from 1996-2014 and logistic regression to develop win curves for
average MLB team accounting for second wild card in each league.
Used Steamer team win total projections from FanGraphs and “stickiness” from Hardball Times to project win totals for MLB teams over next 5 seasons.
Used Forbes’ 2013 revenue data from each team and linear regression model for the 2014-2015 offseason to develop market value of win for each team before accounting for playoffs.
Used info from “Diamonds Dollars: The Economics of Winning in Baseball” by Vince Gennaro to estimate revenue bumps of reaching playoffs, reaching World Series, and winning World Series.
TRADE BENEFIT FACTOR METHODOLOGY
TRADE BENEFIT FACTOR METHODOLOGY
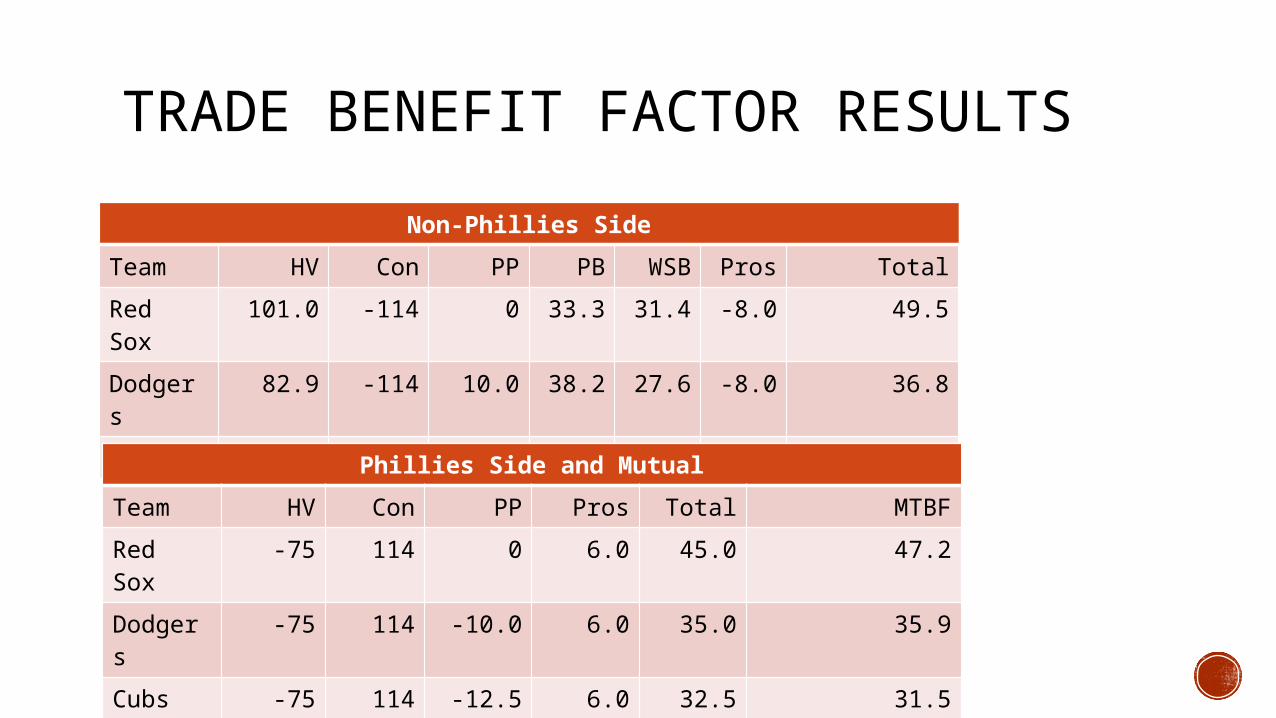
TRADE BENEFIT FACTOR RESULTS
Non-Phillies Side
Team HV Con PP PB WSB Pros Total
Red Sox 101.0 -114 0 33.3 31.4 -8.0 49.5
Dodgers
82.9 -114 10.0 38.2 27.6 -8.0 36.8
Cubs 75.3 -114 12.5 30.5 34.2 -8.0 30.5
Phillies Side and Mutual
Team HV Con PP Pros Total MTBF
Red Sox -75 114 0 6.0 45.0 47.2
Dodgers
-75 114 -10.0 6.0 35.0 35.9
Cubs -75 114 -12.5 6.0 32.5 31.5

WHEN DOES THE TRADE TAKE PLACE? A “perfect” Cole Hamels trade would be completed prior to the start of the
regular season Team receiving Hamels obtains his services for a full season Phillies can develop incoming players Value of a win doubles in July (Dave Cameron, 8/14); good for Phillies, not ideal
for trade partner

PERFECT TRADE SCENARIO #1To Phillies To Red Sox
Mookie Betts, 2B/OFHenry Owens, LHPBlake Swihart, CMatt Barnes, RHP
Cole Hamels, LHPBen Lively, RHP
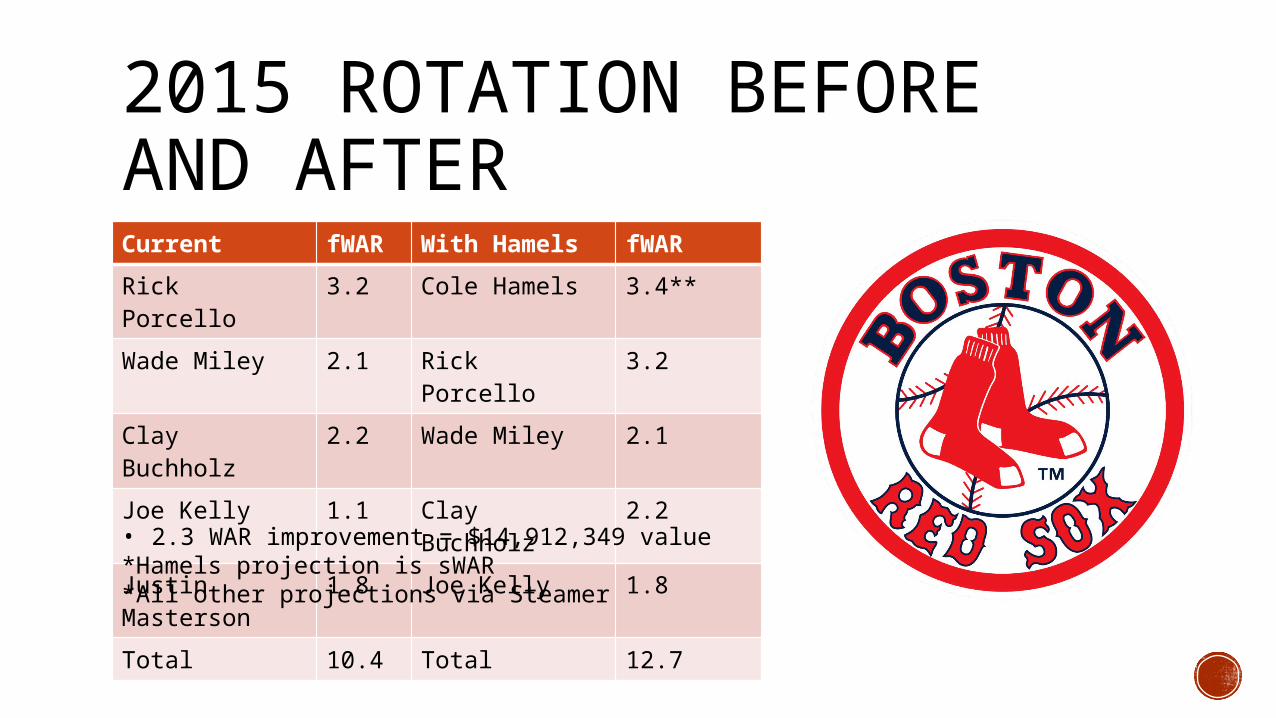
2015 ROTATION BEFORE AND AFTERCurrent fWAR With Hamels fWAR
Rick Porcello 3.2 Cole Hamels 3.4**
Wade Miley 2.1 Rick Porcello 3.2
Clay Buchholz 2.2 Wade Miley 2.1
Joe Kelly 1.1 Clay Buchholz 2.2
Justin Masterson
1.8 Joe Kelly 1.8
Total 10.4 Total 12.7
• 2.3 WAR improvement = $14,912,349 value*Hamels projection is sWAR*All other projections via Steamer

PROJECTING WAR
RoyalsReview.com
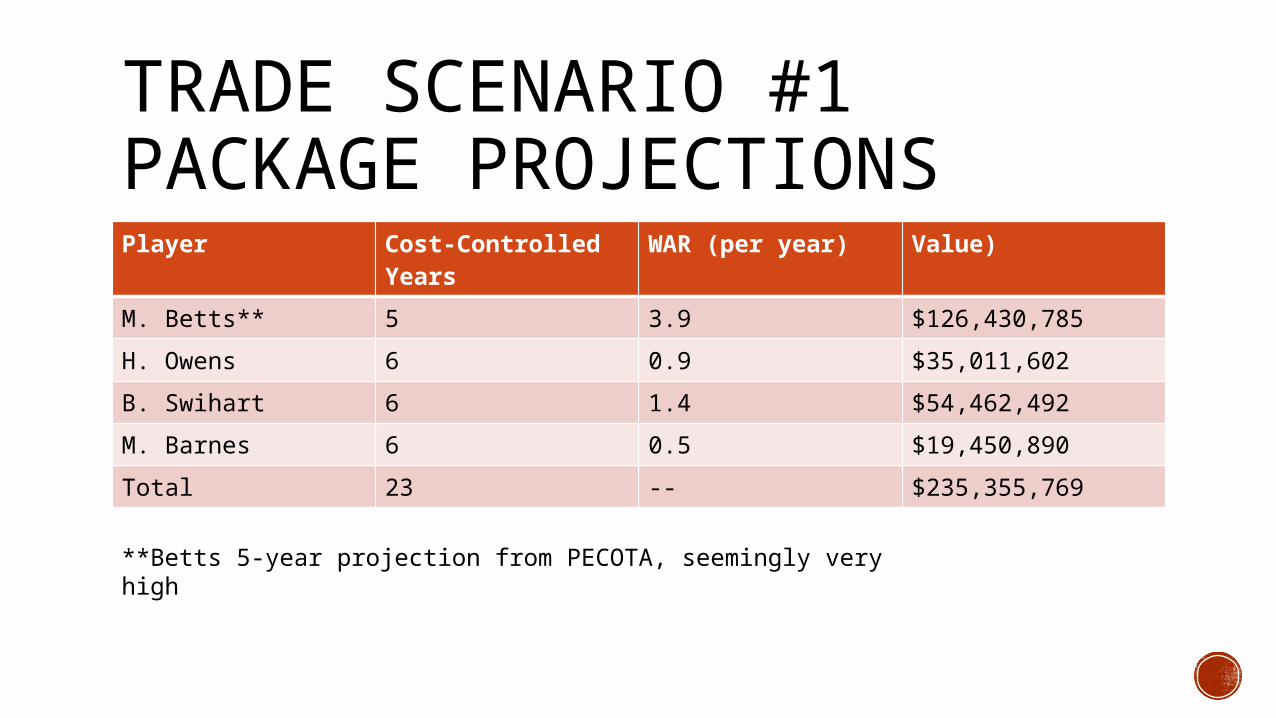
TRADE SCENARIO #1 PACKAGE PROJECTIONSPlayer Cost-Controlled
YearsWAR (per year) Value)
M. Betts** 5 3.9 $126,430,785
H. Owens 6 0.9 $35,011,602
B. Swihart 6 1.4 $54,462,492
M. Barnes 6 0.5 $19,450,890
Total 23 -- $235,355,769
**Betts 5-year projection from PECOTA, seemingly very high

HAMELS WITH RED SOX Benefits from Designated Hitter
Less injury risk as Hamels ages
According to park factors, Fenway Park allows less home runs to both righties and lefties than does Citizens Bank Park
Christian Vazquez graded as the ninth best framer in baseball in 2014, according to Baseball Prospectus’s Framing Runs Added By Count. Ruiz ranked 98th.
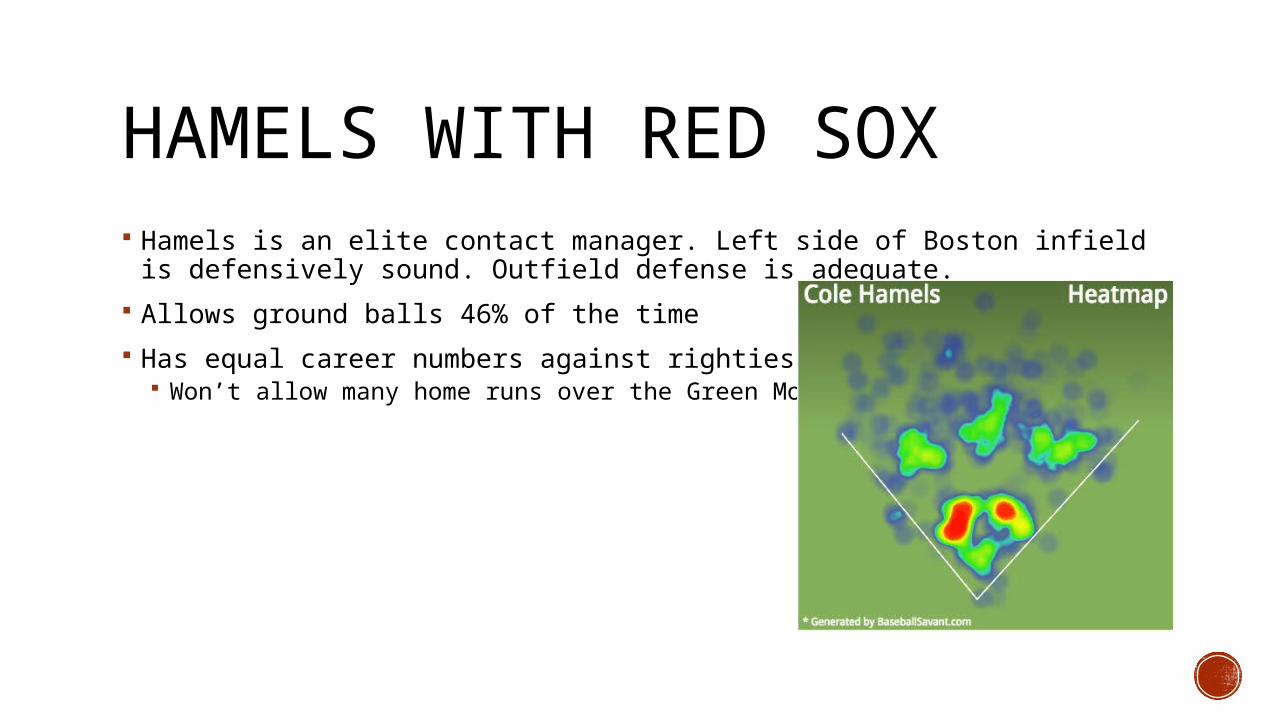
HAMELS WITH RED SOX Hamels is an elite contact manager. Left side of Boston infield is
defensively sound. Outfield defense is adequate.
Allows ground balls 46% of the time
Has equal career numbers against righties and lefties Won’t allow many home runs over the Green Monster

TRADE SCENARIO #1 RISK Mookie Betts was unranked by Baseball Prospectus in 2014. Could be a sign of a
hot season.
Blake Swihart, ranked 17th by Baseball Prospectus, has a 38.9% chance of being a bust, 61.1% chance of being a success (at least an average player by WAR)
Henry Owens, ranked 46th by Baseball Prospectus, has a 79.1% chance of being a bust, 20.9% chance of being a success
Matt Barnes is ranked in the top ten among prospects in the Red Sox system by Baseball Prospectus
*Success: >1.5 WAR per season during 6 cost-controlled seasons
*Bust: <1.5 WAR
*Percentages courtesy of research done by Royals Review

PERFECT TRADE SCENARIO #2To Phillies To Dodgers
Corey Seager, SSJulio Urias, LHPChris Anderson, RHPAustin Barnes, C
Cole Hamels, LHP$10M ($2M/season until 2019)

2015 BEFORE AND AFTERCurrent fWAR With Hamels fWAR
Clayton Kershaw 5.2 Clayton Kershaw 5.2
Zack Greinke 3.2 Cole Hamels 3.4**
Hyun-Jin Ryu 2.4 Zack Greinke 3.2
Brandon McCarthy 2.0 Hyun-Jin Ryu 2.4
Brett Anderson 0.8 Brandon McCarthy
2.0
Total 13.6 Total 16.2
• 2.6 WAR improvement = $16,857,438 value**Hamels projection is sWAR*All other projections via Steamer
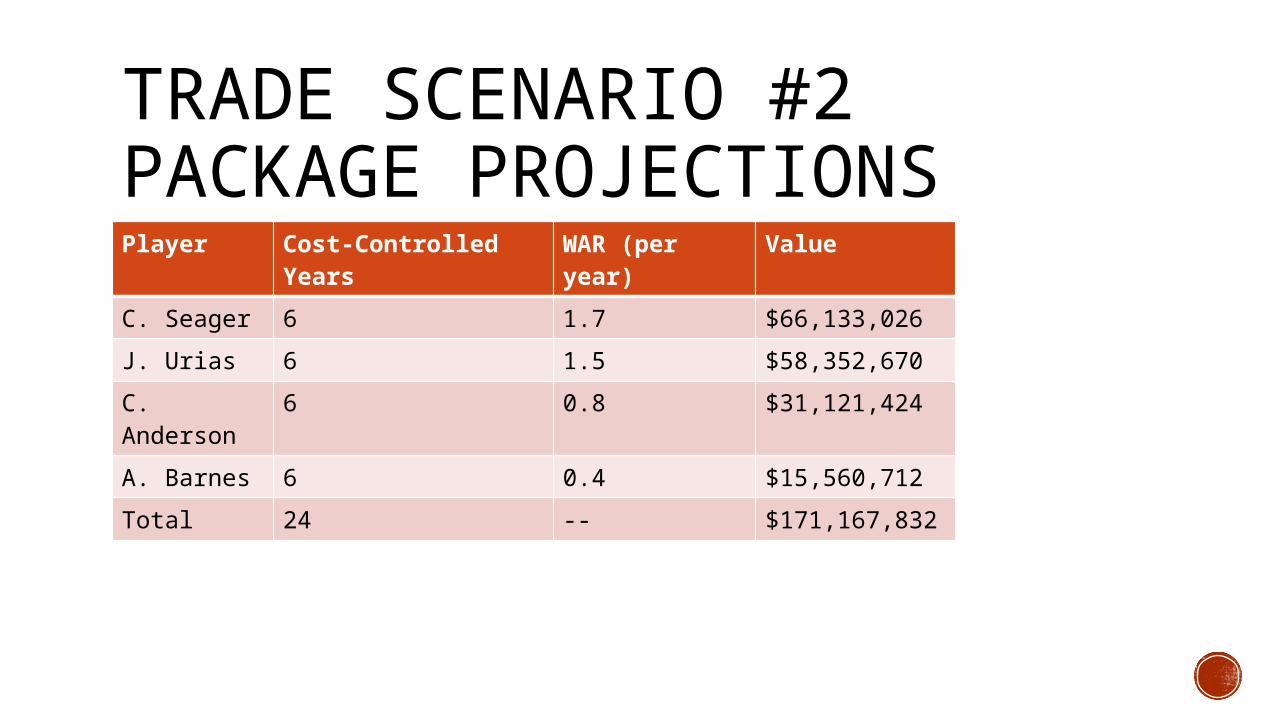
TRADE SCENARIO #2 PACKAGE PROJECTIONSPlayer Cost-Controlled
YearsWAR (per year)
Value
C. Seager 6 1.7 $66,133,026
J. Urias 6 1.5 $58,352,670
C. Anderson
6 0.8 $31,121,424
A. Barnes 6 0.4 $15,560,712
Total 24 -- $171,167,832
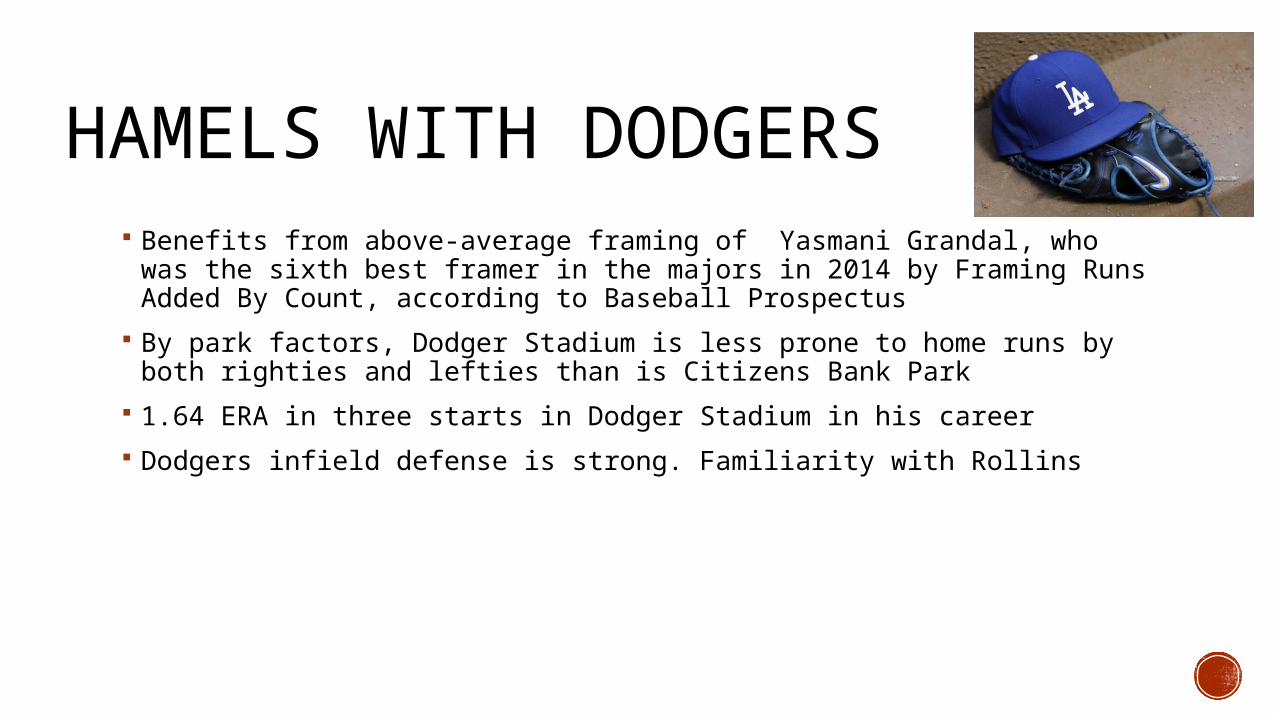
HAMELS WITH DODGERS Benefits from above-average framing of Yasmani Grandal, who was the
sixth best framer in the majors in 2014 by Framing Runs Added By Count, according to Baseball Prospectus
By park factors, Dodger Stadium is less prone to home runs by both righties and lefties than is Citizens Bank Park
1.64 ERA in three starts in Dodger Stadium in his career
Dodgers infield defense is strong. Familiarity with Rollins

HAMELS WITH DODGERS (CONTINUED)

TRADE SCENARIO #2 RISK Corey Seager, ranked 7th by Baseball Prospectus, has a 38.9% chance of being
a bust, 61.1% chance of being a success (at least an average player by WAR)
Julio Urias, ranked 10th by Baseball Prospectus, has a 61.2% of being a bust, 38.9% chance of being a success
Chris Anderson is ranked in the top ten amongst prospects in the Dodgers system by Baseball Prospectus
Austin Barnes is unranked
*Success: >1.5 WAR per season during 6 cost-controlled seasons
*Bust: <1.5 WAR
*Percentages courtesy of research done by Royals Review