diagrams in biology 1 - semantic scholar · diagrams in biology 1 laura perini department of...
TRANSCRIPT

1
Diagrams in Biology1
Laura Perini
Department of Philosophy
Pomona College
Abstract Biologists depend on visual representations, and their use of diagrams has drawn the attention of philosophers, historians, and sociologists interested in understanding how these images are involved in biological reasoning. These studies, however, proceed from identification of diagrams on the basis of their spare visual appearance, and do not draw on a foundational theory of the nature of diagrams as representations. This approach has limited the extent to which we understand how these diagrams are involved in biological reasoning. In this paper I characterize three different kinds of figures among those previously identified as diagrams. The features that make these figures distinctive as representational types, furthermore, illuminate the ways in which they are involved in biological reasoning. 1. Introduction
Judging by their frequent use, diagrams are important tools for biologists. They
are used during the process of research, as biologists plan experiments with flow charts,
and draw models to represent hypotheses for consideration. Diagrams are also frequent
components of biologists’ key communication venues: they often appear in textbooks and
research publications. There are now several studies available that address the use of
diagrams in biology.2 Griesemer (1991), for example, asks whether—and why—
diagrams might be necessary for science. Others have discussed diagrams used to convey
metaphors and facilitate analogical reasoning (Taylor and Blum 1991b, Ruse 1991.)3
Lynch (1988), Maienschein (1991) and Abraham (2003) are all concerned with the use of
1 I would like to thank Richard Burian for many helpful suggestions on earlier versions of this paper. 2 See the collections edited by Taylor and Blum (1991) and Baigrie (1996). 3 Going beyond biology, Nersessian (1992) presents a valuable discussion of Clerk Maxwell’s use of analogical diagrams and their role in conceptual change.

2
diagrams to convey theoretical content. Gilbert (1991) argues that Waddington presented
genetic data in a diagrammatic format typical of embryology in an attempt to synthesize
the two fields. This sample of papers suggests that diagrams play diverse roles in
biological reasoning. We do not, however, understand what it is about diagrammatic
representation that allows them to play these roles.
Larkin and Simon (1987) compare linguistic and diagrammatic representation and
show that while some diagrams are informationally equivalent to linguistic descriptions,
this does not imply computational equivalence. Diagrams can be more efficient
platforms for drawing inferences than informationally equivalent linguistic
representations. Comparison between linguistic and diagrammatic representations,
however, is limited in the extent to which it can clarify why biologists would use
diagrams in biology. Biologists communicate with a variety of non-diagrammatic forms
of visual representations, so understanding why biologists use diagrams requires
understanding why they choose diagrams over non-diagrammatic visual representations.4
Furthermore, since biologists typically use multiple kinds of representations when they
communicate, understanding the role of a diagram often depends on analyzing the other
representations involved; the most important ones to consider are often other kinds of
visual representations. For these reasons, understanding what makes diagrams distinctive
as representations is essential for understanding what roles they play in biological
reasoning, and how they do so. In this paper I characterize representational features of
diagrams. Analysis of the relation between the forms and contents of diagrams will show
there is significant diversity among the diagrams used by biologists, and that the features
4I use ‘visual representation’ as a generic term for external representations like pictures, diagrams, graphs; this is a distinct category from mental representations, including perceptions. I clarify the nature of visual representations in the next section.

3
that distinguish these different types explain why biologists use particular kinds of
diagrams for particular roles in biological reasoning.
2. Beyond simplicity: what diagrams have in common
Diagrams are visual representations, and it will be helpful to start by clarifying
this broader class of representations. Visual representations are external representations
in which some spatial relations in the picture are interpreted, and thus convey content.
Spatial features of a photograph, for example, are interpreted as representing spatial
features of a scene. Visual representations constitute a broad category with a lot of
variety, because spatial relations in an image can refer to spatial properties (like shape) or
to other kinds of properties—which need not be visible. In line graphs, for example,
spatial relations are used to refer to relations between properties. Additional visible
features in a picture, such as color, may also convey information. The variety of kinds of
pictures is thus due to a variety in form-content relations. In order to understand a
particular image, you must view its form, and also apply appropriate interpretive
conventions to what you see, in order to relate the visible features of the picture to what it
represents (Perini 2004). For example, you must interpret grey colors differently in a
black and white photograph than in a color photograph.
Most pictures do not represent all aspects of their subject matter. There are some
odd exceptions, such as an image representing itself, but most pictures remain
noncommittal about some properties of their subject matter (Lopes 1995). For example,
color photographs represent the features of an object visible from a particular angle,
omitting information about the visible features on the opposite side, and information

4
about the object’s non-visible features. Similarly for black and white photos, except that
colors are not represented. Diagrams are not distinctive among visual representations in
that they are selective about the properties they represent.
However, there is something distinctive about the form-content relations of
diagrams; they share a feature characterized by Goodman in Languages of Art. Diagrams
are relatively non-replete, which means that compared to other pictures, relatively few
visible features are used to convey content (Goodman 1976). A typical line graph is
relatively non-replete, because only the position of the line, and not its width or darkness,
conveys content. A naturalistic pencil drawing is relatively replete, because the position,
width, and darkness of pencil marks contribute to the content of the picture. Because
diagrams are relatively non-replete, they represent fewer properties relative to non-
diagrammatic images. However, diagrams are not less accurate as a result: Hall (1996)
shows that they can be accurate, and that non-diagrammatic images can be inaccurate.
For visual representations, as for other types of representations, omission and accuracy
are separable.
Low relative repleteness is a feature that all diagrams share. Since there is no
sharp line between high and low relative repleteness, there will be some visual
representations whose status is indeterminate. This does not interfere with the usefulness
of characterizing diagrams as relatively non-replete. Identifying this feature provides a
way to characterize what all the figures that have been identified and studied as diagrams
have in common. Consider the diversity involved: Maienschein (1991) examines
Wilson’s cell diagrams, which represent the structures of various components of cells,
while Abraham (1993) includes a discussion of McCullock and Pitts’ diagram of the
5
functional connections involved in neural firing (Figures 1, 2). Both the appearance and
the subject matter of these images are quite different. One feature they share is a notable
simplicity of visible form, compared to pictures like photographs and naturalistic
renderings. The fact that figures identified as diagrams have a visibly simple and spare
form might explain why all these particular figures were chosen as case studies of
diagrammatic representation. Simplicity of appearance, however, offers no insight into
diagrams as representations. Understanding diagrams as having form-content relations
that are all relatively non-replete clarifies the problem at hand: explaining why biologists
use diagrams requires understanding the advantages of relatively non-replete figures.
Figures 1, 2 about here
Prior work on diagrams shows that this project will require explanatory resources
beyond relative repleteness. Michael Lynch studies figures that pair a diagram with a
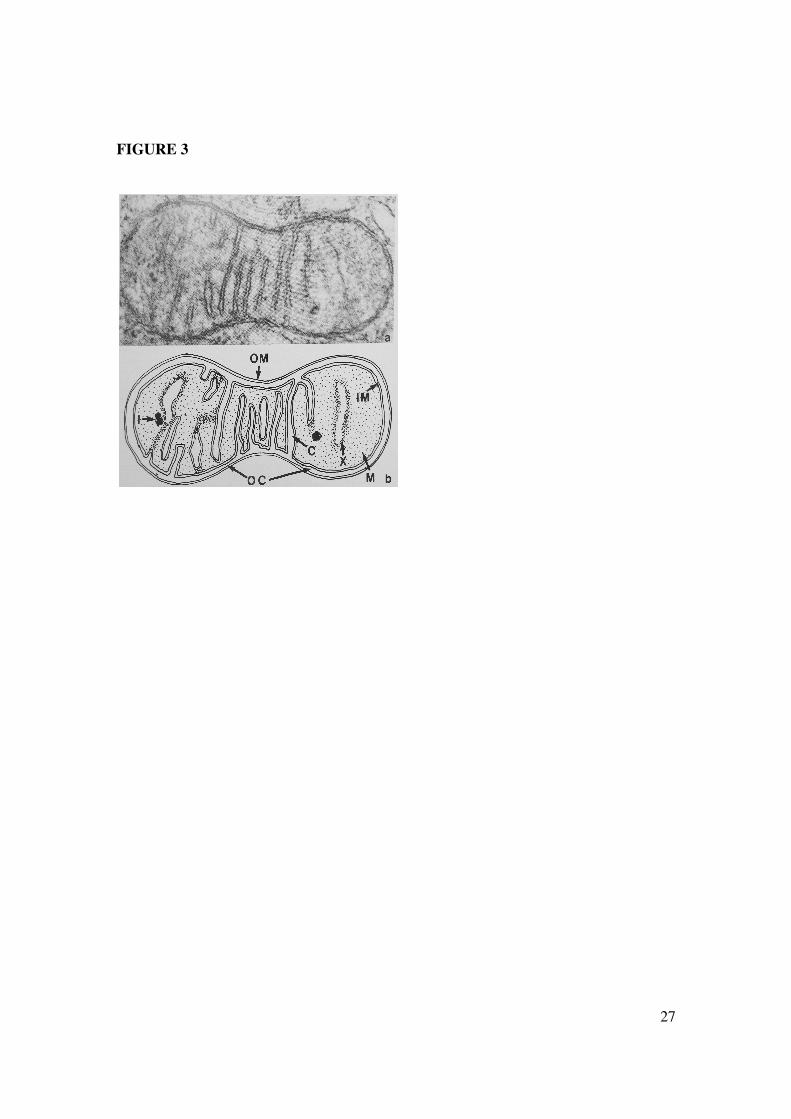
non-diagrammatic figure, an electron micrograph (Figure 3). The micrograph is an
image of a particular sample, and represents the structure of an individual subcellular
structure, a mitochondrion, in detail. The diagram conveys less information about the
detail of the structure. For example, where the micrograph represents the width of
membranes precisely as detected by the electron microscope, the diagram does not,
making some areas that look different in the micrograph appear similar in the diagram.
Lynch argues that the diagram does not merely leave out some information conveyed by
the micrograph. Rather, the diagram is a means to convey content that is distinctively
theoretical compared to the micrograph (Lynch 1988). So the diagram is not used simply
to select out some particular details from the full detail represented by the micrograph. It
is not a matter of just ‘saying less’ with a figure of low relative repleteness. Lynch’s

6
discussion suggests that the two figures convey different kinds of content, and not just
different amounts.5
Figure 3 about here
Thus, although the concept of repleteness allows for clarifying the questions we
need to ask about why biologists use diagrams, the explanatory role low relative
repleteness can play in this project is limited. It cannot explain differences among
diagrams (as will be seen below, those go beyond differences in repleteness).
Furthermore, on its own the fact that diagrams are relatively non-replete does not explain
why biologists would use diagrams. Such figures convey less content compared to
relatively replete figures, but there is no general advantage to communicating less
content rather than more. Clarification of the feature diagrams share thus indicates that
explaining reasoning with diagrams will depend on further analysis of diagrams. Below I
describe three important types of diagrams in biology, and the distinctive features of
those types explain their use in biology.6
3. Pictorial diagrams
Consider Figure 4, a figure that combines two forms of representation. My aim is
to characterize a particular type of diagram (superimposed on a non-diagrammatic image)
and show how the features of that type of diagram explain why the diagrammatic form is
combined with the other image in the figure.
Figure 4 about here
5 Maienschein’s (1991) study of E.B. Wilson’s diagrams also shows that diagrams are not used just to reduce the amount of content conveyed. 6 For a detailed account of the semiotic analysis that grounds the distinction among diagrammatic types I report here, see Perini, forthcoming a.

7
Figure 4 is the result of a study of the structure of a particularly important
biological enzyme complex, the ATP synthase. This complex catalyzes the formation of
ATP, the energy currency of the cell, in the last stage of oxidative phosphorylation.
Because it plays such a key role in making energy available for cell processes, and
because the structure of the enzyme would provide some insight into how the ATP
synthase catalyzes the reaction, scientists were keen to get any information they could.
One early step was the Boekema et al (1986) study. The authors isolated the complex
and used electron microscopy to generate an image of the isolated particles, which
represents individual synthase particles as white areas on a dark background (Figure 5).
However, the light spots corresponding to individual particles vary significantly in shape.
This meant that the authors could not derive information about the shape of the particle
from the appearance of individual spots. In order to get more precise and accurate
information about particle shape, they oriented and scanned individual spots, then applied
a mathematical analysis to the optical signals derived from multiple spots, in order to get
an average of their shape.
Figure 5 about here
The results were presented in Figure 4, which involves two different kinds of
images superimposed on one another. The first is the shading that ranges from light to
dark, which represents the signal intensity of the averaged spots. Spatial relations of the
figure are used to represent spatial relations of the signal intensities from the analysis,
and the exact degree of lightness of the image correlates with the precise strength of the
signal. The figure also includes a superimposed representation that is less replete than
the first. Each topo line represents the spatial location of one particular value of signal

8
intensity. The brightness and width of the topo lines are not informative. The positions
of the topo lines convey significant detail, because they track precisely the location of
specific signal intensities in two-dimensional space. Because each line represents a
particular value, relative distance between the lines shows the steepness of the drop-off in
signal toward the edge of the particle. The diagrammatic topo lines therefore carry less
than the full information derived from the mathematical analysis.
Why did the authors superimpose a diagram over a more replete representation of
the same structure? The topo lines are a means to express the results that were the
ultimate aim of this study—information about the cross-sectional shape of the ATP
synthase complex. That information is derived not from the particular intensity of the
signal in any part of the complex, but from the drop-off of signal at the complex’s
boundaries. Human visual perception is not able to distinguish the kind of differences in
light intensities needed to reliably pick out the outline shape of the complex from the full
results, as represented in the gradual shading. However, the topo lines convey that drop-
off very clearly—they are close together where the drop-off in signal intensity is rapid,
which is at the edge of the complex. Thus the diagrammatic representational scheme
leaves out some information (the smooth gradient information about how the signal drops
off) and conveys just that part of the mathematical output that is relevant to the goal of
the study: it shows where the drop-off occurs, and thus represents the outline shape of the
complex.
There are three things to note here. First, the topo lines drop out some
information relative to the shaded form, but they still represent a specific shape: the
precise location of the topo lines are used to represent the details of the complex’s shape.
9
The move to the diagram in this case is a move from one type of visual representation
that conveys a great deal of detailed information, to another type of visual representation
that conveys less information, but the information it conveys is both detailed and limited
to the content of interest: the conclusion of the study, and nothing more. Second, the
value of the topo lines does not merely result from the fact that extraneous information is
deleted (so the viewer’s attention is focused on the information relevant to the study); it
represents the drop-off in a way that is reliably comprehended by human interpreters of
the visible form of the image, so it is a more effective means of conveying the results
than the more replete representation.
Finally, in this case there is a visible similarity between the less and the more
abstract images superimposed in the figure. This raises a question about whether
reasoning involving visual representations in some way depends on visual matching—
recognizing a straightforward visual similarity, such as similarity of outline shape—
between the two figures. Later examples will show that visual matching is not required
in reasoning with visual representations.7
4. Compositional diagrams
Some diagrams are compositional: they are built out of discrete atomic
characters. Written sentences are compositional—composed of letters, spaces and
punctuation marks. In compositional visual representations, spatial relations among
atomic characters are interpreted as representing relations among the referents of the
atomic characters. Like words and numerals, however, the atomic characters of
7 Giere (1996) discusses reasoning with diagrams in geology, and stresses the fact that visual matching between diagrams plays a role in explaining why one supports another. My goal is not to show that visual matching is always irrelevant to reasoning with figures, but to show that it is not necessary.

10
compositional diagrams need bear no resemblance to their referents, nor convey any
information about them; they can function simply as labels. Simple chemical diagrams
have this feature. Consider diagrams made with the following atomic characters: filled
circles, which refer to hydrogen atoms; open circles, which refer to oxygen atoms, and
straight lines, which refer to inter-atomic bonds. Spatial relations are interpreted in the
following way: lines between two circles represent a bond between the two atoms
denoted by the circle; angles between lines represent relative position of the atoms
connected by those lines. This simple representational system will allow for
representation of the structure of compounds like water and hydrogen peroxide, because
the meaning of the diagrams produced are a function of the meaning of the atomic
characters and the interpreted spatial relations among them.
Figure 6 here (or lower)
For a more complex case that will allow for discussion of how compositional
figures are involved in biological argumentation, consider Figure 6. This diagram is a
representation of the mechanism by which the ATP synthase catalyzes the formation of
ATP from precursors ADP and Pi. The complex includes three chemically identical
subunits. The subunits can take on three different structural conformations. According
to the binding change model, at any given time each of the subunits is in a different one
of the three conformations. The conformation of the subunit determines whether, and
how tightly, it binds the precursors and products of the reaction. The loose conformation
has a moderate affinity for the precursors ADP and Pi, so they will bind that site. The
tight conformation binds ADP and ATP so strongly that neither is released; furthermore,
when bound in this way ADP and Pi react to form ATP. ‘Open’ has such a low affinity
11
for these compounds that neither bind. All three subunits transition at the same time,
from one conformation to the next. Energy input drives the conformation changes, and
the formation of ATP happens as a result of those changes. The subunit in the loose
conformation binds the precursors, and when its conformation changes to tight, the
precursors react to form ATP. After another transition to the open conformation, ATP is
released, since in that conformation the subunit can’t bind anything.
The diagram represents this model through the use of atomic characters, such as
the wedge shapes, arrows, and linguistic characters. The three different wedge shapes
refer to the loose, open, and tight conformations, respectively. Spatial relations among
the atomic characters represent relations among the referents of those characters.
Contiguity of the wedge shapes indicates that the enzyme complex has subunits in those
particular conformations. Arrows between the different combined wedges refer to
transitions between stages in the mechanism, in which chemicals are bound or released,
energy is input, and the subunits change shape. Note that the atomic characters of this
system could be used to make a different diagram, expressing a different model of the
enzyme’s function. For example, a diagram with three L wedges together, then three T
wedges, then three O wedges would represent a mechanism in which all the subunits are
in the same conformation, and they all transition together to the next conformation.
The diagram does not represent intrinsic features of the referents of the atomic
characters. In this example, the wedge shapes do not represent the shape of the different
subunit binding conformations. Rather, they simply denote the different conformations,
which are named for their functional characteristics rather than spatial features. The fact
that the forms of atomic characters don’t map on to features of their referents means that
12
they can function simply as labels. In such a system, atomic characters can refer to the
elements of a system—even when those elements are very complex—without referring to
their intrinsic properties.
The result is a figure that represents relations among the referents of the atomic
characters, and is noncommittal about many—or all—of the intrinsic properties of those
referents. This is the point at which we should ask, why do biologists use a form of
representation that is noncommittal about such features? This type of selectivity in the
content of the figure is relevant to biological reasoning in two important ways. First,
compositional diagrams convey the kind of information that plays an important
explanatory role in biology. Cummins (1975) calls this functional analysis, in which a
feature of a system is explained in terms of its component parts. Bechtel and
Richardson’s (1992) discussion of research in biology make it clear that the relations
among component parts of a biological system often are key to explaining that system.
While both the identities of component parts and relations among those components are
integral to the functional explanation, many properties of the system components are not
relevant to explaining the capacity of the system. Compositional figures use atomic
characters to refer to component parts (like subunits in particular conformations). Spatial
relations among atomic characters are interpreted as referring to relations among the
referents of the atomic characters, so that reference to the relations among the
components is built into the representation. For this reason, the two kinds of information
that make these models explanatorily relevant are presented in one figure: identification
of important component parts of a system and of important relations among those
components. The visual formatting of the diagram provides a way to refer to system
13
components in such a way that their relationship to the system itself is also represented
(Perini 2005a).
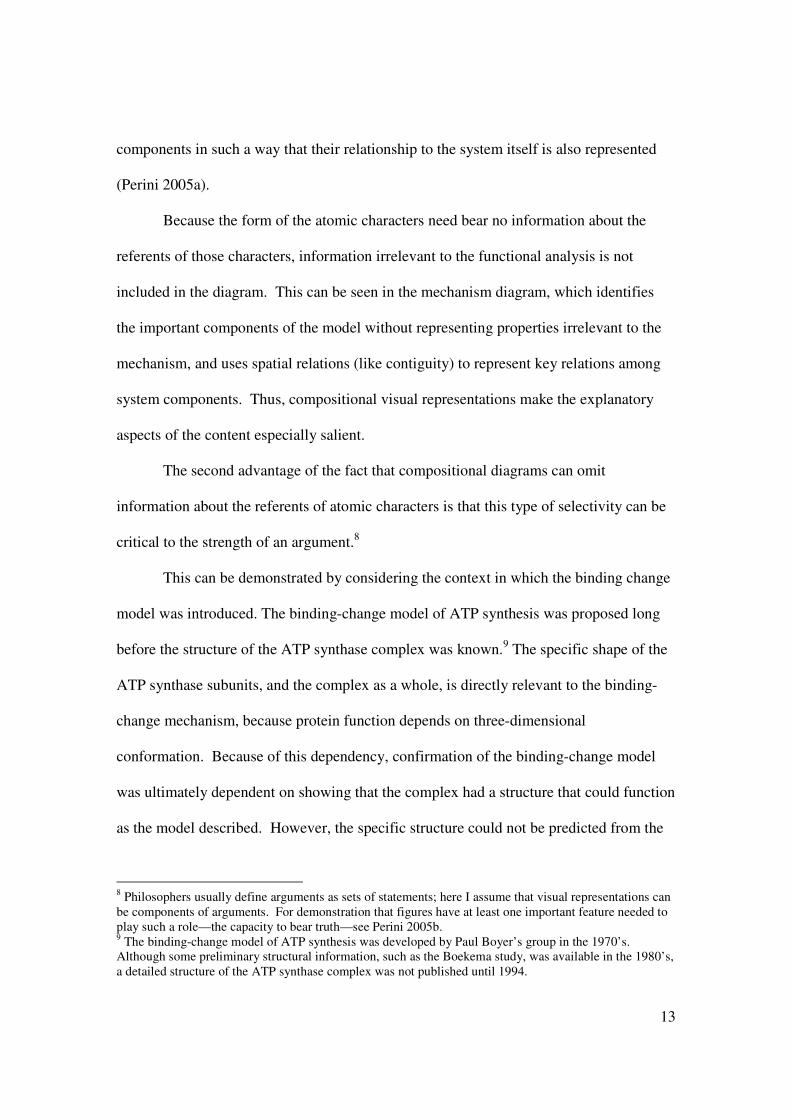
Because the form of the atomic characters need bear no information about the
referents of those characters, information irrelevant to the functional analysis is not
included in the diagram. This can be seen in the mechanism diagram, which identifies
the important components of the model without representing properties irrelevant to the
mechanism, and uses spatial relations (like contiguity) to represent key relations among
system components. Thus, compositional visual representations make the explanatory
aspects of the content especially salient.
The second advantage of the fact that compositional diagrams can omit
information about the referents of atomic characters is that this type of selectivity can be
critical to the strength of an argument.8
This can be demonstrated by considering the context in which the binding change
model was introduced. The binding-change model of ATP synthesis was proposed long
before the structure of the ATP synthase complex was known.9 The specific shape of the
ATP synthase subunits, and the complex as a whole, is directly relevant to the binding-
change mechanism, because protein function depends on three-dimensional
conformation. Because of this dependency, confirmation of the binding-change model
was ultimately dependent on showing that the complex had a structure that could function
as the model described. However, the specific structure could not be predicted from the
8 Philosophers usually define arguments as sets of statements; here I assume that visual representations can be components of arguments. For demonstration that figures have at least one important feature needed to play such a role—the capacity to bear truth—see Perini 2005b. 9 The binding-change model of ATP synthesis was developed by Paul Boyer’s group in the 1970’s. Although some preliminary structural information, such as the Boekema study, was available in the 1980’s, a detailed structure of the ATP synthase complex was not published until 1994.
14
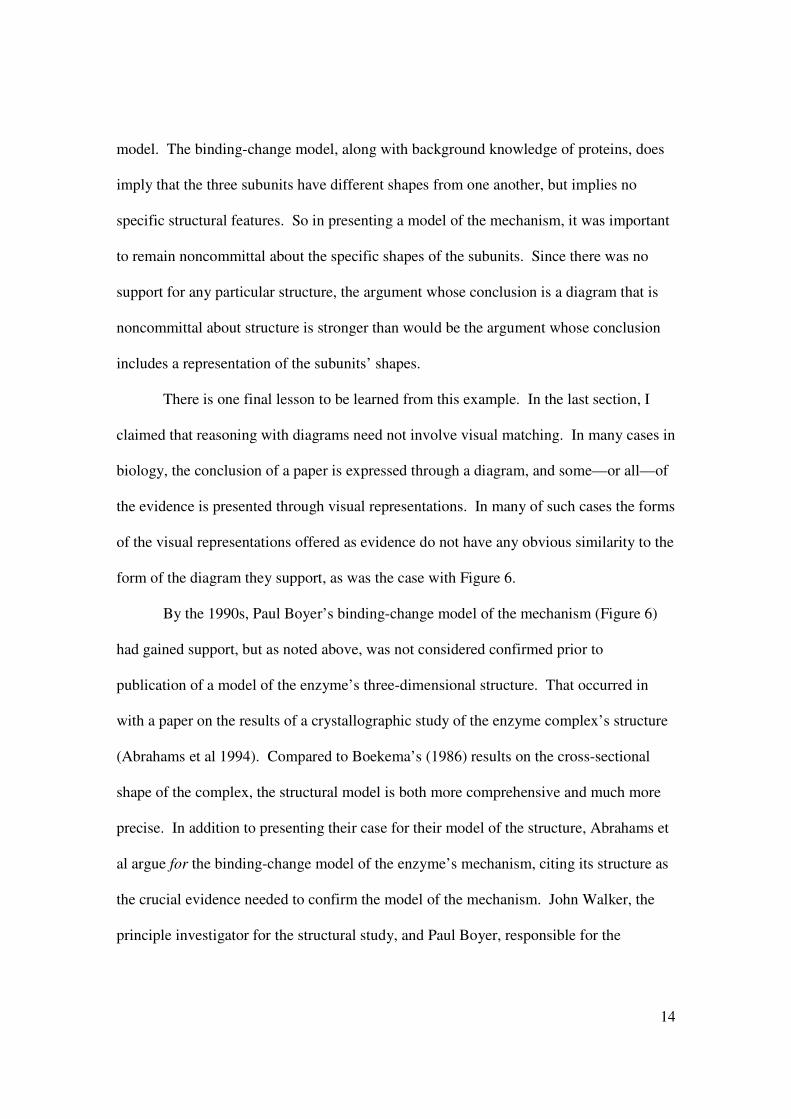
model. The binding-change model, along with background knowledge of proteins, does
imply that the three subunits have different shapes from one another, but implies no
specific structural features. So in presenting a model of the mechanism, it was important
to remain noncommittal about the specific shapes of the subunits. Since there was no
support for any particular structure, the argument whose conclusion is a diagram that is
noncommittal about structure is stronger than would be the argument whose conclusion
includes a representation of the subunits’ shapes.
There is one final lesson to be learned from this example. In the last section, I
claimed that reasoning with diagrams need not involve visual matching. In many cases in
biology, the conclusion of a paper is expressed through a diagram, and some—or all—of
the evidence is presented through visual representations. In many of such cases the forms
of the visual representations offered as evidence do not have any obvious similarity to the
form of the diagram they support, as was the case with Figure 6.
By the 1990s, Paul Boyer’s binding-change model of the mechanism (Figure 6)
had gained support, but as noted above, was not considered confirmed prior to
publication of a model of the enzyme’s three-dimensional structure. That occurred in
with a paper on the results of a crystallographic study of the enzyme complex’s structure
(Abrahams et al 1994). Compared to Boekema’s (1986) results on the cross-sectional
shape of the complex, the structural model is both more comprehensive and much more
precise. In addition to presenting their case for their model of the structure, Abrahams et
al argue for the binding-change model of the enzyme’s mechanism, citing its structure as
the crucial evidence needed to confirm the model of the mechanism. John Walker, the
principle investigator for the structural study, and Paul Boyer, responsible for the

15
binding-change model, shared half of the Nobel Prize in Chemistry for these
contributions in 1997.10
Figure 7 here (or lower)
Figure 7 is a representation of the structure of the C-terminal ends of the proteins
making up the subunits of the ATP synthase complex. The overall structure of the
complex is sort of like a tangerine, with a central core and six protein subunits arranged
around this core. The three catalytic β subunits, in gold, are distributed evenly around the
core. The diagrams of the models for the ATP synthase structure (for example, Figure 7)
and the binding-change model (Figure 6) look completely different. Not only are they
different in appearance, they involve quite different types of form-content relations. In
Figure 7, ribbon-like shapes represent protein chains, and the spatial features of the image
are used to represent spatial features among the protein chains of the complex. The
diagram of the binding-change model, on the other hand, uses spatial relations to
represent transitions over time, and mere co-location in the complex—not contiguity or
other spatial relations. These two diagrams do not relate to each other on one coherent
set of dimensions. The reasoning involved in taking images like Figure 7 as support for
the model expressed by Figure 6 must be a more complicated matter than perceptual
comparison.
So how does Figure 7 support the binding-change model? Recall that the
binding-change model is non-committal about aspects of the ATP synthase mechanism,
including the specific way that the structure of the complex instantiates that mechanism.
The binding-change model doesn’t imply a particular structure, but any enzyme that has
10 Jens Skou received the other half, for the first discovery of an ion-transporting enzyme, the Na+ K+ -ATPase.

16
the capacity to synthesize ATP in that way must have a structure. There are relevant
theoretical commitments in the background: according to contemporary biochemistry, a
protein’s functional capacities are determined by its three-dimensional structure. The
binding-change model, along with background knowledge about the relation between
protein structure and function, has an important implication for the structure of the
complex. According to the model, the three subunits will always be in different
functional states. According to background knowledge, protein function is determined by
three-dimensional structure. Together these imply that the three subunits will always be
in different conformations from each other, and that in turn implies that the complex will
by asymmetric in shape.
Figure 7 is a visual representation of the complex’s structure, in which spatial
relations in the figure represent spatial features of the complex. For this reason, Figure 7
can be used to evaluate the binding-change model, by looking for asymmetry in the
diagram of the structure. This evaluation requires a visual abstraction on the structure
diagram, because it is the generic property of asymmetry, rather than the specific shape
properties, that is relevant to the binding-change model. The evidential reasoning
involved in understanding Figure 7 as support for Figure 6 does not involve any
perceptual matching between the two figures. Visible similarity is not necessary
reasoning with visual representations.
5. Schematic drawings
A third kind of diagram is distinct from pictorial and compositional diagrams.
Schematic drawings do not represent specific properties due to interpretation of the

17
details of their visible form, as is the case with pictorial diagrams. Unlike compositional
diagrams, they are not composed of atomic characters, which can function like mere
labels, simply denoting referents without representing the intrinsic properties of their
referents. In schematic drawings, relatively generic visual features like contiguity,
inside/outside, etc. are used to represent features that are themselves generic. As a result,
schematic drawings abstract away from the particular properties of individuals, and
instead represent more generic features.
Figure 8 here or lower
Figure 8 is a detail from a figure in a college-level biology textbook (Purves et al
1995). The arrow points from part of a diagram of an animal cell—that representing its
nucleus—to an electron micrograph of a nucleus, directing students to relate the two
different kinds of images. The images do not offer a simple visual match; the overall
shape of the nucleus in each is visibly different, as is the relative position of the darker
area within the nuclear envelope (representing the nucleolus). The pairing of the images
thus prompts two questions: why are both included, and how do students comprehend the
relation between the two?
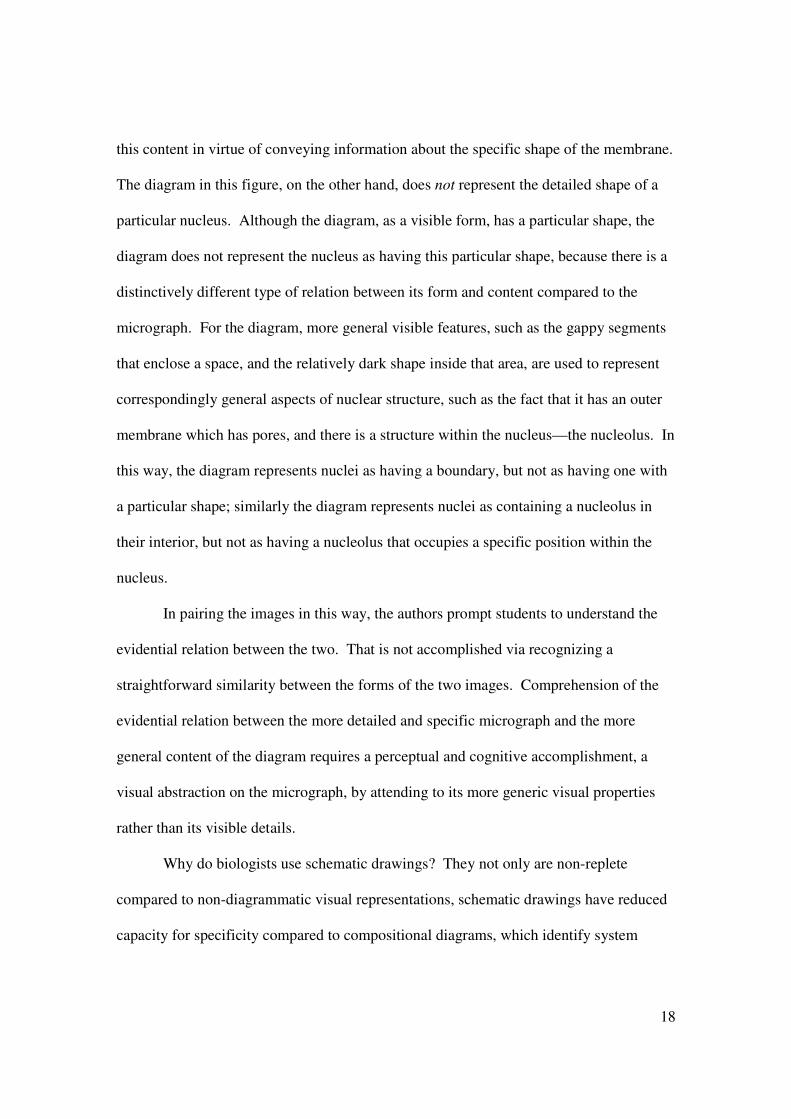
While the electron micrograph is much more replete than the diagram, the key
difference between the two is in type of content each conveys. The electron micrograph
is an image of a particular nucleus, produced through a detection technique that correlates
the specific form of the image to the specific structure of the biological material that was
scanned. A visual representation which uses specific visible details to convey content
about specific detailed properties does convey content about the more generic features of
nuclear structure, such as that it is bounded by a membrane, but the micrograph conveys
18
this content in virtue of conveying information about the specific shape of the membrane.
The diagram in this figure, on the other hand, does not represent the detailed shape of a
particular nucleus. Although the diagram, as a visible form, has a particular shape, the
diagram does not represent the nucleus as having this particular shape, because there is a
distinctively different type of relation between its form and content compared to the
micrograph. For the diagram, more general visible features, such as the gappy segments
that enclose a space, and the relatively dark shape inside that area, are used to represent
correspondingly general aspects of nuclear structure, such as the fact that it has an outer
membrane which has pores, and there is a structure within the nucleus—the nucleolus. In
this way, the diagram represents nuclei as having a boundary, but not as having one with
a particular shape; similarly the diagram represents nuclei as containing a nucleolus in
their interior, but not as having a nucleolus that occupies a specific position within the
nucleus.
In pairing the images in this way, the authors prompt students to understand the
evidential relation between the two. That is not accomplished via recognizing a
straightforward similarity between the forms of the two images. Comprehension of the
evidential relation between the more detailed and specific micrograph and the more
general content of the diagram requires a perceptual and cognitive accomplishment, a
visual abstraction on the micrograph, by attending to its more generic visual properties
rather than its visible details.
Why do biologists use schematic drawings? They not only are non-replete
compared to non-diagrammatic visual representations, schematic drawings have reduced
capacity for specificity compared to compositional diagrams, which identify system

19
components and represent interrelations among them with precision. Schematic drawings
also have a reduced capacity for detail compared to diagrammatic pictorial
representations. Why, then, are they used so frequently in textbooks and research
materials?
The schematic drawing provides a way to communicate about generic properties
while not asserting that those properties are instantiated in a particular way. The ability
to do that is crucial in a science like biology, which frequently requires communication
about types of things that vary in their details, though they are the same in terms of more
generic properties (Perini, forthcoming b). Biologists face this issue when
communicating about almost any sort of biological structure, from organelles to
individual organisms. Biologists often work with data in the form of relatively replete
visual representations of biological forms—electron micrographs, photographs, etc.
These images provide information about individual cases; they play an important
evidential role. However, they are not effective means to express generalizations about
structures that vary from individual to individual. The problem is that with images like
electron micrographs and photographs, the visible details of the image convey content
about the detailed properties of the particular individual pictured in the figure. Schematic
drawings convey information about a class by conveying content about higher-order
properties all its members share, while remaining silent about the detailed properties
which vary among the members. Though compared to the other types of diagrams,
schematic drawings lack capacity for detail and precision, this form of representation is
well-suited to convey information that generalizes over objects that differ in terms of
specifics, but share higher-order features.
20
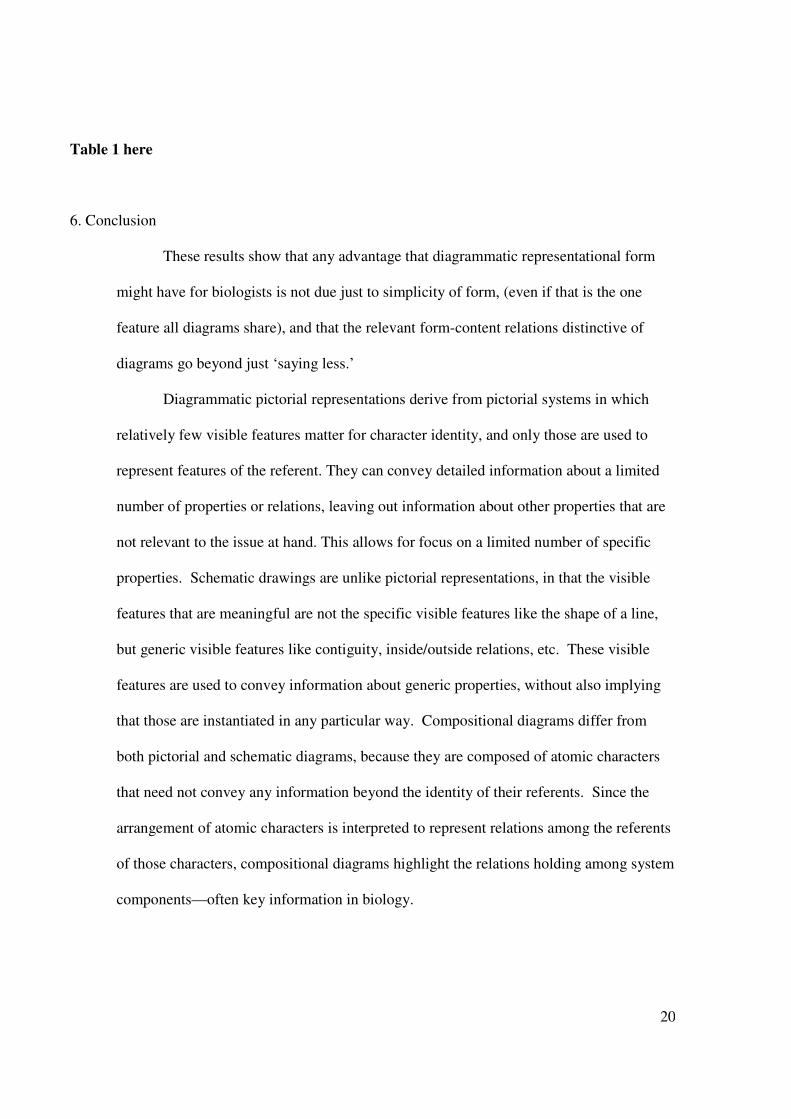
Table 1 here
6. Conclusion
These results show that any advantage that diagrammatic representational form
might have for biologists is not due just to simplicity of form, (even if that is the one
feature all diagrams share), and that the relevant form-content relations distinctive of
diagrams go beyond just ‘saying less.’
Diagrammatic pictorial representations derive from pictorial systems in which
relatively few visible features matter for character identity, and only those are used to
represent features of the referent. They can convey detailed information about a limited
number of properties or relations, leaving out information about other properties that are
not relevant to the issue at hand. This allows for focus on a limited number of specific
properties. Schematic drawings are unlike pictorial representations, in that the visible
features that are meaningful are not the specific visible features like the shape of a line,
but generic visible features like contiguity, inside/outside relations, etc. These visible
features are used to convey information about generic properties, without also implying
that those are instantiated in any particular way. Compositional diagrams differ from
both pictorial and schematic diagrams, because they are composed of atomic characters
that need not convey any information beyond the identity of their referents. Since the
arrangement of atomic characters is interpreted to represent relations among the referents
of those characters, compositional diagrams highlight the relations holding among system
components—often key information in biology.

21
In their introduction to a special volume in biological diagrams, Taylor and Blum
(1991) raise a question about whether there is something significant about the
diagrammatic form in general that explains the use of diagrams, or whether only
particular diagrammatic forms are relevant to understanding their use in biology. These
results help explain why Taylor and Blum, with a volume of illuminating case studies in
hand, would express puzzlement over whether diagrams share some feature that explains
their use by biologists. It is not just that there are significant differences among types of
diagrams. There is not a sharp line distinguishing diagrams (characterized as relatively
non-replete visual representations) and non-diagrammatic figures. Although the line
between relatively replete and non-replete images is obviously not sharp, this is not a
trivial result. The reason is that for some diagrams—pictorial diagrams—the only
difference from non-diagrammatic visual representations is in terms of degree of
repleteness. They share the same capacity to represent specific, detailed properties.
Other types of diagrams, however, are not just relatively non-replete compared to other
nondiagrammatic figures; they have different kinds of form-content relations, and as a
result convey different types of content. Schematic drawings, for example, represent
generic properties rather than specific ones. Without both a comprehensive
understanding of what diagrams have in common, as well as the fact that there are
significantly different types of diagrams, it is impossible to make generalizations about
the use of diagrams in biology.
This study has shown that while all diagrams are relatively non-replete, and
therefore ‘say less’ than non-diagrammatic figures, the kind of information left out, and
what is conveyed, varies among the different kinds of diagrams. That in turn allows for
22
explanation of why diagrams play certain roles in biological reasoning. This
investigation of diagrams is merely another step towards a full account of why diagrams
are important in biology. These results present one reason why that project is so
challenging: in studying diagrams, we are not dealing with just one type of visual
representation after all.
References:
Abraham, T, 2003. “From theory to data: Representing neurons in the 1940s” Biology
and Philosophy 3 pp. 415-426. Abrahams, J P, Leslie, A G, Lutter, R and Walker J, 1994. “Structure at 2.8 Å resolution
of F1-ATPase from bovine heart mitochondria” Nature 370 pp. 621-628. Baigrie, B, ed 1996. Picturing Knowledge: Historical and philosophical problems
concerning the use of art in science, Toronto: University of Toronto Press. Bechtel, W. and Richardson R, 1992. “Emergent Phenomena and Complex Systems”, in
Emergence or Reduction? Essays on the prospects of nonreductive physicalism, New York: Walter de Gruyter Verlag.
Boekema, E J, Berden, J A, van Heel, M G, 1986. “Structure of mitochondrial F1-ATPase studied by electron microscopy and image processing” Biochimica
Biophysica Acta 851 pp. 353-360. Cummins, R, 1975. “Functional Analysis” Journal of Philosophy 72 pp.741-764. Goodman, N, 1976. Languages of Art: An Approach to a Theory of Symbols, Indiana:
Hackett Publishing Company. Giere, R, 1996. “Visual Models and Scientific Judgment” in Picturing Knowledge:
Historical and Philosophical Problems Concerning the use of Art in Science, Baigrie, B, ed. Toronto: University of Toronto Press.
Hall, B, 1996. “The Didactic and the Elegant: Some Thoughts on Scientific and Technological Illustrations in the Middle Ages and Renaissance”, in Picturing
Knowledge: Historical and Philosophical Problems Concerning the use of Art in
Science, Baigrie, B, ed. Toronto: University of Toronto Press. Larkin, J and Simon H, 1987. “Why a diagram is (sometimes) worth ten thousand words”
Cognitive Science 11 pp. 65-99. Lopes, D, 1995. “Pictorial Realism.” The Journal of Aesthetics and Art Criticism 53 pp.
277-285.
23
Lynch, M, 1988. "The externalized retina: Selection and mathematization in the visual documentation of objects in the life sciences" Human Studies 11 pp. 201-268.
Lynch, M, 1991. "Science in the age of mechanical reproduction: Moral and epistemic relations between diagrams and photographs" Biology and Philosophy 6 pp. 205-226.
Maienschein, J, 1991. “From Presentation to Representation in E.B. Wilson’s The Cell Biology and Philosophy 6 pp. 227-254.
McCulloch, W S, and Pitts, W, 1943. “A Logical Calculus of the Ideas Immanent in Nervous Activity” Bulletin of Mathematical Biophysics 5 pp. 423-478.
Nersessian, N, 1992. “How do scientists think? Capturing the dynamics of conceptual change in science” Cognitive models of science. Minnesota Studies in the
Philosophy of Science, v. 15, ed. R.N. Giere. Minneapolis: University of Minnesota Press.
Perini, L, 2004. “Convention, Resemblance and Isomorphism: Understanding Scientific Visual Representations,” in Multidisciplinary Approaches to Visual
Representations and Interpretations, ed. Grant Malcom, Elsevier. --- 2005a. “Explanation in Two Dimensions: Diagrams and Biological Models” Biology
& Philosophy 20 pp. 257-269. ---2005b “The Truth in Pictures” Philosophy of Science 72 pp. 262-285. ---forthcoming a. “Scientific Representations and the Semiotics of Pictures” in New
Waves in Philosophy of Science, Magnus, P D, and Busch, J, eds, Ashgate Publishing.
---forthcoming b. “Form and Function: a semiotic analysis of figures in biology textbooks” in The Educated Eye: Visual Culture and Pedagogy in the Life
Sciences, N. Anderson and M. Dietrich, eds. Purves, W, Orians, G. and Heller, H, 1995. Life: The Science of Biology
Sinauer/Freeman. Ruse, M, and Taylor, P, eds. 1991. Special Issue on Pictorial Representation in Biology,
Biology & Philosophy 6:2. Taylor, P. and Blum, A, 1991. “Pictorial Representation in Biology” Biology and
Philosophy 6 pp. 125-134. Wilson, E B, 1896. The Cell in Development and Inheritance New York:Macmillan.

24
FIGURE 1

25
FIGURE 2

26
27
FIGURE 3

28
FIGURE 4

29
FIGURE 5

30
FIGURE 6

31
FIGURE 7

32
FIGURE 8

33
TABLE 1
DIAGRAM TYPE FORM-CONTENT
RELATIONS
CONTENT
OMMITTED
ADVANTAGES
Pictorial The visible details of the
diagram represent specific
details
Specific details •Focus on details relevant to study
•Figure 1: Less replete representational
form allows for more reliable
comprehension of conclusion
Compositional Atomic characters denote
system components; spatial
relations among atomic
characters represent
relations among system
components
Intrinsic properties
of system
components
•Effective way to convey content
involved in functional explanation
•Makes it possible to non-committal
about properties of system components
can strengthen the argument
Schematic diagram Generic visible properties of
the figure interpreted to
convey information about
generic properties
Information about
detailed ways in
which generic
properties are
instantiated
•Allows for generalization about shared
properties in cases where the
individuals that share the generic
property differ in the details of how that
property is instantiated.