diagnostics -...
TRANSCRIPT

1
Diagnostics
Prof. Dr. J. Dewulf
1
Unit For Veterinary Epidemiology
Fac. Veterinary medicine
Ghent University
Diagnostics
• Clinical symptoms
• lab tests
• RX
• ultrasound
• ............
Diagnostic test =Everything that reduces the uncertainty
concerning the state of disease of an individual or
a group of individuals.
2

2
The ability of a test to detect disease
967 cows are tested for Q-fever (antibodies),
561 are positive. What is the seroprevalence
of Q-fever?
Prev. = 561 /967 =
3
The ability of a test to detect disease
Testcharactheristics:
• Sensitivity
• Specificity
• Predictive value:
• Positive Predictive value (PPV)
• Negative predictive value (NPV)
4

3
The ability of a test to detect disease
967 cows are tested for Q-fever (antibodies),
561 are positive. The test sensitivity is 87%,
the test specificity is 99%. What is the
seroprevalence of Q-fever?
Prev = 561 / 967 = …..
5
The ability of a test to detect disease
Generally determined against a golden standard
Golden standard = best possible approximation of
reality (by it self never 100% correct)
Example: Trichinella spiralis
golden standaard: digestion method
test: ELISA detection of
antibodies against T. spiralis
6

4
Golden standard
diseased Not diseased Total
Test
Pos.
Neg.
Total
truly
positive
Truly
negative
False
negative
False
positive
The ability of a test to detect disease
7
Golden standard
diseased Not diseased Total
Test
Pos. A B A + B
Neg. C D C + D
Total A + C B + D N
The ability of a test to detect disease
8

5
Golden standard
diseased Not diseased Total
Test
Pos. A B A + B
Neg. C D C + D
Total A + C B + D N
Sensitivity
9
Golden standard
diseased Not diseased Total
Test
Pos. A B A + B
Neg. C D C + D
Total A + C B + D N
Specificity
10
6
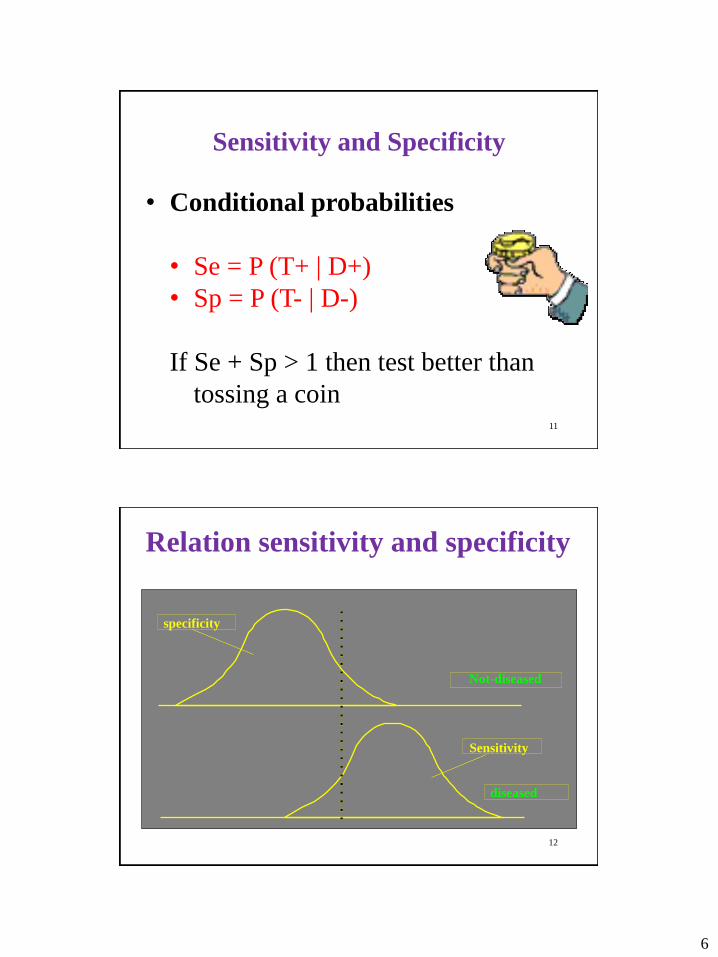
Sensitivity and Specificity
• Conditional probabilities
• Se = P (T+ | D+)
• Sp = P (T- | D-)
If Se + Sp > 1 then test better than
tossing a coin11
Relation sensitivity and specificity
specificity
Sensitivity
Not-diseased
diseased
12

7
%
Sens. / Spec.
1/41/8
1/161/32
1/641/128
1/2561/512
Sensitiviteit a c a / (a+c)
Specificiteit b d d / (b+d)
100
Relation sensitivity and specificity
13
0
20
40
60
80
100
16 17 18 19 20 21 22 23 24
echografische drachtdiagnose bij zeugen in functie van aantal dagen dracht
sensitiviteit
Relation sensitivity and specificity
14

8
15
Antbodies IBR: seroconversion
0
0,2
0,4
0,6
0,8
1
1,2
POS
NEG
21 days (gE)
8 days (gB)
Courtesy Stefaan Ribbens DGZ Vlaanderen
0
20
40
60
80
100
120
140
0,35 0,4 0,45 0,5 0,55 0,6 0,65 0,7 0,75 0,8 0,85 0,9 0,95 1 1,05 1,1 1,15 1,2 1,25 1,3 1,35
Batch A Batch B
positive negativequestionable
Nu
mb
erof
catt
le
Teuffert 2001
Antbodies IBR: gE- ‘ELISA batch dependancy’
Samples from marker-vaccinated, gE-negative farm
Courtesy Stefaan Ribbens DGZ Vlaanderen

9
Predictive value
= probability that the true status of the animal
agrees with the test result
= usability of a diagnostic test for an individual
animal
17
Positive predictive value
Golden standard
diseased Not diseased Total
Test
Pos. A B A + B
Neg. C D C + D
Total A + C B + D N
18

10
Negative predictive value
Golden standard
diseased Not diseased Total
Test
Pos. A B A + B
Neg. C D C + D
Total A + C B + D N
19
Predictive value
• Conditional probabilities
• PPV =
• NPV =
20
P (D+ | T+)
P (D- | T-)

11
Predictive value
• Dependant upon
• test sensitivity
• test specificity
• prevalence
21
Predictive value
22
0,00%
10,00%
20,00%
30,00%
40,00%
50,00%
60,00%
70,00%
80,00%
90,00%
100,00%
1,00% 5,00% 10,00% 20,00% 30,00% 40,00% 50,00% 60,00% 70,00% 80,00% 90,00% 99,00%
Relation Se, Sp, prevalence and PPV, NPV
PVW test 1 NVW test 1 PVW test 2 NVW test 2
12
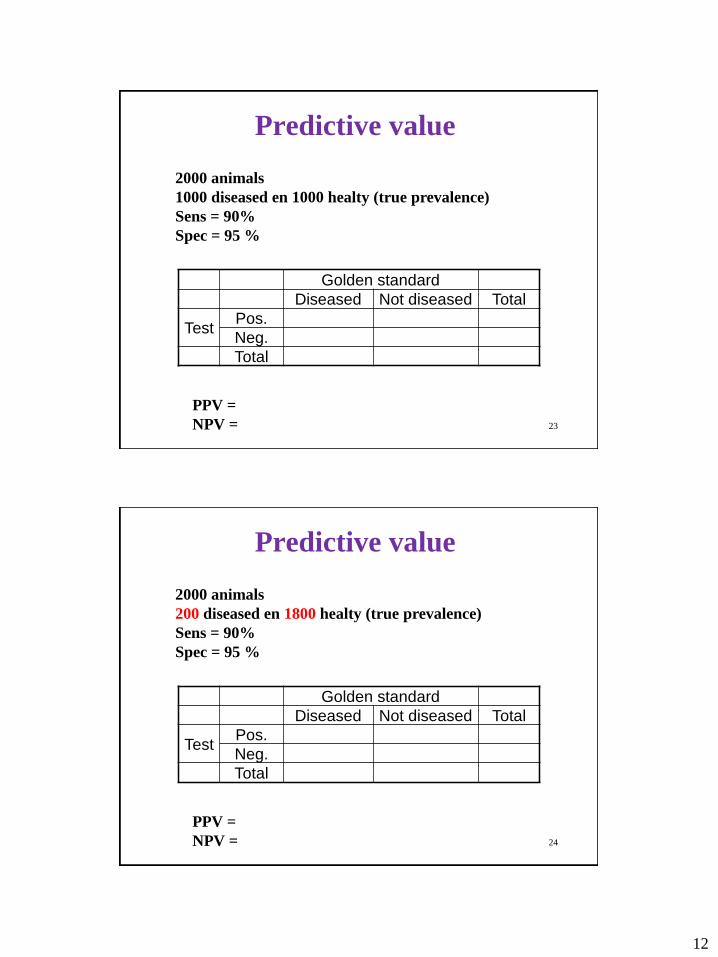
2000 animals
1000 diseased en 1000 healty (true prevalence)
Sens = 90%
Spec = 95 %
PVW =
NVW =
Predictive value
Golden standard
Diseased Not diseased Total
TestPos.
Neg.
Total
PPV =
NPV = 23
2000 animals
200 diseased en 1800 healty (true prevalence)
Sens = 90%
Spec = 95 %
PVW =
NVW =
Predictive value
Golden standard
Diseased Not diseased Total
TestPos.
Neg.
Total
PPV =
NPV = 24
13
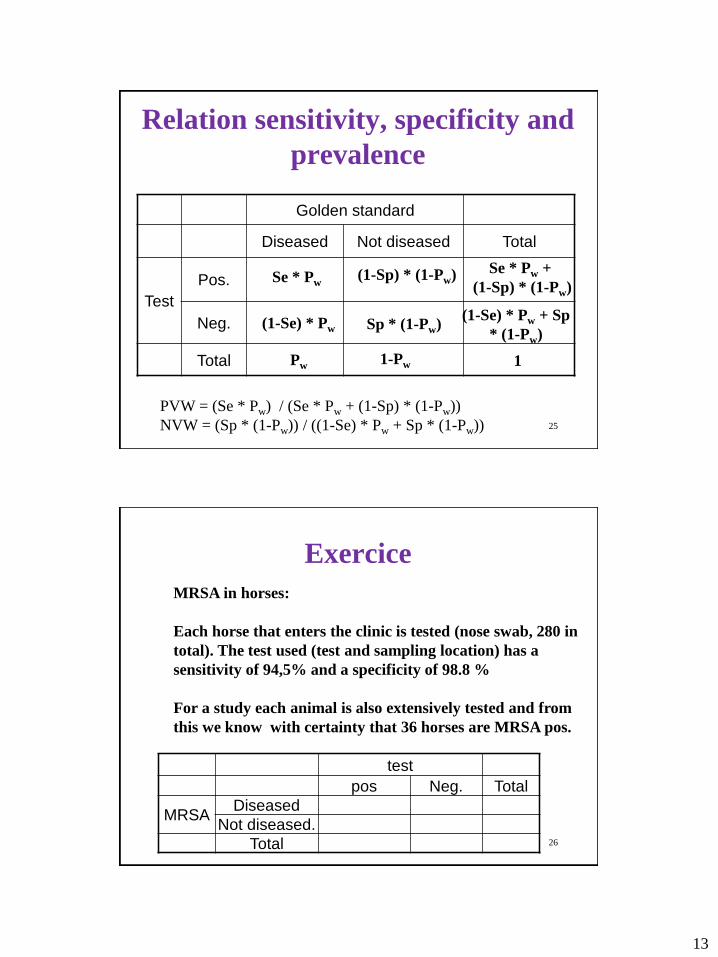
PVW = (Se * Pw) / (Se * Pw + (1-Sp) * (1-Pw))
NVW = (Sp * (1-Pw)) / ((1-Se) * Pw + Sp * (1-Pw))
Relation sensitivity, specificity and
prevalence
Golden standard
Diseased Not diseased Total
Test
Pos.
Neg.
Total
Se * Pw
Sp * (1-Pw)(1-Se) * Pw
(1-Sp) * (1-Pw)
Pw 11-Pw
Se * Pw +
(1-Sp) * (1-Pw)
(1-Se) * Pw + Sp
* (1-Pw)
25
Exercice
test
pos Neg. Total
MRSADiseased
Not diseased.
Total
MRSA in horses:
Each horse that enters the clinic is tested (nose swab, 280 in
total). The test used (test and sampling location) has a
sensitivity of 94,5% and a specificity of 98.8 %
For a study each animal is also extensively tested and from
this we know with certainty that 36 horses are MRSA pos.
26

14
Exercice
• Calculate:
• propability that the animal is diseased given a
test pos result
•Propability that a test is negative given that the
animal is diseased
• the propability for a test negative animal to be
truly diseased
27
Apparent prevalence
The observed prevalence = based on the test results
Pa = P (T+)
True prevalence
Prevalence present in reality
Pt = P (D+)
Relation sensitivity, specificity and
prevalence
28

15
Apparent prevalence
Pa = Se * Pt + (1-Sp) * (1-Pt)
True prevalence
= ? (calculate)
Relation sensitivity, specificity and
prevalence
29
Rogan – Gladen estimator (1978)
If the sens and spec are known the prevalence
can be estimated from the proportion test pos
animals through the Rogan-Glanden estimator
Relation sensitivity, specificity and
prevalence
1
1
SpSe
SpPP a
t
30

16
The ability of a test to detect disease
967 cows are tested for Q-fever (antibodies), 561
are positive. The test sensitivity is 87%, the test
specificity is 99%. What is the seroprevalence of
Q-fever?
Pa = 561 /967 = 58%
Pt = 0.58 + 0.99 -1 / 0.87 +0.99 -1 = 66.3%
31
The ability of a test to detect disease
Vb : serology for paraTBC (F. Boelaert et al., 2000)
Ab against para TBC on 458 farms,
Result: 82 farms pos
Test charactheristics:
• Sens. 45%,
• Spec. 99%
Apparent prevalence: 82 / 458 = 0.18 = 18%
true prevalence = Pt = (0.18 +(0.99-1)) / (0.45+ (0.99-1))
true prevalence = Pt = 0.17 / 0.44 = 0.41 = 39% 32

17
Sensitivity
Specificity= proportions
Probability distribution for proportions
= binomial distribution
Confidence intervals
33
The binomial distribution
• SD = √ (p * (1-p))
Binomial(100; 0,1) vsBinomial(100; 0,5)
0,00
0,02
0,04
0,06
0,08
0,10
0,12
0,14
-10 0
10
20
30
40
50
60
70
>5,0% 5,0%
5,0034

18
The binomial distribution
• Normal approximation with large n
Binomial(5; 0,5) vs Normal(2,5;1)
0,00
0,05
0,10
0,15
0,20
0,25
0,30
0,35
0,40
-1 0 1 2 3 4 5 6
5,0% 5,0%90,0%
1,000 4,000
Binomial(50; 0,5) vs Normal(25;3,6)
0,00
0,02
0,04
0,06
0,08
0,10
0,12
16
18
20
22
24
26
28
30
32
34
< >90,0%
19,00 31,00
Binomial(500; 0,5) vsNormal(250; 11,2)
Valu
es x
10^-2
0,0
0,5
1,0
1,5
2,0
2,5
3,0
3,5
4,0
22
0
23
0
24
0
25
0
26
0
27
0
28
0
< >5,0% 5,0%90,0%
232,00 268,00
35
The binomial distribution
• Normal approximation with large n
Rule of thumb:
» p*n > 5
» (1-p)*n > 5
» 95% CI= p ± 1.96 *
SD
Binomial(10; 0,1) vs Normal(0,1;0,9)
0,00
0,05
0,10
0,15
0,20
0,25
0,30
0,35
0,40
0,45
-2 -1 0 1 2 3 4 5
>5,0% 5,0%90,0%
0,000 3,000
Binomial(100; 0,1) vs Normal(10;3,1)
0,00
0,02
0,04
0,06
0,08
0,10
0,12
0,14
-2 0 2 4 6 8
10
12
14
16
18
20
>5,0% 5,0%90,0%
5,00 15,00
36
19
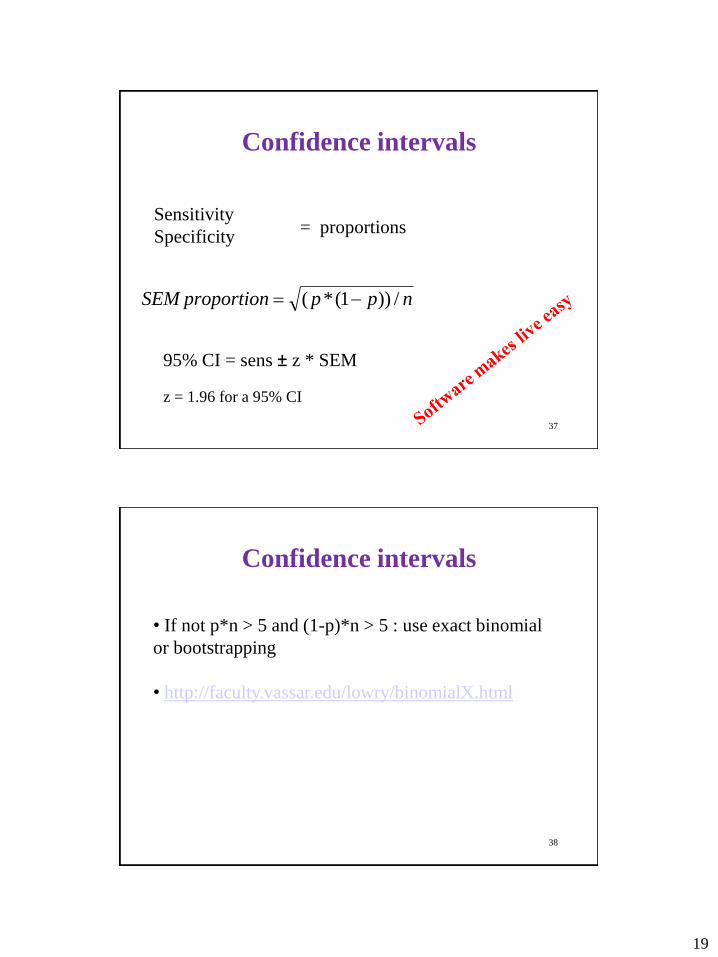
Sensitivity
Specificity= proportions
nppproportionSEM /))1(*(
95% CI = sens ± z * SEM
z = 1.96 for a 95% CI
Confidence intervals
37
Confidence intervals
• If not p*n > 5 and (1-p)*n > 5 : use exact binomial
or bootstrapping
• http://faculty.vassar.edu/lowry/binomialX.html
38

20
Determining cut-off values
Classical approach
Mean + 2 * SD
• assumes normal distribution
• only accounts for sens. and ingnores spec.
39
Cut- off value split results in test pos and test negative
Determining cut-off values
Normal(15; 3) vs Normal(25; 4)
X <= 10,07
5,0%
X <= 19,93
95,0%
0
0,02
0,04
0,06
0,08
0,1
0,12
0,14
5 10 15 20 25 30 35
Pop. Diseased animalsPop. healty animals
False pos resultsFalse negative results 40

21
Reciever-operating curve
0
0,1
0,2
0,3
0,4
0,5
0,6
0,7
0,8
0,9
1
0 0,2 0,4 0,6 0,8 1
Vals-positieve fractie (1-SP)
Po
sit
iev
e f
rac
tie
(S
E)
Determining cut-off values
41
Reciever-operating curve
Determining cut-off values
• Optimal cut-off: Se + Sp = Max
•AUC measure for accuracy of the test over all cut-
off values
42

22
Reciever-operating curve
Determining cut-off values
43
Reciever-operating curve
Determining cut-off values
0
0,1
0,2
0,3
0,4
0,5
0,6
0,7
0,8
0,9
1
0 0,1 0,2 0,3 0,4 0,5 0,6 0,7 0,8 0,9 1
sen
siti
vit
y
1- specificity
ROC PVP
ROC PVP
Poly. (ROC PVP)
44

23
Reciever-operating curve
Determining cut-off values
0
0,1
0,2
0,3
0,4
0,5
0,6
0,7
0,8
0,9
1
0 0,1 0,2 0,3 0,4 0,5 0,6 0,7 0,8 0,9 1
sen
siti
vit
y
1- specificity
ROC PVF
ROC PVF
Poly. (ROC PVF)
45
Multiple testing
Mass diagnostics often in 2 stages
1° stage: screening test
= fast, simple, high sens.
2° stage: confirmation test
= more expensive, high spec.
46

24
I. Serial testing
• 2 tests after each other
• only pos animals are retested
• If both tests are pos animal pos.
• Se and Sp
• animal has to prove that it is infected
• only if no fast result is necessary
Multiple testing
47
II. Parallel testing
• 2 tests on the same moment
• if 1 out of the 2 tests is pos animal pos
• Se and Sp
• animal has to prove that it is healthy
• if a fast result is necessary
• not possible in mass diagnostics
Multiple testing
48
25
When to use which test?
• Depending on the pre-test probability of disease
(=prevalence)
• High prevalence:
• test to “rule-in”
• Test with high spec (95%) and moderate sens
(75%)
• results in High PPV
Selection of tests
49
When to use which test?
• Depending on the pre-test probability of disease
(=prevalence)
• Low prevalence:
• test to “rule out”
• Test with high sens (95%) and moderate spec
(75%)
• results in High NPV
Selection of tests
50

26
When to use which test?
Selection of tests
Vb: diagnosis of a cow suspected of sub-clinical
ketonemia.
Two tests available
1. Ketonreagens in milk:
• sensitivity= 90%
• Specificity= 96%
2. Ketonreagens in urine:
• sensitivity = 100%
• Specificiteit = 67% 51
When to use which test?
Selection of tests at animal level
Vb: diagnosis of a cow suspected of sub-clinical
ketonemia.
1. Calved 2 weeks ago, higly productive, milk
prod drop
Prior prob of ketonimia: high
Test to “rule in” (low sens, high spec)
Milk test results in high PPV52

27
When to use which test?
Vb: diagnosis of a cow suspected of sub-clinical
ketonemia.
1. Calved 2 weeks ago, higly productive, milk
prod drop
Milk test: sens = 90%, spec 96%, prev 80%
PPV: 98,9%
NPV: 70,6%53
Selection of tests at animal level
When to use which test?
Selection of tests at animal level
Vb: diagnosis of a cow suspected of sub-clinical
ketonemia.
2. Calved 2 moths ago, high fever
Prior prob of ketonimia: low
Test to “rule out” (high sens, low spec)
urine test results in high NPV54

28
When to use which test?
Selection of tests at animal level
Vb: diagnosis of a cow suspected of sub-clinical
ketonemia.
2. Calved 2 moths ago, high fever
Urine test: sens = 100%, spec = 67%, Prev = 20%
NPV: 100%
PPV: 43,1%
55
When to use which test?
• when importing a batch of animals from exotic
country endemic for FMD
Test with high sensitivity
• To test for national proof of freedom of Brucellosis
Test with a high specificity
Selection of tests at population
level
56

29
Win Epi
Google: Win Epi
http://www.winepi.net/
57
58
Success is going from failure to failure
without loss of enthusiasm
Winston Churchill, Sir