diagnostic development through the decades (mostly a los
TRANSCRIPT

Managed and Operated by National Security Technologies, LLC Nevada National Security Site
Diagnostic development through the decades (mostly a Los Alamos perspective)
R. S. Hixson
Some material taken from: ‘Thunder in the Mountains’ by John Taylor, SCCM 1983 (Santa Fe)
DOE/NV-25946--2114
This work was done by National Security Technologies, LLC, under Contract No. DE‑AC52‑06NA25946 with the U.S. Department of Energy and supported by the Site-Directed Research and Development Program.

Managed and Operated by National Security Technologies, LLC Nevada National Security Site
Outline • Introduction: Why make time-resolved
measurements at interfaces? • The early years: Pins and such • Middle years: Time-resolved—quartz
gauges, capacitive gauges, etc. • Then there is temperature! • More lately: VISAR and PDV • MPDV • Simulations/ simple integral experiments • Conclusions
-2-

Managed and Operated by National Security Technologies, LLC Nevada National Security Site
Introduction: Why do diagnostic development for shock physics research?
• At the most fundamental level, we need to measure a couple of velocities; then apply the jump conditions:
• Early work focused on measuring us and inferring up, then using these equations to get P, E, and ρ
• While this does not get us all we want, it does get us the principal Hugoniot • To measure other physical observables requires more effort
-3-
(1) mass (2) P – P0 = ρ0 (us – up0)(up – up0) momentum
(3) E – E0 = 1/2(P + P0)(V0 – V) energy
This is a system of 3 equations in 5 unknowns... P, ρ, E, us, up
)()(
10
00
ps
pp
uuuu
−
−−=
ρ
ρ

Managed and Operated by National Security Technologies, LLC Nevada National Security Site
Uncertainty analyses essential; errors propagate
• For symmetric impact, assuming errors are random, these equations hold
• Take Up=0.5Ud ;true if density in flyer and target are equal
• Uncertainties in ρ0 are typically very small; immersion density
• But not for unsymmetric impact conditions
• It can be shown that for very compressible materials, error in V (or ρ) can become very large
21
222
0
0
⎥⎥⎦
⎤
⎢⎢⎣
⎡⎟⎠
⎞⎜⎝
⎛+⎟⎠
⎞⎜⎝
⎛+⎟⎟⎠
⎞⎜⎜⎝
⎛=
d
d
s
s
UU
UU
PP δδ
ρδρδ
21
222
0
2
0
0 )1(⎪⎭
⎪⎬⎫
⎪⎩
⎪⎨⎧
⎟⎟⎠
⎞⎜⎜⎝
⎛⎟⎠
⎞⎜⎝
⎛+⎟⎠
⎞⎜⎝
⎛−+⎟⎟⎠
⎞⎜⎜⎝
⎛=
d
d
s
s
UU
UU
VV δδ
ρρ
ρδρδ
( ) ( )
21
2222
0
0
⎪⎭
⎪⎬⎫
⎪⎩
⎪⎨⎧
⎟⎟⎠
⎞⎜⎜⎝
⎛
−+⎟⎟
⎠
⎞⎜⎜⎝
⎛
−⎟⎟⎠
⎞⎜⎜⎝
⎛+⎟⎟
⎠
⎞⎜⎜⎝
⎛=
PS
P
PS
P
S
S
UUU
UUU
UU δδ
ρδρ
ρδρ

Managed and Operated by National Security Technologies, LLC Nevada National Security Site
What do we get from time-resolved measurements? • From the earliest days, shock
wave experimentalists have wanted to make time-resolved measurements: – Getting wave structure from pins
is hard to do! – Time-resolved wave profiles at
interfaces contain a wealth of information
• HEL • Shock rise/velocity • Particle velocity in peak state
(with some assumptions) • Evolution of tension • Phase transition in compression • Reverse phase transition • Release isentrope/interface
release states
-5-
0.0 0.1 0.2 0.3 0.4 0.5 0.6 0.70.0
0.4
0.8
1.2
1.6
2.0
Parti
cle
Velo
city
(mm
/µs)
Time (µs)
Zr0(HP)
ZrI(LP) ZrII(VLP)
Zirconium Wave Profiles
t (s)2.5e-6 3.0e-6 3.5e-6
U p (k
m/s)
0.00
0.02
0.04
0.06
0.08
0.10
0.12
0.14
0.16
0.18
0.20
0.22
0.24
0.26
0.28
0.30
0.32
0.34
56-01-3356-01-3456-01-36
ω à β
α à ω
Rigg, Knudsen (2006)
ω à β
Rigg (2006

Managed and Operated by National Security Technologies, LLC Nevada National Security Site
But, in-situ measurements would be even better
• Velocimetry techniques are always looking at an interface – Free surface; interface between target and vacuum/air: mirror image
approximation – Target/window interface: Wave interactions!
• Many efforts to do in-situ: – Manganin gauges: Piezo resistance – Elecromagnetic gauges: Faraday’s law, insulators
• But, this turns out to be difficult. Embedded gauges perturb the measurement in some ways and, thus, are not widely used
-6-
So, velocimetry at interfaces has become a well-used tool for looking at wave structure

Managed and Operated by National Security Technologies, LLC Nevada National Security Site
A bit of history…the Manhattan project (Los Alamos), etc.
• Shock physics research began in the 19th century: Rankine (~1870) and Hugoniot (~1887), as well described by Cheret and Johnson (Classic papers in shock compression, Springer-Verlag)
– This was mostly theory, but with connections to artillery problems – Experimental tool to make quantitative measurements really did not exist
• Later, the Manhattan project (1942–1945) brought the need for dynamic properties of materials into a clear focus
– As before, mostly theory. Experimental tools were lacking. – Interestingly, Bethe and Teller wrote a research paper on shock waves and
equation of state (EOS) in 1941, predating the project (‘Deviations from thermal equilibrium in shock waves’)
– Research on making better and more reproducible explosives began early on, ~1943. A lot of effort went into this at LANL’s S-site. More on this later…
– By late 1943 there was a recognition that to move metal with explosives required some understanding of the strength of the metal! No help here from the jump conditions…or hydrodynamic theory.
-7-

Managed and Operated by National Security Technologies, LLC Nevada National Security Site
History…. – Hans Bethe (T Division leader) and others worked on the underlying
physics theoretically; no experimental program to speak of • Data table from Birch up to 0.04 Mbar were used, and TFD theory used
(above 50 Mbar?) • This lead to some early publications: H. Bethe et al.: Shock hydrodynamics
and blast waves (1944); Penney, Energy dissipation in plastic deformation (LA-155) (1944); Hirschfelder, Shock hydrodynamics (LA-165) (1944); Metropolis, metals EOS (LA-208) (1945), etc.
• By 1944 Teller et al. had published a derivation of the Mie-Gruneisen EOS (LA-144)
– Computer simulations (such as they were!) started around this time as well. Von Neumann (and others): Solution of hydrodynamic flow equations, concept of artificial viscosity
-8-
All this should be familiar to current researchers: add in an experimental component, and that how programs are now!

Managed and Operated by National Security Technologies, LLC Nevada National Security Site
But even most theorists agree: Experiments are needed!
• Research on making better explosives lead to their use to do metals research
• This work began in 1944 in G-8 under Froman and Critchfield: Proposed to do experiments with contacting pins
– First Hugoniot measurements made for the project with in-contact (unsteady) HE drive:
– Elastic waves observed • Early work on making free surface motion
measurements using a ‘capacitance’ gauge by Marshall in 1945
• Lab reorganized in 1946 (!!), new experimental division was stood up (M); M-4 took over this work using pin technique
• Interestingly, first attempts (I’m aware of) to make shock temperature measurements was 1946–47
-9-

Managed and Operated by National Security Technologies, LLC Nevada National Security Site
More modern research; experimental technique and diagnostic evolution
• After 1948, many researchers returned to academia. But the staff who remained and new hires began really pushing on the experimental program:
– Lab re-organized (!!!) by Bradbury in 1948: GMX division formed; experiments in GMX-6 (GMX-4 doing pin work for other reasons)
– By 1952 the flash gap method (Walsh and Christian) replaced pins for many EOS experiments
• But there were still drive issues! (in-contact) • And, pin techniques were still used for looking
at multi-wave (elastic-plastic; phase change) structure (Minshall; iron)
• In 1954 Fowler/Walsh/Christian did new iron flash gap experiments; discovered an ‘anomaly’ in compressibility. Minshall repeated with pins. At odds with theory and Bridgeman; turned out to be the α-ε phase change at 13 GPa.
• Tourmaline pressure gauge records also showed multi-wave structure
-10-
Bancroft et al. (1956)

Managed and Operated by National Security Technologies, LLC Nevada National Security Site
Timeline… • Around 1958 Taylor began looking at measuring
shock state temperatures • The early capacitive gauge technique was later
revived, and it showed that both elastic and plastic waves can have structure and be less than sharp. This demonstrated the need for good time-resolved data, especially at low stress.
• But, back in 1955, McQueen and Walsh (and others!) began developing the HE flyer technique; allowed much higher stresses than the in-contact method and flat top (steady) waves (but with some flyer bow)
• When combined with the flash gap method, a data production ‘factory’ was developed. Result was the current ‘Marsh’ compendium of data.
-11-

Managed and Operated by National Security Technologies, LLC Nevada National Security Site
HE flyers + flash gaps = lots of data
• PIs like Walsh and McQueen defined the directions and the experiments
• Firing site technicians fired the shots, collected data
• Data analysts reduced data, gave to PIs • Most focus was on relatively high
pressures where the techniques worked best
• By about 1956 Sandia had established a shock physics effort somewhat focused on lower pressures: Lundergan, Barker, later Asay, etc.
• In the early 1970s, Lynn Barker at Sandia began developing an interferometer to make particle velocity measurements: 1st reference to a laser interferometer is in 1971

Managed and Operated by National Security Technologies, LLC Nevada National Security Site
The VISAR era: ~1972–present • Barkers early interferometers (~1965) became mature by 1972 and
were named VISAR – Based on the WAMI concept, following earlier work done at Lockheed – This was a revolutionary invention, and soon it led to two landmark
research papers: • “Shockwave studies of PMMA, Fused Silica, and Sapphire,” Barker &
Hollenbach, 1970 • “Shockwave study of the phase transition in iron,” Barker and Hollenbach,
1974; this work reconfirmed the earlier work of Minshall in considerably more detail; demonstrated how complex shock wave structure can be!
– In 1979 Will Hemsing (Los Alamos) introduced the push-pull VISAR modification, which made things even better
– The VISAR was the state-of-the-art tool for time-resolved experiments up to the development of the PDV
– There were other ways to get time-resolved data: • Manganin gauges • Quartz gauges • Inclined mirrors • EM embedded gauges
-13-
But really, none of these have eve been used as extensively as VISAR since the 1970s

Managed and Operated by National Security Technologies, LLC Nevada National Security Site
For many years VISAR was the preferred technique
Some beautiful time-resolved data have been collected
-14-
Hixson
-0.5 0.0 0.5 1.0 1.5 2.0 2.5-0.1
0.0
0.1
0.2
0.3
0.4
0.5
0.6
0.7
0.8
VISAR Record for Shot prad 0198
Vel
ocity
(mm
/µs)
Time (µs)
0.723
Fe Spall above and below transformation
t (s)2.0e-6 4.0e-6 6.0e-6 8.0e-6 1.0e-5 1.2e-5
Up (
km/s
)
0
1
U-Nb (6%) 28.4/42.5/55 kbar/100kbar
time (S)-2e-6 0 2e-6 4e-6 6e-6 8e-6
U p (km/
s)
-0.1
0.0
0.1
0.2
0.3
0.4
0.5

Managed and Operated by National Security Technologies, LLC Nevada National Security Site
They come in many shapes and sizes
• Early are big, hard to align • More modern VISAR’s have
been made by NSTec/STL that really are pretty user friendly!
-15-
Variable air-delay VISAR
Compact VISAR
Fast VISAR

Managed and Operated by National Security Technologies, LLC Nevada National Security Site
Line Velocimeter for SNL
Status: • Cavity design complete • Parts fabrication complete • Assembly in process • Designing array input optics

Managed and Operated by National Security Technologies, LLC Nevada National Security Site
Any issues with VISAR?
• Well, OK, nothing is perfect! • Some issues that come to mind are:
– Alignment of optics, which is needed to change fringe constant – Issues caused by collecting unshifted light – Target surface preparation; finish somewhere between specular and
diffuse; loss of light upon emergence of shock wave – Data analysis; centering Lissajous figure
• Every once in a while, we’d get a data set that seemed to defy analysis! – Time response limited by cavity fill time, detector response, and
digitizer response – Relatively hard to make multi-channel instrument; laser power – Maybe best suited for planar geometry?
• But when it works, data with good signal to noise can be obtained
-17-

Managed and Operated by National Security Technologies, LLC Nevada National Security Site
Then came PDV (Strand, et. Al RSI 77 #8 083108, 2006)
• Not my area of expertise; but what are pros and cons? • Pros (?):
– Relatively easy to build from telecomunications parts – No Lissajous stuff; replaced by sliding Fourier transform method
which may be easier (?) – Relatively easy to make with many channels!
• Cons (?): – Signal/noise ratio? Can analyze either for good time response or
good s/n? – Any others?
• This takes us to MPDV, a revolutionary invention! – I think MPDV has the potential to revolutionize fundamental shock
physics research methods – The ability to ‘flood’ a target with data points is powerful – We already have some examples of this
-18-

Managed and Operated by National Security Technologies, LLC Nevada National Security Site
MPDV: A new tool • Rod penetrator example:
– Lexan rod hitting steel plate
• A lot of data! How do we interpret it all? – Work in progress
-19-
mpdv
Managed and Operated by National Security Technologies, LLC Nevada National Security Site
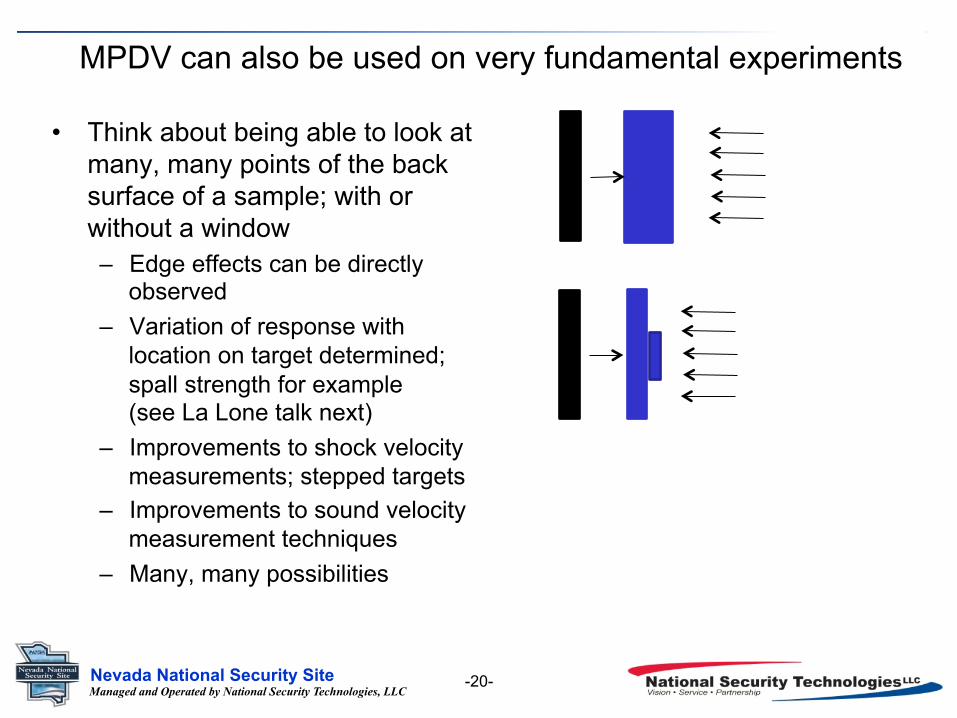
MPDV can also be used on very fundamental experiments
• Think about being able to look at many, many points of the back surface of a sample; with or without a window – Edge effects can be directly
observed – Variation of response with
location on target determined; spall strength for example (see La Lone talk next)
– Improvements to shock velocity measurements; stepped targets
– Improvements to sound velocity measurement techniques
– Many, many possibilities
-20-

Managed and Operated by National Security Technologies, LLC Nevada National Security Site
But time-resolved data have other significant benefits
• Even simple experiments contain complicated data; how can we use this information? – Experiments used to get fundamental data also contain some
integral data; both are needed to develop a better numerical modeling capability
-21-
Hydrodynamic simulations
Physics models
Small scale experiments
Integral experiments
Comparison of results

Managed and Operated by National Security Technologies, LLC Nevada National Security Site
We can use experiments with a range of complexity to see how well our computer simulations are doing:
• CTH simulations of a symmetric impact copper spall experiment reveal: – Johnson-Cook does well for copper – EOS gets the plastic shock state right – But, spall signature is challenging – Right zone sizes needed!
• Iron wave profile is another story: – Here J-C is challenged – Phase change stress (pressure?) off
both in compression and release – Both CTH and WONDY get the
rerefaction shock; CTH even gets the timing right (sound speed)
We must match the whole wave profile to have confidence in our physics models & codes!

Managed and Operated by National Security Technologies, LLC Nevada National Security Site
Details on Cu spall shot
• Simple copper flyer plate spall experiment contains integral information
– EOS and tensile strength info integrated – Compressive strength and EOS info
integrated (multiple waves – Release info is complex
• Hydrocode modeling of such an experiment may help to identify strengths/weaknesses of physics models and computational technique
• Used CTH; models chosen: – MG EOS for copper – Johnson-Cook library model for strength – Pmin (PFRAC) model for tensile strength
(–13 kbar) is spall strength derived from data
• Choice of zone size matters!
-23-
VISAR

Managed and Operated by National Security Technologies, LLC Nevada National Security Site
Conclusions • Shock compression experiments are hard to diagnose!
• We would like to be able to do in-situ measurements, but this is difficult
• Diagnostic development has been continuously pursued over the years following the Manhattan project, and arguably the greatest contribution to better understanding how dynamic deformation works has come from velocimetry
• I think both VISAR and PDV are great tools; my personal choice for planar impact experiments would be both! Don’t throw away your VISAR’s!
• MPDV is poised to give us even greater insights!
Keep up the good work!