diablo: a warehouse-scale computer network …krste/papers/diablo-asplos2015.pdfdiablo: a...
TRANSCRIPT

DIABLO: A Warehouse-Scale ComputerNetwork Simulator using FPGAs
Zhangxi Tan Zhenghao Qian Xi Chen Krste Asanovic David PattersonUniversity of California, Berkeley
{xtan,peterfly,c.xi,krste,pattrsn}@eecs.berkeley.edu
AbstractMotivated by rapid software and hardware innovation inwarehouse-scale computing (WSC), we visit the problemof warehouse-scale network design evaluation. A WSC iscomposed of about 30 arrays or clusters, each of which con-tains about 3000 servers, leading to a total of about 100,000servers per WSC. We found many prior experiments havebeen conducted on relatively small physical testbeds, andthey often assume the workload is static and that com-putations are only loosely coupled with the adaptive net-working stack. We present a novel and cost-efficient FPGA-based evaluation methodology, called Datacenter-In-A-Boxat LOw cost (DIABLO), which treats arrays as whole com-puters with tightly integrated hardware and software. Wehave built a 3,000-node prototype running the full WSC soft-ware stack. Using our prototype, we have successfully re-produced a few WSC phenomena, such as TCP Incast andmemcached request latency long tail, and found that resultsdo indeed change with both scale and with version of the fullsoftware stack.
Categories and Subject Descriptors C.5.3 [Computer Sys-tem Implementation]: Microprocessors; I.6.8 [Simulationand Modeling]: Discrete Event
Keywords Warehouse-scale computing; FPGA; Perfor-mance Evaluation
1. IntroductionModern datacenters are no longer just a collection of serversrunning traditional commercial workloads. The tremendoussuccess of Internet services has led to the rise of Warehouse-Scale Computers (WSCs) [25] with 50,000 to 100,000
Permission to make digital or hard copies of all or part of this work for personal orclassroom use is granted without fee provided that copies are not made or distributedfor profit or commercial advantage and that copies bear this notice and the full citationon the first page. Copyrights for components of this work owned by others than ACMmust be honored. Abstracting with credit is permitted. To copy otherwise, or republish,to post on servers or to redistribute to lists, requires prior specific permission and/or afee. Request permissions from [email protected] ’15, Month 14–18, 2015, Istanbul, Turkey.Copyright c� 2015 ACM 978-1-4503-2835-7/15/03. . . $15.00.http://dx.doi.org/10.1145/2694344.2694362
servers [41] treated as a massive computer system. The con-tinuing push for greater cost efficiency and scalability hasdriven leading Internet companies, such as Facebook andGoogle, to innovate in new software infrastructure and evencustom hardware [15, 18].
As noted in many recent papers [35, 58], the network isperhaps the most critical component in a WSC. The growingscale of WSCs leads to increasing and more variable net-work delays, while demand for more ports increases cost inan already expensive switching fabric. Consequently, manyresearchers have proposed novel datacenter network archi-tectures, mostly focusing on new switch designs [36, 37, 40,50, 57, 58], and several new networking products emphasizesimple switch designs with low latency [9, 10].
When comparing these network proposals, we observe awide variety of design choices made for almost every as-pect of the design space, including switch design, networktopology, protocol, and applications. We believe these ba-sic disagreements about fundamental design decisions aredue to the different assumptions taken by various exist-ing WSC infrastructures and applications, and the lack ofa sound methodology to evaluate new options. Most pro-posed designs have only been tested with a small testbedrunning unrealistic microbenchmarks, as it is very difficultto evaluate network infrastructure innovations at scale with-out first building a WSC. We surveyed WSC-related papersin the SIGCOMM conference from 2008 to 2013 and foundthat the median size of physical testbeds contained only 16servers and 6 switches (see Figure 2).
In this paper, we present the design of DIABLO(Datacenter-In-A-Box at LOw cost), an FPGA-based WSCsimulator that enables the at-scale and in-depth modeling ofWSC arrays as complete computer systems with tightly in-tegrated hardware and software. DIABLO can run unmodi-fied WSC applications and operating systems at the scale ofO(1,000) to O(10,000) nodes while providing detailed mod-els of every instruction executed on every node, the opera-tion of the network interfaces on each node, and the move-ment of every byte in every packet through multiple levelsof datacenter switches.

The specific target of DIABLO is the building block ofthe WSC, called an array [38] or cluster [25]. A WSC iscomposed of about 20–40 such arrays, each of which con-tains about 2000–3000 servers, summing to a total of about50,000–100,000 servers per WSC. The array is often thetarget of an application, with multiple arrays used for bothdependability and to distribute workload. DIABLO is fastenough to model O(10) seconds of runtime of a whole WSCarray in a few hours instead of the weeks that would berequired for an equivalent software simulator. To increaseFPGA efficiency and flexibility, DIABLO is not based onFPGA prototyping, where hardware designs are directlymapped to FPGAs, but instead uses FPGAs to accelerate pa-rameterized abstract performance models of the system [55].
The number of compute nodes in the DIABLO prototypeis two orders-of-magnitude greater than recent testbeds usedby academic researchers, but the FPGA-based simulation ap-proach makes it plausible for many research groups to ac-quire their own private platform. The projected full-systemhardware cost of an O(10,000)-node DIABLO system usingmodern state-of-the-art FPGAs is around $150K. An equiva-lent real WSC array would cost around $36M in CAPEX and$800K in OPEX/month. Furthermore, unlike real hardware,DIABLO is fully parameterizable and fully instrumented,and supports repeatable deterministic experiments.
In our evaluation, we show how results obtained fromlarge-scale DIABLO runs can be dramatically different fromthose obtained from smaller testbeds. In particular, DIABLOallows us to record the same behavior administrators observewhen deploying equivalently scaled WSC software, such asTCP Incast throughput collapse [60] and the long tails ofmemcached request latency.
2. Background and Related WorkIn this section, we first review the structure of WSCs, thendiscuss existing evaluation approaches and previous studies,and conclude with a summary of WSC simulation needs.
2.1 WSC Network ArchitectureWSCs use a hierarchy of local-area networks (LAN) and off-the-shelf switches. Figure 1 shows a typical WSC networkarranged in a Clos topology with three networking layers.At the bottom layer, each rack typically holds 20–40 servers,each singly connected to a commodity Top-of-Rack (ToR)switch with a 1 Gbps link. These ToR switches usually of-fer two to eight uplinks, which leave the rack to connect upto several array switches to provide redundancy and band-width. At the top of the hierarchy, datacenter switches carrytraffic between array switches usually using 10 Gbps links.All links use Ethernet physical-layer protocol, with eithercopper or fiber cabling depending on connection distance.
One of the most challenging design problems is that thebandwidth “over-subscription” ratio (i.e. bandwidth enteringfrom below versus bandwidth available to level above) wors-
ens rapidly as we move up the hierarchy. This imbalance isdue to the cost of switch bandwidth, which grows quadrat-ically in the number of switch ports. The resulting limitedWSC bisection bandwidth significantly affects the design ofsoftware and the placement of services and data, hence thecurrent active interest in improving network switch designs.
Recent novel network architectures employ a simple,low-latency, supercomputer-like interconnect. For example,the Sun Infiniband datacenter switch [10] has a 300 ns port-port latency as opposed to the 7–8µs of common GigabitEthernet switches. Even at the WSC level, where huge tradi-tional Cisco and Juniper switches or routers have dominatedto handle inter-WSC traffic, simple switches with minimalsoftware are now preferred. For example, the Google G-scale OpenFlow switch [47] runs almost no software exceptthe OpenFlow agent using just BGP and ISIS protocols.
2.2 Evaluation ApproachesWe next compare the different methodologies that have beenused to evaluate designs for WSC networks.Production prototyping: In industry, perhaps the ideal wayto test new hardware is to build the real system at a smallerscale and run it alongside a production system [34]. In thisway, new hardware evaluation will benefit from running pro-duction software and a more realistic workload. However,this approach suffers from scalability issues. First, it is ex-pensive to build a large number of prototypes. Second, it isrisky to deploy experimental hardware at a large-scale in aproduction environment. Third, the majority of the testingworkload will be generated by older and slower computers.Testing clusters: Another popular approach is to deploythe test equipment in medium-scale shared testing clusters.For instance, the Yahoo M45 [7] cluster has 4,000 proces-sors and 1.5 petabytes of data storage, and is designed torun data-intensive distributed computing platforms such asHadoop [13]. Larger Internet companies can afford muchlarger testing clusters, e.g. 20,000 nodes at Google [8]. Al-though these test clusters have enough computing nodes tohelp diagnose interesting scalability problems, their con-struction and maintenance costs are enormous. Bringing upan equivalent production software stack is also another prac-tical issue [8]. Because of cost, researchers in academia usemuch smaller in-house clusters at the scale of 40–80 nodes(1–2 racks) [36, 51, 61] of off-the-shelf hardware. Commer-
Array Switch
Array of Racks
Rack
Rack Switch
20~40 Servers
Array Switch
Array of Racks
Datacenter Switch
Datacenter Switch
Figure 1. A typical WSC network architecture.

cial hardware usually has few controllable parameters, soexperiments can only explore a limited design space, andhas limited observability to help understand behavior, whichcomplicates analysis given that experimental runs with realhardware are not generally reproducible.Cloud computing: Cloud computing platforms such asAmazon EC2 offer a pay-per-use service based on virtualmachine (VM) technology to enable users to share theirWSC infrastructure at an O(1,000) scale. Researchers canpay $0.10/hour/node to rapidly deploy a functional-onlytestbed for network management and control plane stud-ies [30, 63]. The cloud is a straightforward approach forsoftware developers to acquire a large-scale infrastructure.Such services, however, provide almost no visibility or con-trol over the network and have no mechanism for accuratelyexperimenting with new networking architectures.Full-system software simulations: To avoid the high capi-tal cost of hardware prototyping, researchers have long usedsoftware simulators to explore new architectural ideas at alllevels, from microarchitectures and instruction sets [46] tofull systems [27]. Alas, the recent abrupt transitions to mas-sively distributed architectures and high-radix switches haveboth increased the complexity and scale of simulation. Thecomplex interaction of networking software with network-ing hardware renders popular techniques, such as samplingand simple analytical models, unreliable at reproducing ac-tual steady-state behavior even in the simplest TCP/IP net-working environments [39].Analytical simulation models: Researchers have usedstochastic queuing models in simulations [43, 48] to gain in-sight into existing systems. Instead of simulating the detailedmicroarchitecture, such analytical models raise the level ofabstraction, provided measurements of distributions of ar-rival and service times for various tasks in the system areavailable. Although analytical models are much faster thanfull-scale simulation, it is challenging to build faithful mod-els for new HW/SW that captures interesting interactions atthe 100,000-server scale when there is no system to measure.
2.3 Recent WSC Network Evaluation StudiesWe next survey previous WSC-network evaluation studies.Figure 2 plots the scale of the physical testbeds used bydatacenter networking papers published in SIGCOMM from2008 to 2013. To be generous in our survey, we count VMsas physical nodes, although VMs time-share hardware re-sources and might not reflect accurate timing in the realphysical network. In addition, when EC2 is used, there isno visibility into network performance. We optimisticallyestimate the maximum number of switches assuming eachphysical machine only hosts one VM.
Clearly, the biggest issue is evaluation scale. Althougha mid-size WSC contains tens of thousands of servers andthousands of switches, recent evaluations have been limitedto relatively small testbeds with less than 100 servers and10–20 switches. Small-scale systems are understandable, but
results obtained may not be predictive of systems deployedat large scale. As we show later in this paper, sometimesdesign decisions drawn from O(100) testbeds are completelyreversed when scaling to O(1,000) nodes.
For workloads, most evaluations run synthetic programs,microbenchmarks, or even pattern generators, but real WSCworkloads include web search, email, and Map-Reduce jobs.In large companies, like Google and Microsoft, researcherstypically use trace-driven simulation, due to the abundanceof production traces. Nevertheless, production traces are col-lected on existing systems with drastically different networkarchitectures. They cannot capture the effects of timing-dependent execution on a new proposed architecture. In thepast, when looking at networking designs, researchers tendto focus on networking hardware and ignore server compu-tation and client OS interaction for large-scale experiments.We find that not only does OS software affect the systemresults at scale, but it can be the dominant factor.
Types Microbenchmark Trace ApplicationNumber of Papers 16 3 2
Table 1. Workload in recent SIGCOMM papers
Finally, many evaluations make use of existing com-mercial off-the-shelf switches, with proprietary architecturesthat have poor documentation of their existing structure andlittle opportunity to change parameters such as link speedand switch buffer configurations, which may have signifi-cant impact on fundamental design decisions.
2.4 WSC Network Evaluation NeedsAs pointed out in [25], the technical challenges of design-ing WSCs are no less worthy of the expertise of computersystems and networking architects than any other class ofmachines. Their size alone makes them difficult to experi-ment with or simulate efficiently, therefore, system designersmust develop new techniques to guide design decisions. Webelieve to evaluate new WSC network architectures usinghigh-performance supercomputing-style interconnects witha rapidly evolving set of application workloads and OS soft-ware requires simulations with the following four properties:
Figure 2. Size of physical testbeds used in recent SIG-COMM papers.

1. Scale: WSCs contain O(100,000) servers or more. Al-though few single apps use all servers in a WSC,O(10,000) nodes are desired to study networking phe-nomena at aggregate and array-level switches.
2. Performance: Current large datacenter switches have48/96 ports, and are massively parallel. Each port has1–4 K flow tables and several input/output packet buffers.In the worst case, there are ⇠200 concurrent events everyclock cycle. In addition, high-bandwidth switch proces-sors often employ multicore architectures [1].
3. Accuracy: A WSC network operates at nanosecond timescales. For example, transmitting a 64-byte packet ona 10 Gbps link takes only ⇠50 ns, which is comparableto DRAM access latency. This precision implies manyfine-grained synchronizations during simulation if timingmodels are to be accurate.
4. Flexibility: The simulator should support experimenta-tion with radical new switch designs and network soft-ware stacks. It is unlikely slight tweaks to existing de-signs will lead to large improvements.
3. DIABLO ImplementationAlthough software simulation is a flexible and low-cost tech-nique for systems evaluation, it cannot scale to the size andperformance levels required for WSC-scale network exper-iments while maintaining accuracy. In this section, we de-scribe the design of DIABLO, which exploits FPGAs toprovide programmable hardware acceleration of simulationmodels, achieving two orders of magnitude performance im-provement over software simulators. In addition, DIABLOcan be scaled using multiple tightly coupled FPGAs to pro-vide scalable high-performance simulations that retain ac-curacy and flexibility. Overall, we designed DIABLO to an-swer questions about how new systems behave after changesto the hardware, the software, and/or the scale. We use targetto refer to the proposed system under evaluation, and host torefer to the system running the simulation.
3.1 FAME-Based WSC Array SimulationThe most obvious approach to experimenting with WSC ar-rays on FPGAs is to build a WSC array emulator by map-ping processor and switch RTL designs directly to the FP-GAs. But this naive mapping is inefficient and inflexible,and makes it impractical to model key WSC array archi-tecture features at scale. DIABLO instead uses FPGAs toaccelerate simulation models of the various components, anapproach known as FPGA Architecture Model Execution(FAME) [55]. Groups in both academia and industry havebuilt various types of FAME simulators, which can be clas-sified in five levels that are analogous to different RAID lev-els [55]. Higher FAME levels lower simulator cost and im-prove performance over lower levels, while moving furtheraway from the concrete RTL design of the target. DIABLO
is a FAME-7 simulator using the following three key tech-niques to improve efficiency [55].
1. Abstracted Models: To reduce host hardware resourcerequirements, we employ high-level abstract models ofeach simulated component, capturing important featuresbut simplifying or removing features that are rarely used.We also separate functional models from timing modelsto simplify parameterization of target timing. For exam-ple, the functional model for a router interprets headers tosend packets to the correct output port, while the router’stiming model calculates how many target clock cyclesthis takes. Thus, we can change the timing without al-tering the router’s functional model.
2. Decoupled Design: We use a variable number of FPGAhost clock cycles and FPGA-resource-friendly structuresto simulate a single target clock cycle. For example, asimple ring network on the host FPGA can model an ex-pensive multiport crossbar in the target datacenter switch.
3. Host Multithreading: We run multiple target modelthreads simulating different target instances in a singlehost hardware model pipeline. Multithreading improvesFPGA resource utilization and hides host platform laten-cies, such as those from host DRAM access and timing-model synchronization across different FPGAs.
3.2 DIABLO Modular ArchitectureDIABLO employs a modular design with only two distinctFPGA configurations. Figure 3 shows the high-level simu-lator architecture for the typical target WSC array config-uration presented in Figure 1. We map all server modelsalong with the ToR switch models into Rack FPGAs, andarray and datacenter switch models to separate Switch FP-GAs. To further simplify switch model design, we keep anyswitch model within a single FPGA. Mirroring the physicaltopology of the target system, we connect Rack FPGAs toSwitch FPGAs through several time-shared 2.5 Gbps serialtransceivers. Each FPGA has its own simulation schedulerthat synchronizes with adjacent FPGAs over the serial linksat a fine granularity to satisfy the nanosecond-scale simula-tion accuracy requirements mentioned in Section 2.
To make the design simpler and more modular, we onlyuse multi-gigabit serial transceivers for inter-FPGA con-nections. The serial transceivers provide enough bandwidthbetween FPGAs considering our overall simulation slow-down of between 250–1000⇥ of real time. For example,the bandwidth of a 2.5 Gbps host transceiver translates to625–2500 Gbps in the target, which far exceeds the band-width between a few racks and several array switches today.Moreover, recent FPGAs have significantly enhanced serialtransceiver performance, supporting up to 28 Gbps band-width [14] in the 28 nm generation.
We reduce host communication latency by using our ownprotocol over the serial links. Including all packet payload

DDR2 Memory Controller
2x2 144-bit Crossbar
Server Model
1
Server Model
0
NIC host $
NICModel 0
NICModel 1
Switch Host $
Host $ ring station
Host $ ring station
Rack SwitchModel 0
Rack SwitchModel 1
2-to-1 Host memory arbiter
Host mem access data path
(144-bit @ clk 2x)
Target network data path
(64-bit @ clk)
Simulation Partition 0
Performance Counters Gigabit Frontend Link
Simulation Scheduler Multi-gigabit Transceivers
To control PC
To Switch FPGAs
To multi-gigabit Transceivers
Simulation Partition 1
Mem
ory
Cont
rolle
r Array/Datacenter Switch Model
Performance Counters
Gigabit Frontend Link
Simulation Scheduler
Multi-gigabit Transceivers
Array/Datacenter Switch Model
To control PC
To other Switch FPGAs To Rack FPGAs
Switch FPGARack FPGASimulation Partition
Figure 3. DIABLO FPGA simulator architecture. Only two FPGA configurations are used: Rack FPGA and Switch FPGA.
and overhead, the overall round-trip latency between FAMEmodels on different FPGAs is only around 1.6µs. In addi-tion, the host-multithreaded FAME-7 design further helps tohide host communication latency, removing model synchro-nization latency as a simulator performance bottleneck.
3.3 DIABLO FPGA ModelsDIABLO contains three FPGA models corresponding tothree basic components in WSC array network infrastruc-ture: compute servers, network interface cards, and networkswitches. To enable design-space exploration without time-consuming FPGA re-synthesis, all the models have runtime-configurable parameters. All the modules were custom-builtin SystemVerilog with minimal use of 3rd-party IP blocks.
Server ModelThe server model is built on top of RAMP Gold [54], whichis an open-source cycle-level full-system FAME-7 architec-ture simulator supporting the full 32-bit SPARC v8 ISA.RAMP Gold also models MMUs, timers, and interrupt con-trollers, and boots Linux 2.6.39.3 and 3.5.7 kernels as wellas a many-core research OS [45]. The server model is bi-nary compatible with existing SPARC32 machines, and runsunmodified binaries from Debian Linux distributions.
We map one target server running an independent Linuxinstance to one hardware thread in the host server modelpipeline, with each host pipeline in DIABLO simulatinga WSC rack holding up to 32 servers. Each simulatedserver uses a simplified runtime-configurable fixed-CPI tim-ing model, where all instructions take a fixed number of cy-cles. The goal of the simple server model is not to modelWSC server microarchitecture with 100% accuracy but runa full software stack with an approximate performance esti-mate or bound. More detailed timing models could be im-plemented, but would require additional host hardware re-sources and would thus reduce simulation scale.
Even though the RAMP Gold pipeline improves servermodel performance by two orders-of-magnitude over state-
of-the-art software simulators, the server models are still thesimulation bottleneck for the whole DIABLO system.
Switch ModelTo demonstrate the flexibility of our approach, we buildFAME-7 models for two broad categories of WSC arrayswitch: those using connectionless packet switching, alsoknown as datagram switching, and those using connection-oriented virtual-circuit switching.
Although packet switches dominate current WSC net-works, some researchers are proposing new circuit-switching designs for WSCs to provide more predictablelatencies and to take advantage of new high-speed switch-ing technologies. The proposed designs are only availableas early research prototypes but details are open, and somehave been directly implemented on FPGAs [59], simplify-ing construction of highly accurate models. An earlier pub-lication [56] showed that the fully detailed model for a 128-port 10-Gbps high-radix array/datacenter circuit-switchingswitch can fit on a single FPGA.
In contrast, the packet switches used in existing produc-tion WSCs pose a considerable modeling challenge due totheir design complexity and their hidden proprietary mi-croarchitecture. To make modeling tractable, we simplifyour abstract models by removing features that are seldomused in a WSC. Here are the simplifications we employedand the rationale behind our choice:
Ignore Ethernet QoS-related features: Although QoSfeatures (e.g. support of IEEE 802.1p class of service(CoS)) are available on almost every switch today,many WSCs only utilize switches for basic connectivitywithout turning on QoS features.
Use simplified source routing: Many switches [11, 12] al-ready support TCAM-based flow tables that have at least32 K entries. Given the total number of machines in aWSC, the slow-path flow-table update is rarely executed,making the flow-table lookup time constant in practice.Besides, WSC topologies do not change frequently, and

routes can be pre-configured statically. We use sourcerouting to simplify modeling of packet routing, and wenote that source routing is actually a component of manyWSC-switch research proposals. To emulate more com-plicated flow-table operations, we could implement d-lefthash tables [49] using host DRAM. This technique hasalready been applied by recent datacenter switches im-plementing large flow tables [11].
Abstract packet processors: Commercial datacenterswitches include many pipelined packet processors thathandle different tasks such as MAC address learning,VLAN membership, and so on. The processing timeof each stage is relatively constant regardless of packetsize, and the time can be as short as a few hundrednanoseconds [31] to a few microseconds [11].
Although commercial switch implementation details aregenerally not publicly available, the fundamentals of theseswitch architectures are well known. Examples include thearchitecture of a virtual-output-queue switch and commonscheduling algorithms. We build our abstracted model fo-cusing on these central well-known architectural features,and allow other parts that are unclear or of special inter-est to researchers (for example, packet buffer layout) to beconfigurable during simulation. Specifically, in our switchmodels, we focus on the data path features, such as switchbuffer management and configuration, which have becomean active area for packet-switch researchers [26]. We baseour packet buffer models after that of the Cisco Nexus 5000switch, with configurable parameters selected according toa Broadcom switch design [42]. We also model high linkbandwidth and cut-through switching fabrics with low port-to-port latencies. These are all essential features for explor-ing future high-performance WSC switches, which are notvery easy to deploy at scale for testing in the real world be-cause of high cost.
There has been an increasing research interest in thearea of Software Defined Networks (SDNs) using Openflow-capable switches in the WSC. The datapaths of these SDNswitches are actually identical to those of conventionalswitches, and our simplified source-routed switch modelscan be easily extended to support the flow-table architectureused by an SDN switch.
In DIABLO, we use a unified abstract virtual output-queue switch model with a simple round-robin schedulerfor all levels of switch. Switch models in different layers ofthe network hierarchy differ only in their link latency, band-width, and buffer configuration parameters. An earlier pub-lication provides more details of our switch model [56]. OurFAME-7-based switch model is four times faster than a soft-ware single-threaded network simulator used at Google [8]that does not simulate packet payloads or support fullsoftware-stack scaling to 10,000 nodes as does DIABLO.
NIC ModelsThe DIABLO NIC models an abstracted Ethernet device,whose internal architecture resembles that of the Intel 8254xGigabit Ethernet controller on the popular Intel PRO/1000MT server adapter. It is also popular among many VM im-plementations such as Virtual Box [20], VMWare VirtualServer [21], QEMU [19], and Microsoft Hyper-V [16]. Fig-ure 4 shows the target architecture of our abstracted NICmodel. The core feature of the NIC is a scatter/gather DMAwith ring-based packet buffers stored in the main systemDRAM. The scatter/gather DMA is used to support thezero-copy feature in Linux, and is essential for any high-performance networking interface. In our current prototype,we support only one hardware ring buffer for each of the re-ceive (RX) and transmit (TX) queues. For model simplicity,we did not model any hardware checksum offloading. In-stead, we turn off the packet checksum feature in the Linuxkernel to emulate having a hardware checksum offloadingengine in the NIC without taking additional CPU time. Our
RX Descriptor
RingRX Packet
Data Buffers
TX Descriptor
RingTX Packet
Data BuffersHost
DRAM
Kernel Space Device DriverOS Networking Stack
DMA Engines Interrupt
RX/TX Physical Interface
ApplicationApplicationApplications
Network Interface Card
User SpaceZero-copy data path
Regular data path
To network
Figure 4. Software and hardware architecture of genericnetwork interface cards
NIC device driver supports all features of a generic LinuxEthernet device driver. We can run unmodified TCP/IP userapplications using the standard socket programming inter-face. To model high performance NICs, our driver supportsadvanced features such as Zero-copy, RX/TX interrupt miti-gation and the NAPI polling interface [52].
The NIC model is a straightforward FAME-7 implemen-tation of the target hardware. The basic functionality of aNIC is to manipulate packet data stored in the DRAM, butDRAM performance is much less an issue for FAME modelsso the NIC model is not on the simulator critical path.
3.4 DIABLO Cluster PrototypeThe DIABLO prototype was built using a rack of BEE3boards [32]. Each board has four Xilinx Virtex-5 LX155TFPGAs, each with 16 GB of DDR2 memory across twoindependent DRAM channels, resulting in 64 GB total perboard. Each FPGA provides eight 2.5 Gbps SERDES lanesin two CX4 ports to connect to other FPGAs.

On each Rack FPGA of the current BEE3 boards, weevenly distribute four 32-thread server models to two hostDRAM channels and partition the host DRAM for servercomputations, simulating four racks with 124 servers. Eachserver model has one ToR switch model attached to the sameDRAM controller.
Component Name LUT Register BRAM LUTRAMServer Models 28,445 37,463 96 6,584NIC Models 9,467 4,785 10 752Rack Switch Models 4,511 3,482 52 345Miscellaneous 3,395 16,052 31 5,058Total 45,818 62,811 189 12,739
Table 2. Rack FPGA resource utilization on Xilinx Virtex-5LX155T after place and route using Xilinx ISE 14.3.
Table 2 shows the overall resource utilization of the RackFPGA on the BEE3 board. Including the resources dedicatedfor FPGA routing, the device is almost fully utilized with95% of logic slices occupied at a 90 MHz host clock rate.The chip resources are dominated by structures to simulateserver computation. On each FPGA, we equally divide the16 GB physical DRAM into 128⇥128 MB partitions. Eachsimulated server uses one partition for target memory stor-age. For each server pipeline, we use 31 threads out of the 32available threads and save the DRAM storage of the remain-ing thread for simulating packet buffers on the ToR switch.Each DIABLO model has a dedicated on-chip host cache tooptimize simulator DRAM accesses.
All DIABLO models on the same FPGA share a singleGigabit Ethernet connection as the frontend connection forbootstrapping, console output and functional I/O, such askeyboard and disk access.
The Switch FPGA is just a cut-down version of theRack FPGA containing only switch models and fewer servermodel pipelines. A single server functional model pipeline,without a timing model, is used to run functional configura-tion for our switch models. The server functional model canalso act as a control-plane processor for a simulated switch.
We emphasized reliability over performance in physicaldesign. We protect all physical links, such as Gigabit Eth-ernet and serial links, with hardware checksums and retriesto handle occasional soft errors, which we’ve observed oc-cur a few times per day in our prototype. We also use ECCto protect all memory data paths that interact with the ECCmemory DIMMs on our FPGA board.
A 3,000-node DIABLO systemWe used 9 BEE3 boards totalling 36 FPGAs to build a siz-able prototype, as Figure 5 shows. We use off-the-shelf CX4breakout cables to connect arbitrary transceiver pairs on dif-ferent FPGAs from the front panel following the target net-work topology. We populate six boards with the Rack-FPGAdesign simulating 2,976 servers with 96 rack switches. Weload the remaining three boards with the Switch-FPGA de-
(a) Without inter-board connections (b) Fully-connected with high-speedcables
Figure 5. DIABLO cluster prototype
sign to simulate 6 array switches and one datacenter switch.Using an additional 13 boards, we could scale the existingsystem to build an emulated large WSC array with 11,904servers and 385 rack switches.
The whole FPGA cluster has a total memory capacityof 576 GB in 72 independent DRAM channels with an ag-gregated bandwidth of 268 GB/s. All FPGA boards fit intoa standard server rack, and the prototype consumes about1.5 kW when active. Each FPGA has a Gigabit frontendcontrol link connected to a shared 48-port gigabit switch.We use two 12-core Intel Xeon X5680 servers to drive allnine FPGA boards using our custom protocol over Ether-net. Each server has four 1 Gbps interface card connectedto the 48-port switch to balance the control traffic to differ-ent boards. We store boot disk images and console I/O logsof all 2,976 servers on a striped RAID-0 partition on eachfront-end server. This setup is used to optimize the simulatedLinux booting process, where all simulated servers accessdisk images over 8⇥1 Gbps links simultaneously.
The BEE3 boards used have 2007-era FPGAs and olderDRAM DIMMs, and the BEE3 board was not designed withlow-cost simulations in mind. Each BEE3 cost $15K, andthe total cost of a 9-board system was about $140K. Al-though the BEE3 hardware is now somewhat dated, the sys-tem was sufficient to develop and evaluate the approach andgather experience for the next system. Because DIABLOuses a modular design and uses only the serial links betweenFPGAs, we can readily port DIABLO to lower-cost single-FPGA boards. Using the latest 20nm FPGAs in 2015 andwith a redesigned board, we estimate we could now poten-tially build a 32,000-node DIABLO system using just 32 FP-GAs and an overall cost of $150K including DRAM.
4. Case StudiesIn this section, we demonstrate the capabilities of the DIA-BLO prototype and validate its performance models usingcase studies drawn from classic networking problems run atscale. We show the effects of changing both hardware andsoftware parameters of the system, including switch band-
width, latency, buffer configuration, target server CPU per-formance, operating systems, and application logic.
4.1 Reproducing TCP IncastIncast is a classic many-to-one communication pattern com-monly found in many WSCs implementing scale-out dis-tributed storage and computing frameworks, such as Hadoopand Map-Reduce. In particular, the TCP Incast problem [53,60] refers to the application-level throughput collapse thatoccurs as the number of servers returning data to a client in-creases past the ability of an Ethernet switch to buffer pack-ets. Previous work [28, 60] has focused on studying the inter-play between the TCP retransmission timeout (RTO) valueand the limited capacity of buffers in low-cost ToR switches.However, as pointed out in [53], TCP Incast is only obviousunder specific hardware and software setups, for instancewith switches that have very small shared packet buffers.
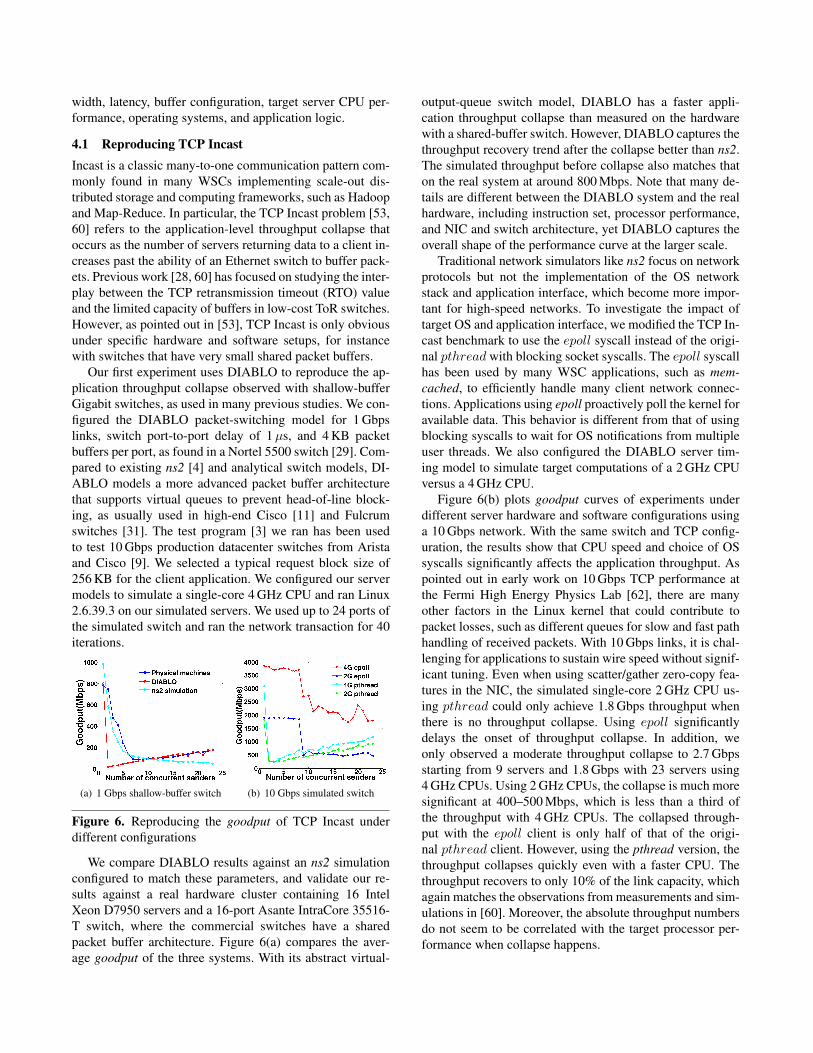
Our first experiment uses DIABLO to reproduce the ap-plication throughput collapse observed with shallow-bufferGigabit switches, as used in many previous studies. We con-figured the DIABLO packet-switching model for 1 Gbpslinks, switch port-to-port delay of 1µs, and 4 KB packetbuffers per port, as found in a Nortel 5500 switch [29]. Com-pared to existing ns2 [4] and analytical switch models, DI-ABLO models a more advanced packet buffer architecturethat supports virtual queues to prevent head-of-line block-ing, as usually used in high-end Cisco [11] and Fulcrumswitches [31]. The test program [3] we ran has been usedto test 10 Gbps production datacenter switches from Aristaand Cisco [9]. We selected a typical request block size of256 KB for the client application. We configured our servermodels to simulate a single-core 4 GHz CPU and ran Linux2.6.39.3 on our simulated servers. We used up to 24 ports ofthe simulated switch and ran the network transaction for 40iterations.
(a) 1 Gbps shallow-buffer switch (b) 10 Gbps simulated switch
Figure 6. Reproducing the goodput of TCP Incast underdifferent configurations
We compare DIABLO results against an ns2 simulationconfigured to match these parameters, and validate our re-sults against a real hardware cluster containing 16 IntelXeon D7950 servers and a 16-port Asante IntraCore 35516-T switch, where the commercial switches have a sharedpacket buffer architecture. Figure 6(a) compares the aver-age goodput of the three systems. With its abstract virtual-
output-queue switch model, DIABLO has a faster appli-cation throughput collapse than measured on the hardwarewith a shared-buffer switch. However, DIABLO captures thethroughput recovery trend after the collapse better than ns2.The simulated throughput before collapse also matches thaton the real system at around 800 Mbps. Note that many de-tails are different between the DIABLO system and the realhardware, including instruction set, processor performance,and NIC and switch architecture, yet DIABLO captures theoverall shape of the performance curve at the larger scale.
Traditional network simulators like ns2 focus on networkprotocols but not the implementation of the OS networkstack and application interface, which become more impor-tant for high-speed networks. To investigate the impact oftarget OS and application interface, we modified the TCP In-cast benchmark to use the epoll syscall instead of the origi-nal pthread with blocking socket syscalls. The epoll syscallhas been used by many WSC applications, such as mem-cached, to efficiently handle many client network connec-tions. Applications using epoll proactively poll the kernel foravailable data. This behavior is different from that of usingblocking syscalls to wait for OS notifications from multipleuser threads. We also configured the DIABLO server tim-ing model to simulate target computations of a 2 GHz CPUversus a 4 GHz CPU.
Figure 6(b) plots goodput curves of experiments underdifferent server hardware and software configurations usinga 10 Gbps network. With the same switch and TCP config-uration, the results show that CPU speed and choice of OSsyscalls significantly affects the application throughput. Aspointed out in early work on 10 Gbps TCP performance atthe Fermi High Energy Physics Lab [62], there are manyother factors in the Linux kernel that could contribute topacket losses, such as different queues for slow and fast pathhandling of received packets. With 10 Gbps links, it is chal-lenging for applications to sustain wire speed without signif-icant tuning. Even when using scatter/gather zero-copy fea-tures in the NIC, the simulated single-core 2 GHz CPU us-ing pthread could only achieve 1.8 Gbps throughput whenthere is no throughput collapse. Using epoll significantlydelays the onset of throughput collapse. In addition, weonly observed a moderate throughput collapse to 2.7 Gbpsstarting from 9 servers and 1.8 Gbps with 23 servers using4 GHz CPUs. Using 2 GHz CPUs, the collapse is much moresignificant at 400–500 Mbps, which is less than a third ofthe throughput with 4 GHz CPUs. The collapsed through-put with the epoll client is only half of that of the origi-nal pthread client. However, using the pthread version, thethroughput collapses quickly even with a faster CPU. Thethroughput recovers to only 10% of the link capacity, whichagain matches the observations from measurements and sim-ulations in [60]. Moreover, the absolute throughput numbersdo not seem to be correlated with the target processor per-formance when collapse happens.

In conclusion, switch buffers are not always the one andonly limiting factor for TCP Incast. The long TCP retrans-mission timeout is just a consequence of an imbalanced sys-tem. Simple analytical or network simulation models mightallow parameters to be set to match results for a small num-ber of faster machines connected by a slower network, butthen the models will not correctly predict behavior of ascaled system.
4.2 Studying memcached Latency Long Tail at ScaleOne of the greatest challenges in building responsive large-scale computer systems is the nature of request service vari-ations. For example, Google researchers found long-tail dis-tributions for web query latencies, where some request la-tencies are multiple orders of magnitude longer than the me-dian [24, 33]. Moreover, more requests fall into the tail asthe system scale increases. There are multiple complex un-derlying causes of the long tail, including queuing in bothsoftware and hardware, kernel schedulers, shared hardwareresources and many others [33]. Hence, reproducing the longtail and understand the contributing factors requires analyz-ing hardware along with the full software stack at large scale.In this section, we use DIABLO to illustrate the impact ontail latency of many factors including: implementation ofthe application, versions of the OS kernel, network transportprotocols, as well as switch design.
Experiment setupTo demonstrate running production WSC software, weran the popular memcached [2, 5, 17] distributed key-value store application on DIABLO. We used unmodifiedmemcached source code versions 1.4.15 and 1.4.17.
In a real production environment, the client workloads ofmemcached servers are generated by the front-end web tier.Although the API is simple, it is difficult to accurately repre-sent a memcached workload. In particular, previous studiesshow that the object size distribution has a large impact onthe system behavior [44]. Simple microbenchmark tools likememslap do not attempt to reproduce the statistical charac-teristics of real traffic. To provide a more realistic workload,we built our own client based on recently published Face-book live traffic statistics [23]. At Facebook, memcached
servers are partitioned based on the concept of pools. Wefocused on one of the pools that is the most representative,and validated our workload generator against the Facebookdata [23].
Figure 7 shows the simulated target topology. Each rackcontains 31 servers with one Top-of-Rack switch. We usedthe 32nd port on the rack switch to connect to an arrayswitch, creating a bandwidth over-subscription ratio of 31 to1. Each array switch supports up to 16 inward-facing linksand one uplink to the datacenter switch, thus having a band-width over-subscription ratio of 16-to-1. With the runtimeconfigurable switch timing models, we are able to simu-late a 1 Gbps interconnect with 1µs port-to-port switch la-
DC#Switch#
16 Racks / Array x 4
……..
2 Servers / Rack
29 Clients / Rack
Array#Switch#
….
ToR# ToR#
Array#Switch#
….
ToR# ToR#
Figure 7. Memcached experimental setup.
tency as well as a 10 Gbps interconnect with 100 ns port-to-port switch latency. We used the same simulated switchbuffer configuration as in section 4.1, and used the simple4 GHz fixed-CPI timing model for server CPUs. This simu-lation required six BEE3 boards: four boards to simulate 64server racks of 1,984 servers, one board to simulate all arrayswitches, and the remaining board for the datacenter switchsimulation.
We distributed 128 memcached servers evenly across all64 racks to minimize potential hot spots in the network,and used the remaining machines as clients. This creates aconfiguration of two memcached servers and 29 clients ina single rack. Each client sends 30K requests to a randomlyselected server from all 128 servers, each configured with a64 MB memory pool.
We performed experiments at several scales: 496-node,992-node, and 1984-node. For convenience when presentingresults, we round up the exact number of nodes to 500, 1000and 2000 respectively in the rest of this paper. We scale downthe number of servers when running a smaller configuration,maintaining a constant server-to-client ratio. The 500-nodesetup uses only one 16-port array switch without a datacenterswitch, while both 1000-node and 2000-node experimentsexercise all three levels of switches. We also performedour load tests using both TCP and UDP protocols. CPUutilization in all servers is moderate, at under 50%. There isalso no packet retransmission due to switch buffer overruns.
Validating memcached on real clusters andReproducing the latency long tail on DIABLOFirst, to validate our DIABLO models at an understand-able scale, we deployed a set of memcached experimentsat the single-rack scale using a real cluster. Our single-rack16-node testbed includes 3 GHz Intel Xeon D7950 serversrunning Linux 2.6.34 connected with a 16-port Asante In-traCore 35516-T Gigabit switch. We used two machines asmemcached servers with the rest as clients. We let eachclient thread send 30,000 requests till completion. We alsotried 100,000 requests with up to 256 MB server memorypool, and the steady-state performance numbers were simi-lar. We configured each server with several parameter com-

binations, for example 4 or 8 worker threads using TCP orUDP connections.
(a) Throughput
(b) Latency
Figure 8. Real machines vs. simulated memcached servers.
We compared results from the perspective of both serverand client. Figure 8(a) shows the throughput of a measuredserver versus a simulated server under different number ofclients. We only show results from one server, as throughputcurves of other servers are similar. Figure 8(b) illustratesthe average request latencies measured at every client. Forall configurations we tested at this small scale, DIABLOsuccessfully reproduced the shapes of performance curves.The client latency stays low and scales linearly with a smallnumber of clients, while more clients saturate the server. Weexpect absolute performance differences between real andsimulated clusters, as DIABLO uses a different simulatedhardware specification. However, the goal is to reproducethe trend at scale.
As with prior studies using real physical testbeds, our val-idation efforts are limited by available networking and com-puting hardware. To perform scale-out validations, we ranthe same experiments on an 8-rack 120-node Intel Xeon E5-2620 v2 cluster with 10 Gbps rack switches and a 40 Gbpsaggregate switch [6]. As we could not obtain dedicated ac-cess to this large shared cluster, we had to run the same ex-periments many times and choose 10 runs without a signifi-cant background workload in the cluster. Figure 9 comparesthe client request latency tail measured from the large phys-ical cluster with the simulation results from DIABLO. Toshow the robustness of our data from the shared physicalcluster, we plotted the error bars in Figure 9. At the scale of120 machines, we do see < 0.1% of total requests finish or-ders of magnitude slower than regular requests. The newermemcached 1.14.17 has a slightly better tail performancethan the older 1.14.15 on both simulated and real cluster. Thesimulated 120-node setup is a more ideal environment with
less software services running in the background. Therefore,there are fewer requests falling into the tail compared to areal system. Similarly, the difference between the two ver-sions of memcached becomes less obvious.
0 200 400 600 800 10000.98
0.99
1
Latency (microsecond)
Cum
ulat
ive
Dist
ribut
ion
[Physical] Memcached 1.4.17[Physical] Memcached 1.4.15[DIABLO] Memcached 1.4.17[DIABLO] Memcached 1.4.15
Figure 9. Client latency CDF on a 120-node real cluster vs.DIABLO
10^1 10^2 10^30
0.05
0.1
0.15
0.2
0.25
Latency (microsecond)
Fre
qu
ency
1Gbps Local1Gbps 1−Hop1Gbps 2−Hop1Gbps Overall10 Gbps Local10 Gbps 1−Hop10 Gbps 2−Hop10 Gbps Overall
Figure 10. PMF of client request latency at 2000-node onDIABLO using UDP.
Figure 10 plots the Probability Mass Function (PMF) ofall client queries for the 2k-node DIABLO simulation run-ning UDP over different interconnects. The shape of PMF issimilar at the scale of 500-node and 1k-node. We also ob-served similar latency long tails using TCP. We found themajority of requests finished in less than 100µs, but thereare a small number of requests that finished more than twoorders of magnitude slower than the average, reproducingthe long tail distribution. To understand the long tail better,we classified all queries into three different categories basedon the number of physical switches they traverse, with localindicating requests hit the same rack. From Figure 10, weknow that all three types of requests exhibit a long tail dis-tribution. The more switches the query traverses, the greaterthe latency variation. Moreover, 2-hop requests dominate theoverall latency distribution at large scale, as the majority ofrequests travel to a remote rack.
From Figure 11, we can also tell the impact of systemscale on the latency tail. For example, the 99-percentilelatency of a 2K-node system is more than an order-of-magnitude worse than that of a 500-node system. These ob-servations from DIABLO match those reported in a recentGoogle publication [33].

Figure 11. 95th � 100th percentile CDF of client latency atdifferent scales on a 1 Gbps interconnect running UDP.
Impact of network hardwareOne straightforward solution to reduce request latency isto upgrade the network hardware, and we next explore thepotential performance gain via DIABLO simulations. Wesimulate a low-latency 10 Gbps switch with 10⇥ bandwidthand 10⇥ shorter latency compared to the simulated 1 Gbpsnetwork. From our results, the improved cut-through switchdoes help to reduce request latencies, but the improvement isno more than 2⇥. This indicates that the full OS networkingstack dominates the request latency. Google showed similarresults from their large-scale testbed using O(100 ns) low-latency switches [24].
Further, to evaluate the robustness of our simulation re-sults, we simulated the client latency tail with an additional50 ns and 100 ns port-to-port latency at all switch levels,with results in Figure 12. The error bars on the figure arevery small showing that the cycle-level DIABLO simulatoris quite stable when tweaking simulated hardware configura-tions. We found that the extra switch latency does not affectthe shape of the tail curves, although the 99-percentile la-tency increases to 364µs from 253µs. In addition, the extraswitch latency does not impose a significant tax on regularnon-tail request latencies.
0 200 400 600 800 10000.96
0.97
0.98
0.99
1
Latency (microsecond)
Cum
ulat
ive D
istrib
utio
n
+0 ns+50ns+100 ns
Figure 12. Client latency tail with different switch laten-cies.
Impact of the network transport protocol at scaleAs mentioned earlier, current evaluation technologies onlyallow most networking researchers to conduct full-system
experiments at scales of O(10) to O(100). Often the mostintuitive solution to a networking issue is to change thenetwork transport protocol. However, one big question iswhether we can generalize O(10)–O(100) node results to alarger scale at O(1000)–O(10,000). In this section, we con-duct a simple experiment using DIABLO to quantitativelyanalyze which network protocol (TCP or UDP) is better atreducing the long-tail at scale, by sweeping through severalsystem parameters including interconnect performance andsystem scale.
Figure 13 shows the cumulative tail distribution of usingdifferent protocols. For the 1 Gbps interconnect, at the 500-node scale the UDP protocol is a clear winner compared toTCP. However, UDP’s advantage disappears when movingto 1000 nodes, as TCP slightly outperforms UDP. When wemove to the 2000-node scale, TCP is better. The conclusionat 2000-node scale is completely reversed to that at 500nodes. On the other hand, upgrading the interconnect to10 Gbps shows a very different result. Now, there is muchless difference between UDP and TCP.
The 500-node setup represents a small cluster in a full-scale datacenter, with 13–14 fully populated standard serverracks connected to a single aggregate array switch. For thegiven topology we simulated, both 1000-node and 2000-node setups require an extra aggregate switch. The extraaggregate switch contributes to the tail latency more thanusing more ports (2000 vs. 1000) on the same extra switch.
Impact of target operating systemDIABLO is different from prior simulators in that it can run1,000s of full OS instances while modeling time accurately.This enables experiments that are difficult even in a realWSC, e.g., deploying an experimental kernel on thousandsof machines.
We ported a more recent Linux 3.5.7 kernel and comparedits performance running our large-scale memcached exper-iments against those from the one-year-older 2.6.39.3 kernelused earlier in this section. We compare them at 2K nodeswith the same 10 Gbps interconnect and server hardware.Figure 14 plots the cumulative distribution of 95-percentileclient request latencies. We can see that there are significantimprovements in terms of request responsiveness in the new3.5.7 kernel. The average request latency is almost halved,and the better kernel scheduler and more efficient network-ing stack also helps to alleviate the latency long-tail issue.
This result shows that OS optimizations play a criticalrole in the performance of distributed applications, and OSbehaviour should be modeled when evaluating any new pro-posed new network designs.
Impact of application implementationIn addition to OS network stack design, another factor thataffects client request latency is the application’s implemen-tation and choice of system calls. We ran two versions ofmemcached, 1.4.17 and 1.4.15 on both the physical testbed

10^2 10^3 10^4 10^50.97
0.98
0.99
1
Latency (microsecond)
Cum
ulat
ive
Dis
tribu
tion
UDPTCP
(a) 500-node 1 Gbps
10^2 10^3 10^4 10^50.97
0.98
0.99
1
Latency (microsecond)
Cum
ulat
ive
Dis
tribu
tion
UDPTCP
(b) 1000-node 1 Gbps
10^2 10^3 10^4 10^50.97
0.98
0.99
1
Latency (microsecond)
Cum
ulat
ive
Dis
tribu
tion
UDPTCP
(c) 2000-node 1 Gbps
10^1 10^2 10^3 10^4 10^50.97
0.98
0.99
1
Latency (microsecond)
Cum
ulat
ive
Dis
tribu
tion
UDPTCP
(d) 500-node 10 Gbps
10^1 10^2 10^3 10^4 10^50.97
0.98
0.99
1
Latency (microsecond)
Cum
ulat
ive
Dis
tribu
tion
UDPTCP
(e) 1000-node 10 Gbps
10^1 10^2 10^3 10^4 10^50.97
0.98
0.99
1
Latency (microsecond)
Cum
ulat
ive
Dis
tribu
tion
UDPTCP
(f) 2000-node 10 Gbps
Figure 13. Comparing TCP vs UDP on CDFs of client request latency at different scale with different interconnect.
Figure 14. Impact of OS kernel versions on the 2,000-nodesystem.
Figure 15. Impact of memcachd versions on the latencyCDF. 1.4.17 has a slightly better tail performance similar toour validation results in Figure 9.
and DIABLO. One of the major differences for the slightnewer 1.4.17 is the support of the accept4 syscall, whicheliminates one extra syscall for each new TCP connec-tion [22].
For both versions, there is no significant difference be-tween the client request latencies on the real cluster at thescale of 120 nodes. The 1.4.17 memcached has a marginalbetter 99 percentile latency of 197µs, while the older 1.4.15is at 210µs.
To investigate the effectiveness of the accept4 syscall ata larger scale, we simulate a configuration with 500 nodesand another configuration with 2,000 nodes on DIABLO.Figure 15 shows the CDF of client latency of both configura-tions. At the 500-node scale, both versions of memcached onthe simulated cluster behave similarly to the 120-node realcluster. The 99-percentile client request latency of 1.4.17memcached is only 8µs faster on the simulated hardware.Note that the absolute latency difference between the sim-ulated hardware and real cluster is due to the fact that weconfigure our abstract model with a slightly faster switch.
On the other hand, when scaling to the 2,000-node scalewith one more aggregate switch in the network hierarchy, thebenefit of fewer syscalls in the newer version of memcachedbecomes more apparent. The 99-percentile client request la-tency of version 1.4.17 is 145µs versus 345µs of version1.4.15. This again shows how the scale of the system ampli-fies the latency tail effect.
To summarize, in our case studies, the impact of softwareimplementation of OS and application interface are far moreimportant than all the hardware and network transport proto-col changes we have studied. The detailed execution-drivenDIABLO models show that there are many more aspects inboth HW and SW stacks that could significantly affect theapplication tail latency at scale.
5. Discussion and Future WorkWhen simulating 4 GHz servers with a 10 Gbps intercon-nect, around 50 minutes of simulation wall-clock time arerequired for one second of target time; software simulationwould take almost two weeks. Moreover, DIABLO’s simu-lation performance scales perfectly. We observed no perfor-mance drop from simulating 500 nodes with two boards, to2,000 nodes using six boards. The simulation performanceis dominated by simulating the server computation usingRAMP Gold, which can be improved by reducing the num-ber of model threads per host hardware pipeline at the costof reduced system scale or increased hardware cost [54].
The FAME-7 modeling technique gives us the capabilityof emulating larger target systems with fewer virtualizedFPGA resources. However, the target memory capacity isvery hard to virtualize with limited physical DRAM storage.We should note that this is an open topic for any work that istrying to emulate a WSC with limited hardware resources.Another limitation is that we have only simulated fixed-CPI single-CPU servers with one hardware thread per servermodel. A more complex timing model supporting multi-coreCPUs is planned for DIABLO-2.
Neither limitation is intrinsic to the methodology, but in-stead reflects our use of a 5-year-old FPGA board. We aredeveloping a new FPGA board using upcoming 20 nm FP-GAs that should support a quad-core 64-bit server modelwith 4 GB/node memory capacity. Additional simulatedDRAM storage will be provided through PCIe-attachedNAND FLASH storage.
Our current prototype used FAME-7 style NIC/switchmodels, which run far faster than necessary for the sim-ulation while consuming considerable FPGA resources.We will replace these hardware models with a software-programmable microcoded model, to provide additionalflexibility as well as reduced resource usage.
6. ConclusionWe believe the research community needs a boost in evalu-ation technology to look at systems with scale of O(1,000)to O(10,000), as behavior is drastically different comparedto O(10) to O(100) systems. The working DIABLO proto-type enables networking researchers to conduct controllable,reproducible, full-stack WSC simulations at much largerscales than previously possible. We show that consideringend-to-end server computation, including full OS and ap-plication code, is essential to understanding network systemperformance, and has much greater impact than networkinghardware and protocols.
AcknowledgmentsThis research is supported in part by gifts from Oracle,Google, Microsoft, Amazon Web Services, Cisco Systems,Cloudera, eBay, Facebook, Fujitsu, Hewlett-Packard, In-tel, Network Appliance, SAP, VMWare and Yahoo! and by
matching funds from the State of California’s MICRO pro-gram (grants 06-152, 07-010, 06-148, 07-012, 06-146, 07-009, 06-147, 07-013, 06-149, 06-150, and 07-008), the Na-tional Science Foundation (grant #CNS-0509559), AFOSRunder MURI award FA9550-09-1-0539 (Air Force Officeof Sponsored Research in MURI program), and the Uni-versity of California Industry/University Cooperative Re-search Program (UC Discovery) grant COM07-10240. Thetestbed for validation work was supported in part by theby the National Basic Research Program of China Grant2011CBA00300, 2011CBA00301, the National Natural Sci-ence Foundation of China Grant 61033001, 61361136003.We thank the anonymous reviewers for their many insightfulcomments and suggestions.
References[1] XGS Core Switch Series - BCM88030 Series.
http://www.broadcom.com/products/Switching/
Carrier-and-Service-Provider/BCM88030-Series.
[2] Facebook Memcached. https://github.com/amanuel/
facebook-memcached.
[3] R2D2: RAPID AND RELIABLE DATA DELIVERYIN DATA CENTERS. http://www.stanford.edu/
~atikoglu/r2d2/.
[4] Network simulator, ns-2 : http://www.isi.edu/nsnam/ns/.
[5] Twemcache. https://twitter.com/twemcache.
[6] Tsinghua IIIS test cluster. http://wiki.iiis.systems/w/index.php/Cluster.
[7] Yahoo! Reaches for the Stars with M45 SupercomputingProject. http://research.yahoo.com/node/1884, 2007.
[8] Glen Anderson, private communications, 2009.
[9] Switching Architectures for Cloud Network De-signs. http://www.aristanetworks.com/en/
SwitchingArchitecture_wp.pdf, 2009.
[10] Sun Datacenter InfiniBand Switch 648. http://www.sun.
com/products/networking/infiniband.jsp, 2009.
[11] Cisco Nexus 5000 Series Architecture: The Building Blocksof the Unified Fabric. http://www.cisco.com/en/US/
prod/collateral/switches/ps9441/ps9670/white_
paper_c11-462176.html, 2010.
[12] Force10 S60 High-Performance 1/10 GbE Access Switch.http://www.force10networks.com/products/s60.
asp, 2010.
[13] Hadoop. http://hadoop.apache.org/, 2010.
[14] Xilinx Virtex 7 Series FPGAs. http://www.xilinx.com/
technology/roadmap/7-series-fpgas.htm, 2010.
[15] Google G-Scale Network. http://www.
eetimes.com/electronics-news/4371179/
Google-describes-its-OpenFlow-network, 2012.
[16] Microsoft Hyper-V virtualization platform. http:
//www.microsoft.com/en-us/server-cloud/
windows-server/server-virtualization.aspx,2012.

[17] memcached: a distributed memory objec caching system.http://memcached.org, 2012.
[18] Open Compute Project. http://opencompute.org, 2012.[19] QEMU open source processor emulator. http://wiki.
qemu.org, 2012.[20] Oracle Virtualbox VM. http://www.virtualbox.org/,
2012.[21] VMware Virtual Server. http://www.vmware.com, 2012.[22] Memcache 1.14.17 release notes. https://code.google.
com/p/memcached/wiki/ReleaseNotes1417, 2013.[23] B. Atikoglu, Y. Xu, E. Frachtenberg, S. Jiang, and
M. Paleczny. Workload analysis of a large-scale key-value store. In Proceedings of the 12th ACM SIGMET-RICS/PERFORMANCE joint international conference onMeasurement and Modeling of Computer Systems, SIGMET-RICS ’12, pages 53–64, New York, NY, USA, 2012. ACM.ISBN 978-1-4503-1097-0. . URL http://doi.acm.org/
10.1145/2254756.2254766.[24] L. A. Barroso. Warehouse-scale computing: Entering the
teenage decade. In Proceedings of the 38th annual inter-national symposium on Computer architecture, ISCA ’11,pages –, New York, NY, USA, 2011. ACM. ISBN 978-1-4503-0472-6.
[25] L. A. Barroso and U. Holzle. The Datacenter as a Com-puter: An Introduction to the Design of Warehouse-Scale Ma-chines. Synthesis Lectures on Computer Architecture. Mor-gan & Claypool Publishers, 2009.
[26] A. Bechtolsheim. Moore’s Law and Networking. In TheLinley Group Processor Conference, San Jose, CA, USA,2012.
[27] N. L. Binkert, R. G. Dreslinski, L. R. Hsu, K. T. Lim, A. G.Saidi, and S. K. Reinhardt. The M5 simulator: Modelingnetworked systems. IEEE Micro, 26(4):52–60, 2006. ISSN0272-1732.
[28] Y. Chen, R. Griffith, J. Liu, R. H. Katz, and A. D. Joseph.Understanding TCP incast throughput collapse in datacenternetworks. In WREN ’09: Proceedings of the 1st ACM work-shop on Research on enterprise networking, pages 73–82,New York, NY, USA, 2009. ACM. ISBN 978-1-60558-443-0.
[29] Y. Chen, R. Griffit, D. Zats, and R. H. Katz. Understand-ing tcp incast and its implications for big data workloads.Technical Report UCB/EECS-2012-40, EECS Depart-ment, University of California, Berkeley, Apr 2012. URLhttp://www.eecs.berkeley.edu/Pubs/TechRpts/
2012/EECS-2012-40.html.[30] M. Chowdhury, M. Zaharia, J. Ma, M. I. Jordan, and I. Stoica.
Managing data transfers in computer clusters with orchestra.In SIGCOMM, pages 98–109, 2011.
[31] U. Cummings, D. Daly, R. Collins, V. Agarwal, F. Petrini,M. Perrone, and D. Pasetto. Fulcrum’s FocalPoint FM4000: AScalable, Low-Latency 10GigE Switch for High-PerformanceData Centers. In Proceedings of the 2009 17th IEEE Sym-posium on High Performance Interconnects, pages 42–51,Washington, DC, USA, 2009. IEEE Computer Society. ISBN978-0-7695-3847-1. . URL http://portal.acm.org/
citation.cfm?id=1633800.1634467.
[32] J. Davis, C. Thacker, and C. Chang. BEE3: Re-vitalizing Computer Architecture Research. Techni-cal Report MSR-TR-2009-45, Microsoft Research, Apr2009. URL http://research.microsoft.com/apps/
pubs/default.aspx?id=80369.
[33] J. Dean and L. A. Barroso. The tail at scale. Communicationsof the ACM, 56(2):74–80, 2013.
[34] A. Ganesan, D. Lee, A. Leinwand, A. Shaikh, and M. Shaw.What is the impact of cloud computing on the data centerinterconnect? In Hot Interconnects, 2011.
[35] A. Greenberg, J. Hamilton, D. A. Maltz, and P. Patel. Thecost of a cloud: research problems in data center networks.SIGCOMM Comput. Commun. Rev., 39(1):68–73, 2009. ISSN0146-4833.
[36] A. Greenberg, J. R. Hamilton, N. Jain, S. Kandula, C. Kim,P. Lahiri, D. A. Maltz, P. Patel, and S. Sengupta. VL2: ascalable and flexible data center network. In SIGCOMM ’09,pages 51–62, New York, NY, USA, 2009. ACM. ISBN 978-1-60558-594-9.
[37] C. Guo, G. Lu, D. Li, H. Wu, X. Zhang, Y. Shi, C. Tian,Y. Zhang, and S. Lu. BCube: a high performance, server-centric network architecture for modular data centers. InSIGCOMM ’09, pages 63–74, New York, NY, USA, 2009.ACM. ISBN 978-1-60558-594-9.
[38] J. L. Hennessy and D. A. Patterson. Computer architecture: aquantitative approach. Elsevier, 2012.
[39] L. R. Hsu, A. G. Saidi, N. L. Binkert, and S. K. Reinhardt.Sampling and stability in tcp/ip workloads. In Proceedings ofthe First Annual Workshop on Modeling, Benchmarking, andSimulation, MoBS ’05, pages 68–77, 2005.
[40] D. A. Joseph, A. Tavakoli, and I. Stoica. A policy-awareswitching layer for data centers. In SIGCOMM ’08, pages 51–62, New York, NY, USA, 2008. ACM. ISBN 978-1-60558-175-0.
[41] R. Katz. Tech titans building boom: The architecture ofinternet datacenters. IEEE Spectrum, February 2009.
[42] B. Kwan, P. Agarwal, and L. Ashvin. Flexible buffer allo-cation entities for traffic aggregate containment. US Patent20090207848, August 2009.
[43] J. Li, N. K. Sharma, D. R. K. Ports, and S. D. Gribble. Talesof the tail: Hardware, OS, and application-level sources of taillatency. In Proceedings of the ACM Symposium on CloudComputing (SoCC), Seattle, WA, USA, 11 2014. ACM. URLpapers/latency-socc14.pdf.
[44] K. Lim, D. Meisner, A. Saidi, P. Ranganathan, and T. F.Wenisch. Thin Servers with Smart Pipes: Designing SoCAccelerators for Memcached. In Proceedings of the 40thannual international symposium on Computer architecture,ISCA ’13, 2013.
[45] R. Liu et al. Tessellation: Space-Time partitioning in a many-core client OS. In HotPar09, Berkeley, CA, 03/2009 2009.URL http://www.usenix.org/event/hotpar09/tech/.
[46] P. S. Magnusson et al. Simics: A Full System SimulationPlatform. IEEE Computer, 35, 2002.

[47] N. McKeown, T. Anderson, H. Balakrishnan, G. Parulkar,L. Peterson, J. Rexford, S. Shenker, and J. Turner. Open-flow: enabling innovation in campus networks. SIGCOMMComput. Commun. Rev., 38(2):69–74, Mar. 2008. ISSN 0146-4833. . URL http://doi.acm.org/10.1145/1355734.
1355746.[48] D. Meisner, J. Wu, and T. F. Wenisch. BigHouse: A Sim-
ulation Infrastructure for Data Center Systems. ISPASS ’12:International Symposium on Performance Analysis of Systemsand Software, April 2012.
[49] M. Mitzenmacher and A. Broder. Using multiple hash func-tions to improve ip lookups. In In Proceedings of IEEE IN-FOCOM, pages 1454–1463, 2000.
[50] R. Niranjan Mysore, A. Pamboris, N. Farrington, N. Huang,P. Miri, S. Radhakrishnan, V. Subramanya, and A. Vahdat.PortLand: a scalable fault-tolerant layer 2 data center networkfabric. In SIGCOMM ’09, pages 39–50, New York, NY, USA,2009. ACM. ISBN 978-1-60558-594-9.
[51] D. Ongaro, S. M. Rumble, R. Stutsman, J. K. Ousterhout, andM. Rosenblum. Fast crash recovery in ramcloud. In SOSP,pages 29–41, 2011.
[52] J. H. Salim, R. Olsson, and A. Kuznetsov. Beyond softnet.In Proceedings of the 5th annual Linux Showcase & Con-ference - Volume 5, ALS ’01, pages 18–18, Berkeley, CA,USA, 2001. USENIX Association. URL http://dl.acm.
org/citation.cfm?id=1268488.1268506.[53] H. Shah. Solving TCP Incast in Cluster Storage Sys-
tems. Technical report (Information Networking Institute).Carnegie Mellon University. Information Networking Insti-tute, 2009. URL http://books.google.com/books?id=
Rl2jYgEACAAJ.[54] Z. Tan, A. Waterman, R. Avizienis, Y. Lee, H. Cook, D. Pat-
terson, and K. Asanovic and. RAMP gold: An FPGA-basedarchitecture simulator for multiprocessors. In Design Automa-tion Conference (DAC), 2010 47th ACM/IEEE, pages 463 –468, June 2010.
[55] Z. Tan, A. Waterman, H. Cook, S. Bird, K. Asanovic, andD. Patterson. A case for FAME: FPGA architecture modelexecution. In Proceedings of the 37th annual internationalsymposium on Computer architecture, ISCA ’10, pages 290–301, New York, NY, USA, 2010. ACM. ISBN 978-1-4503-0053-7.
[56] Z. Tan, K. Asanovic, and D. Patterson. Datacenter-scalenetwork research on fpgas. In Proc. Workshop on ExascaleEvaluation and Research Techniques, 2011.
[57] A. Tavakoli, M. Casado, T. Koponen, and S. Shenker. Apply-ing NOX to the datacenter. In HotNets, 2009.
[58] C. Thacker. Rethinking data centers. October 2007.[59] C. Thacker. A data center network using FPGAs, May 2010.[60] V. Vasudevan, A. Phanishayee, H. Shah, E. Krevat, D. G.
Andersen, G. R. Ganger, G. A. Gibson, and B. Mueller. Safeand effective fine-grained TCP retransmissions for datacentercommunication. In SIGCOMM ’09, pages 303–314, NewYork, NY, USA, 2009. ACM. ISBN 978-1-60558-594-9.
[61] G. Wang, D. G. Andersen, M. Kaminsky, K. Papagiannaki,T. S. E. Ng, M. Kozuch, and M. P. Ryan. c-through: part-timeoptics in data centers. In SIGCOMM, pages 327–338, 2010.
[62] W. Wu and M. Crawford. Potential performance bottleneckin linux tcp. Int. J. Commun. Syst., 20(11):1263–1283, Nov.2007. ISSN 1074-5351. . URL http://dx.doi.org/10.
1002/dac.v20:11.[63] M. Zaharia, D. Borthakur, J. S. Sarma, K. Elmeleegy,
S. Shenker, and I. Stoica. Delay scheduling: a simple tech-nique for achieving locality and fairness in cluster scheduling.In EuroSys, pages 265–278, 2010.