diabetic retention in the national ‘get checked’ programme dr rawiri keenan janet amey prof....
TRANSCRIPT

Diabetic Retention in the National ‘Get Checked’ Programme
Dr Rawiri Keenan
Janet Amey
Prof. Ross Lawrenson
Outline
• What is MHN?
• Why we chose to do the study
• Methods
• Results/Discussion
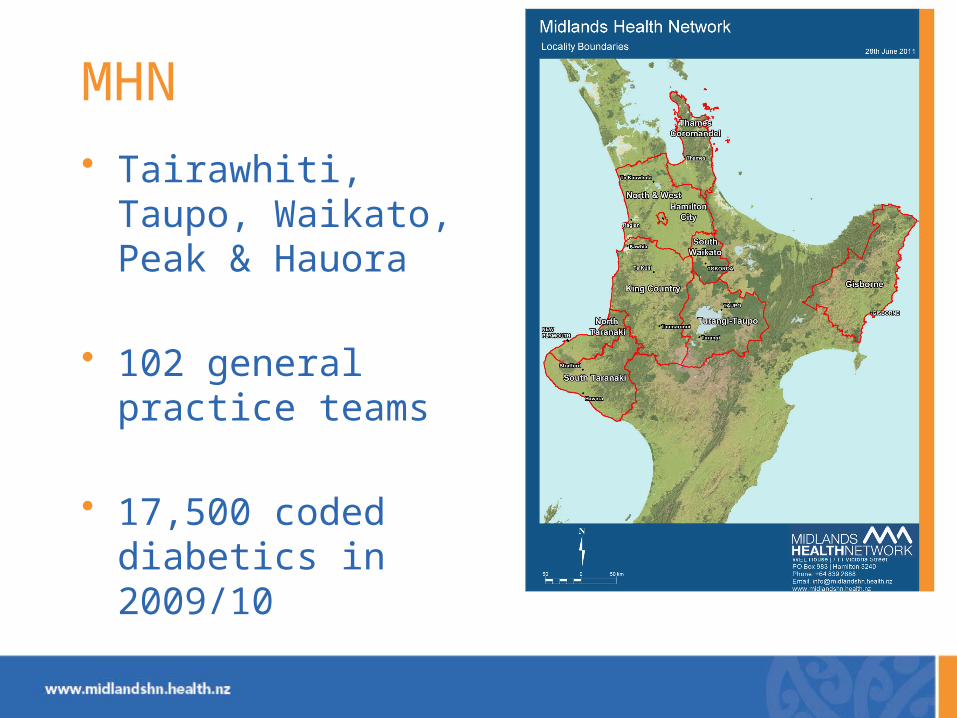
MHN
• Tairawhiti, Taupo, Waikato, Peak & Hauora
• 102 general practice teams
• 17,500 coded diabetics in 2009/10
Why more diabetes research?
• High profile
• New lens, old problem
• Research registrar
Methods
• Data held by MHN/MoH• DARs 06/07, had a further 2 in 3 years• Excluded Type 1 diabetes• Excluded if death or migrated
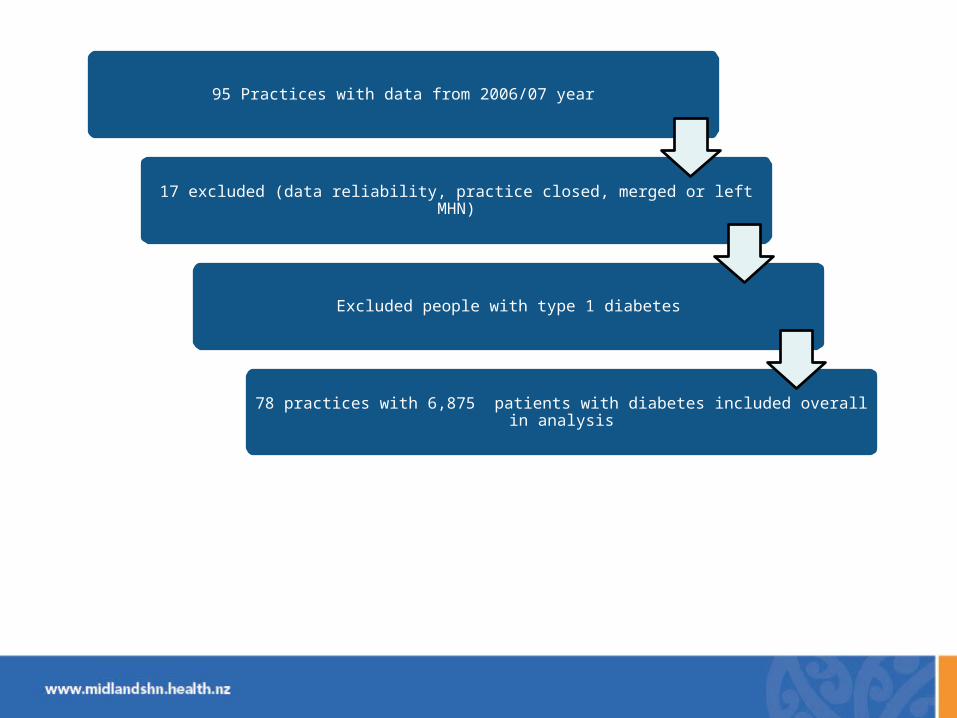
95 Practices with data from 2006/07 year
17 excluded (data reliability, practice closed, merged or left MHN)
Excluded people with type 1 diabetes
78 practices with 6,875 patients with diabetes included overall in analysis
The Questions
• Relationship between QP vs retention?
• Just the patient?
• Just the practice?
• What happens all together?
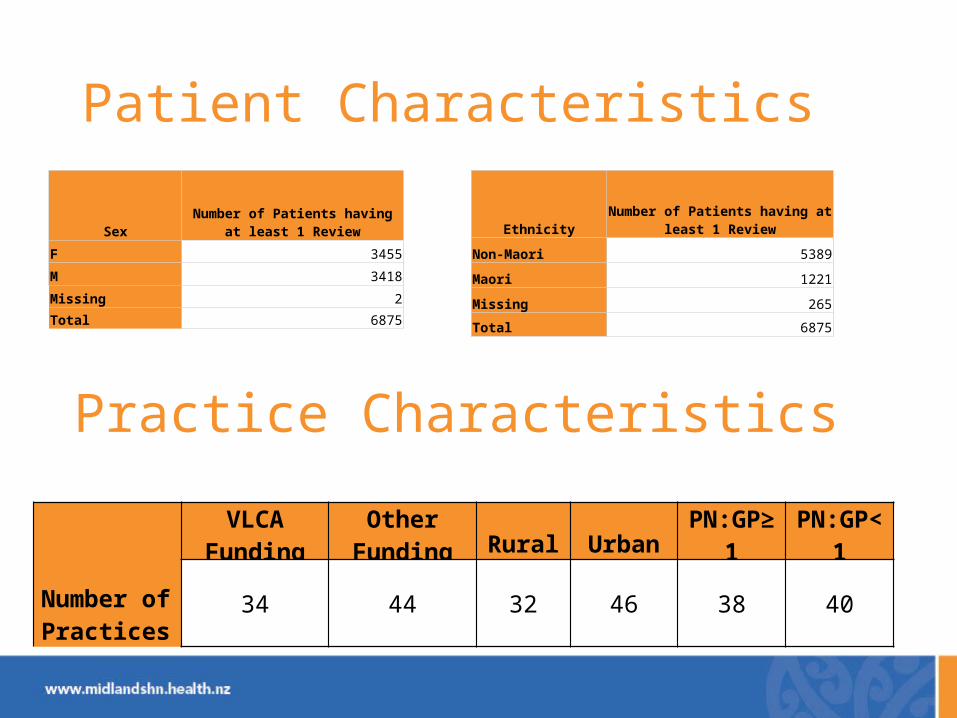
Patient Characteristics
SexNumber of Patients having at least
1 Review
F 3455
M 3418
Missing 2
Total 6875
EthnicityNumber of Patients having at least
1 Review
Non-Maori 5389
Maori 1221
Missing 265
Total 6875
6610
Number of Practices
VLCA Funding
Other Funding Rural Urban PN:GP≥1 PN:GP<1
34 44 32 46 38 40
Practice Characteristics

QP vs Cohort retention

Univariate
statistical analysis was performed using Mantel-Haenszel estimates of odds ratio
1 DARRetained (n=5861) Māori
Non-Māori Total
Odds Ratio 95% CI
Age 60 yrs and over 4,369 3,872 88% 91% 90% 2.60 2.24-3.02
Age 59 yrs and under 2,241 1,989 74% 80% 79%
Male 3,289 2,904 79% 88% 87% 1.05 0.91-1.22
Female 3,319 2,955 81% 87% 86%
PN:GP >1 3,406 2,999 82% 89% 88% 1.33 1.15-1.54
PN:GP <1 3,204 2,862 78% 87% 85%
Rural Practice 2,469 2,250 82% 89% 88% 1.27 1.09-1.48
Urban Practice 4,141 3,611 79% 87% 85%
VLCA Funding 2,746 2,460 80% 88% 86% 1.10 0.94-1.27
Other Funding 3,864 3,401 80% 88% 87%
Non-Māori 5,389 4,786 88% 1.70 1.43-2.02
Māori 1,221 1,075 80%
[RK1]Gary/ross throught on n here
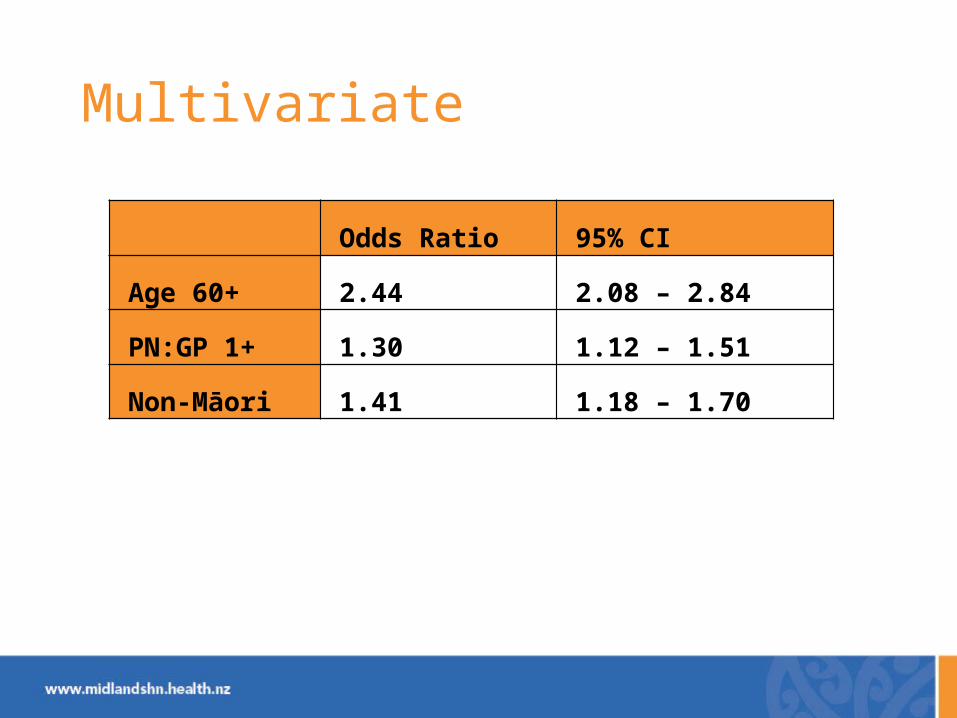
Multivariate
Odds Ratio 95% CI
Age 60+ 2.44 2.08 – 2.84
PN:GP 1+ 1.30 1.12 – 1.51
Non-Māori 1.41 1.18 – 1.70
Discussion
• Patient– Age – more time? Better understanding?– Māori/Non-Māori – relationship with service?
• Practice– PN:GP ratio – nurse led process?– Rural – know patient better?
Discussion
• Cross sectional aligns with this definition of retention
• Practice factors are important
• Patient factors are important

Thanks
• Prof Ross Lawrenson, Waikato Clinical School, University of Auckland
• Ben Amey (SAS programming)• Ass. Prof. Dharma Arunchalam,
Monash University (Statistical advice)• Janet Amey• You

Questions?