diabetes weight management in clinical practice: why … · diabetes weight management in clinical...
TRANSCRIPT

Diabetes Weight Management in Clinical Practice:Why WAIT Program
Osama Hamdy, MD, PhD, FACE
Medical Director, Obesity Clinical Program,Joslin Diabetes Center,Harvard Medical School

Weight control in diabetes practice is the most frustrating challenge
second to HbA1c!
Weight control in diabetes practice is the most frustrating challenge
second to HbA1c!

40.1
35.8
19.3
2.72.1
Underweight Normal Weight Overweight Obese Extremely Obese
Department of Health and Human Services,Center for Financing, Access, and Cost Trends, AHEQ
0.720.3
33
36.5
9.5
Percentage Distribution of Diabetic and Nondiabetic Adults in the U.S. PopulationPercentage Distribution of Diabetic and Nondiabetic Adults in the U.S. Population
NonNon--Diabetic Adults Diabetic Adults Diabetic Adults Diabetic Adults
Normal Weight Normal Weight

-1
0
1
2
3
4
5
6
7
8
MetforminMetformin
Diet aloneDiet alone
SulfonylureasSulfonylureas
InsulinInsulin
Wei
ght C
hang
e (K
g)W
eigh
t Cha
nge
(Kg)
Years After RandomizationYears After Randomization
UKPDS Lancet 1998;352:854-856
108642
Change in Body Weight With Diabetes Medications Change in Body Weight With Diabetes Medications

-7.1 -7.4-3.3
56.8
-20
0
20
40
60
*Weight BMI W/H Si
Perc
enta
ge (%
) Cha
nge
Body Weight % Body Weight Waist / Hip
Insulin Sensitivity
Hamdy O et al Diabetes Care 2003;26:2119-2125
* *
*
* p <0.001
Benefits of ShortBenefits of Short -- term Weight Reduction term Weight Reduction on IS in Type 2 DM and in Preon IS in Type 2 DM and in Pre-- diabetes diabetes

It is difficult to implement in routine clinical practice
It is costly for patients
Who will pay for it?
It is unsustainable
It is impossible to get similar results
It is difficult to implement in routine clinical practice
It is costly for patients
Who will pay for it?
It is unsustainable
It is impossible to get similar results
Common Criticisms to Clinical Research Around Weight Management in Diabetes

Joslin Comprehensive Program Joslin Comprehensive Program for Diabetes Weight Management for Diabetes Weight Management

Components of the Why WAIT?
• Interactive-Intensive Diabetes Treatment• Structured Modified Dietary Intervention• Graded-Balanced & Individualized Exercise Plan• Cognitive Behavioral Support• Group Adult-Educational Sessions

Modifications of Diabetes Medications
Potential Weight Gain Diabetes Medications
Most InsulinsNPH & Regular GlargineLisproAspart
Sulfonylureas GlyburideGlipizideGlimepiride
GlinidesNateglinideRepaglinide
TZDsPioglitazone (Actos)Rosiglitazone (Avandia)
Weight Neutral or Potential Weight LossDiabetes Medications
Metfomin Pramlintide (Symlin)Exenatide (Byetta)Glulisine insulin (Apidra) PPDetemir insulin (Levemir)DPP-IV inhibitors
Sitagliptin (Januvia)
Obesity Medications
Orlistat (Xenical)Sibutramine (Meredia)
Future Medications
Endocannabinoid RB DPP-IV inhibitors
VildagliptinGLP-1 Analogues
LiraglutideGLP-1R Agonists
Exenatide LAR
List A List B

Joslin New Nutrition GuidelinesJoslin New Nutrition Guidelines
Reduce Daily Caloric Intake by 250-500 cal~ 40% Carbohydrates, LGI, High Fiber20-30% Protein30% Fat (no TF, 7-10% SF, 20% Mono & Poly UF)Allowed Meal Replacement, Same Diet Composition
Reduce Daily Caloric Intake by 250-500 cal~ 40% Carbohydrates, LGI, High Fiber20-30% Protein30% Fat (no TF, 7-10% SF, 20% Mono & Poly UF)Allowed Meal Replacement, Same Diet Composition
www.joslin.orgwww.joslin.org

Structured Modified Dietary Intervention
2 Meal Replacements (BOOST® Diabetic or BOOST®
Glucose Control™ )
Two 100 cal snacks (e.g. Fruit, Nuts)
Choice from 15 pre-set dinner menus

60135701800501126015004090501200
FatProteinCarbs
Structured Modified Dietary Intervention
Meal Plan Dinner Composition

Graded
Balanced
Individualized
Obese, sedentary, limited ROM
Aerobic, resistance & stretching Ex
Based on clinical & exercise history
Graded-Balanced & Individualized Exercise Plan

Graded-Balanced & Individualized Exercise Plan
AEX+STCH+ CT + IT
50-60 min6 days /wk9-12
AEX+STCH+ CT
40-45 min5 days /wk5-8
AEX+STCH20-40 min4 days /wk1-4
Type of Exercise
Duration of Exercise
Frequency of Exercise*
Session Number

30-60 minute sessions facilitated by psychologist
Realistic and attainable goals (Smart Goals) for long-term sustainability
Relapse prevention using Logbook Learning and success stories
Mastering unique challenges (Delay and distraction, Planning ahead, Problem solving)
Managing automatic, negative thoughts (“detour thinking”)
Cognitive Behavioral Support

Group Adult-Educational Sessions“Let Us Start” All Team
“Balancing the Calorie Scale” RD“When Thoughts Get in Your Way” Psychologist “Take Action-Be Active” EP“Effect of Lifestyle on Diabetes & Vascular Health” MD“Making Sense of Portion Distortion” RD“Burn the Fat” EP“Lapse, Relapse, Collapse” Psychologist“Stay Active-Keep it Off” EP“Lifestyle and Food: What Science Says” MD“Keeping out of the Fast Food Lane” RD
“Eating for Life: How to Put it All Together” All Team

Why WAIT ResultsWhy WAIT Results

22/40M/F
138.2TG mg/dL100.8LDL-C mg/dL41.1HDL -C mg/dL
6.1CRP mg/L
165.8TC mg/dL
7.3HbA1c %7.2 (0-22)Duration of Diabetes yrs
56.1 (33-77)Age Average (range) yrs
Why WAIT? Program: Demographic & Baseline Data
Hamdy O et al, ADA 2007

239.5Weight Average (range) lbs38.4BMI Average (range) kg/m2
43.5% Body Fat
1877BMR Kcal/day
47.0Waist (inch)
Why WAIT? Program: Baseline Body Composition
Hamdy O et al, ADA 2007

-4.44
-7.01-9.27
-11.2
-13.7-15.44
-16.97
-19.48-20.34-22.15
-24.47-25
-21
-17
-13
-9
-5
-1
Wei
ght L
oss
in L
bs
Hamdy O et al, ADA 2007
Than
ksgi
ving
Than
ksgi
ving
Change in Body Weight During Why WAIT? Program (group 1)
Week 1-12
n = 14

-8.1-10.8
-12.9-15
-17-19.2
-20.8-23.3
-23.5-26.5 -25.45
-20.7
-28
-24
-20
-16
-12
-8
-4
0
Wei
ght L
oss
in L
bsChange in Body Weight During Why WAIT? Program (group 2)
Week 1-12
Hamdy O et al, ADA 2007n = 13

-5.12-7.64
-9.53-12.01
-14.19-16.44
-18.12
-21.61
-24.16-24.78-26.57
-19.61
-27
-23
-19
-15
-11
-7
-3
Wei
ght L
oss
in L
bs
n = 14
Change in Body Weight During Why WAIT? Program (group 3)
Week 1-12
Hamdy O et al, ADA 2007

-3.59
-6.09-7.54
-9.79 -10.5-12.38
-14.71 -14.62-15.29
-17.29-17.98
-13.69
-20
-16
-12
-8
-4
0
Wei
ght L
oss
in L
bs
n = 11
Change in Body Weight During Why WAIT? Program (group 4)
Week 1-12
Hamdy O et al, ADA 2007

-5.59
-8.26 -9.09-10.53
-12.78-14.82
-16.04
-22.6-21.18
-22.54-19.58
-18.06
-25
-21
-17
-13
-9
-5
-1
Wei
ght L
oss
in L
bs
n = 14
Change in Body Weight During Why WAIT? Program (group 5)
Week 1-12

-7.02-9.18
-11.13-12.78
-15.49-16.66
-18.64
-24.35-22.73
-26.05
-23.08
-20.05
-27
-23
-19
-15
-11
-7
-3
Wei
ght L
oss
in L
bs
n = 13
Change in Body Weight During Why WAIT? Program (group 6)
Week 1-12
Hamdy O et al, ADA 2007

-5.3
-8.1-9.7
-11.7-13.5
-15.6-17.4
-20 -20.8-22.7 -23.5
-18.1
-25
-21
-17
-13
-9
-5
-1
Wei
ght L
oss
in L
bsChange in Body Weight During Why WAIT? Program
Week 1-12
Hamdy O et al, ADA 2007n = 62

-5.3
-2.8
-1.8 -2 -2.2 -2.1
-1.5 -1.7 -1.5 -1.4 -1.5-1.2
-6
-5
-4
-3
-2
-1
0
Wei
ght L
oss
in L
bsChange in Body Weight During Why WAIT? Program
Week 1-12
Hamdy O et al, ADA 2007n = 62

-9.8-12
-10
-8
-6
-4
-2
0237.5
214.3
150
170
190
210
230
250
Bod
y w
eigh
t in
lbs
n = 62 * p <0.05 ** p <0.01 *** p <0.001
Changes in Body Weight after Why WAIT? Program
Body Weight % Weight Change
***
-23.5 lb
% C
hang
e
***Hamdy O et al, ADA 2007

38.3
35
25
30
35
40
n = 62 * p <0.05 ** p <0.01 *** p <0.001
Changes in BMI after Why WAIT? Program
***B
MI i
n K
g/m
2
Hamdy O et al, ADA 2007

7.3
6.4
5
6
7
8
Changes in HbA1cafter Why WAIT? Program
***
HbA
1c (%
)
n = 62 * p <0.05 ** p <0.01 *** p <0.001 Hamdy O et al, 2007
-0.89-1
-0.8
-0.6
-0.4
-0.2
0
Ave
rage
HbA
1c C
hang
e
***

47.2
43.4
35
40
45
50
Wais
t in
inches
Changes in Waist and Waist/Hip Ratioafter Why WAIT? Program
***
-3.7 inches
0.94
0.92
0.8
0.9
1
Waist Waist/Hip Ratio
**
n = 62 * p <0.05 ** p <0.01 *** p <0.001 Hamdy O et al, ADA 2007

101.6
85.8
75
80
85
90
95
100
105
110
Changes in %Body Fat, Fat Mass & Lean/Fat Ratio after Why WAIT? Program
43.23
39.95
3536373839404142434445
Bod
y Fa
t Mas
s in
lbs
Fat Mass (lbs) Body Fat (%) Lean/Fat Ratio
1.5
1.57
1.4
1.45
1.5
1.55
1.6
***
***
n = 62 * p <0.05 ** p <0.01 *** p <0.001
*
Hamdy O et al, ADA 2007
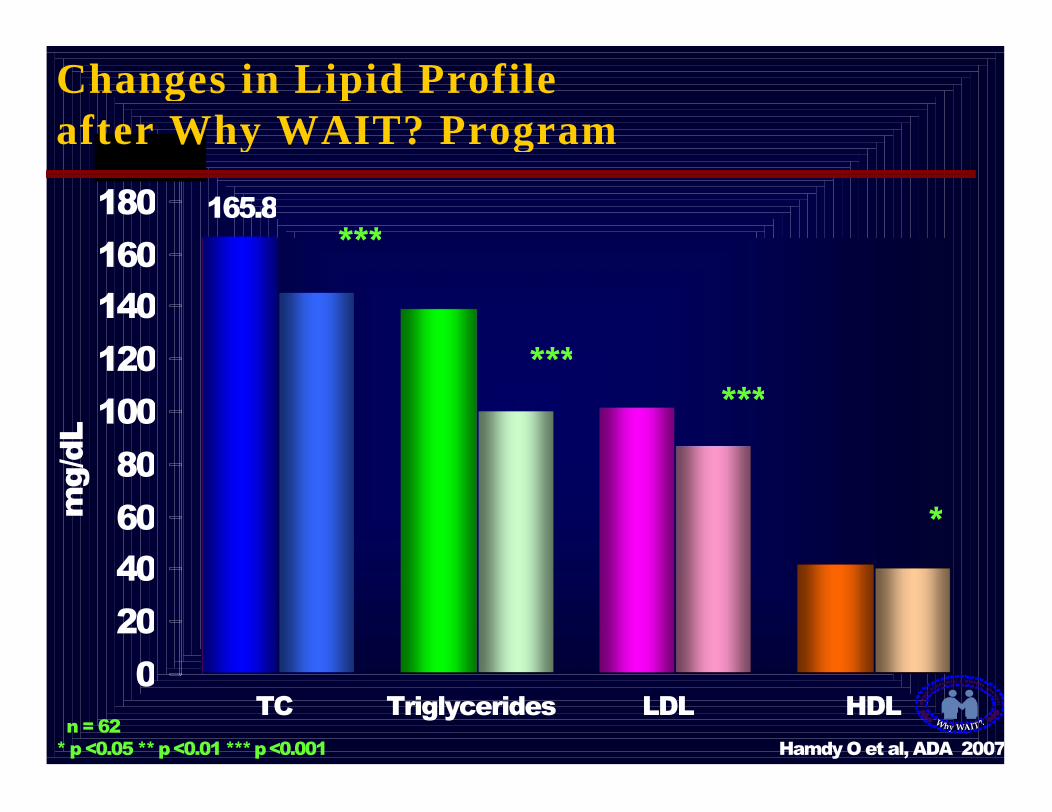
165.8
138.2
100.8
41.1
144.1
99.186
39.5
020406080
100120140160180200
***
mg/
dL
******
TC Triglycerides LDL HDL n = 62
* p <0.05 ** p <0.01 *** p <0.001
*
Changes in Lipid Profile after Why WAIT? Program
Hamdy O et al, ADA 2007

-12.2
-21.8
-11.4
-3
-30
-25
-20
-15
-10
-5
0
% C
hang
ePercentage Changes in Lipid Profile after Why WAIT? Program
TC Triglycerides LDL HDL n = 62 * p <0.05 ** p <0.01 *** p <0.001 Hamdy O et al, ADA 2007

125.4
105.3
0
20
40
60
80
100
120
140
mg/
dLChanges in Non-HDL and TC/HDL Ratio after Why WAIT? Program
Non HDL-Cholesterol TC/HDL
4.13.7
0
1
2
3
4
5
Rat
io
n = 62 * p <0.05 ** p <0.01 *** p <0.001
*** ***
Hamdy O et al, ADA 2007

0.92 0.9
0
0.2
0.4
0.6
0.8
1
1.2
mg/
dLChanges in Kidney Functions after Why WAIT? Program
S. Creatinine BUN
17 17.1
5
10
15
20
Mg/
dL
n = 62 * p <0.05 ** p <0.01 *** p <0.001 Hamdy O et al, ADA 2007

n = 62 * p <0.05
29.4
20.16
0
10
20
30U
rinar
y A
lbum
in/c
reat
inin
e R
atio
m
cg/m
g
Changes in Urinary Albumin/Creatinine Ratio after Why WAIT? Program
**
Hamdy O et al, ADA 2007

24.1
21.98
5
10
15
20
25
30
IU/L
Changes in Liver Enzymes after Why WAIT? Program
AST ALT
27.9
21.7
5
10
15
20
25
30
***
IU/L
**
n = 62 * p <0.05 ** p <0.01 *** p <0.001 Hamdy O et al, ADA 2007

Changes in CRPafter Why WAIT? Program
6
4.2
3
4
5
6
7
**
CR
P in
mg/
L
n = 62 * p <0.05 ** p <0.01 *** p <0.001 Hamdy O et al, ADA 2007

Changes in Adiponectinafter 6 Months of the Why WAIT? Program
6.7
11.6
0
2
4
6
8
10
12
14 **A
dipo
nect
in in
g/
ml
n = 15 * p <0.05 ** p <0.01 *** p <0.001 Hamdy O et al, ADA 2007

Changes in TNF-after 6 Months of the Why WAIT? Program
3.99
2.96
2
3
4
5
*
TNF-
in p
g/m
l
n = 15 * p <0.05 ** p <0.01 *** p <0.001 Hamdy O et al, ADA 2007

226.9
178.5
100
150
200
250
sIC
AM
in n
g/m
lChanges in sICAM and sVCAMafter 6 Months of the Why WAIT? Program
sICAM sVCAM
796.9
655.7
400
600
800
1000
**sV
CA
Min
ng/
ml
*
n = 15* p <0.05 ** p <0.01 *** p <0.001 Hamdy O et al, ADA 2007

Changes in E-Selectinafter 6 Months of the Why WAIT? Program
28.8
20.2
0
5
10
15
20
25
30
35
*
E-Se
lect
inin
ng/
ml
n = 15 * p <0.05 ** p <0.01 *** p <0.001 Hamdy O et al, ADA 2007

Is Weight loss sustainable?Is Weight loss sustainable?

Results of Why WAIT? Program Follow up of the 5 groups
Hamdy O et al, ADA 2007
-11.2
-16.97
-23.5 -23-25.1 -25.43 -25.23 -24.82 -24.5
-30
-25
-20
-15
-10
-5
00 1 2 3 4 5 6 7 8 9
Wei
ght c
hang
e in
lbs
from
bas
elin
e
Program End
Months of follow-up

450% (5%)11 (47.3 unit/d)2 (45 unit/d)Pramlintide-21% (-54%)11 (24.1 unit/day)14 (52.1 unit/d)Short acting Analog30% (-55%)13 (27.2 unit/day)10 (60.9 unit/d)Long acting Analog-50% (-12%)3 (41.7 unit/day)6 (47.5 unit/day)NPH
Insulin
213% (17)25 (17.6 mcg/d)8 (15 mcg/d)Exenatide
2% (12%)47 (1862 mg/d)46 (1664.1 mg/d)Metformin
-71% (-33%)2 (5 mg/d)7 (7.4 mg/d)Rosiglitazone-88% (-47%)1 (15 mg/d)8 (28.1 mg/d)Pioglitazone
Thiozelidindiones-63% (-41%)3 (6.6 mg/d)8 (11.25 mg/d)Glipizide-67% (-35%)2 (6.2 mg/d)6 (9.5 mg/d)Glyburide
Sulfonylureas
% Change# patients
(dose)
After# patients (dose/day)
Before# patients (dose/day)
Diabetes Medication
Change of Diabetes Medications

Cost Saving on Diabetes Medications
Per Month: $ 46.78
During the Program: $ 140.34
Estimated/year: $ 561.37
Hamdy O et al, ADA 2007

What is Unique About the WWP?
• The model of intervention is suitable for clinic use
• Components of the program are mostly covered by US insurance including Medicare
• Easily transferable to primary care setting• Potential for long-term positive results
• The model of intervention is suitable for clinic use
• Components of the program are mostly covered by US insurance including Medicare
• Easily transferable to primary care setting• Potential for long-term positive results

Thank YouThank You