diabetes in texas4 2015 reported higher than texas average prevalence rates. this suggests residents...
TRANSCRIPT

The Texas Demographic Center is responsible for interpreting and communicating information on demographic and socioeconomic issues for the State of Texas to the public and the legislature.
Included in this Brief:
In 2015, 11.2% of Texans had
diagnosed diabetes.
Diabetes disproportionately
impacts among older adults &
racial/ethnic minorities, and is
concentrated in East Texas.
Diabetes may become a larger
problem in the future because
population growth will be
driven by groups at high risk for
diabetes.
December 2018
Diabetes in Texas
Type II diabetes poses a major health burden for the United
States, but even more so for states like Texas. Many Texans have
already been diagnosed with Type II diabetes (hereafter referred to
as diabetes), and the rate of new cases increases every year.
Diabetes is associated with complications like retinopathy (vision
problems resulting from damage to the retina) and amputation and
increased risk for other problems like cardiovascular disease. It
remains one of the leading causes of death in Texas and the
United States. In addition, diabetes costs the nation billions of
dollars in medical fees and reduced productivity. These physical
and financial costs are felt throughout the nation but especially in
Texas, which has greater-than-national diabetes prevalence. Thus,
given its high costs and increasing spread across the state, it is
important to assess the trend and prevalence of diabetes in Texas.
Diabetes prevalence is greater in Texas than the
United States.
Approximately 9.4% of Americans (30.3 million) had
diabetes in 2015, in comparison to 11.2% of Texans (2.3 million)
(see Figure 1). In addition, the rate of new diagnoses (i.e.,
incidence rate) for diabetes has increased over the past several
years and is also greater in Texas than nationally. Approximately
7.5 per 1,000 (or 1.4 million) adults aged 18 to 76 years in the
United States were persons newly diagnosed with diabetes in
2015, in comparison to 11.1 per 1,000 (or 187,000) adults aged 18
to 76 years in Texas during the same year. Diabetes prevalence
has also been on the rise since the 1990s. Between 1997 and
2010, the population with diagnosed diabetes increased from 5.1%
to 9.1% among Americans, and from 6.4% to 9.9% among Texans.
Diabetes prevalence continued to grow between 2011 and 2015,
swelling from 8.9% to 9.6% in the US and from 10.2% to 11.2% in
Texas.
Diabetes disproportionately impacts older adults,
racial/ethnic minorities, men, and the population with
lower levels of education.
Diabetes prevalence is strongly patterned by age and is most common among those aged 65 to 74 years (25.9%; 516,411), followed by those 75 years and older (23.3%; 306,863), 45-64 years (17.8%; 1,178,670), and 18-44 years of age (3.1%; 321,276) (see Figure 2). The highest percentage of diabetes is concentrated among the population 65 to 74 years old, whereas the greatest number of population with diabetes is concentrated among those 45 to 64 years old. Similarly, diabetes is more common among some racial/ethnic minorities, men, and the population with lower levels of education relative to their counterparts. NH (non-Hispanic) Blacks (17%) and Hispanics (12.2%) have a higher prevalence of diabetes than the Texas average (11.5%), whereas the disease’s

2
prevalence is lower among NH Whites (10.2%), NH Others (7.9%), and NH Multiracial individuals (3.2%). Approximately 12.4% of Texas men have diabetes (1,230,020) compared to 10.1% of women (1,093,200). Finally, 16.2% (639,415) of adults with less than a high school education have diabetes, compared to 10.7% (565,002) of those with a high school education, and 9.7% (1,113,785) of those with a greater than high school education.
Diabetes disproportionately impacts
older adults, racial/ethnic minorities,
men, and the population with lower
levels of education.
Diabetes prevalence is strongly patterned by age and is most common among those aged 65 to 74 years (25.9%; 516,411), followed by those 75 years and older (23.3%; 306,863), 45-64 years (17.8%; 1,178,670), and 18-44 years of age (3.1%; 321,276) (see Figure 2). The highest percentage of diabetes is concentrated among the population 65 to 74 years old, whereas the greatest number of population with diabetes is concentrated among those 45 to 64 years old. Similarly, diabetes is more common among some racial/ethnic minorities, men,
and the population with lower levels of education relative to their counterparts. NH (non-Hispanic) Blacks (17%) and Hispanics (12.2%) have a higher prevalence of diabetes than the Texas average (11.5%), whereas the disease’s prevalence is lower among NH Whites (10.2%), NH Others (7.9%), and NH Multiracial individuals (3.2%). Approximately 12.4% of Texas men have diabetes (1,230,020) compared to 10.1% of women (1,093,200). Finally, 16.2% (639,415) of adults with less than a high school education have diabetes, compared to 10.7% (565,002) of those with a high school education, and 9.7% (1,113,785) of those with a greater than high school education.
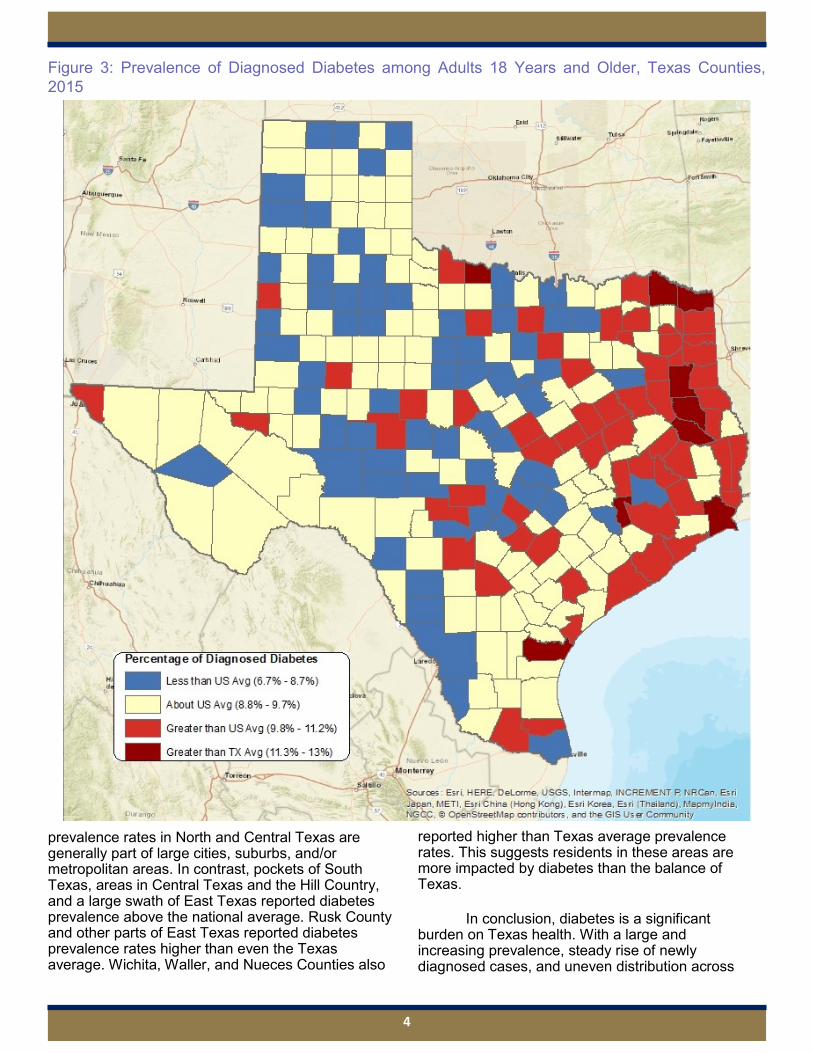
Diabetes prevalence is unevenly
distributed across the state, but
concentrated in East Texas.
Figure 3 highlights Texas counties that fall at, above, or below the 2015 US and Texas averages for diabetes prevalence (9.4% and 11.2%, respectively). The findings indicate that much of West Texas and the Panhandle, parts of North, and parts of Central Texas report at or below the US prevalence for diabetes (see Table 1). Counties with lower
Figure 1: Percentage of Diagnosed Diabetes Cases among Adults 18 Years and Older, Texas, 2015
Sources: U.S. Diabetes Surveillance System, Division of Diabetes Translation, CDC, Diagnosed Diabetes

3
Figure 2: Percentage of Diagnosed Diabetics by Age Group among Adults 18 Years and Older,
Texas, 2015
Sources: U.S. Diabetes Surveillance System, Division of Diabetes Translation, CDC, Diagnosed Diabetes
Rank County Prevalence
1 Rusk 13%
2 Nacogdoches 12.7%
3 Wichita 12.3%
4 Angelina 12.1%
5 Jefferson 11.8%
6 Red River 11.5%
7 Bowie 11.3%
8 Nueces 11.3%
9 Waller 11.3%
10… Cherokee 11.2%
- Texas 11.2%
- US 9.4%
Table 1: Texas Counties with the Highest and Lowest Prevalence of Age-Adjusted Diagnosed
Diabetes Prevalence, 2015
Sources: U.S. Diabetes Surveillance System, Division of Diabetes Translation, CDC, Diagnosed Diabetes
Rank County Prevalence
…245 Comal 6.7%
246 Kendall 7.3%
247 Parker 7.7%
248 Williamson 7.8%
249 Travis 7.9%
250 Bandera 8.1%
251 Lampasas 8.1%
252 Montgomery 8.1%
253 Midland 8.2%
254 Randall 8.2%
- Texas 11.2%
- US 9.4%
4
reported higher than Texas average prevalence rates. This suggests residents in these areas are more impacted by diabetes than the balance of Texas.
In conclusion, diabetes is a significant burden on Texas health. With a large and increasing prevalence, steady rise of newly diagnosed cases, and uneven distribution across
prevalence rates in North and Central Texas are generally part of large cities, suburbs, and/or metropolitan areas. In contrast, pockets of South Texas, areas in Central Texas and the Hill Country, and a large swath of East Texas reported diabetes prevalence above the national average. Rusk County and other parts of East Texas reported diabetes prevalence rates higher than even the Texas average. Wichita, Waller, and Nueces Counties also
Figure 3: Prevalence of Diagnosed Diabetes among Adults 18 Years and Older, Texas Counties,
2015

Austin Office P.O. Box 13455
Austin, TX 78711 Ph: 512-463-8390
Fax: 512-463-7632
San Antonio Office The University of Texas at San Antonio 501 West Cesar E. Chavez Blvd. San Antonio, TX 78207-4415 Ph: 210-458-6543 Fax: 210-458-6541
@TexasDemography http://demographics.texas.gov [email protected]
Texas groups and geographies, diabetes is an important issue for Texans. Furthermore, diabetes could become an even larger problem in the future. Much of the state’s projected growth will occur among groups that are high-risk for diabetes, including older adults and racial/ethnic minorities such as Hispanics. According to the latest Texas Demographic Center projections, the percentage of adults 65 years and older is projected to double from 10% to 20% between 2010 and 2050. Similarly, racial/ethnic minorities will make up 72% of the population by 2050, compared to just 55% in 2010. Most of this growth will be driven by Hispanics, whose share of the population is projected to increase from 38% to 53% by 2050. Thus, the prevalence of diabetes may surge as the population increasingly becomes comprised of greater numbers and shares of at-risk groups. Taken together, these demographic and geographic characteristics all emphasize the importance of preventing diabetes to improve Texas health.
Endnotes
Diagnosed diabetes numbers do not reflect the
substantial number of undiagnosed diabetic
population. However, since the CDC does not
provide state-level estimates of undiagnosed
diabetes, this report focuses on diagnosed diabetes
numbers alone.
The rate of newly diagnosed cases of diabetes for
the US reflects the median of states rather than the
national average. The rate for the median of states,
rather than the national average, was used because
it was directly comparable to state rates (e.g.,
Texas).
Note: Major methodological changes occurred in
the 2011 Behavioral Risk Factor Surveillance
System (BRFSS).
About This Report
The Texas Demographic Center produced this
report. The report’s authors include: Sara Robinson,
Lila Valencia, Helen You, Lloyd B. Potter, Steve
White, and Jeffrey A. Jordan.
References
American Diabetes Association. 2018. Complications. http://www.diabetes.org/livingwith-diabetes/complications/ American Diabetes Association. 2018. Statistics about Diabetes. http://www.diabetes.org/diabetes-basics/statistics/?loc=db-slabnav American Diabetes Association. 2018. Cost of Diabetes. http://www.diabetes.org/advocacy/news-events/cost-of-diabetes.html Centers for Disease Control and Prevention (CDC). 2017. Who’s at Risk? https://www.cdc.gov/diabetes/basics/risk-factors.html Centers for Disease Control and Prevention (CDC). 2018. 2017 National Diabetes Statistics Report. https://www.cdc.gov/diabetes/data/statistics/statistics-report.html Centers for Disease Control and Prevention (CDC). 2018. Behavioral Risk Factor Surveillance System (BRFSS), 2015 Texas Cross Tabulation for Diagnosed Diabetes by Five Level Race/Ethnicity Category. https://nccd.cdc.gov/weat/index.html#/crossTabulation/view Centers for Disease Control and Prevention (CDC). 2018. U.S. Diabetes Surveillance System, Diagnosed Diabetes. https://gis.cdc.gov/grasp/diabetes/DiabetesAtlas.html Texas Demographic Center. 2014. Texas Population Projections. http://demographics.texas.gov/Data/TPEPP/Projections/