d.hiebeler, matlab r reference 1 matlab r referencehiebeler/comp/matlabr.pdf ·...
TRANSCRIPT
D. Hiebeler, Matlab / R Reference 1
MATLAB R© / R ReferenceJune 24, 2014
David HiebelerDept. of Mathematics and Statistics
University of MaineOrono, ME 04469-5752
http://www.math.umaine.edu/~hiebeler
I wrote the first version of this reference during Spring 2007, as I learned R while teaching my Modeling& Simulation course at the University of Maine. The course covers population and epidemiologicalmodeling, including deterministic and stochastic models in discrete and continuous time, along withspatial models. Earlier versions of the course had used Matlab. In Spring 2007, some biology graduatestudents in the class asked if they could use R; I said “yes.” My colleague Bill Halteman was a great helpas I frantically learned R to stay ahead of the class. As I went along, I started building this reference formy own use. In the end, I was pleasantly surprised that most things I do in Matlab have fairly directequivalents in R. I was also inspired to write this after seeing the “R for Octave Users” reference writtenby Robin Hankin, and have continued to add to the document.
This reference is organized into general categories. There is also a Matlab index and an R index atthe end, which should make it easy to look up a command you know in one of the languages and learnhow to do it in the other (or if you’re trying to read code in whichever language is unfamiliar to you,allow you to translate back to the one you are more familiar with). The index entries refer to the itemnumbers in the first column of the reference document, rather than page numbers.
Any corrections, suggested improvements, or even just notification that the reference has been usefulare appreciated. I hope all the time I spent on this will prove useful for others in addition to myself andmy students. Note that sometimes I don’t necessarily do things in what you may consider the “best” wayin a particular language. I often tried to do things in a similar way in both languages, and where possibleI’ve avoided the use of Matlab toolboxes or R packages which are not part of the core distributions.But if you believe you have a “better” way (either simpler, or more computationally efficient) to dosomething, feel free to let me know.
For those transitioning fromMatlab to R, you should check out the pracma package for R (“PracticalNumerical Math Routines”) — it has more than 200 functions which emulate Matlab functions, whichyou may find very handy.
Acknowledgements: Thanks to Juan David Ospina Arango, Berry Boessenkool, Robert Bryce,Thomas Clerc, Alan Cobo-Lewis, Richard Cotton, Stephen Eglen, Andreas Handel, Niels Richard Hansen,Luke Hartigan, Roger Jeurissen, David Khabie-Zeitoune, Seungyeon Kim, Michael Kiparsky, Isaac Michaud,Andy Moody, Ben Morin, Lee Pang, Manas A. Pathak, Rachel Rier, Rune Schjellerup Philosof, RachelRier, William Simpson, David Winsemius, Corey Yanofsky, and Jian Ye for corrections and contributions.
Permission is granted to make and distribute verbatim copies of this manual provided this permissionnotice is preserved on all copies.
Permission is granted to copy and distribute modified versions of this manual under the conditionsfor verbatim copying, provided that the entire resulting derived work is distributed under the terms of apermission notice identical to this one.
Permission is granted to copy and distribute translations of this manual into another language, un-der the above conditions for modified versions, except that this permission notice may be stated in atranslation approved by the Free Software Foundation.
Copyright c©2014 David Hiebeler
D. Hiebeler, Matlab / R Reference 2
Contents
1 Help 3
2 Entering/building/indexing matrices 32.1 Cell arrays and lists . . . . . . . . . . . . . . . . . . . . . . . . . . . . . . . . . . . . . . . 62.2 Structs and data frames . . . . . . . . . . . . . . . . . . . . . . . . . . . . . . . . . . . . . 7
3 Computations 83.1 Basic computations . . . . . . . . . . . . . . . . . . . . . . . . . . . . . . . . . . . . . . . . 83.2 Complex numbers . . . . . . . . . . . . . . . . . . . . . . . . . . . . . . . . . . . . . . . . 93.3 Matrix/vector computations . . . . . . . . . . . . . . . . . . . . . . . . . . . . . . . . . . . 93.4 Root-finding . . . . . . . . . . . . . . . . . . . . . . . . . . . . . . . . . . . . . . . . . . . . 163.5 Function optimization/minimization . . . . . . . . . . . . . . . . . . . . . . . . . . . . . . 163.6 Numerical integration / quadrature . . . . . . . . . . . . . . . . . . . . . . . . . . . . . . . 173.7 Curve fitting . . . . . . . . . . . . . . . . . . . . . . . . . . . . . . . . . . . . . . . . . . . 18
4 Conditionals, control structure, loops 19
5 Functions, ODEs 23
6 Probability and random values 25
7 Graphics 297.1 Various types of plotting . . . . . . . . . . . . . . . . . . . . . . . . . . . . . . . . . . . . . 297.2 Printing/saving graphics . . . . . . . . . . . . . . . . . . . . . . . . . . . . . . . . . . . . . 377.3 Animating cellular automata / lattice simulations . . . . . . . . . . . . . . . . . . . . . . . 38
8 Working with files 39
9 Miscellaneous 409.1 Variables . . . . . . . . . . . . . . . . . . . . . . . . . . . . . . . . . . . . . . . . . . . . . 409.2 Strings and Misc. . . . . . . . . . . . . . . . . . . . . . . . . . . . . . . . . . . . . . . . . . 41
10 Spatial Modeling 45
Index of MATLAB commands and concepts 46
Index of R commands and concepts 51

D. Hiebeler, Matlab / R Reference 3
1 Help
No. Description Matlab R
1 Show help for a function (e.g.sqrt)
help sqrt, or helpwin sqrt to seeit in a separate window
help(sqrt) or ?sqrt
2 Show help for a built-in key-word (e.g. for)
help for help(’for’) or ?’for’
3 General list of many help top-ics
help library() to see available libraries,or library(help=’base’) for verylong list of stuff in base package whichyou can see help for
4 Explore main documentationin browser
doc or helpbrowser (previously itwas helpdesk, which is now beingphased out)
help.start()
5 Search documentation forkeyword or partial keyword(e.g. functions which refer to“binomial”)
lookfor binomial help.search(’binomial’)
2 Entering/building/indexing matrices
No. Description Matlab R
6 Enter a row vector ~v =[
1 2 3 4]
v=[1 2 3 4] v=c(1,2,3,4) or alternativelyv=scan() then enter “1 2 3 4” andpress Enter twice (the blank lineterminates input)
7 Enter a column vector
1234
[1; 2; 3; 4] c(1,2,3,4)
(R does not distinguish between rowand column vectors.)
8 Enter a matrix
[
1 2 34 5 6
]
[1 2 3 ; 4 5 6] To enter values by row:matrix(c(1,2,3,4,5,6), nrow=2,
byrow=TRUE) To enter values bycolumn: matrix(c(1,4,2,5,3,6),
nrow=2)
9 Access an element of vector v v(3) v[3]
10 Access an element of matrixA
A(2,3) A[2,3]
11 Access an element of matrixA using a single index: in-dices count down the first col-umn, then down the secondcolumn, etc.
A(5) A[5]
12 Build the vector [2 3 4 5 6 7] 2:7 2:7
13 Build the vector [7 6 5 4 3 2] 7:-1:2 7:2
14 Build the vector [2 5 8 11 14] 2:3:14 seq(2,14,3)
D. Hiebeler, Matlab / R Reference 4
No. Description Matlab R
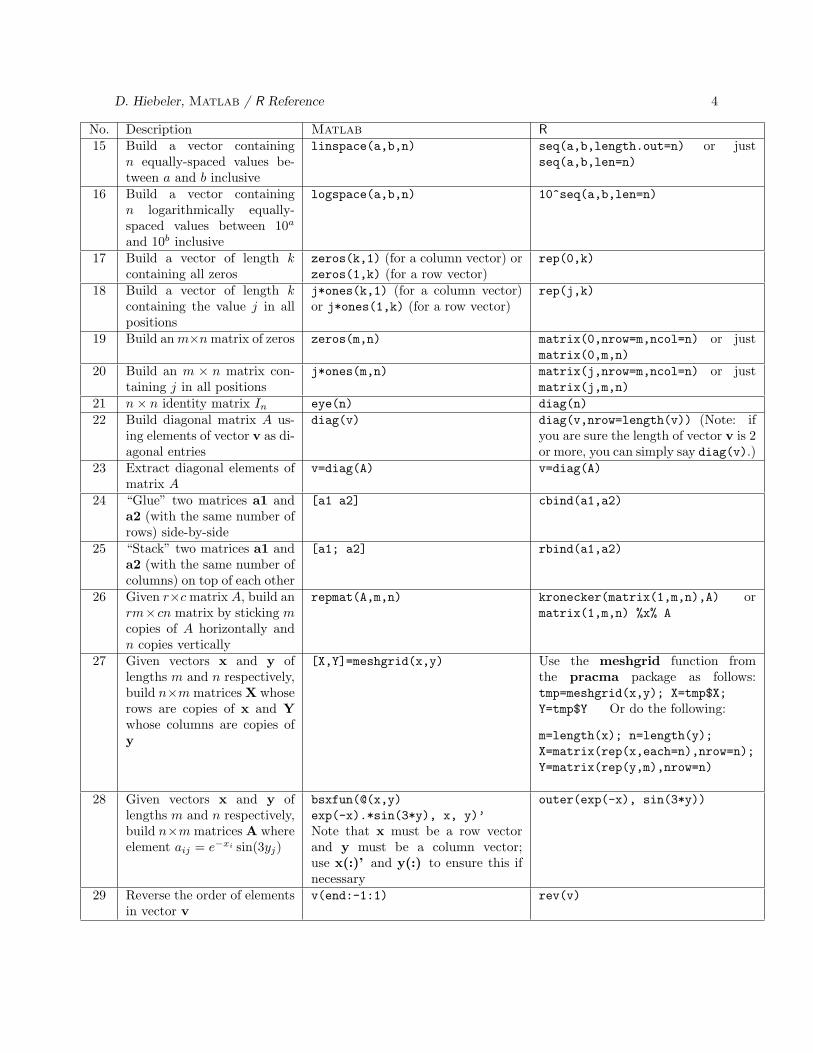
15 Build a vector containingn equally-spaced values be-tween a and b inclusive
linspace(a,b,n) seq(a,b,length.out=n) or justseq(a,b,len=n)
16 Build a vector containingn logarithmically equally-spaced values between 10a
and 10b inclusive
logspace(a,b,n) 10^seq(a,b,len=n)
17 Build a vector of length kcontaining all zeros
zeros(k,1) (for a column vector) orzeros(1,k) (for a row vector)
rep(0,k)
18 Build a vector of length kcontaining the value j in allpositions
j*ones(k,1) (for a column vector)or j*ones(1,k) (for a row vector)
rep(j,k)
19 Build anm×nmatrix of zeros zeros(m,n) matrix(0,nrow=m,ncol=n) or justmatrix(0,m,n)
20 Build an m × n matrix con-taining j in all positions
j*ones(m,n) matrix(j,nrow=m,ncol=n) or justmatrix(j,m,n)
21 n× n identity matrix In eye(n) diag(n)
22 Build diagonal matrix A us-ing elements of vector v as di-agonal entries
diag(v) diag(v,nrow=length(v)) (Note: ifyou are sure the length of vector v is 2or more, you can simply say diag(v).)
23 Extract diagonal elements ofmatrix A
v=diag(A) v=diag(A)
24 “Glue” two matrices a1 anda2 (with the same number ofrows) side-by-side
[a1 a2] cbind(a1,a2)
25 “Stack” two matrices a1 anda2 (with the same number ofcolumns) on top of each other
[a1; a2] rbind(a1,a2)
26 Given r×cmatrix A, build anrm×cn matrix by sticking mcopies of A horizontally andn copies vertically
repmat(A,m,n) kronecker(matrix(1,m,n),A) ormatrix(1,m,n) %x% A
27 Given vectors x and y oflengths m and n respectively,build n×mmatrices X whoserows are copies of x and Ywhose columns are copies ofy
[X,Y]=meshgrid(x,y) Use the meshgrid function fromthe pracma package as follows:tmp=meshgrid(x,y); X=tmp$X;
Y=tmp$Y Or do the following:
m=length(x); n=length(y);
X=matrix(rep(x,each=n),nrow=n);
Y=matrix(rep(y,m),nrow=n)
28 Given vectors x and y oflengths m and n respectively,build n×m matrices A whereelement aij = e−xi sin(3yj)
bsxfun(@(x,y)
exp(-x).*sin(3*y), x, y)’
Note that x must be a row vectorand y must be a column vector;use x(:)’ and y(:) to ensure this ifnecessary
outer(exp(-x), sin(3*y))
29 Reverse the order of elementsin vector v
v(end:-1:1) rev(v)

D. Hiebeler, Matlab / R Reference 5
No. Description Matlab R
30 Column 2 of matrix A A(:,2) A[,2] Note: that gives the result as avector. To make the result am×1 ma-trix instead, do A[,2,drop=FALSE]
31 Row 7 of matrix A A(7,:) A[7,] Note: that gives the result as avector. To make the result a 1×n ma-trix instead, do A[7,,drop=FALSE]
32 All elements of A as a vector,column-by-column
A(:) (gives a column vector) c(A)
33 Rows 2–4, columns 6–10 of A(this is a 3× 5 matrix)
A(2:4,6:10) A[2:4,6:10]
34 A 3 × 2 matrix consisting ofrows 7, 7, and 6 and columns2 and 1 of A (in that order)
A([7 7 6], [2 1]) A[c(7,7,6),c(2,1)]
35 Circularly shift the rows ofmatrix A down by s1 ele-ments, and right by s2 ele-ments
circshift(A, [s1 s2]) circshift(A, c(s1,s2)) wherecircshift is in the pracma pack-age. Or modulo arithmetic onindices will work: m=dim(A)[1];
n=dim(A)[2]; A[(1:m-s1-1)%%m+1,
(1:n-s2-1)%%n+1]
36 Flip the order of elements ineach row of matrix A
fliplr(A) fliplr(A) using fliplr fromthe pracma package, ort(apply(A,1,rev)) orA[,ncol(A):1]
37 Flip the order of elements ineach column of matrix A
flipud(A) flipud(A) using flipud from thepracma package, or apply(A,2,rev)or A[nrow(A):1,]
38 Given a single index ind intoan m× n matrix A, computethe row r and column c ofthat position (also works ifind is a vector)
[r,c] = ind2sub(size(A), ind)
arrayInd(ind, c(m,n)) or
r = ((ind-1) %% m) + 1
c = floor((ind-1) / m) + 1
or r=row(A)[ind]; c=col(A)[ind]
39 Given the row r and columnc of an element of an m × nmatrix A, compute the singleindex ind which can be usedto access that element of A(also works if r and c are vec-tors)
ind = sub2ind(size(A), r, c) ind = (c-1)*m + r
40 Given equal-sized vectors rand c (each of length k), setelements in rows (given by r)and columns (given by c) ofmatrix A equal to 12. Thatis, k elements of A will bemodified.
inds = sub2ind(size(A),r,c);
A(inds) = 12;
inds = cbind(r,c)
A[inds] = 12
41 Truncate vector v, keepingonly the first 10 elements
v = v(1:10) v = v[1:10], or length(v) = 10
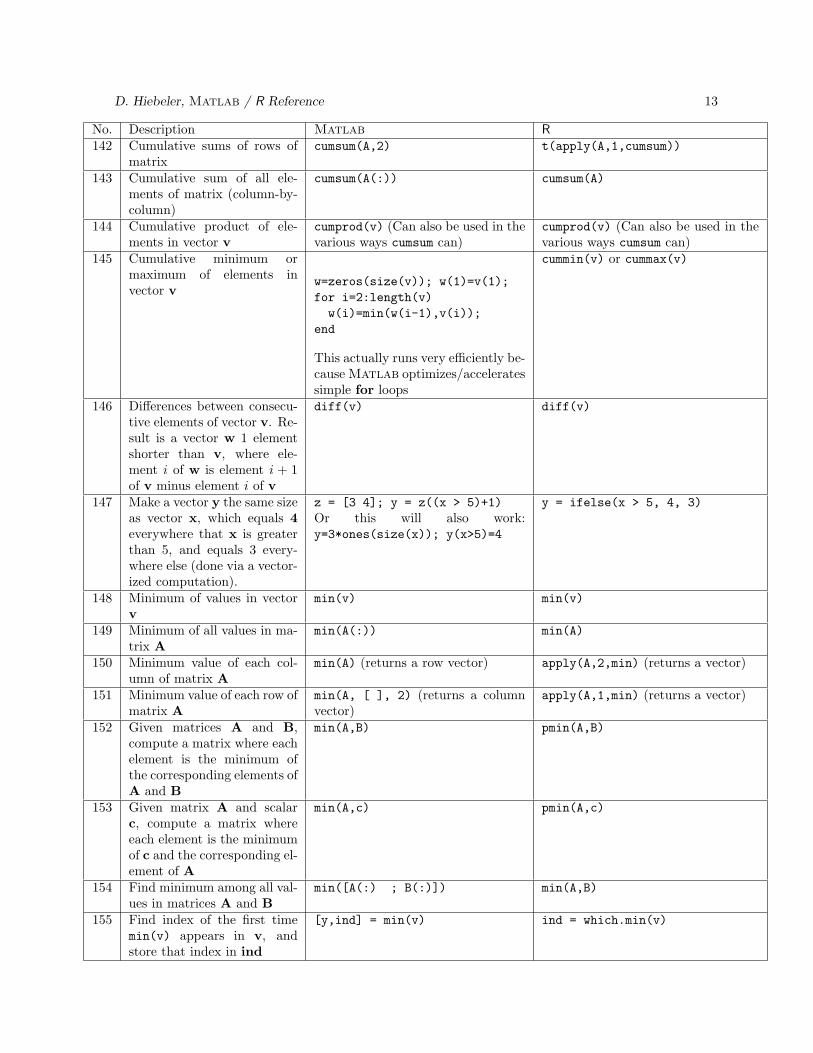
also works

D. Hiebeler, Matlab / R Reference 6
No. Description Matlab R
42 Extract elements of vector vfrom position a to the end
v(a:end) v[a:length(v)]
43 All but the kth element ofvector v
v([1:(k-1) (k+1):end]) orv([k]) = [ ] (but this will modifythe original vector v)
v[-k]
44 All but the jth and kth ele-ments of vector v
v(~ismember(1:length(v),[j k]))
or v([j k]) = [ ] (but this willmodify the original vector v)
v[c(-j,-k)]
45 Reshape matrix A, making itan m × n matrix with ele-ments taken columnwise fromthe original A (which musthave mn elements)
A = reshape(A,m,n) dim(A) = c(m,n)
46 Extract the lower-triangularportion of matrix A
L = tril(A) L = A; L[upper.tri(L)]=0
47 Extract the upper-triangularportion of matrix A
U = triu(A) U = A; U[lower.tri(U)]=0
48 Enter n×n Hilbert matrix Hwhere Hij = 1/(i+ j − 1)
hilb(n) Hilbert(n), but this is part of theMatrix package which you’ll need toinstall (see item 348 for how to in-stall/load packages).
49 Enter an n-dimensional array,e.g. a 3×4×2 array with thevalues 1 through 24
reshape(1:24, 3, 4, 2) orreshape(1:24, [3 4 2])
array(1:24, c(3,4,2)) (Note thata matrix is 2-D, i.e. rows andcolumns, while an array is more gen-erally N -D)
2.1 Cell arrays and lists
No. Description Matlab R
50 Build a vector v of length n,capable of containing differ-ent data types in different el-ements (called a cell array inMatlab, and a list in R)
v = cell(1,n) In general,cell(m,n) makes an m × n cellarray. Then you can do e.g.:
v{1} = 12
v{2} = ’hi there’
v{3} = rand(3)
v = vector(’list’,n) Then youcan do e.g.:
v[[1]] = 12
v[[2]] = ’hi there’
v[[3]] = matrix(runif(9),3)
51 Extract the ith element of acell/list vector v
w = v{i}
If you use regular indexing, i.e. w
= v(i), then w will be a 1 × 1 cellmatrix containing the contents of theith element of v.
w = v[[i]]
If you use regular indexing, i.e. w =
v[i], then w will be a list of length 1containing the contents of the ith ele-ment of v.
52 Set the name of the ith ele-ment in a list.
(Matlab does not have names asso-ciated with elements of cell arrays.)
names(v)[3] = ’myrandmatrix’
Use names(v) to see all names, andnames(v)=NULL to clear all names.

D. Hiebeler, Matlab / R Reference 7
2.2 Structs and data frames
No. Description Matlab R
53 Create a matrix-like objectwith different named columns(a struct in Matlab, or adata frame in R)
avals=2*ones(1,6);
yvals=6:-1:1; v=[1 5 3 2 3 7];
d=struct(’a’,avals,
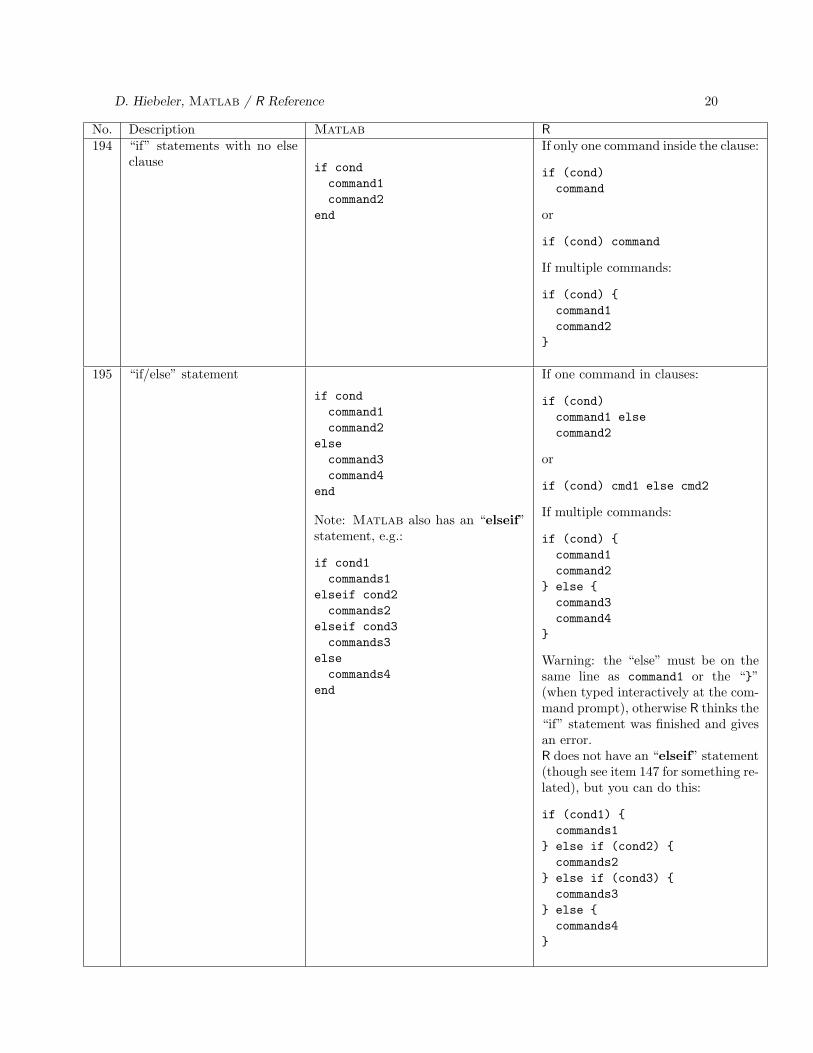
’yy’, yyvals, ’fac’, v);
v=c(1,5,3,2,3,7); d=data.frame(
cbind(a=2, yy=6:1), v)
Note that I (surprisingly) don’t use R for statistics, and therefore have very little experience with dataframes (and also very little with Matlab structs). I will try to add more to this section later on.

D. Hiebeler, Matlab / R Reference 8
3 Computations
3.1 Basic computations
No. Description Matlab R
54 a+ b, a− b, ab, a/b a+b, a-b, a*b, a/b a+b, a-b, a*b, a/b55
√a sqrt(a) sqrt(a)
56 ab a^b a^b
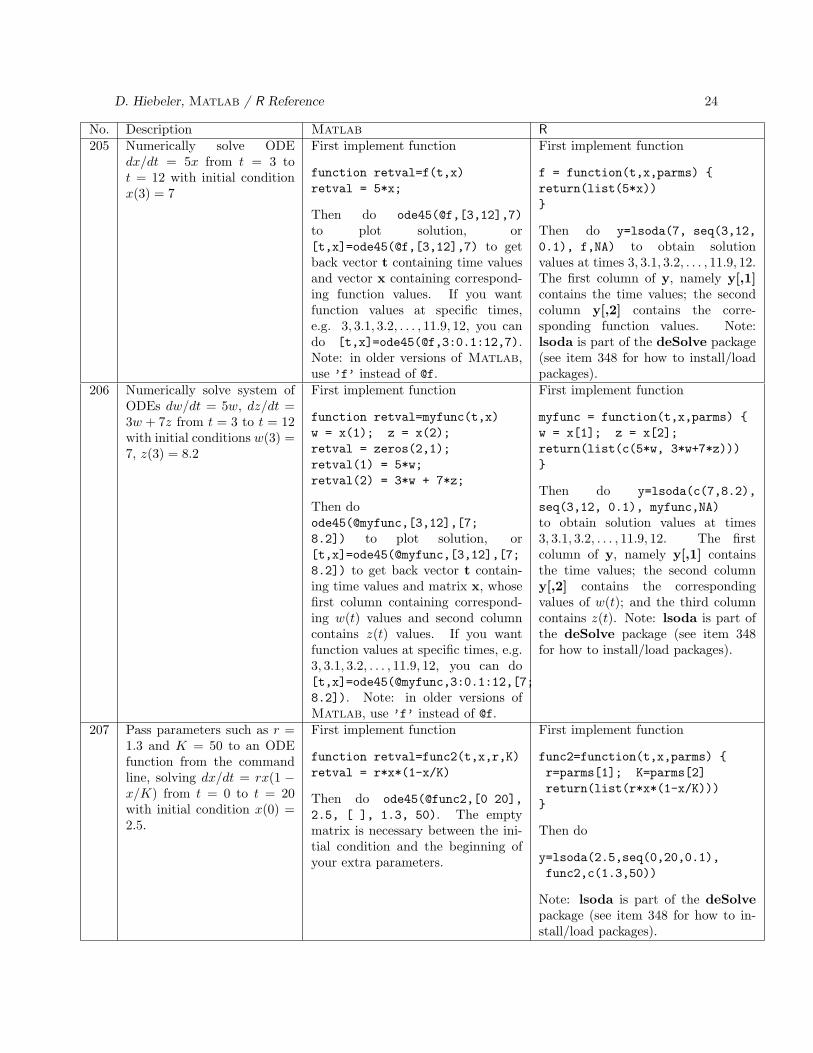
57 |a| (note: for complex ar-guments, this computes themodulus)
abs(a) abs(a)
58 ea exp(a) exp(a)
59 ln(a) log(a) log(a)
60 log2(a), log10(a) log2(a), log10(a) log2(a), log10(a)61 sin(a), cos(a), tan(a) sin(a), cos(a), tan(a) sin(a), cos(a), tan(a)
62 sin−1(a), cos−1(a), tan−1(a) asin(a), acos(a), atan(a) asin(a), acos(a), atan(a)63 sinh(a), cosh(a), tanh(a) sinh(a), cosh(a), tanh(a) sinh(a), cosh(a), tanh(a)
64 sinh−1(a), cosh−1(a),tanh−1(a)
asinh(a), acosh(a), atanh(a) asinh(a), acosh(a), atanh(a)
65 n MOD k (modulo arith-metic)
mod(n,k) n %% k
66 Round to nearest integer round(x) round(x) (Note: R uses IEC 60559standard, rounding 5 to the even digit— so e.g. round(0.5) gives 0, not 1.)
67 Round down to next lowestinteger
floor(x) floor(x)
68 Round up to next largest in-teger
ceil(x) ceiling(x)
69 Round toward zero fix(x) trunc(x)
70 Sign of x (+1, 0, or -1) sign(x) (Note: for complex values,this computes x/abs(x).)
sign(x) (Does not work with com-plex values)
71 Error function erf(x) =
(2/√π)
∫ x
0e−t2dt
erf(x) 2*pnorm(x*sqrt(2))-1
72 Complementary er-ror function cerf(x) =
(2/√π)
∫
∞
xe−t2dt = 1-erf(x)
erfc(x) 2*pnorm(x*sqrt(2),lower=FALSE)
73 Inverse error function erfinv(x) qnorm((1+x)/2)/sqrt(2)
74 Inverse complementary errorfunction
erfcinv(x) qnorm(x/2,lower=FALSE)/sqrt(2)
75 Binomial coefficient(
nk
)
= n!/(n!(n− k)!)
nchoosek(n,k) choose(n,k)
76 Bitwise logical operations(NOT, AND, OR, XOR,bit-shifting)
bitcmp, bitand, bitor, bitxor,bitshift
bitwNot, bitwAnd, bitwOr, bitwXor,bitwShiftL, bitwShiftR
Note: the various functions above (logarithm, exponential, trig, abs, and rounding functions) all workwith vectors and matrices, applying the function to each element, as well as with scalars.
D. Hiebeler, Matlab / R Reference 9
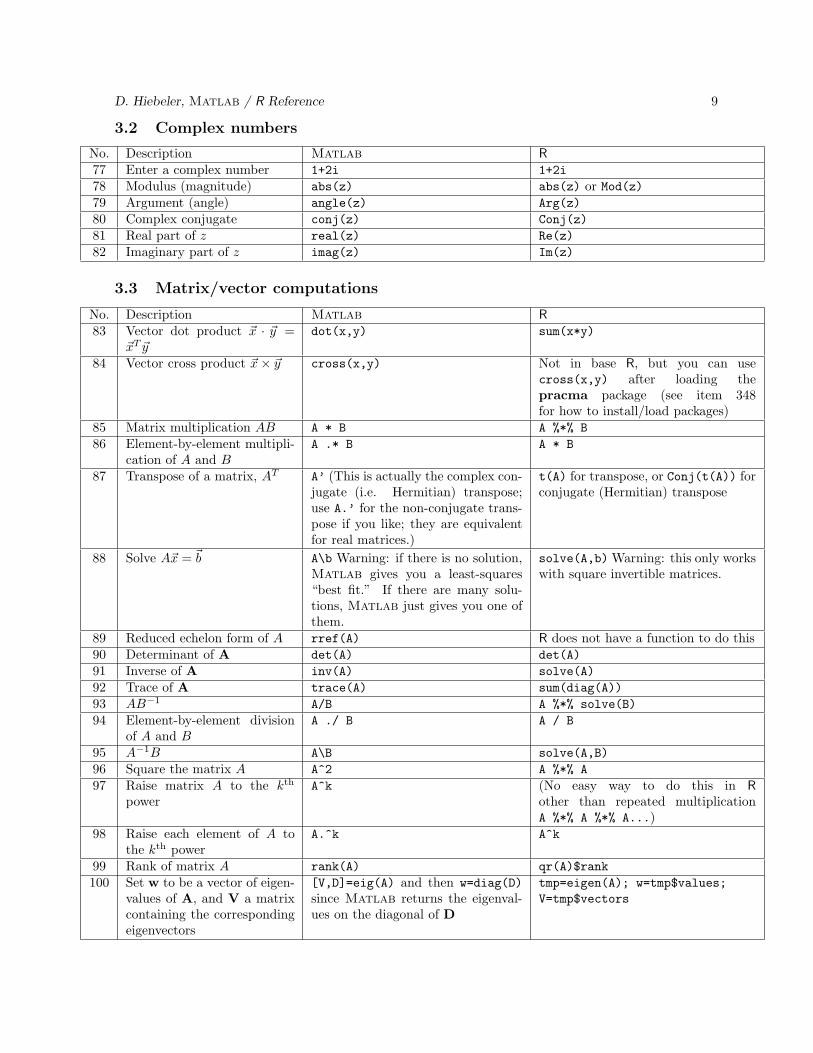
3.2 Complex numbers
No. Description Matlab R
77 Enter a complex number 1+2i 1+2i
78 Modulus (magnitude) abs(z) abs(z) or Mod(z)79 Argument (angle) angle(z) Arg(z)
80 Complex conjugate conj(z) Conj(z)
81 Real part of z real(z) Re(z)
82 Imaginary part of z imag(z) Im(z)
3.3 Matrix/vector computations
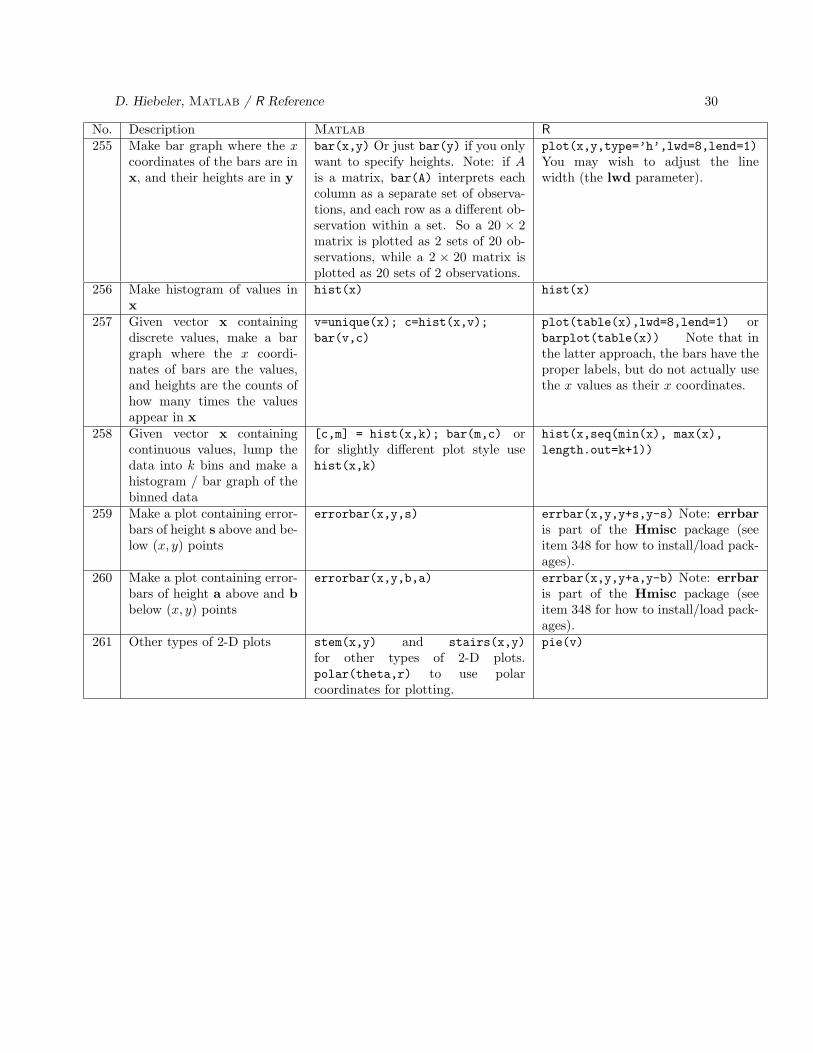
No. Description Matlab R
83 Vector dot product ~x · ~y =~xT~y
dot(x,y) sum(x*y)
84 Vector cross product ~x× ~y cross(x,y) Not in base R, but you can usecross(x,y) after loading thepracma package (see item 348for how to install/load packages)
85 Matrix multiplication AB A * B A %*% B
86 Element-by-element multipli-cation of A and B
A .* B A * B
87 Transpose of a matrix, AT A’ (This is actually the complex con-jugate (i.e. Hermitian) transpose;use A.’ for the non-conjugate trans-pose if you like; they are equivalentfor real matrices.)
t(A) for transpose, or Conj(t(A)) forconjugate (Hermitian) transpose
88 Solve A~x = ~b A\b Warning: if there is no solution,Matlab gives you a least-squares“best fit.” If there are many solu-tions, Matlab just gives you one ofthem.
solve(A,b)Warning: this only workswith square invertible matrices.
89 Reduced echelon form of A rref(A) R does not have a function to do this90 Determinant of A det(A) det(A)
91 Inverse of A inv(A) solve(A)
92 Trace of A trace(A) sum(diag(A))
93 AB−1 A/B A %*% solve(B)
94 Element-by-element divisionof A and B
A ./ B A / B
95 A−1B A\B solve(A,B)
96 Square the matrix A A^2 A %*% A
97 Raise matrix A to the kth
powerA^k (No easy way to do this in R
other than repeated multiplicationA %*% A %*% A...)
98 Raise each element of A tothe kth power
A.^k A^k
99 Rank of matrix A rank(A) qr(A)$rank
100 Set w to be a vector of eigen-values of A, and V a matrixcontaining the correspondingeigenvectors
[V,D]=eig(A) and then w=diag(D)
since Matlab returns the eigenval-ues on the diagonal of D
tmp=eigen(A); w=tmp$values;
V=tmp$vectors

D. Hiebeler, Matlab / R Reference 10
No. Description Matlab R
101 Permuted LU factorization ofa matrix
[L,U,P]=lu(A) then the matricessatisfy PA = LU . Note that thisworks even with non-square matrices
tmp=expand(lu(Matrix(A)));
L=tmp$L; U=tmp$U; P=tmp$P thenthe matrices satisfy A = PLU , i.e.P−1A = LU . Note that the lu andexpand functions are part of the Ma-trix package (see item 348 for how toinstall/load packages). Also note thatthis doesn’t seem to work correctlywith non-square matrices. L, U, andP will be of class Matrix rather thanclass matrix; to make them the latter,instead do L=as.matrix(tmp$L),U=as.matrix(tmp$U), andP=as.matrix(tmp$P) above.
102 Singular-value decomposi-tion: given m × n matrixA with k = min(m,n), findm × k matrix P with or-thonormal columns, diagonalk × k matrix S, and n × kmatrix Q with orthonormalcolumns so that PSQT = A
[P,S,Q]=svd(A,’econ’) tmp=svd(A); P=tmp$u; Q=tmp$v;
S=diag(tmp$d)
103 Schur decomposi-tion of square matrix,A = QTQ∗ = QTQ−1 whereQ is unitary (i.e. Q∗Q = I)and T is upper triangular;Q∗ = QT is the Hermitian(conjugate) transpose
[Q,T]=schur(A) tmp=Schur(Matrix(A)); T=tmp@T;
Q=tmp@Q Note that Schur is part ofthe Matrix package (see item 348 forhow to install/load packages). T andQ will be of class Matrix rather thanclass matrix; to make them the latter,instead do T=as.matrix(tmp@T) andQ=as.matrix(tmp@Q) above.
104 Cholesky factorization of asquare, symmetric, positivedefinite matrix A = R∗R,where R is upper-triangular
R = chol(A) R = chol(A)
105 QR factorization of matrix A,where Q is orthogonal (sat-isfying QQT = I) and R isupper-triangular
[Q,R]=qr(A) satisfying QR = A, or[Q,R,E]=qr(A) to do permuted QRfactorization satisfying AE = QR
z=qr(A); Q=qr.Q(z); R=qr.R(z);
E=diag(n)[,z$pivot] (where n isthe number of columns in A) givespermuted QR factorization satisfyingAE = QR
106 Vector norms norm(v,1) for 1-norm ‖~v‖1,norm(v,2) for Euclidean norm‖~v‖2, norm(v,inf) for infinity-norm‖~v‖∞, and norm(v,p) for p-norm
‖~v‖p = (∑ |vi|p)1/p
R does not have a norm func-tion for vectors; only one formatrices. But the following willwork: norm(matrix(v),’1’) for1-norm ‖~v‖1, norm(matrix(v),’i’)
for infinity-norm ‖~v‖∞, andsum(abs(v)^p)^(1/p) for p-norm
‖~v‖p = (∑ |vi|p)1/p

D. Hiebeler, Matlab / R Reference 11
No. Description Matlab R
107 Matrix norms norm(A,1) for 1-norm ‖A‖1,norm(A) for 2-norm ‖A‖2,norm(A,inf) for infinity-norm‖A‖∞, and norm(A,’fro’) for
Frobenius norm(∑
i(ATA)ii
)1/2
norm(A,’1’) for 1-norm ‖A‖1,max(svd(A,0,0)$d) for 2-norm‖A‖2, norm(A,’i’) for infinity-norm ‖A‖∞, and norm(A,’f’) for
Frobenius norm(∑
i(ATA)ii
)1/2
108 Condition number cond(A) =‖A‖1‖A−1‖1 of A, using 1-norm
cond(A,1) (Note: Matlab also hasa function rcond(A) which computesreciprocal condition estimator usingthe 1-norm)
1/rcond(A,’1’)
109 Condition number cond(A) =‖A‖2‖A−1‖2 of A, using 2-norm
cond(A,2) kappa(A, exact=TRUE) (leave outthe “exact=TRUE” for an esti-mate)
110 Condition number cond(A) =‖A‖∞‖A−1‖∞ of A, usinginfinity-norm
cond(A,inf) 1/rcond(A,’I’)
111 Orthnormal basis for nullspace of matrix A
null(A) null(A) with this function providedby the pracma package
112 Orthnormal basis for im-age/range/column space ofmatrix A
orth(A) orth(A) with this function providedby the pracma package
113 Mean of all elements in vectoror matrix
mean(v) for vectors, mean(A(:)) formatrices
mean(v) or mean(A)
114 Means of columns of a matrix mean(A) colMeans(A)
115 Means of rows of a matrix mean(A,2) rowMeans(A)
116 Standard deviation of all ele-ments in vector or matrix
std(v) for vectors, std(A(:)) formatrices. This normalizes by n − 1.Use std(v,1) to normalize by n.
sd(v) for vectors, sd(A) for matrices.This normalizes by n− 1.
117 Standard deviations ofcolumns of a matrix
std(A). This normalizes by n − 1.Use std(A,1) to normalize by n
apply(A,2,sd). This normalizes byn − 1. Note: in previous versions ofR, sd(A) computed this.
118 Standard deviations of rowsof a matrix
std(A,0,2) to normalize by n − 1,std(A,1,2) to normalize by n
apply(A,1,sd). This normalizes byn− 1.
119 Variance of all elements invector or matrix
var(v) for vectors, var(A(:)) formatrices. This normalizes by n − 1.Use var(v,1) to normalize by n.
var(v) for vectors, var(c(A)) formatrices. This normalizes by n− 1.
120 Variance of columns of a ma-trix
var(A). This normalizes by n − 1.Use var(A,1) to normalize by n
apply(A,2,var). This normalizes byn− 1.
121 Variance of rows of a matrix var(A,0,2) to normalize by n − 1,var(A,1,2) to normalize by n
apply(A,1,var). This normalizes byn− 1.
122 Mode of values in vector v mode(v) (chooses smallest value incase of a tie), or [m,f,c]=mode(v);c{1} (gives list of all tied values)
No simple function built in,but some approaches are:as.numeric(names(sort(-table(v)
)))[1] (chooses smallestvalue in case of a tie), oras.numeric(names(table(v))[
table(v)==max(sort(table(v)))])
(gives vector of all tied val-ues), or tmp = unique(v);
tmp[which.max(tabulate(match(v,
tmp)))] (in case of a tie, chooseswhichever tied value occurs first in v)

D. Hiebeler, Matlab / R Reference 12
No. Description Matlab R
123 Median of values in vector v median(v) median(v)
124 Basic summary statistics ofvalues in vector v
summary(dataset(v)) Note: onlyworks if v is a column vector; usesummary(dataset(v(:))) to makeit work regardless of whether v is arow or column vector.
summary(v)
125 Covariance for two vectors ofobservations
cov(v,w) computes the 2 × 2 co-variance matrix; the off-diagonal ele-ments give the desired covariance
cov(v,w)
126 Covariance matrix, giving co-variances between columns ofmatrix A
cov(A) var(A) or cov(A)
127 Given matrices A and B,build covariance matrix Cwhere cij is the covariance be-tween column i of A and col-umn j of B
I don’t know of a direct way todo this in Matlab. But one way is[Y,X]=meshgrid(std(B),std(A));
X.*Y.*corr(A,B)
cov(A,B)
128 Pearson’s linear correlationcoefficient between elementsof vectors v and w
corr(v,w) Note: v and wmust be column vectors. Orcorr(v(:),w(:)) will work forboth row and column vectors.
cor(v,w)
129 Kendall’s tau correlationstatistic for vectors v and w
corr(v,w,’type’,’kendall’) cor(v,w,method=’kendall’)
130 Spearman’s rho correlationstatistic for vectors v and w
corr(v,w,’type’,’spearman’) cor(v,w,method=’spearman’)
131 Pairwise Pearson’s corre-lation coefficient betweencolumns of matrix A
corr(A) The ’type’ argument mayalso be used as in the previous twoitems
cor(A) The method argument mayalso be used as in the previous twoitems
132 Matrix C of pairwise Pear-son’s correlation coefficientsbetween each pair of columnsof matrices A and B, i.e. cijis correlation between columni of A and column j of B
corr(A,B) The ’type’ argumentmay also be used as just above
cor(A,B) The method argumentmay also be used as just above
133 Sum of all elements in vectoror matrix
sum(v) for vectors, sum(A(:)) formatrices
sum(v) or sum(A)
134 Sums of columns of matrix sum(A) colSums(A)
135 Sums of rows of matrix sum(A,2) rowSums(A)
136 Product of all elements invector or matrix
prod(v) for vectors, prod(A(:)) formatrices
prod(v) or prod(A)
137 Products of columns of ma-trix
prod(A) apply(A,2,prod)
138 Products of rows of matrix prod(A,2) apply(A,1,prod)
139 Matrix exponential eA =∑
∞
k=0Ak/k!
expm(A) expm(Matrix(A)), but this is part oftheMatrix package which you’ll needto install (see item 348 for how to in-stall/load packages).
140 Cumulative sum of values invector
cumsum(v) cumsum(v)
141 Cumulative sums of columnsof matrix
cumsum(A) apply(A,2,cumsum)
D. Hiebeler, Matlab / R Reference 13
No. Description Matlab R
142 Cumulative sums of rows ofmatrix
cumsum(A,2) t(apply(A,1,cumsum))
143 Cumulative sum of all ele-ments of matrix (column-by-column)
cumsum(A(:)) cumsum(A)
144 Cumulative product of ele-ments in vector v
cumprod(v) (Can also be used in thevarious ways cumsum can)
cumprod(v) (Can also be used in thevarious ways cumsum can)
145 Cumulative minimum ormaximum of elements invector v
w=zeros(size(v)); w(1)=v(1);
for i=2:length(v)
w(i)=min(w(i-1),v(i));
end
This actually runs very efficiently be-causeMatlab optimizes/acceleratessimple for loops
cummin(v) or cummax(v)
146 Differences between consecu-tive elements of vector v. Re-sult is a vector w 1 elementshorter than v, where ele-ment i of w is element i + 1of v minus element i of v
diff(v) diff(v)
147 Make a vector y the same sizeas vector x, which equals 4everywhere that x is greaterthan 5, and equals 3 every-where else (done via a vector-ized computation).
z = [3 4]; y = z((x > 5)+1)
Or this will also work:y=3*ones(size(x)); y(x>5)=4
y = ifelse(x > 5, 4, 3)
148 Minimum of values in vectorv
min(v) min(v)
149 Minimum of all values in ma-trix A
min(A(:)) min(A)
150 Minimum value of each col-umn of matrix A
min(A) (returns a row vector) apply(A,2,min) (returns a vector)
151 Minimum value of each row ofmatrix A
min(A, [ ], 2) (returns a columnvector)
apply(A,1,min) (returns a vector)
152 Given matrices A and B,compute a matrix where eachelement is the minimum ofthe corresponding elements ofA and B
min(A,B) pmin(A,B)
153 Given matrix A and scalarc, compute a matrix whereeach element is the minimumof c and the corresponding el-ement of A
min(A,c) pmin(A,c)
154 Find minimum among all val-ues in matrices A and B
min([A(:) ; B(:)]) min(A,B)
155 Find index of the first timemin(v) appears in v, andstore that index in ind
[y,ind] = min(v) ind = which.min(v)

D. Hiebeler, Matlab / R Reference 14
Notes:
• Matlab and R both have a max function (and R has pmax and which.max as well) which behavesin the same ways as min but to compute maxima rather than minima.
• Functions like exp, sin, sqrt etc. will operate on arrays in both Matlab and R, doing thecomputations for each element of the matrix.
No. Description Matlab R
156 Number of rows in A size(A,1) nrow(A) or dim(A)[1]157 Number of columns in A size(A,2) ncol(A) or dim(A)[2]158 Dimensions of A, listed in a
vectorsize(A) dim(A)
159 Number of elements in vectorv
length(v) length(v)
160 Total number of elements inmatrix A
numel(A) length(A)
161 Max. dimension of A length(A) max(dim(A))
162 Sort values in vector v sort(v) sort(v)
163 Sort values in v, puttingsorted values in s, and indicesin idx, in the sense that s[k]= x[idx[k]]
[s,idx]=sort(v) tmp=sort(v,index.return=TRUE);
s=tmp$x; idx=tmp$ix
164 Sort the order of the rows ofmatrix m
sortrows(m)
This sorts according to the first col-umn, then uses column 2 to breakties, then column 3 for remainingties, etc. Complex numbers aresorted by abs(x), and ties are thenbroken by angle(x).
m[order(m[,1]),]
This only sorts according to the firstcolumn. To use column 2 to breakties, and then column 3 to break fur-ther ties, dom[order(m[,1], m[,2], m[,3]),]
Complex numbers are sorted first byreal part, then by imaginary part.
165 Sort order of rows of matrixm, specifying to use columnsx, y, z as the sorting “keys”
sortrows(m, [x y z]) m[order(m[,x], m[,y], m[,z]),]

D. Hiebeler, Matlab / R Reference 15
No. Description Matlab R
166 Same as previous item, butsort in decreasing order forcolumns x and y
sortrows(m, [-x -y z]) m[order(-m[,x], -m[,y],
m[,z]),]
167 Sort order of rows of matrixm, and keep indices used forsorting
[y,i] = sortrows(m) i=order(m[1,]); y=m[i,]
168 To count how many values inthe vector v are between 4and 7 (inclusive on the upperend)
sum((v > 4) & (v <= 7)) sum((v > 4) & (v <= 7))
169 Given vector v, return list ofindices of elements of v whichare greater than 5
find(v > 5) which(v > 5)
170 Given matrix A, return listof indices of elements of Awhich are greater than 5, us-ing single-indexing
find(A > 5) which(A > 5)
171 Given matrix A, generatevectors r and c giving rowsand columns of elements of Awhich are greater than 5
[r,c] = find(A > 5) w = which(A > 5, arr.ind=TRUE);
r=w[,1]; c=w[,2]
172 Given vector x, build a vectorcontaining the unique valuesin x (i.e. with duplicates re-moved).
unique(x) gives the values sortednumerically; unique(x, ’stable’)
gives them in the order they appearin x
unique(x) gives the values inthe order they appear in x;sort(unique(x)) builds a sorted setof unique values
173 Given vector x (of presum-ably discrete values), build avector v listing unique val-ues in x, and correspondingvector c indicating how manytimes those values appear inx
v = unique(x); c = hist(x,v); w=table(x); c=as.numeric(w);
v=as.numeric(names(w))
174 Given vector x (of presum-ably continuous values), di-vide the range of values into kequally-sized bins, and builda vector m containing themidpoints of the bins and acorresponding vector c con-taining the counts of values inthe bins
[c,m] = hist(x,k) w=hist(x,seq(min(x),max(x),
length.out=k+1), plot=FALSE);
m=w$mids; c=w$counts
175 Convolution / polynomialmultiplication (given vectorsx and y containing polyno-mial coefficients, their convo-lution is a vector containingcoefficients of the product ofthe two polynomials)
conv(x,y) convolve(x,rev(y),type=’open’)
Note: the accuracy of this is notas good as Matlab; e.g. doingv=c(1,-1); for (i in 2:20)
v=convolve(v,c(-i,1),
type=’open’) to generate the20th-degree Wilkinson polynomialW (x) =
∏20
i=1(x−i) gives a coefficient
of ≈ −780.19 for x19, rather than thecorrect value -210.

D. Hiebeler, Matlab / R Reference 16
3.4 Root-finding
No. Description Matlab R
176 Find roots of polynomialwhose coefficients are storedin vector v (coefficients in vare highest-order first)
roots(v) polyroot(rev(v)) (This functionreally wants the vector to have theconstant coefficient first in v; rev re-verses their order to achieve this.)
177 Find zero (root) of a functionf(x) of one variable
Define function f(x), then dofzero(f,x0) to search for a rootnear x0, or fzero(f,[a b]) to finda root between a and b, assumingthe sign of f(x) differs at x = aand x = b. Default forward errortolerance (i.e. error in x) is machineepsilon ǫmach.
Define function f(x), then douniroot(f, c(a,b)) to find a rootbetween a and b, assuming the signof f(x) differs at x = a and x = b.Default forward error tolerance (i.e.error in x) is fourth root of machineepsilon, (ǫmach)
0.25. To specify e.g.a tolerance of 2−52, do uniroot(f,
c(a,b), tol=2^-52).
3.5 Function optimization/minimization
No. Description Matlab R
178 Find value m which mini-mizes a function f(x) of onevariable within the intervalfrom a to b
Define function f(x), then do
m = fminbnd(@f, a, b)
Define function f(x), then do
m = optimize(f,c(a,b))$minimum
179 Find value m which mini-mizes a function f(x, p1, p2)with given extra parameters(but minimization is only oc-curing over the first argu-ment), in the interval from ato b.
Define function f(x,p1,p2), then usean “anonymous function”:
% first define values for p1
% and p2, and then do:
m=fminbnd(@(x) f(x,p1,p2),a,b)
Define function f(x,p1,p2), then:
# first define values for p1
# and p2, and then do:
m = optimize(f, c(a,b), p1=p1,
p2=p2)$minimum
180 Find values of x, y, z whichminimize function f(x, y, z),using a starting guess of x =1, y = 2.2, and z = 3.4.
First write function f(v) which ac-cepts a vector argument v containingvalues of x, y, and z, and returns thescalar value f(x, y, z), then do:
fminsearch(@f,[1 2.2 3.4])
First write function f(v) which ac-cepts a vector argument v containingvalues of x, y, and z, and returns thescalar value f(x, y, z), then do:
optim(c(1,2.2,3.4),f)$par
181 Find values of x, y, zwhich minimize functionf(x, y, z, p1, p2), using astarting guess of x = 1,y = 2.2, and z = 3.4, wherethe function takes some extraparameters (useful e.g. fordoing things like nonlinearleast-squares optimizationwhere you pass in some datavectors as extra parameters).
First write function f(v,p1,p2)which accepts a vector argumentv containing values of x, y, andz, along with the extra parame-ters, and returns the scalar valuef(x, y, z, p1, p2), then do:
fminsearch(@f,[1 2.2 3.4], ...
[ ], p1, p2)
Or use an anonymous function:
fminsearch(@(x) f(x,p1,p2), ...
[1 2.2 3.4])
First write function f(v,p1,p2) whichaccepts a vector argument v contain-ing values of x, y, and z, along withthe extra parameters, and returns thescalar value f(x, y, z, p1, p2), then do:
optim(c(1,2.2,3.4), f, p1=p1,
p2=p2)$par

D. Hiebeler, Matlab / R Reference 17
3.6 Numerical integration / quadrature
No. Description Matlab R
182 Numerically integrate func-tion f(x) over interval froma to b
quad(f,a,b) uses adaptive Simp-son’s quadrature, with a defaultabsolute tolerance of 10−6. Tospecify absolute tolerance, usequad(f,a,b,tol)
integrate(f,a,b) uses adaptivequadrature with default absoluteand relative error tolerances beingthe fourth root of machine epsilon,(ǫmach)
0.25 ≈ 1.22 × 10⁻⁴. Tol-erances can be specified by usingintegrate(f,a,b, rel.tol=tol1,
abs.tol=tol2). Note that the func-tion f must be written to work evenwhen given a vector of x values as itsargument.
183 Simple trapezoidal numericalintegration using (x, y) valuesin vectors x and y
trapz(x,y) sum(diff(x)*(y[-length(y)]+
y[-1])/2)

D. Hiebeler, Matlab / R Reference 18
3.7 Curve fitting
No. Description Matlab R
184 Fit the line y = c1x + c0 todata in vectors x and y.
p = polyfit(x,y,1)
The return vector p has the coeffi-cients in descending order, i.e. p(1)is c1, and p(2) is c0.
p = coef(lm(y ~ x))
The return vector p has the coeffi-cients in ascending order, i.e. p[1] isc0, and p[2] is c1.
185 Fit the quadratic polynomialy = c2x
2+ c1x+ c0 to data invectors x and y.
p = polyfit(x,y,2)
The return vector p has the coeffi-cients in descending order, i.e. p(1)is c2, p(2) is c1, and p(3) is c0.
p = coef(lm(y ~ x + I(x^2)))
The return vector p has the coeffi-cients in ascending order, i.e. p[1] isc0, p[2] is c1, and p[3] is c2.
186 Fit nth degree polynomialy = cnx
n + cn−1xn−1 + . . .+
c1x + c0 to data in vectors xand y.
p = polyfit(x,y,n)
The return vector p has the coeffi-cients in descending order, p(1) iscn, p(2) is cn−1, etc.
No simple built-in way. But this willwork: coef(lm(as.formula(paste(
’y~’,paste(’I(x^’,1:n,’)’,
sep=’’,collapse=’+’)))))
This more concise “lower-level” method will also work:coef(lm.fit(outer(x,0:n,’^’),y))
Note that both of the above returnthe coefficients in ascending order.Also see the polyreg function in themda package (see item 348 for howto install/load packages).
187 Fit the quadratic polynomialwith zero intercept, y =c2x
2 + c1x to data in vectorsx and y.
(I don’t know a simple way do thisin Matlab, other than to write afunction which computes the sumof squared residuals and use fmin-search on that function. There islikely an easy way to do it in theStatistics Toolbox.)
p=coef(lm(y ~ -1 + x + I(x^2)))
The return vector p has the coeffi-cients in ascending order, i.e. p[1] isc1, and p[2] is c2.
188 Fit natural cubic spline(S′′(x) = 0 at both end-points) to points (xi, yi)whose coordinates are invectors x and y; evaluate atpoints whose x coordinatesare in vector xx, storingcorresponding y’s in yy
pp=csape(x,y,’variational’);
yy=ppval(pp,xx) but note thatcsape is in Matlab’s SplineToolbox
tmp=spline(x,y,method=’natural’,
xout=xx); yy=tmp$y
189 Fit cubic spline usingForsythe, Malcolm andMoler method (third deriva-tives at endpoints matchthird derivatives of exact cu-bics through the four pointsat each end) to points (xi, yi)whose coordinates are invectors x and y; evaluate atpoints whose x coordinatesare in vector xx, storingcorresponding y’s in yy
I’m not aware of a function to do thisin Matlab
tmp=spline(x,y,xout=xx);
yy=tmp$y

D. Hiebeler, Matlab / R Reference 19
No. Description Matlab R
190 Fit cubic spline such thatfirst derivatives at endpointsmatch first derivatives of ex-act cubics through the fourpoints at each end) to points(xi, yi) whose coordinates arein vectors x and y; evaluateat points whose x coordinatesare in vector xx, storing cor-responding y’s in yy
pp=csape(x,y); yy=ppval(pp,xx)
but csape is in Matlab’s SplineToolbox
I’m not aware of a function to do thisin R
191 Fit cubic spline with periodicboundaries, i.e. so that firstand second derivatives matchat the left and right ends(the first and last y valuesof the provided data shouldalso agree), to points (xi, yi)whose coordinates are in vec-tors x and y; evaluate atpoints whose x coordinatesare in vector xx, storing cor-responding y’s in yy
pp=csape(x,y,’periodic’);
yy=ppval(pp,xx) but csape is inMatlab’s Spline Toolbox
tmp=spline(x,y,method=
’periodic’, xout=xx); yy=tmp$y
192 Fit cubic spline with “not-a-knot” conditions (the firsttwo piecewise cubics coincide,as do the last two), to points(xi, yi) whose coordinates arein vectors x and y; evaluateat points whose x coordinatesare in vector xx, storing cor-responding y’s in yy
yy=spline(x,y,xx) I’m not aware of a function to do thisin R
4 Conditionals, control structure, loops
No. Description Matlab R
193 “for” loops over values in avector v (the vector v is of-ten constructed via a:b)
for i=v
command1
command2
end
If only one command inside the loop:
for (i in v)
command
or
for (i in v) command
If multiple commands inside the loop:
for (i in v) {
command1
command2
}
D. Hiebeler, Matlab / R Reference 20
No. Description Matlab R
194 “if” statements with no elseclause if cond
command1
command2
end
If only one command inside the clause:
if (cond)
command
or
if (cond) command
If multiple commands:
if (cond) {
command1
command2
}
195 “if/else” statement
if cond
command1
command2
else
command3
command4
end
Note: Matlab also has an “elseif”statement, e.g.:
if cond1
commands1
elseif cond2
commands2
elseif cond3
commands3
else
commands4
end
If one command in clauses:
if (cond)
command1 else
command2
or
if (cond) cmd1 else cmd2
If multiple commands:
if (cond) {
command1
command2
} else {
command3
command4
}
Warning: the “else” must be on thesame line as command1 or the “}”(when typed interactively at the com-mand prompt), otherwise R thinks the“if” statement was finished and givesan error.R does not have an “elseif” statement(though see item 147 for something re-lated), but you can do this:
if (cond1) {
commands1
} else if (cond2) {
commands2
} else if (cond3) {
commands3
} else {
commands4
}

D. Hiebeler, Matlab / R Reference 21
Logical comparisons which can be used on scalars in “if” statements, or which operate element-by-element on vectors/matrices:
Matlab R Descriptionx < a x < a True if x is less than ax > a x > a True if x is greater than ax <= a x <= a True if x is less than or equal to ax >= a x >= a True if x is greater than or equal to ax == a x == a True if x is equal to ax ~= a x != a True if x is not equal to a
Scalar logical operators:
Description Matlab R
a AND b a && b a && b
a OR b a || b a || b
a XOR b xor(a,b) xor(a,b)
NOT a ~a !a
The && and || operators are short-circuiting, i.e. && stops as soon as any of its terms are FALSE, and|| stops as soon as any of its terms are TRUE.
Matrix logical operators (they operate element-by-element):
Description Matlab R
a AND b a & b a & b
a OR b a | b a | b
a XOR b xor(a,b) xor(a,b)
NOT a ~a !a
No. Description Matlab R
196 To test whether a scalar valuex is between 4 and 7 (inclu-sive on the upper end)
if ((x > 4) && (x <= 7)) if ((x > 4) && (x <= 7))
197 Count how many values inthe vector x are between 4and 7 (inclusive on the upperend)
sum((x > 4) & (x <= 7)) sum((x > 4) & (x <= 7))
198 Test whether all values ina logical/boolean vector areTRUE
all(v) all(v)
199 Test whether any values ina logical/boolean vector areTRUE
any(v) any(v)

D. Hiebeler, Matlab / R Reference 22
No. Description Matlab R
200 “while” statements to do iter-ation (useful when you don’tknow ahead of time howmany iterations you’ll need).E.g. to add uniform ran-dom numbers between 0 and1 (and their squares) untiltheir sum is greater than 20:
mysum = 0;
mysumsqr = 0;
while (mysum < 20)
r = rand;
mysum = mysum + r;
mysumsqr = mysumsqr + r^2;
end
mysum = 0
mysumsqr = 0
while (mysum < 20) {
r = runif(1)
mysum = mysum + r
mysumsqr = mysumsqr + r^2
}
(As with “if” statements and “for”loops, the curly brackets are not nec-essary if there’s only one statement in-side the “while” loop.)
201 More flow control: these com-mands exit or move on to thenext iteration of the inner-most while or for loop, re-spectively.
break and continue break and next
202 “Switch” statements for inte-gers
switch (x)
case 10
disp(’ten’)
case {12,13}
disp(’dozen (bakers?)’)
otherwise
disp(’unrecognized’)
end
R doesn’t have a switch statement ca-pable of doing this. It has a functionwhich is fairly limited for integers, butcan which do string matching. See?switch for more. But a basic ex-ample of what it can do for integers isbelow, showing that you can use it toreturn different expressions based onwhether a value is 1, 2, . . ..
mystr = switch(x, ’one’, ’two’,
’three’); print(mystr)
Note that switch returns NULL if x islarger than 3 in the above case. Also,continuous values of x will be trun-cated to integers.

D. Hiebeler, Matlab / R Reference 23
5 Functions, ODEs
No. Description Matlab R
203 Implement a functionadd(x,y)
Put the following in add.m:
function retval=add(x,y)
retval = x+y;
Then you can do e.g. add(2,3)
Enter the following, or put it in a fileand source that file:
add = function(x,y) {
return(x+y)
}
Then you can do e.g. add(2,3).Note, the curly brackets aren’t neededif your function only has one line.Also, the return keyword is optionalin the above example, as the value ofthe last expression in a function getsreturned, so just x+y would worktoo.
204 Implement a functionf(x,y,z) which returns mul-tiple values, and store thosereturn values in variables uand v
Write function as follows:
function [a,b] = f(x,y,z)
a = x*y+z; b=2*sin(x-z);
Then call the function by doing:[u,v] = f(2,8,12)
Write function as follows:
f = function(x,y,z) {
a = x*y+z; b=2*sin(x-z)
return(list(a,b))
}
Then call the function by do-ing: tmp=f(2,8,12); u=tmp[[1]];
v=tmp[[2]]. The above is most gen-eral, and will work even when u andv are different types of data. If theyare both scalars, the function couldsimply return them packed in a vec-tor, i.e. return(c(a,b)). If theyare vectors of the same size, the func-tion could return them packed to-gether into the columns of a matrix,i.e. return(cbind(a,b)).
D. Hiebeler, Matlab / R Reference 24
No. Description Matlab R
205 Numerically solve ODEdx/dt = 5x from t = 3 tot = 12 with initial conditionx(3) = 7
First implement function
function retval=f(t,x)
retval = 5*x;
Then do ode45(@f,[3,12],7)
to plot solution, or[t,x]=ode45(@f,[3,12],7) to getback vector t containing time valuesand vector x containing correspond-ing function values. If you wantfunction values at specific times,e.g. 3, 3.1, 3.2, . . . , 11.9, 12, you cando [t,x]=ode45(@f,3:0.1:12,7).Note: in older versions of Matlab,use ’f’ instead of @f.
First implement function
f = function(t,x,parms) {
return(list(5*x))
}
Then do y=lsoda(7, seq(3,12,
0.1), f,NA) to obtain solutionvalues at times 3, 3.1, 3.2, . . . , 11.9, 12.The first column of y, namely y[,1]contains the time values; the secondcolumn y[,2] contains the corre-sponding function values. Note:lsoda is part of the deSolve package(see item 348 for how to install/loadpackages).
206 Numerically solve system ofODEs dw/dt = 5w, dz/dt =3w + 7z from t = 3 to t = 12with initial conditions w(3) =7, z(3) = 8.2
First implement function
function retval=myfunc(t,x)
w = x(1); z = x(2);
retval = zeros(2,1);
retval(1) = 5*w;
retval(2) = 3*w + 7*z;
Then doode45(@myfunc,[3,12],[7;
8.2]) to plot solution, or[t,x]=ode45(@myfunc,[3,12],[7;
8.2]) to get back vector t contain-ing time values and matrix x, whosefirst column containing correspond-ing w(t) values and second columncontains z(t) values. If you wantfunction values at specific times, e.g.3, 3.1, 3.2, . . . , 11.9, 12, you can do[t,x]=ode45(@myfunc,3:0.1:12,[7;
8.2]). Note: in older versions ofMatlab, use ’f’ instead of @f.
First implement function
myfunc = function(t,x,parms) {
w = x[1]; z = x[2];
return(list(c(5*w, 3*w+7*z)))
}
Then do y=lsoda(c(7,8.2),
seq(3,12, 0.1), myfunc,NA)
to obtain solution values at times3, 3.1, 3.2, . . . , 11.9, 12. The firstcolumn of y, namely y[,1] containsthe time values; the second columny[,2] contains the correspondingvalues of w(t); and the third columncontains z(t). Note: lsoda is part ofthe deSolve package (see item 348for how to install/load packages).
207 Pass parameters such as r =1.3 and K = 50 to an ODEfunction from the commandline, solving dx/dt = rx(1 −x/K) from t = 0 to t = 20with initial condition x(0) =2.5.
First implement function
function retval=func2(t,x,r,K)
retval = r*x*(1-x/K)
Then do ode45(@func2,[0 20],
2.5, [ ], 1.3, 50). The emptymatrix is necessary between the ini-tial condition and the beginning ofyour extra parameters.
First implement function
func2=function(t,x,parms) {
r=parms[1]; K=parms[2]
return(list(r*x*(1-x/K)))
}
Then do
y=lsoda(2.5,seq(0,20,0.1),
func2,c(1.3,50))
Note: lsoda is part of the deSolvepackage (see item 348 for how to in-stall/load packages).

D. Hiebeler, Matlab / R Reference 25
6 Probability and random values
No. Description Matlab R
208 Generate a continuous uni-form random value between 0and 1
rand runif(1)
209 Generate vector of n uniformrandom vals between 0 and 1
rand(n,1) or rand(1,n) runif(n)
210 Generatem×nmatrix of uni-form random values between0 and 1
rand(m,n) matrix(runif(m*n),m,n) or justmatrix(runif(m*n),m)
211 Generatem×nmatrix of con-tinuous uniform random val-ues between a and b
a+rand(m,n)*(b-a) or if youhave the Statistics toolbox thenunifrnd(a,b,m,n)
matrix(runif(m*n,a,b),m)
212 Generate a random integerbetween 1 and k
randi(k) or floor(k*rand)+1 floor(k*runif(1)) + 1 orsample(k,1)
213 Generate m×n matrix of dis-crete uniform random inte-gers between 1 and k
randi(k, m, n) orfloor(k*rand(m,n))+1 or if youhave the Statistics toolbox thenunidrnd(k,m,n)
floor(k*matrix(runif(m*n),m))+1
or matrix(sample(k, m*n,
replace=TRUE), m)
214 Generate m×n matrix whereeach entry is 1 with probabil-ity p, otherwise is 0
(rand(m,n)<p)*1 Note: multiplyingby 1 turns the logical (true/false) re-sult back into numeric values. Youcould also do double(rand(m,n)<p)
matrix(sample(c(0,1), m*n,
replace=TRUE, prob=c(1-p, p)),
m) or (matrix(runif(m,n),m)<p)*1
(Note: multiplying by 1 turns thelogical (true/false) result back intonumeric values; using as.numeric()to do it would lose the shape of thematrix.)
215 Generate m×n matrix whereeach entry is a with probabil-ity p, otherwise is b
b + (a-b)*(rand(m,n)<p) matrix(sample(c(b,a), m*n,
replace=TRUE, prob=c(1-p,
p)), m) or b + (a-b)*(matrix(
runif(m,n),m)<p)
216 Generate a random integerbetween a and b inclusive
floor((b-a+1)*rand)+a or if youhave the Statistics toolbox thenunidrnd(b-a+1)+a-1
sample(a:b, 1) orfloor((b-a+1)*runif(1))+a
217 Flip a coin which comes upheads with probability p, andperform some action if it doescome up heads
if (rand < p)
...some commands...
end
if (runif(1) < p) {
...some commands...
}
218 Generate a random permuta-tion of the integers 1, 2, . . . , n
randperm(n) sample(n)
219 Generate a random selectionof k unique integers between1 and n (i.e. sampling with-out replacement)
[s,idx]=sort(rand(n,1));
ri=idx(1:k) or another way isri=randperm(n); ri=ri(1:k). Orif you have the Statistics Toolbox,then randsample(n,k)
ri=sample(n,k)
220 Choose k values (with re-placement) from the vector v,storing result in w
L=length(v);
w=v(floor(L*rand(k,1))+1) Or,if you have the Statistics Toolbox,w=randsample(v,k,true)
w=sample(v,k,replace=TRUE)

D. Hiebeler, Matlab / R Reference 26
No. Description Matlab R
221 Choose k values (without re-placement) from the vector v,storing result in w
L=length(v); ri=randperm(L);
ri=ri(1:k); w=v(ri) Or, ifyou have the Statistics Toolbox,w=randsample(v,k)
w=sample(v,k,replace=FALSE)
222 Generate a value from 1 to nwith corresponding probabil-ities in vector pv
sum(rand > cumsum(pv))+1 If en-tries of pv don’t sum to one,rescale them first: sum(rand >
cumsum(pv)/sum(pv))+1
sample(n, 1, prob=pv) If the en-tries of pv don’t sum to one, sampleautomatically rescales them to do so.
223 Set the random-number gen-erator back to a known state(useful to do at the beginningof a stochastic simulationwhen debugging, so you’ll getthe same sequence of randomnumbers each time)
rng(12) See also RandStream forhow to create and use multiplestreams of random numbers. Andnote: in versions of Matlab priorto 7.7, instead use rand(’state’,
12).
set.seed(12)
Note that the “*rnd,” “*pdf,” and “*cdf” functions described below are all part of the Matlab
Statistics Toolbox, and not part of the core Matlab distribution.No. Description Matlab R
224 Generate a random valuefrom the binomial(n, p) dis-tribution
binornd(n,p) orsum(rand(n,1)<p) will workeven without the Statistics Toolbox.
rbinom(1,n,p)
225 Generate a random valuefrom the Poisson distributionwith parameter λ
poissrnd(lambda) rpois(1,lambda)
226 Generate a random valuefrom the exponential distri-bution with mean µ
exprnd(mu) or -mu*log(rand) willwork even without the StatisticsToolbox.
rexp(1, 1/mu)
227 Generate a random valuefrom the discrete uniform dis-tribution on integers 1 . . . k
unidrnd(k) or floor(rand*k)+1
will work even without the StatisticsToolbox.
sample(k,1)
228 Generate n iid random valuesfrom the discrete uniform dis-tribution on integers 1 . . . k
unidrnd(k,n,1) orfloor(rand(n,1)*k)+1 will workeven without the Statistics Toolbox.
sample(k,n,replace=TRUE)
229 Generate a random valuefrom the continuous uniformdistribution on the interval(a, b)
unifrnd(a,b) or (b-a)*rand + a
will work even without the StatisticsToolbox.
runif(1,a,b)
230 Generate a random valuefrom the normal distributionwith mean µ and standarddeviation σ
normrnd(mu,sigma) ormu + sigma*randn will workeven without the Statistics Toolbox.
rnorm(1,mu,sigma)
231 Generate a random vectorfrom the multinomial distri-bution, with n trials andprobability vector p
mnrnd(n,p) rmultinom(1,n,p)
232 Generate j random vectorsfrom the multinomial distri-bution, with n trials andprobability vector p
mnrnd(n,p,j)
The vectors are returned as rows ofa matrix
rmultinom(j,n,p)
The vectors are returned as columnsof a matrix
Notes:

D. Hiebeler, Matlab / R Reference 27
• The Matlab “*rnd” functions above can all take additional r,c arguments to build an r× c matrixof iid random values. E.g. poissrnd(3.5,4,7) for a 4 × 7 matrix of iid values from the Poissondistribution with mean λ = 3.5. The unidrnd(k,n,1) command above is an example of this, togenerate a k × 1 column vector.
• The first parameter of the R “r*” functions above specifies how many values are desired. E.g. togenerate 28 iid random values from a Poisson distribution with mean 3.5, use rpois(28,3.5). Toget a 4× 7 matrix of such values, use matrix(rpois(28,3.5),4).
No. Description Matlab R
233 Probability that a ran-dom variable from theBinomial(n, p) distributionhas value x (i.e. the density,or pdf).
binopdf(x,n,p) ornchoosek(n,x)*p^x*(1-p)^(n-x)
will work even without the StatisticsToolbox, as long as n and x arenon-negative integers and 0 ≤ p≤ 1.
dbinom(x,n,p)
234 Probability that a randomvariable from the Poisson(λ)distribution has value x.
poisspdf(x,lambda) orexp(-lambda)*lambda^x /
factorial(x) will work evenwithout the Statistics Toolbox, aslong as x is a non-negative integerand lambda ≥ 0.
dpois(x,lambda)
235 Probability density functionat x for a random variablefrom the exponential distri-bution with mean µ.
exppdf(x,mu) or(x>=0)*exp(-x/mu)/mu will workeven without the Statistics Toolbox,as long as mu is positive.
dexp(x,1/mu)
236 Probability density functionat x for a random variablefrom the Normal distributionwith mean µ and standarddeviation σ.
normpdf(x,mu,sigma) orexp(-(x-mu)^2/(2*sigma^2))/
(sqrt(2*pi)*sigma) will work evenwithout the Statistics Toolbox.
dnorm(x,mu,sigma)
237 Probability density functionat x for a random variablefrom the continuous uniformdistribution on interval (a, b).
unifpdf(x,a,b) or((x>=a)&&(x<=b))/(b-a) willwork even without the StatisticsToolbox.
dunif(x,a,b)
238 Probability that a randomvariable from the discreteuniform distribution on inte-gers 1 . . . n has value x.
unidpdf(x,n) or ((x==floor(x))
&& (x>=1)&&(x<=n))/n will workeven without the Statistics Toolbox,as long as n is a positive integer.
((x==round(x)) && (x >= 1) &&
(x <= n))/n
239 Probability that a randomvector from the multinomialdistribution with probabilityvector ~p has the value ~x
mnpdf(x,p)
Note: vector p must sum to one.Also, x and p can be vectors oflength k, or if one or both are m× kmatrices then the computations areperformed for each row.
dmultinom(x,prob=p)
Note: one or more of the parameters in the above “*pdf” (Matlab) or “d*” (R) functions can bevectors, but they must be the same size. Scalars are promoted to arrays of the appropriate size.

D. Hiebeler, Matlab / R Reference 28
The corresponding CDF functions are below:No. Description Matlab R
240 Probability that a ran-dom variable from theBinomial(n, p) distribution isless than or equal to x (i.e.the cumulative distributionfunction, or cdf).
binocdf(x,n,p). Without theStatistics Toolbox, as longas n is a non-negative in-teger, this will work: r =
0:floor(x); sum(factorial(n)./
(factorial(r).*factorial(n-r))
.*p.^r.*(1-p).^(n-r)). (Un-fortunately, Matlab’s nchoosekfunction won’t take a vector argu-ment for k.)
pbinom(x,n,p)
241 Probability that a randomvariable from the Poisson(λ)distribution is less than orequal to x.
poisscdf(x,lambda). With-out the Statistics Toolbox, aslong as lambda ≥ 0, thiswill work: r = 0:floor(x);
sum(exp(-lambda)*lambda.^r
./factorial(r))
ppois(x,lambda)
242 Cumulative distributionfunction at x for a randomvariable from the exponentialdistribution with mean µ.
expcdf(x,mu) or(x>=0)*(1-exp(-x/mu)) willwork even without the StatisticsToolbox, as long as mu is positive.
pexp(x,1/mu)
243 Cumulative distributionfunction at x for a randomvariable from the Normaldistribution with mean µ andstandard deviation σ.
normcdf(x,mu,sigma) or 1/2 -
erf(-(x-mu)/(sigma*sqrt(2)))/2
will work even without the Statis-tics Toolbox, as long as sigma ispositive.
pnorm(x,mu,sigma)
244 Cumulative distributionfunction at x for a randomvariable from the continuousuniform distribution oninterval (a, b).
unifcdf(x,a,b) or(x>a)*(min(x,b)-a)/(b-a) willwork even without the StatisticsToolbox, as long as b > a.
punif(x,a,b)
245 Probability that a randomvariable from the discreteuniform distribution on in-tegers 1 . . . n is less than orequal to x.
unidcdf(x,n) or(x>=1)*min(floor(x),n)/n willwork even without the StatisticsToolbox, as long as n is a positiveinteger.
(x>=1)*min(floor(x),n)/n

D. Hiebeler, Matlab / R Reference 29
7 Graphics
7.1 Various types of plotting
No. Description Matlab R
246 Create a new figure window figure dev.new() Notes: internally, onWindows this calls windows(), onMacOS it calls quartz(), and onLinux it calls X11(). X11() is alsoavailable on MacOS; you can tellR to use it by default by doingoptions(device=’X11’). In R
sometime after 2.7.0, X11 graphicsstarted doing antialising by default,which makes plots look smootherbut takes longer to draw. If you areusing X11 graphics in R and noticethat figure plotting is extremely slow(especially if making many plots),do this before calling dev.new():X11.options(type=’Xlib’) orX11.options(antialias=’none’).Or just use e.g. X11(type=’Xlib’)
to make new figure windows. Theyare uglier (lines are more jagged), butrender much more quickly.
247 Select figure number n figure(n) (will create the figure if itdoesn’t exist)
dev.set(n) (returns the actual de-vice selected; will be different from nif there is no figure device with num-ber n)
248 Determine which figure win-dow is currently active
gcf dev.cur()
249 List open figure windows get(0,’children’) (The 0 handlerefers to the root graphics object.)
dev.list()
250 Close figure window(s) close to close the current figure win-dow, close(n) to close a specifiedfigure, and close all to close all fig-ures
dev.off() to close the currently ac-tive figure device, dev.off(n) to closea specified one, and graphics.off()
to close all figure devices.251 Plot points using open circles plot(x,y,’o’) plot(x,y)
252 Plot points using solid lines plot(x,y) plot(x,y,type=’l’) (Note: that’s alower-case ’L’, not the number 1)
253 Plotting: color, point mark-ers, linestyle
plot(x,y,str) where str is astring specifying color, point marker,and/or linestyle (see table below)(e.g. ’gs--’ for green squares withdashed line)
plot(x,y,type=str1,
pch=arg2,col=str3,
lty=arg4)
See tables below for possible values ofthe 4 parameters
254 Plotting with logarithmicaxes
semilogx, semilogy, and loglog
functions take arguments like plot,and plot with logarithmic scales forx, y, and both axes, respectively
plot(..., log=’x’), plot(...,
log=’y’), and plot(...,
log=’xy’) plot with logarithmicscales for x, y, and both axes,respectively
D. Hiebeler, Matlab / R Reference 30
No. Description Matlab R
255 Make bar graph where the xcoordinates of the bars are inx, and their heights are in y
bar(x,y) Or just bar(y) if you onlywant to specify heights. Note: if Ais a matrix, bar(A) interprets eachcolumn as a separate set of observa-tions, and each row as a different ob-servation within a set. So a 20 × 2matrix is plotted as 2 sets of 20 ob-servations, while a 2 × 20 matrix isplotted as 20 sets of 2 observations.
plot(x,y,type=’h’,lwd=8,lend=1)
You may wish to adjust the linewidth (the lwd parameter).
256 Make histogram of values inx
hist(x) hist(x)
257 Given vector x containingdiscrete values, make a bargraph where the x coordi-nates of bars are the values,and heights are the counts ofhow many times the valuesappear in x
v=unique(x); c=hist(x,v);
bar(v,c)
plot(table(x),lwd=8,lend=1) orbarplot(table(x)) Note that inthe latter approach, the bars have theproper labels, but do not actually usethe x values as their x coordinates.
258 Given vector x containingcontinuous values, lump thedata into k bins and make ahistogram / bar graph of thebinned data
[c,m] = hist(x,k); bar(m,c) orfor slightly different plot style usehist(x,k)
hist(x,seq(min(x), max(x),
length.out=k+1))
259 Make a plot containing error-bars of height s above and be-low (x, y) points
errorbar(x,y,s) errbar(x,y,y+s,y-s) Note: errbaris part of the Hmisc package (seeitem 348 for how to install/load pack-ages).
260 Make a plot containing error-bars of height a above and bbelow (x, y) points
errorbar(x,y,b,a) errbar(x,y,y+a,y-b) Note: errbaris part of the Hmisc package (seeitem 348 for how to install/load pack-ages).
261 Other types of 2-D plots stem(x,y) and stairs(x,y)
for other types of 2-D plots.polar(theta,r) to use polarcoordinates for plotting.
pie(v)

D. Hiebeler, Matlab / R Reference 31
No. Description Matlab R
262 Make a 3-D plot of some datapoints with given x, y, z co-ordinates in the vectors x, y,and z.
plot3(x,y,z) This works much likeplot, as far as plotting symbols, line-types, and colors.
cloud(z~x*y) You can also usearguments pch and col as withplot. To make a 3-D plot withlines, do cloud(z~x*y,type=’l’,
panel.cloud=panel.3dwire). Seethe rgl package to interactively rotate3-D plots (and see item 348 for how toload packages).
263 Surface plot of data in matrixA
surf(A)
You can then click on the smallcurved arrow in the figure window(or choose “Rotate 3D” from the“Tools” menu), and then click anddrag the mouse in the figure to ro-tate it in three dimensions.
persp(A)
You can include shading in the im-age via e.g. persp(A,shade=0.5).There are two viewing angles youcan also specify, among other pa-rameters, e.g. persp(A, shade=0.5,
theta=50, phi=35).264 Surface plot of f(x, y) =
sin(x + y)√y for 100 values
of x between 0 and 10, and90 values of y between 2 and8
x = linspace(0,10,100);
y = linspace(2,8,90);
[X,Y] = meshgrid(x,y);
Z = sin(X+Y).*sqrt(Y);
surf(X,Y,Z)
shading flat
x = seq(0,10,len=100)
y = seq(2,8,len=90)
f = function(x,y)
return(sin(x+y)*sqrt(y))
z = outer(x,y,f)
persp(x,y,z)
265 Other ways of plotting thedata from the previous com-mand
mesh(X,Y,Z), surfc(X,Y,Z),surfl(X,Y,Z), contour(X,Y,Z),pcolor(X,Y,Z),waterfall(X,Y,Z). Also see theslice command.
contour(x,y,z) Or dos=expand.grid(x=x,y=y), andthen wireframe(z~x*y,s) orwireframe(z~x*y,s,shade=TRUE)
(Note: wireframe is part of thelattice package; see item 348 for howto load packages). If you have vectorsx, y, and z all the same length, youcan also do symbols(x,y,z).
266 Set axis ranges in a figurewindow
axis([x1 x2 y1 y2]) You have to do this whenyou make the plot, e.g.plot(x,y,xlim=c(x1,x2),
ylim=c(y1,y2))
267 Add title to plot title(’somestring’) title(main=’somestring’)
adds a main title,title(sub=’somestring’) addsa subtitle. You can also includemain= and sub= arguments in aplot command.
268 Add axis labels to plot xlabel(’somestring’) andylabel(’somestring’)
title(xlab=’somestring’,
ylab=’anotherstr’). You canalso include xlab= and ylab=arguments in a plot command.

D. Hiebeler, Matlab / R Reference 32
No. Description Matlab R
269 Include Greek letters or sym-bols in plot axis labels
You can use basic TeX com-mands, e.g. plot(x,y);
xlabel(’\phi^2 + \mu_{i,j}’)
or xlabel(’fecundity \phi’)
See also help tex and parts ofdoc text props for more aboutbuilding labels using general LaTeXcommands
plot(x,y,xlab=
expression(phi^2 + mu[’i,j’]))
or plot(x,y,xlab=expression(
paste(’fecundity ’, phi)))
See also help(plotmath) and p.98 of the R Graphics book by PaulMurrell for more.
270 Change font size to 16 in plotlabels
For the legends and numerical axislabels, use set(gca, ’FontSize’,
16), and for text labels on axesdo e.g. xlabel(’my x var’,
’FontSize’, 16)
For on-screen graphics, dopar(ps=16) followed by e.g. a plot
command. For PostScript or PDFplots, add a pointsize=16 argument,e.g. pdf(’myfile.pdf’, width=8,
height=8, pointsize=16) (seeitems 286 and 287)
271 Add grid lines to plot grid on (and grid off to turn off) grid() Note that if you’ll beprinting the plot, the default stylefor grid-lines is to use gray dot-ted lines, which are almost invis-ible on some printers. You maywant to do e.g. grid(lty=’dashed’,col=’black’) to use black dashedlines which are easier to see.
272 Add a text label to a plot text(x,y,’hello’) text(x,y,’hello’)
273 Add set of text labels to aplot. xv and yv are vectors.
s={’hi’, ’there’};
text(xv,yv,s)
s=c(’hi’, ’there’);
text(xv,yv,s)
274 Add an arrow to current plot,with tail at (xt, yt) and headat (xh, yh)
annotation(’arrow’, [xt xh],
[yt yh]) Note: coordinates shouldbe normalized figure coordinates, notcoordinates within your displayedaxes. Find and download from TheMathworks the file dsxy2figxy.mwhich converts for you, then do this:[fx,fy]=dsxy2figxy([xt xh],
[yt yh]); annotation(’arrow’,
fx, fy)
arrows(xt, yt, xh, yh)
275 Add a double-headed arrowto current plot, with coordi-nates (x0, y0) and (x1, y1)
annotation(’doublearrow’, [x0
x1], [y0 y1]) See note in previ-ous item about normalized figurecoordinates.
arrows(x0, y0, x1, y1, code=3)
276 Add figure legend to top-leftcorner of plot
legend(’first’, ’second’,
’Location’, ’NorthWest’)
legend(’topleft’,
legend=c(’first’, ’second’),
col=c(’red’, ’blue’),
pch=c(’*’,’o’))
Matlab note: sometimes you build a graph piece-by-piece, and then want to manually add a legendwhich doesn’t correspond with the order you put things in the plot. You can manually construct a legendby plotting “invisible” things, then building the legend using them. E.g. to make a legend with black starsand solid lines, and red circles and dashed lines: h1=plot(0,0,’k*-’); set(h1,’Visible’, ’off’);
h2=plot(0,0,’k*-’); set(h2,’Visible’, ’off’); legend([h1 h2], ’blah, ’whoa’). Just be sureto choose coordinates for your “invisible” points within the current figure’s axis ranges.
D. Hiebeler, Matlab / R Reference 33
No. Description Matlab R
277 Adding more things to a fig-ure
hold on means everything plottedfrom now on in that figure window isadded to what’s already there. holdoff turns it off. clf clears the figureand turns off hold.
points(...) and lines(...) worklike plot, but add to what’s alreadyin the figure rather than clearing thefigure first. points and lines arebasically identical, just with differentdefault plotting styles. Note: axesare not recalculated/redrawn whenadding more things to a figure.
278 Plot multiple data sets atonce
plot(x,y) where x and y are 2-Dmatrices. Each column of x is plot-ted against the corresponding col-umn of y. If x has only one column,it will be re-used.
matplot(x,y) where x and y are 2-Dmatrices. Each column of x is plottedagainst the corresponding column ofy. If x has only one column, it will bere-used.
279 Plot sin(2x) for x between 7and 18
fplot(’sin(2*x)’, [7 18]) curve(sin(2*x), 7, 18, 200)
makes the plot, by sampling thevalue of the function at 200 valuesbetween 7 and 18 (if you don’tspecify the number of points, 101is the default). You could do thismanually yourself via commandslike tmpx=seq(7,18,len=200);
plot(tmpx, sin(2*tmpx)).280 Plot color image of integer
values in matrix Aimage(A) to use array values asraw indices into colormap, orimagesc(A) to automatically scalevalues first (these both draw row1 of the matrix at the top of theimage); or pcolor(A) (draws row1 of the matrix at the bottom ofthe image). After using pcolor,try the commands shading flat orshading interp.
image(A) (it rotates the matrix 90 de-grees counterclockwise: it draws row1 of A as the left column of the im-age, and column 1 of A as the bottomrow of the image, so the row numberis the x coord and column number isthe y coord). It also rescales colors. Ifyou are using a colormap with k en-tries, but the value k does not appearin A, use image(A,zlim=c(1,k))
to avoid rescaling of colors. Ore.g. image(A,zlim=c(0,k-1)) if youwant values 0 through k−1 to be plot-ted using the k colors.
281 Add colorbar legend to imageplot
colorbar, after using image orpcolor.
Use filled.contour(A) ratherthan image(A), although it “blurs”the data via interpolation, oruse levelplot(A) from the lat-tice package (see item 348 forhow to load packages). To usea colormap with the latter, doe.g. levelplot(A,col.regions=
terrain.colors(100)).282 Set colormap in image colormap(hot). Instead of hot, you
can also use gray, flag, jet (thedefault), cool, bone, copper, pink,hsv, prism. By default, the lengthof the new colormap is the same asthe currently-installed one; use e.g.colormap(hot(256)) to specify thenumber of entries.
image(A,col=terrain.colors(100)).The parameter 100 specifies thelength of the colormap. Othercolormaps are heat.colors(),topo.colors(), and cm.colors().

D. Hiebeler, Matlab / R Reference 34
No. Description Matlab R
283 Build your own colormap us-ing Red/Green/Blue triplets
Use an n × 3 matrix; each rowgives R,G,B intensities between 0and 1. Can use as argument withcolormap. E.g. for 2 colors: mycmap= [0.5 0.8 0.2 ; 0.2 0.2 0.7]
Use a vector of hexadecimal strings,each beginning with ’#’ and givingR,G,B intensities between 00 and FF.E.g. c(’#80CC33’,’#3333B3’); canuse as argument to col= parameterto image. You can build such avector of strings from vectors of Red,Green, and Blue intensities (eachbetween 0 and 1) as follows (for a2-color example): r=c(0.5,0.2);
g=c(0.8,0.2); b=c(0.2,0.7);
mycolors=rgb(r,g,b).
Matlab plotting specifications, for use with plot, fplot, semilogx, semilogy, loglog, etc:Symbol Color Symbol Marker Symbol Linestyle
b blue . point (.) - solid lineg green o circle (◦) : dotted liner red x cross (×) -. dash-dot linec cyan + plus sign (+) -- dashed linem magenta * asterisk (∗)y yellow s square (�)k black d diamond (♦)w white v triangle (down) (▽)
^ triangle (up) (△)< triangle (left) (⊳)> triangle (right) (⊲)p pentragram starh hexagram star
R plotting specifications for col (color), pch (plotting character), and type arguments, for use with plot,matplot, points, and lines:
col Description pch Description type Description’blue’ Blue ’a’ a (similarly for other
characters, but see ’.’below for an exception)
p points
’green’ Green 0 open square l lines’red’ Red 1 open circle b both’cyan’ Cyan 2 triangle point-up c lines part only of “b”
’magenta’ Magenta 3 + (plus) o lines, points overplotted’yellow’ Yellow 4 × (cross) h histogram-like lines’black’ Black 5 diamond s steps’#RRGGBB’ hexadecimal specifica-
tion of Red, Green,Blue
6 triangle point-down S another kind of steps
(Other names) See colors() for list ofavailable color names.
’.’ rectangle of size 0.01inch, 1 pixel, or 1 point(1/72 inch) dependingon device
n no plotting (can be use-ful for setting up axisranges, etc.)
(See table on next pagefor more)

D. Hiebeler, Matlab / R Reference 35
R plotting specifications for lty (line-type) argument, for use with plot, matplot, points, and lines:lty Description0 blank1 solid2 dashed3 dotted4 dotdash5 longdash6 twodash
0 1 2 3 4 5
6 7 8 9 10 11
12 13 14 15 16 17
18 19 20 21 22 23
24 25 AA bb . ##
R plotting characters, i.e. values for pch argument (from the book R Graphics, by Paul Murrell,Chapman & Hall / CRC, 2006)
D. Hiebeler, Matlab / R Reference 36
No. Description Matlab R
284 Divide up a figure windowinto smaller sub-figures
subplot(m,n,k) divides the currentfigure window into an m × n ar-ray of subplots, and draws in sub-plot number k as numbered in “read-ing order,” i.e. left-to-right, top-to-bottom. E.g. subplot(2,3,4) se-lects the first sub-figure in the secondrow of a 2 × 3 array of sub-figures.You can do more complex things,e.g. subplot(5,5,[1 2 6 7]) se-lects the first two subplots in the firstrow, and first two subplots in thesecond row, i.e. gives you a biggersubplot within a 5 × 5 array of sub-plots. (If you that command followedby e.g. subplot(5,5,3) you’ll seewhat’s meant by that.)
There are several ways to do this, e.g.using layout or split.screen, al-though they aren’t quite as friendlyas Matlab ’s. E.g. if you let A =
1 1 21 1 34 5 6
, then layout(A) will
divide the figure into 6 sub-figures:you can imagine the figure divide intoa 3× 3 matrix of smaller blocks; sub-figure 1 will take up the upper-left2×2 portion, and sub-figures 2–6 willtake up smaller portions, according tothe positions of those numbers in thematrix A. Consecutive plotting com-mands will draw into successive sub-figures; there doesn’t seem to be a wayto explicitly specify which sub-figureto draw into next.To use split.screen, you cando e.g. split.screen(c(2,1)) tosplit into a 2 × 1 matrix of sub-figures (numbered 1 and 2). Thensplit.screen(c(1,3),2) splits sub-figure 2 into a 1× 3 matrix of smallersub-figures (numbered 3, 4, and 5).screen(4) will then select sub-figurenumber 4, and subsequent plottingcommands will draw into it.A third way to accomplish this isvia the commands par(mfrow=) orpar(mfcol=) to split the figure win-dow, and par(mfg=) to select whichsub-figure to draw into.Note that the above methods are allincompatible with each other.
285 Force graphics windows toupdate
drawnow (Matlab normally onlyupdates figure windows when ascript/function finishes and returnscontrol to the Matlab prompt, orunder a couple of other circum-stances. This forces it to updatefigure windows to reflect any recentplotting commands.)
R automatically updates graphicswindows even before functions/scriptsfinish executing, so it’s not neces-sary to explictly request it. But notethat some graphics functions (partic-ularly those in the lattice package)don’t display their results when calledfrom scripts or functions; e.g. ratherthan levelplot(...) you need to doprint(levelplot(...)). Such func-tions will automatically display theirplots when called interactively fromthe command prompt.
D. Hiebeler, Matlab / R Reference 37
7.2 Printing/saving graphics
No. Description Matlab R
286 To print/save to a PDF filenamed fname.pdf
print -dpdf fname saves the con-tents of currently active figure win-dow
First do pdf(’fname.pdf’). Then,do various plotting commandsto make your image, as if youwere plotting in a window. Fi-nally, do dev.off() to close/savethe PDF file. To print the con-tents of the active figure win-dow, do dev.copy(device=pdf,
file=’fname.pdf’); dev.off().(But this will not work if you’veturned off the display list viadev.control(displaylist=
’inhibit’).) You can also simply usedev.copy2pdf(file=’fname.pdf’).
287 To print/save to a PostScriptfile fname.ps or fname.eps
print -dps fname for black &white PostScript; print -dpsc
fname for color PostScript; print
-deps fname for black & whiteEncapsulated PostScript; print
-depsc fname for color Encapsu-lated PostScript. The first two saveto fname.ps, while the latter twosave to fname.eps.
postscript(’fname.eps’), followedby your plotting commands, fol-lowed by dev.off() to close/savethe file. Note: you may want touse postscript(’fname.eps’,
horizontal=FALSE) to save your fig-ure in portrait mode rather than thedefault landscape mode. To print thecontents of the active figure window,do dev.copy(device=postscript,
file=’fname.eps’); dev.off().(But this will not work if you’veturned off the display list viadev.control(displaylist=
’inhibit’).) You can also includethe horizontal=FALSE argumentwith dev.copy(). The commanddev.copy2eps(file=’fname.eps’)
also saves in portrait mode.288 To print/save to a JPEG file
fname.jpg with jpeg qual-ity = 90 (higher quality looksbetter but makes the filelarger)
print -djpeg90 fname jpeg(’fname.jpg’,quality=90),followed by your plotting commands,followed by dev.off() to close/savethe file.

D. Hiebeler, Matlab / R Reference 38
7.3 Animating cellular automata / lattice simulations
No. Description Matlab R
289 To display images of cellu-lar automata or other latticesimulations while running inreal time
Repeatedly use either pcolor orimage to display the data. Don’tforget to call drawnow as well, oth-erwise the figure window will not beupdated with each image.
If you simply call image repeatedly,there is a great deal of flicker-ing/flashing. To avoid this, afterdrawing the image for the first timeusing e.g. image(A), from thenon only use image(A,add=TRUE),which avoids redrawing the entireimage (and the associated flicker).However, this will soon consume agreat deal of memory, as all drawnimages are saved in the image buffer.There are two solutions to thatproblem: (1) every k time steps,leave off the “add=TRUE” argumentto flush the image buffer (and getoccasional flickering), where youchoose k to balance the flickeringvs. memory-usage tradeoff; or(2) after drawing the first image,do dev.control(displaylist=
’inhibit’) to prohibit retaining thedata. However, the latter solutionmeans that after the simulation isdone, the figure window will not beredrawn if it is resized, or temporarilyobscured by another window. (Acall to dev.control(displaylist=
’enable’) and then one finalimage(A) at the end of the sim-ulation will re-enable re-drawingafter resizing or obscuring, withoutconsuming extra memory.)

D. Hiebeler, Matlab / R Reference 39
8 Working with files
No. Description Matlab R
290 Create a folder (also knownas a “directory”)
mkdir dirname dir.create(’dirname’)
291 Set/change working directory cd dirname setwd(’dirname’)
292 Get working directory pwd getwd()
293 See list of files in currentworking directory
dir dir()
294 Run commands in file ‘foo.m’or ‘foo.R’ respectively
foo But see item 344 for howto tell Matlab where to look for thefile foo.m.
source(’foo.R’)
295 Read data from text file“data.txt” into matrix A
A=load(’data.txt’) orA=importdata(’data.txt’) Notethat both routines will ignore com-ments (anything on a line followinga “%” character)
A=as.matrix(read.table(
’data.txt’)) This will ignorecomments (anything on a linefollowing a “#” character). To ig-nore comments indicated by “%”,do A=as.matrix(read.table(
’data.txt’, comment.char=’%’))
296 Read data from text file“data.txt” into matrix A,skipping the first s lines of thefile
tmp=importdata(’data.txt’,
’ ’,s);
a=tmp.data
A=as.matrix(read.table(
’data.txt’, skip=s))
297 Write data from matrix Ainto text file “data.txt”
save data.txt A -ascii write(t(A), file=’data.txt’,
ncolumn=dim(A)[2])
298 Save all variables/data in theworkspace to a file foo (withappropriate suffix)
save foo.mat (Matlab recognizesfiles with “.mat” suffix as binary savefiles). Just save with no argumentssaves to matlab.mat
save.image(file=’foo.rda’) (Youmay use whatever filename suffix youlike.) Just save.image() with no ar-guments saves to .RData
299 Reload all variables/datafrom a saved file foo (withappropriate suffix)
load foo.mat. Just load with noarguments tries to load from mat-lab.mat.
load(’foo.rda’)

D. Hiebeler, Matlab / R Reference 40
9 Miscellaneous
9.1 Variables
No. Description Matlab R
300 Assigning to variables x = 5 x <- 5 or x = 5 Note: for compati-bility with S-plus, many people preferthe first form.
301 From within a function, as-sign a value to variable yin the base environment (i.e.the command prompt envi-ronment)
assignin(’base’, ’y’, 7) y <<- 7
302 From within a function, ac-cess the value of variable yin the base environment (i.e.the command prompt envi-ronment)
evalin(’base’, ’y’) get(’y’, envir=globalenv())
Though note that inside a function,if there isn’t a local variable y, thenjust the expression y will look for onein the base environment, but if thereis a local y then that one will be usedinstead.
303 Short list of defined variables who ls()
304 Long list of defined variables whos ls.str()
305 See detailed info about thevariable ab
whos ab str(ab)
306 See detailed info about allvariables with “ab” in theirname
whos *ab* ls.str(pattern=’ab’)
307 Open graphical data editor,to edit the value of variableA (useful for editing values ina matrix, though it works fornon-matrix variables as well)
openvar(A), or double-click on thevariable in the Workspace pane (ifit’s being displayed) of your Mat-
labdesktop
fix(A)
308 Clear one variable clear x rm(x)
309 Clear two variables clear x y rm(x,y)
310 Clear all variables clear all rm(list=ls())
311 See if variable x exists (thecommands given can alsotake more arguments to bemore specific)
exist(’x’) exists(’x’)
312 See what type of object x is class(x) class(x), typeof(x), and mode(x)
give different aspects of the “type” ofx
313 (Variable names) Variable names must begin with aletter, but after that they may con-tain any combination of letters, dig-its, and the underscore character.Names are case-sensitive.
Variable names may contain letters,digits, the period, and the underscorecharacter. They cannot begin with adigit or underscore, or with a periodfollowed by a digit. Names are case-sensitive.
314 Result of last command ans contains the result of the lastcommand which did not assign itsvalue to a variable. E.g. after 2+5;x=3, then ans will contain 7.
.Last.value contains the result ofthe last command, whether or not itsvalue was assigned to a variable. E.g.after 2+5; x=3, then .Last.value willcontain 3.
315 See how many bytes of mem-ory are used to store a givenobject x
tmp = whos(’x’); tmp.bytes object.size(x)

D. Hiebeler, Matlab / R Reference 41
9.2 Strings and Misc.
No. Description Matlab R
316 Line continuation If you want to break up a Matlab
command over more than one line,end all but the last line with threeperiods: “...”. E.g.:x = 3 + ...
4
orx = 3 ...
+ 4
In R, you can spread commands outover multiple lines, and nothing ex-tra is necessary. R will continue read-ing input until the command is com-plete. However, this only works whenthe syntax makes it clear that the firstline was not complete. E.g.:x = 3 +
4
works, butx = 3
+ 4
does not treat the second line as a con-tinuation of the first.
317 Controlling formatting ofoutput
format short g andformat long g are handy; seehelp format
options(digits=6) tells R you’d liketo use 6 digits of precision in values itdisplays (it is only a suggestion, notstrictly followed)
318 Exit the program quit or exit q() or quit()319 Comments % this is a comment # this is a comment
320 Display a string disp(’hi there’) or toomit trailing newline usefprintf(’hi there’)
print(’hi there’) Note: toavoid having double-quotesaround the displayed string, doprint(’hi there’, quote=FALSE)
or print(noquote(’hi there’)).Or use cat(’hi there’). But notethat use of cat in a script won’tput newlines at the end of eachstring. To achieve that, either docat(’hi there\n’) or cat(’hi
there’,fill=TRUE)
321 Display a string containingsingle quotes
disp(’It’’s nice’) orto omit trailing newlinefprintf(’It’’s nice’)
print(’It\’s nice’) orprint("It’s nice") Also seecat in item above.
322 Give prompt and read numer-ical input from user
x = input(’Enter data:’) print(’Enter data:’); x=scan()
However, note that if you are exe-cuting commands from a file (via thesource command or some mechanismin R’s GUI), scan is likely to read itsinput from the following lines of thefile, rather than from the keyboard.Also see cat 2 items above.
323 Give prompt and read char-acter (string) input from user
x = input(’Enter string:’,’s’) x = readline(’Enter string:’)
324 Concatenate strings [’two hal’ ’ves’] paste(’two hal’, ’ves’, sep=’’)
325 Concatenate strings stored ina vector
v={’two ’, ’halves’};
strcat(v{:}) But note thatthis drops trailing spaces onstrings. To avoid that, instead dostrcat([v{:}])
v=c(’two ’, ’halves’);
paste(v, collapse=’’)
326 Extract substring of a string text1=’hi there’;
text2=text(2:6)
text1=’hi there’;
text2=substr(text1,2,6)
D. Hiebeler, Matlab / R Reference 42
No. Description Matlab R
327 Determine whether elementsof a vector are in a set, andgive positions of correspond-ing elements in the set.
x = {’a’, ’aa’, ’bc’, ’c’}; y
= {’da’, ’a’, ’bc’, ’a’, ’bc’,
’aa’}; [tf, loc]=ismember(x,y)
Then loc contains the locations oflast occurrences of elements of xin the set y, and 0 for unmatchedelements.
x = c(’a’, ’aa’, ’bc’, ’c’); y
= c(’da’, ’a’, ’bc’, ’a’, ’bc’,
’aa’); loc=match(x,y) Then loccontains the locations of first oc-curences of elements of x in the sety, and NA for unmatched elements.
328 Find indices of regular ex-pression pattern p in string s
v=regexp(s,p) v=gregexpr(p,s)[[1]] (Thereturned vector also has a“match.length” attribute giv-ing lengths of the matches; thisattribute can be removed viaattributes(v)=NULL.)
329 Perform some commandsonly if the regular expressionp is contained in the string s
if (regexp(s,p)
...commands...
end
if (grepl(p,s)) {
...commands...
}
330 Convert number to string num2str(x) as.character(x)
331 Use sprintf to create aformatted string. Use %d forintegers (“d” stands for “dec-imal”, i.e. base 10), %f forfloating-point numbers, %efor scientific-notation floatingpoint, %g to automaticallychoose %e or %f based onthe value. You can spec-ify field-widths/precisions,e.g. %5d for integers withpadding to 5 spaces, or %.7ffor floating-point with 7digits of precision. There aremany other options too; seethe docs.
x=2; y=3.5;
s=sprintf(’x is %d, y=%g’, ...
x, y)
x=2; y=3.5
s=sprintf(’x is %d, y is %g’,
x, y)
332 Machine epsilon ǫmach, i.e.difference between 1 and thenext largest double-precisionfloating-point number
eps (See help eps for various otherthings eps can give.)
.Machine$double.eps
333 Pause for x seconds pause(x) Sys.sleep(x)
334 Wait for user to press any key pause Don’t know of a way to do this in R,but scan(quiet=TRUE) will wait untilthe user presses the Enter key
335 Produce a beep (or possiblya visual signal, depending onpreferences set)
beep alarm()
336 Measure CPU time used todo some commands
t1=cputime; ...commands... ;
cputime-t1
t1=proc.time(); ...commands...
; (proc.time()-t1)[1]
337 Measure elapsed (“wall-clock”) time used to do somecommands
tic; ...commands... ; toc ort1=clock; ...commands... ;
etime(clock,t1)
t1=proc.time(); ...commands...
; (proc.time()-t1)[3]
338 Print an error message andinterrupt execution
error(’Problem!’) stop(’Problem!’)

D. Hiebeler, Matlab / R Reference 43
No. Description Matlab R
339 Print a warning message warning(’Smaller problem!’) warning(’Smaller problem!’)
340 Putting multiple statementson one line
Separate statements by commas orsemicolons. A semicolon at the endof a statement suppresses display ofthe results (also useful even with justa single statement on a line), while acomma does not.
Separate statements by semicolons.
341 Evaluate contents of a strings as command(s).
eval(s) eval(parse(text=s))
342 Get a command prompt fordebugging, while executing ascript or function. While atthat prompt, you can type ex-pressions to see the values ofvariables, etc.
Insert the command keyboard inyour file. Note that your prompt willchange to K>>. When you are donedebugging and want to continue ex-ecuting the file, type return.
Insert the command browser() inyour file. Note that your prompt willchange toBrowse[1]>. When you aredone debugging and want to continueexecuting the file, either type c or justpress return (i.e. enter a blank line).Note, if you type n, you enter the stepdebugger.
343 Show where a command is which sqrt shows you where the filedefining the sqrt function is (butnote that many basic functions are“built in,” so the Matlab func-tion file is really just a stub con-taining documentation). This is use-ful if a command is doing somethingstrange, e.g. sqrt isn’t working. Ifyou’ve accidentally defined a variablecalled sqrt, then which sqrt willtell you, so you can clear sqrt toerase it so that you can go back tousing the function sqrt.
R does not execute commands directlyfrom files, so there is no equivalentcommand. See item 294 for readingcommand files in R.
344 Query/set the search path. path displays the current search path(the list of places Matlab searchesfor commands you enter). To add adirectory ~/foo to the beginning ofthe search path, do
addpath ~/foo -begin
or to add it to the end of the path,do addpath ~/foo -end (Note: youshould generally add the full pathof a directory, i.e. in Linux or MacOS-X something like ~/foo as aboveor of the form /usr/local/lib/foo,while under Windows it would besomething like C:/foo)
R does not use a search path to lookfor files. See item 294 for reading com-mand files in R.

D. Hiebeler, Matlab / R Reference 44
No. Description Matlab R
345 Startup sequence If a file startup.m exists in thestartup directory for Matlab, itscontents are executed. (See theMatlab docs for how to change thestartup directory.)
If a file .Rprofile exists in the cur-rent directory or the user’s home di-rectory (in that order), its contentsare sourced; saved data from the file.RData (if it exists) are then loaded.If a function .First() has been de-fined, it is then called (so the obviousplace to define this function is in your.Rprofile file).
346 Shutdown sequence Upon typing quit or exit, Matlab
will run the script finish.m if presentsomewhere in the search path.
Upon typing q() or quit(), R will callthe function .Last() if it has been de-fined (one obvious place to define itwould be in the .Rprofile file)
347 Execute a command (such asdate) in the operating sys-tem
!date system(’date’)
348 Install and load a package. Matlab does not have packages. Ithas toolboxes, which you can pur-chase and install. “Contributed”code (written by end users) can sim-ply be downloaded and put in a di-rectory which you then add to Mat-
lab’s path (see item 344 for how toadd things to Matlab’s path).
To install e.g. the deSolve pack-age, you can use the commandinstall.packages(’deSolve’).You then need to load the packagein order to use it, via the commandlibrary(’deSolve’). When runningR again later you’ll need to load thepackage again to use it, but youshould not need to re-install it. Notethat the lattice package is typicallyincluded with binary distributions ofR, so it only needs to be loaded, notinstalled.

D. Hiebeler, Matlab / R Reference 45
10 Spatial Modeling
No. Description Matlab R
349 Take an L×L matrix A of0s and 1s, and “seed” frac-tion p of the 0s (turn theminto 1s), not changing entrieswhich are already 1.
A = (A | (rand(L) < p))*1; A = (A | (matrix(runif(L^2),L)
< p))*1
350 Take an L×L matrix A of 0sand 1s, and “kill” fraction pof the 1s (turn them into 0s),not changing the rest of theentries
A = (A & (rand(L) < 1-p))*1; A = (A & (matrix(runif(L^2),L)
< 1-p))*1
351 Do “wraparound” on a coor-dinate newx that you’ve al-ready calculated. You canreplace newx with x+dx ifyou want to do wraparoundon an offset x coordinate.
mod(newx-1,L)+1 Note: for porta-bility with other languages such asC which handle MOD of negativevalues differently, you may want toget in the habit of instead doingmod(newx-1+L,L)+1
((newx-1) %% L) + 1 Note: forportability with other languages suchas C which handle MOD of nega-tive values differently, you may wantto get in the habit of instead doing((newx-1+L)%%L) + 1
352 Randomly initialize a portionof an array: set fraction p ofsites in rows iy1 through iy2and columns ix1 through ix2equal to 1 (and set the rest ofthe sites in that block equalto zero). Note: this assumeiy1 < iy2 and ix1 < ix2.
dx=ix2-ix1+1; dy=iy2-iy1+1;
A(iy1:iy2,ix1:ix2) = ...
(rand(dy,dx) < p0)*1;
dx=ix2-ix1+1; dy=iy2-iy1+1;
A[iy1:iy2,ix1:ix2] =
(matrix(runif(dy*dx),dy) <
p0)*1
INDEX OF MATLAB COMMANDS AND CONCEPTS 46
Index of MATLAB commands and concepts
’, 87,, 340.*, 86..., 316./, 94.^, 98/, 93:, 12–14;, 340=, 300[, 6–8%, 319&, 196, 197^, 56, 96, 97\, 88, 95!, 347{ 51
abs, 57, 78acos, 62acosh, 64addpath, 344all, 198angle, 79annotation, 274, 275ans, 314any, 199arrows in plots, 274, 275asin, 62asinh, 64assignin, 301atan, 62atanh, 64average, see meanaxis, 266
bar, 255, 257, 258beep, 335binocdf, 240binopdf, 233binornd, 224bitand, 76bitcmp, 76bitor, 76bitshift, 76bitwise logical operations, 76bitxor, 76boolean tests
scalar, 196vector, 197–199
break, 201bsxfun, 28
cd, 291ceil, 68cell, 50cell arrays, 50
extracting elements of, 51cellular automata animation, 289chol, 104circshift, 35class, 312clear, 308–310clf, 277clock, 337close, 250colon, see :colorbar, 281colormap
building your own, 283colormap, 282, 283column vector, 7comments, 319complex numbers, 77–82cond, 108–110conj, 80continue, 201contour, 265conv, 175corr, 127–132cos, 61cosh, 63cov, 125, 126cputime, 336cross, 84csape, 188, 190, 191cubic splines, 189, 190
natural, 188not-a-knot, 192periodic, 191
cumprod, 144cumsum, 140–143cumulative distribution functions
binomial, 240continuous uniform on interval (a, b), 244discrete uniform from 1..n, 245exponential, 242normal, 243Poisson, 241
dataset, 124
INDEX OF MATLAB COMMANDS AND CONCEPTS 47
debugging, 342det, 90diag, 22, 23diff, 146differential equations, see ode45
dir, 293disp, 320, 321doc, 4dot, 83drawnow, 285, 289
echelon form, see matrixeig, 100element-by-element matrix operations, see ma-
trixelse, 195elseif, 195end, 42eps, 332erf, 71erfc, 72erfcinv, 74erfinv, 73error, 338errorbar, 259, 260etime, 337eval, 341evalin, 302exist, 311exit, 318, 346exp, 58expcdf, 242expm, 139exppdf, 235exprnd, 226eye, 21
figure, 246, 247file
restoring workspace from, 299running commands in, 294saving workspace to, 298textreading data from, 295, 296saving data to, 297
find, 169–171finish.m, 346fix, 69fliplr, 36flipud, 37floor, 67fminbnd, 178, 179fminsearch, 180, 181
font size in plots, 270for, 193format, 317fplot, 279fprintf, 320, 321function
multi-variableminimization, 180minimization over first parameter only, 179minimization over only some parameters,
181single-variableminimization, 178
user-written, 203returning multiple values, 204
fzero, 177
gca, 270gcf, 248get, 249Greek letters
in plot labels, 269grid, 271
help, 1–3helpbrowser, 4helpdesk, 4hilb, 48hist, 173, 174, 256, 257hold, 277
identity, see matrixif, 194–196imag, 82image, 280, 289imagesc, 280importdata, 295, 296ind2sub, 38indexing
matrix, 10with a single index, 11
vector, 9input, 322, 323inv, 91inverse, see matrixismember, 327
keyboard, 342
legend, 276length, 159, 161linspace, 15load, 295, 299log, 59
INDEX OF MATLAB COMMANDS AND CONCEPTS 48
log10, 60log2, 60loglog, 254logspace, 16lookfor, 5lu, 101
matrix, 8basis for image/range/column space, 112basis for null space, 111boolean operations on, 170, 171changing shape of, 45Cholesky factorization, 104circular shift, 35condition number, 108–110containing all indentical entries, 20containing all zeros, 19converting row, column to single index, 39converting single-index to row, column, 38cumulative sums of all elements of, 143cumulative sums of columns, 141cumulative sums of rows, 142determinant, 90diagonal, 22echelon form, 89eigenvalues and eigenvectors of, 100equationsolving, 88
exponential of, 139extracting a column of, 30extracting a rectangular piece of, 33extracting a row of, 31extracting specified rows and columns of, 34“gluing” together, 24, 25identity, 21inverse, 91lower-triangular portion of, 46LU factorization, 101minimum of values of, 149minimum value of each column of, 150minimum value of each row of, 151modifying elements given lists of rows and
columns, 40multiplication, 85element-by-element, 86
N -dimensional, 49norm, 107powers of, 97productof all elements, 136of columns of, 137of rows of, 138
QR factorization, 105
rank, 99re-shaping its elements into a vector, 32reverse elements in columns, 37reverse elements in rows, 36Schur decomposition, 103singular value decomposition, 102size of, 156–158, 160, 161sumof all elements, 133of columns of, 134of rows of, 135
trace, 92transpose, 87upper-triangular portion of, 47
max, see min
mean, 113–115median, 123mesh, 265meshgrid, 27, 127, 264min, 148–151, 153–155mind, 152mkdir, 290mnpdf, 239mnrnd, 231, 232mod, 65, 351mode, 122mode of vector of values, 122modulo arithmetic, 65, 351multiple statements on one line, 340
nchoosek, 75norm, 106, 107normcdf, 243normpdf, 236normrnd, 230null, 111num2str, 330numel, 160
ode45, 205–207ones, 18, 20openvar, 307optimization, 178–181orth, 112
path, 344pause, 333, 334pcolor, 265, 280, 289perform some commands with probability p, 217permutation of integers 1..n, 218plot, 251–253, 278
Greek letters in axis labels, 269plot3, 262poisscdf, 241

INDEX OF MATLAB COMMANDS AND CONCEPTS 49
poisspdf, 234poissrnd, 225polar, 261polyfit, 184–186polynomial
least-squares fitted, 185–187multiplication, 175roots of, 176
ppval, 188, 190, 191print, 286–288probability density functions
binomial, 233continuous uniform on interval (a, b), 237discrete uniform from 1..n, 238exponential, 235multinomial, 239normal, 236Poisson, 234
prod, 136–138pwd, 292
qr, 105quad, 182quit, 318, 346
rand, 208–216, 222, 223randi, 212, 213random values
Bernoulli, 214binomial, 224continuous uniform distribution on interval
(a, b), 211, 229continuous uniform distribution on interval
(0,1), 208–210discrete uniform distribution from a..b, 216discrete uniform distribution from 1..k, 213,
227, 228discrete uniform distribution, 212exponential, 226general discrete distribution, 222k unique values sampled from integers 1..n,
219multinomial, 231, 232normal, 230Poisson, 225setting the seed, 223
randperm, 218, 219randsample, 219–221RandStream, 223rank, 99rcond, 108real, 81regexp, 328, 329
repmat, 26reshape, 45, 49rng, 223roots
of general single-variable function, 177polynomial, 176
roots, 176round, 66row vector, 6rref, 89
sampling values from a vector, 220, 221save, 297, 298schur, 103semilogx, 254semilogy, 254set, 270shading, 280sign, 70sin, 61sinh, 63size, 156–158slice, 265sort, 162, 163, 219sortrows, 164–167spline, 192splines, see cubic splinessprintf, 331sqrt, 55stairs, 261standard deviation, see std
startup.m, 345std, 116–118stem, 261stop, 338strcat, 325string
concatenation, 324converting number to, 330pattern matching, 328, 329substrings, 326
struct, 53sub2ind, 39, 40subplot, 284sum, 133–135, 197summary, 124surf, 263, 264surfc, 265surfl, 265svd, 102switch, 202
tan, 61

INDEX OF MATLAB COMMANDS AND CONCEPTS 50
tanh, 63text, 272, 273tic, 337title, 267toc, 337trace, 92transpose, see matrixtrapz, 183tril, 46triu, 47
unidcdf, 245unidpdf, 238unidrnd, 227, 228unifcdf, 244unifpdf, 237unifrnd, 229unique, 172, 173, 257
var, 119–121variables
assigning, 300assigning in base environment from func-
tion, 301evaluating from base environment within func-
tion, 302names, 313
variance, see var
vectorboolean operations on, 168, 169containing all indentical entries, 18containing all zeros, 17counts of binned values in, 174counts of discrete values in, 173cross product, 84cumulative sum of elements of, 140differences between consecutive elements of,
146dot product, 83minimum of values of, 148norm, 106position of first occurance of minimum value
in, 155product of all elements, 136reversing order of elements in, 29size of, 159sum of all elements, 133summary of values in, 124truncating, 41unique values in, 172
warning, 339waterfall, 265which, 343
while, 200who, 303whos, 304–306, 315
xlabel, 268–270
ylabel, 268, 269
zeros, 17, 19

INDEX OF R COMMANDS AND CONCEPTS 51
Index of R commands and concepts
*, 96/, 94:, 12, 13;, 340<-, 300<<-, 301=, 300?, 1, 2[[, 51#, 319%%, 65, 351%x%, 26&, 196, 197^, 56, 98
abs, 57, 78acos, 62acosh, 64alarm, 335all, 198any, 199apply, 36, 37, 118, 120, 121, 137, 150, 151Arg, 79array, 49arrayInd, 38arrows, 274, 275as.character, 330as.formula, 186as.numeric, 173asin, 62asinh, 64atan, 62atanh, 64average, see mean
barplot, 257bitwAnd, 76bitwise logical operations, 76bitwNot, 76bitwOr, 76bitwShiftL, 76bitwShiftR, 76bitwXor, 76boolean tests
scalar, 196vector, 197–199
break, 201browser, 342
c, 6, 7cat, 320
cbind, 24, 40ceiling, 68cellular automata animation, 289chol, 104choose, 75class, 312cloud, 262coef, 184–187colMeans, 114colon, see :colormap
building your own, 283for image, 282
colSums, 134column vector, 7comments, 319complex numbers, 77–82Conj, 80contour, 265convolve, 175cor, 128–132cos, 61cosh, 63cov, 125–127cubic splines, 189, 190, 192
natural, 188periodic, 191
cummax, 145cummin, 145cumprod, 144cumsum, 140–143cumulative distribution functions
binomial, 240continuous uniform on interval (a, b), 244discrete uniform from 1..n, 245exponential, 242normal, 243Poisson, 241
curve, 279
data.frame, 53dbinom, 233debugging, 342det, 90dev.control, 286, 287, 289dev.copy, 286, 287dev.copy2eps, 287dev.copy2pdf, 286dev.cur(), 248dev.list, 249

INDEX OF R COMMANDS AND CONCEPTS 52
dev.new, 246dev.off, 250, 286–288dev.set, 247dexp, 235diag, 21–23diff, 146differential equations, see lsoda
dim, 45, 156–158, 161dir, 293dir.create, 290dmultinom, 239dnorm, 236dpois, 234dunif, 237
echelon form, see matrixeig, 100element-by-element matrix operations, see ma-
trixelse, 195errbar, 259, 260eval, 341exists, 311exp, 58expand, 101expand.grid, 265expm, 139
filerestoring workspace from, 299running commands in, 294saving workspace to, 298textreading data from, 295, 296saving data to, 297
filled.contour, 281.First, 345fix, 307floor, 67font size in plots, 270for, 193function
multi-variableminimization, 180minimization over first parameter only, 179minimization over only some parameters,181
single-variableminimization, 178
user-written, 203returning multiple values, 204
get, 302getwd, 292
globalenv, 302graphics
not being displayed from scripts/functions,285
Greek lettersin plot labels, 269
gregexpr, 328grepl, 329grid, 271
help, 1, 2help.search, 5help.start, 4Hilbert, 48hist, 174, 256, 258
identity, see matrixif, 194–196ifelse, 147Im, 82image, 280, 289indexing
matrix, 10with a single index, 11
vector, 9install.packages, 348integrate, 182inverse, see matrix
jpeg, 288
kappa, 109kronecker, 26
.Last, 346
.Last.value, 314lattice package, 265, 281, 285, 348layout, 284legend, 276length, 41, 42, 159, 160levelplot, 281, 285library, 3, 348lines, 277lists, 50
extracting elements of, 51lm, 184–187lm.fit, 186load, 299log, 59log10, 60log2, 60lower.tri, 47ls, 303ls.str, 304, 306

INDEX OF R COMMANDS AND CONCEPTS 53
lsoda, 205–207
.Machine$double.eps, 332match, 327matplot, 278matrix, 8
basis for image/range/column space, 112basis for null space, 111boolean operations on, 170, 171changing shape of, 45Cholesky factorization, 104circular shift, 35condition number, 108–110containing all indentical entries, 20containing all zeros, 19converting row, column to single index, 39converting single-index to row, column, 38cumulative sums of all elements of, 143cumulative sums of columns, 141cumulative sums of rows, 142determinant, 90diagonal, 22echelon form, 89eigenvalues and eigenvectors of, 100equationsolving, 88
exponential of, 139extracting a column of, 30extracting a rectangular piece of, 33extracting a row of, 31extracting specified rows and columns of, 34“gluing” together, 24, 25identity, 21inverse, 91lower-triangular portion of, 46LU factorization, 101minimum of values of, 149minimum value of each column of, 150minimum value of each row of, 151modifying elements given lists of rows and
columns, 40multiplication, 85element-by-element, 86
N -dimensional, 49norm, 107powers of, 97productof all elements, 136of columns of, 137of rows of, 138
QR factorization, 105rank, 99re-shaping its elements into a vector, 32
reverse elements in columns, 37reverse elements in rows, 36Schur decomposition, 103singular value decomposition, 102size of, 156–158, 160, 161sumof all elements, 133of columns of, 134of rows of, 135
trace, 92transpose, 87upper-triangular portion of, 47
matrix, 8, 19, 20max, see min
mean, 113median, 123min, 148–151, 154Mod, 78mode, 312mode of vector of values, 122modulo arithmetic, 65, 351multiple statements on one line, 340
names, 52, 173ncol, 157next, 201noquote, 320norm, 106, 107nrow, 156null, 111
object.size, 315optim, 180, 181optimization, 178–181optimize, 178, 179options
digits=, 317order, 164–167orth, 112outer, 28, 186, 264
packagesinstalling, 348loading, 348
par, 270par
mfcol=, 284mfrow=, 284
parse, 341paste, 186, 324, 325pbinom, 240pdf, 270, 286perform some commands with probability p, 217permutation of integers 1..n, 218

INDEX OF R COMMANDS AND CONCEPTS 54
persp, 263, 264pexp, 242pie, 261plot, 255, 257plot, 251–254
Greek letters in axis labels, 269main=, 267sub=, 267xlab=, 268, 269xlim=, 266ylab=, 268, 269ylim=, 266
pmin, 152, 153pnorm, 71, 72, 243points, 277polynomial
least-squares fitted, 185–187multiplication, 175roots of, 176
polyreg, 186polyroot, 176postscript, 287ppois, 241print, 285, 320, 321probability density functions
binomial, 233continuous uniform on interval (a, b), 237discrete uniform from 1..n, 238exponential, 235multinomial, 239normal, 236Poisson, 234
proc.time, 336, 337prod, 136–138punif, 244
q, 318, 346qnorm, 73, 74qr, 99, 105quartz, 246quit, 318, 346
random valuesBernoulli, 214binomial, 224continuous uniform distribution on interval
(a, b), 211, 229continuous uniform distribution on interval
(0,1), 208, 210continuous uniform distribution on inteval
(0,1), 209discrete uniform distribution from a..b, 216discrete uniform distribution from 1..k, 213,
227, 228
discrete uniform distribution, 212exponential, 226general discrete distribution, 222k unique values sampled from integers 1..n,
219multinomial, 231, 232normal, 230Poisson, 225setting the seed, 223
rbind, 25rbinom, 224rcond, 108, 110.RData, 345Re, 81read.table, 295, 296readline, 323rep, 17, 18rev, 29rexp, 226rgb, 283rm, 308–310rmultinom, 231, 232rnorm, 230roots
of general single-variable function, 177polynomial, 176
round, 66row vector, 6rowMeans, 115rpois, 225.Rprofile, 345runif, 208–216, 229
sample, 212–216, 218–222, 227, 228sampling values from a vector, 220, 221save.image, 298scan, 322, 334Schur, 103sd, 116–118seq, 14–16set.seed, 223setwd, 291sign, 70sin, 61sinh, 63solve, 88, 91, 93, 95sort, 162, 163source, 294spline, 188, 189, 191splines, see cubic splinessplit.screen, 284sprintf, 331sqrt, 55

INDEX OF R COMMANDS AND CONCEPTS 55
standard deviation, see sd
str, 305string
concatenation, 324converting number to, 330pattern matching, 328, 329substrings, 326
substr, 326sum, 133, 135, 197summary, 124svd, 102switch, 202symbols, 265Sys.sleep, 333system, 347
t, 87table, 122, 173, 257tan, 61tanh, 63text, 272, 273title, 267, 268transpose, see matrixtrunc, 69typeof, 312
unique, 172uniroot, 177upper.tri, 46
var, 119–121, 126variables
assigning, 300assigning in base environment from func-
tion, 301evaluating from base environment within func-
tion, 302names, 313
variance, see var
vectorboolean operations on, 168, 169containing all indentical entries, 18containing all zeros, 17counts of binned values in, 174counts of discrete values in, 173cross product, 84cumulative sum of elements of, 140differences between consecutive elements of,
146dot product, 83minimum of values of, 148norm, 106position of first occurance of minimum value
in, 155
product of all elements, 136reversing order of elements in, 29size of, 159sum of all elements, 133summary of values in, 124truncating, 41unique values in, 172
vector, 50
warning, 339which, 169–171which.max, see which.min
which.min, 155while, 200windows, 246wireframe, 265write, 297
x11, 246