dhh region 7 profile report - state of...
TRANSCRIPT

DHH Region 7

2010 Louisiana2010 Louisiana
Pete Calamari, Interim Assistant Secretary
Caring Communities Youth Survey
Sponsored by
The LCCYS was conducted by
Cecil J. Picard Center for Child Development and Lifelong Learning, University of Louisiana at Lafayette
This report was created by
Bach Harrison, L.L.C.
Paul G. Pastorek, State Superintendent of Education

Table of ContentsIntroductionThe Risk and Protective Factor Model of Prevention Data-Driven Strategic Planning Building a Strategic Prevention Framework Using CCYS Data for Prevention Planning Understanding the Charts in this Report Charts and Tables in this Report:
Risk and Protective Factor Scale Definitions Contacts for Prevention
Drug Use Indicators and Profile Charts Gateway Drug Use Profiles Other Illicit Drug Use Profiles Severe Substance Use Indicators
Antisocial Behavior and Gambling Indicators and Profile Charts Risk & Protective Factor Profiles
Alcohol Causal Variables Additional Data for Prevention Planning
Violence, Bullying, and Mental Health Prevention Indicators
Perceived Parent/Peer Disapproval, Risk Perception and Age of Initiation

4
Introduction
Table 1. Characteristics of ParticipantsRegion 2006 Region 2008 Region 2010 State 2010
Number Percent Number Percent Number Percent Number Percent
Grade 6 5,233 32.7 4,726 31.4 4,680 35.2 33,149 31.4
8 4,669 29.2 4,680 31.1 4,165 31.3 30,316 28.7
10 3,476 21.7 3,040 20.2 2,405 18.1 23,387 22.2
12 2,606 16.3 2,597 17.3 2,040 15.3 18,662 17.7
Gender Male 7,342 46.8 6,915 47.1 6,164 47.6 49,230 47.8
Female 8,355 53.2 7,762 52.9 6,773 52.4 53,822 52.2
Ethnicity* African American 7,072 44.2 6,772 42.1 5,904 41.9 38,871 34.7
Asian 139 0.9 323 2.0 258 1.8 2,273 2.0
Hispanic 342 2.1 622 3.9 596 4.2 5,373 4.8
Native American 597 3.7 626 3.9 601 4.3 3,823 3.4
Pacific Islander 29 0.2 266 1.7 105 0.7 749 0.7
White 7,304 45.7 6,941 43.1 6,161 43.7 56,394 50.4
Other 502 3.1 552 3.4 468 3.3 4,412 3.9
* Beginning in 2008, students were encouraged to mark all applicable ethnic categories.
participated in the survey. Since students are able to select more than one race or ethnicity, the sum of students of individual categories may exceed the total number of students surveyed. Because not all students answer all of the questions, the total count of students by gender (and less frequently, students by ethnicity) may be less than the reported total students.
Comparisons between the number of students completing the survey and the student enrollment in your community and the state are shown on Table 2. The total percentage of students completing the survey and the percentage from each grade are shown in the �Percent� column.
When using the information in this report, please pay attention to the number of students who participated from your community. If 60% or more of the students participated, the report is a good indicator of the levels of substance use, risk, protection, and antisocial behavior. If fewer than 60% participated, consult with your local prevention coordinator or a survey professional before generalizing the results to the entire community.
Coordination and administration of the Louisiana CCYS was a collaborative effort of Department of Health and Hospitals, Office of Behavioral Health (OBH), Addictive Disorders Services; Regional Prevention Coordinators; Department of Education; Cecil J. Picard Center for Child Development and Lifelong Learning, University of Louisiana at Lafayette; and Bach Harrison, L.L.C. For more information about the CCYS or prevention services in Louisiana, please refer to the Contacts for Prevention section at the end of this report.
2010 DHH Region 7 CCYS Summary This report summarizes the findings from the 2010 Louisiana Caring Communities Youth Survey (CCYS), a survey of 6th, 8th, 10th, and 12th grade students conducted in the fall of 2010 and January of 2011. The results for your DHH region are presented along with comparisons to the results for the State of Louisiana. In addition, the report contains important information about the content of the survey, and suggestions and guidelines on how to interpret and use the data for prevention planning.
The Louisiana CCYS was originally designed to assess students� involvement in a specific set of problem behaviors, as well as their exposure to a set of scientifically validated risk and protective factors identified in the Risk and Protective Factor Model of adolescent problem behaviors. These risk and protective factors have been shown to predict the likelihood of academic success, school dropout, substance abuse, violence, and delinquency among youth. As the substance abuse prevention field has evolved, the CCYS has been modified to measure additional substance abuse and other problem behavior variables to provide prevention professionals in Louisiana with important information for understanding their communities. Some examples of these additional variables include the percentage of youth who are in need for alcohol or drug treatment, measures of community norms around alcohol use, and bullying.
Table 1 contains the characteristics of the students who completed the survey from your region and the State of Louisiana. A total of 709 schools across Louisiana
Table 2. Survey Completion RateRegion 2010 State 2010
NumberSurveyed
NumberEnrolled Percent Number
SurveyedNumberEnrolled Percent
Grade4,680 6,665 70.2 33,149 53,554 61.9
4,165 6,413 64.9 30,316 51,202 59.2
2,405 6,170 39.0 23,387 48,594 48.1
2,040 4,713 43.3 18,662 40,175 46.5
Total 13,290 23,961 55.5 105,514 193,525 54.5
12
10
8
6
Table 1 provides demographic information for the survey participants in your community. Table 2 provides enrollment and completion information for your community. Please note that in order to be included in the charts and tables in this report, grades must meet a minimum cutoff of 20 participating students. However, data are presented in Table 2 for all participating grades, even those grades surveyed that did not meet minimum cutoff criteria.
5
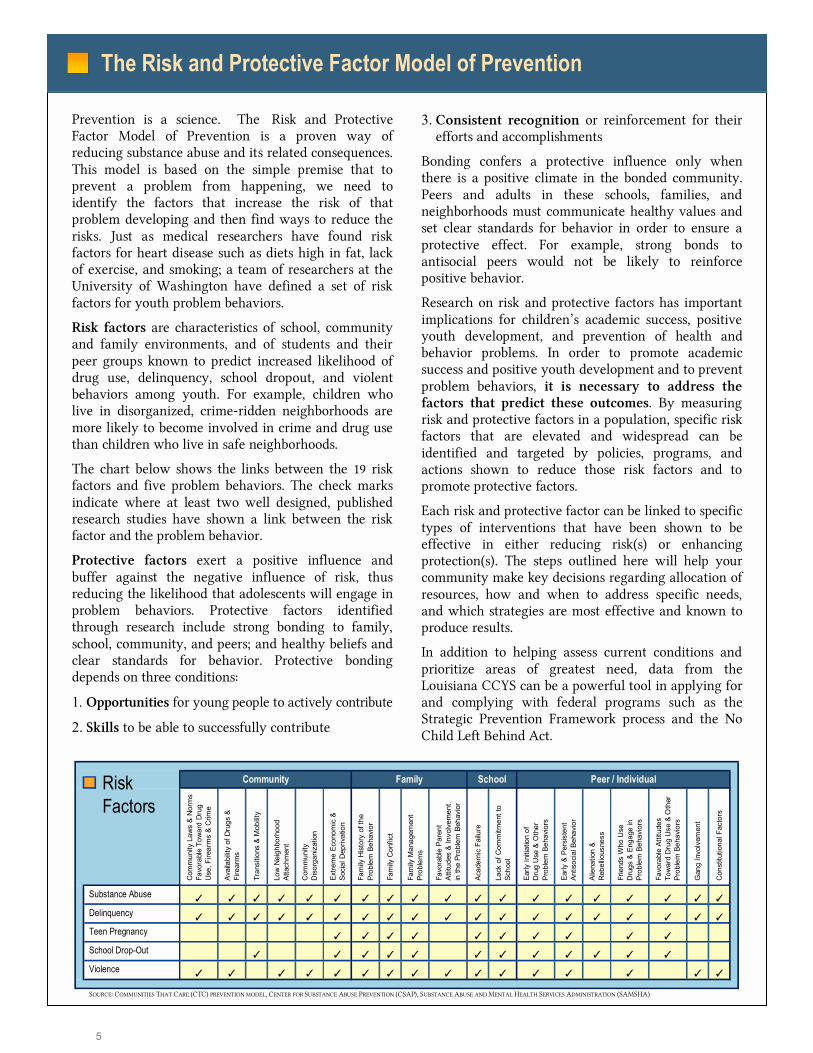
3. Consistent recognition or reinforcement for their efforts and accomplishments
Bonding confers a protective influence only when there is a positive climate in the bonded community. Peers and adults in these schools, families, and neighborhoods must communicate healthy values and set clear standards for behavior in order to ensure a protective effect. For example, strong bonds to antisocial peers would not be likely to reinforce positive behavior.
Research on risk and protective factors has important implications for children�s academic success, positive youth development, and prevention of health and behavior problems. In order to promote academic success and positive youth development and to prevent problem behaviors, it is necessary to address the factors that predict these outcomes. By measuring risk and protective factors in a population, specific risk factors that are elevated and widespread can be identified and targeted by policies, programs, and actions shown to reduce those risk factors and to promote protective factors.
Each risk and protective factor can be linked to specific types of interventions that have been shown to be effective in either reducing risk(s) or enhancing protection(s). The steps outlined here will help your community make key decisions regarding allocation of resources, how and when to address specific needs, and which strategies are most effective and known to produce results.
In addition to helping assess current conditions and prioritize areas of greatest need, data from the Louisiana CCYS can be a powerful tool in applying for and complying with federal programs such as the Strategic Prevention Framework process and the No Child Left Behind Act.
Prevention is a science. The Risk and Protective Factor Model of Prevention is a proven way of reducing substance abuse and its related consequences. This model is based on the simple premise that to prevent a problem from happening, we need to identify the factors that increase the risk of that problem developing and then find ways to reduce the risks. Just as medical researchers have found risk factors for heart disease such as diets high in fat, lack of exercise, and smoking; a team of researchers at the University of Washington have defined a set of risk factors for youth problem behaviors.
Risk factors are characteristics of school, community and family environments, and of students and their peer groups known to predict increased likelihood of drug use, delinquency, school dropout, and violent behaviors among youth. For example, children who live in disorganized, crime-ridden neighborhoods are more likely to become involved in crime and drug use than children who live in safe neighborhoods.
The chart below shows the links between the 19 risk factors and five problem behaviors. The check marks indicate where at least two well designed, published research studies have shown a link between the risk factor and the problem behavior.
Protective factors exert a positive influence andbuffer against the negative influence of risk, thus reducing the likelihood that adolescents will engage in problem behaviors. Protective factors identified through research include strong bonding to family, school, community, and peers; and healthy beliefs and clear standards for behavior. Protective bonding depends on three conditions:
1. Opportunities for young people to actively contribute
2. Skills to be able to successfully contribute
SOURCE: COMMUNITIES THAT CARE (CTC) PREVENTION MODEL, CENTER FOR SUBSTANCE ABUSE PREVENTION (CSAP), SUBSTANCE ABUSE AND MENTAL HEALTH SERVICES ADMINISTRATION (SAMSHA)
The Risk and Protective Factor Model of Prevention
T T T T T T T T T T T T T T T T T T T
T T T T T T T T T T T T T T T T T T T
T T T T T T T T T T
T T T T T T T T T T T T
T T T T T T T T T T T T T T T T
School Drop-Out
Violence
Substance Abuse
Delinquency
Teen Pregnancy
Tra
nsiti
ons
& M
obilit
y
Ava
ilabi
lity
of D
rugs
& F
irear
ms
Fam
ily M
anag
emen
t P
robl
ems
Fam
ily C
onfli
ct
Fam
ily H
isto
ry o
f the
Pro
blem
Beh
avio
r
Ext
rem
e Ec
onom
ic &
Soc
ial D
epriv
atio
n
Lac
k of
Com
mitm
ent t
o S
choo
l
Aca
dem
ic F
ailu
re
Com
mun
ity D
isor
gani
zatio
n
Low
Nei
ghbo
rhoo
d A
ttach
men
t
Frie
nds
Who
Use
Dru
gs &
Eng
age
in P
robl
em B
ehav
iors
Alie
natio
n &
Reb
ellio
usne
ss
Ear
ly &
Per
sist
ent
Ant
isoc
ial B
ehav
ior
Ear
ly In
itiat
ion
of D
rug
Use
& O
ther
Pro
blem
Beh
avio
rs
Risk Factors
Fav
orab
le P
aren
t A
ttitu
des
& In
volv
emen
t in
the
Prob
lem
Beh
avio
r
Community Peer / IndividualSchoolFamily
Com
mun
ity L
aws
& N
orm
s F
avor
able
Tow
ard
Dru
g U
se, F
irear
ms
& C
rime
Con
stitu
tiona
l Fac
tors
Gan
g In
volv
emen
t
Fav
orab
le A
ttitu
des
Tow
ard
Dru
g U
se &
Oth
er P
robl
em B
ehav
iors

6
Why conduct the Louisiana Caring Communities Youth Survey? Data from the CCYS are important for building an understanding of the substance use priorities in your community, and can help your community develop a data driven strategic prevention plan to address the areas of greatest need. The Substance Abuse and Mental Health Services Administration (SAMHSA) Center for Substance Abuse Prevention (CSAP) has emphasized data driven strategic planning guidelines using the Risk and Protective Factor Model, and more recently, the Strategic Prevention Framework (SPF) Model through incentive grants provided to states. These two planning models share much in common and utilize many of the same planning steps and tasks. Specifically, both planning models advocate the collection and use of data to identify needs, resources and community capacity. Based on these data, communities can establish substance abuse prevention priorities to be addressed. Next, both models encourage the implementation of strategically chosen evidence-based programs and interventions to address the identified priorities. Finally, the two models promote the collection of evaluation data to ensure the desired outcomes are achieved. An overview of the basic planning steps and tasks for both the Risk and Protective Factor Model and SPF Model is provided below. 1
Step 1: Profile Population Needs, Resources, and Readiness to Address the Problems and Gaps in Service Delivery � Community Needs Assessment: While planning
prevention services, communities need to understand the factors that cause substance use and abuse in their community. Communities are urged to collect and use multiple data sources, including archival and social indicators, assessment of existing resources, key informant interviews, as well as survey data in order to establish prevention priorities for their community. CSAP encourages states to consider administering a survey to assess adolescent substance use, anti-social behavior, and many of the risk and protective factors that predict adolescent problem behaviors. The results of the CCYS (presented in this Profile Report and in results reported at the State level) are particularly useful in helping to identify the prevention needs in your community.
� Community Resource Assessment: It is likely that existing agencies and programs are already addressing some of the prioritized risk and protective factors. It is important to identify the assets and resources already available in the community and any gaps in services and capacity.
Data-Driven Strategic Planning: Risk and Protective Factor Model
� Community Readiness Assessment: It is very important for states and communities to have the commitment and support of their members and ample resources to implement effective prevention efforts. Therefore, the readiness and capacity of communities and resources to act should also be assessed.
Step 2: Mobilize and/or Build Capacity to Address Needs: Engagement of key stakeholders at the State and community levels is critical to plan and implement successful prevention activities that will be sustained over time. Some of the key tasks to mobilize the state and communities are to work with leaders and stakeholders to build coalitions, provide training, leverage resources, and help sustain prevention activities.
Step 3: Develop a Comprehensive Strategic Plan: States and communities should develop a strategic plan that articulates not only a vision for the prevention activities, but also strategies for organizing and implementing prevention efforts. The strategic plan should be based on documented needs, build on identified resources/strengths, set measurable objectives, and identify how progress will be monitored. Plans should be adjusted with ongoing needs assessment and monitoring activities. The issue of sustainability should be kept in mind throughout each step of planning and implementation.
Stepz4: Implement Evidence-based PreventionPrograms and Infrastructure Development Activities: By understanding risk and protective factors in a population, as well as other causal factors at work in the community, prevention programs can be implemented that will reduce the most influential causes of substance abuse in your community. For example, if academic failure is identified as a prioritized risk factor in a community, then mentoring, tutoring, and increased opportunities and rewards for classroom participation can be provided to improve academic performance. After completing Steps 1, 2, and 3, communities will be able to choose prevention programs that fit the Strategic Framework of the community, match the population served, and are scientifically proven to work.
Step 5: Monitor Process, Evaluate Effectiveness, Sustain Effective Programs/Activities, and Improve or Replace Those That Fail: Finally, ongoing monitoring and evaluation are essential to determine if the outcomes desired are achieved and to assess program effectiveness, assess service delivery quality, identify successes, encourage needed improvement, and promote sustainability of effective policies, programs, and practices. 1 ADAPTED FROM CSAP�S STRATEGIC PREVENTION FRAMEWORK STATE INCENTIVE GRANTS
REQUEST FOR APPLICATION (2008)

7
Prevention Planning: Strategic Prevention Framework (SPF) ModelThe SPF Model of prevention planning is the most current planning model endorsed by CSAP. The SPF planning model, while differing in focus from the Risk and Protective Factor Model, is actually quite similar in regards to process. While the Risk and Protective Factor Model of prevention planning focuses on identifying prevention priorities based on areas of higher risk and lower protection as a means for ultimately reducing substance use and problem behaviors, the SPF Model has a broader focus. Within the SPF, it is important
associated with those con-sequences (e.g., binge drinking
munity cause these problematic substance use (consumption) pat-terns (e.g., community norms that accept binge drinking and/or drinking as driving as acceptable
for prevention professionals to understand what substance use related consequences are problematic in the com-munity (e.g., alcohol related
substance use patterns are
and drinking and driving), and
motor vehicle crashes), what
what factors within the com-
Prevention Planning: Risk and Protective Factor Model
charts provided in this report, will allow you to compare the relative levels of each risk (or protective) factor measured by the survey. In so doing, the data will reveal what risk and protective factors your community should pay most attention to, and which factors are relatively low priorities for prevention resources. Once problematic risk and protective factors have been identified, this information can be used in conjunction with information about the existing prevention resources, and community readiness, to identify the priority risk and priority factors that should be addressed with the prevention resources available to your community.
For more information about prevention planning using the Risk and Protective Factor Framework, contact the State Office of Behavioral Health (OBH), Addictive Disorders Services (see contacts section).
For communities using the Risk and Protective Factor Model of prevention as their guide, the CCYS is an ideal source of information for planning purposes. Because the CCYS was specifically developed as a means for assessing the levels of risk and protective factors within the community, the data are particularly relevant to planning using this model.
When using the Risk and Protective Factor Framework for prevention planning, the focus is primarily on identifying the risk and protective factors that are the most problematic within your community and choosing evidence-based programs to address these priority risk and protective factors. In theory, by reducing areas of high risk and bolstering areas of low protection, substance abuse and other problem behaviors in youth can be reduced. An examination of the Risk Factor Profile and Protective Factor Profile
(SPF MODEL PLANNING INFORMATION CONTINUED ON NEXT PAGE)

8
Prevention Planning: SPF Model (cont'd)
your community�s substance use consumption and consequence priorities, many likely will be useful for planning purposes. Prevention professionals should closely examine the risk and protective factor data available through CCYS to determine which are relevant to understanding the causal influences that lead to the specific substance use consequence priorities in their community.
Additionally, several items have been added to the CCYS to better identify causal factors related to problematic alcohol consumption because the Louisiana State SPF SIG Strategic Plan identified alcohol consumption and consequences as the highest priorities for the state overall. These additional items were added to the CCYS in order to aid those communities identified as alcohol problem hot spots through the state needs assessment process. However, given that alcohol is by far the most widely consumed substance across the entire state, these data should be helpful for other communities that experience high levels of alcohol use and consequences. Data for these items can be found in Table 8 of this report.
behavior). The CCYS is an important source of data for prevention professionals using the SPF Model, as it contains many pieces of information regarding substance use and the causal factors that predict substance use. However, as a result of the broad focus of the SPF, it is highly recommended that preventionprofessionals using the SPF Model for prevention planning obtain other sources of data in addition to the CCYS in developing a z strategic plan for their community. In particular, the CCYS has l imited data regarding substance use z consequences within the community, therefore prevention staff are encouraged to seek consequence related data from both local (e.g., local law enforcement) and state sources (e.g., the State Epidemiological Workgroup).
Among the CCYS data that prevention professionals are likely to find useful in their SPF needs assessment process are substance use trends among youth, and risk and protective factor data relevant to the substance use consequences and consumption patterns identified as problematic in the community. While not all of the risk and protective factors within the Risk and Protective Factor Model are likely to be relevant to
Practical Implications of the Assessment
2. NCLB-approved prevention programs can address not only substance use and antisocial behavior (ASB) outcomes, but also behaviors and attitudes demonstrated to be predictive of the youth problem behaviors. Risk and protective factor data from this report provide valuable information for choosing prevention programs.
3. Periodic evaluations of outcome measures must be conducted to evaluate the efficacy of ongoing programs. This report provides schools and communities the ability to compare past and present substance use and ASB data.
The Safe and Drug Free Schools and Communities section of the No Child Left Behind Act (NCLB) requires that schools and communities use guidelines in choosing and implementing federally funded prevention and intervention programs. The results of the CCYS Survey presented in this report can help your schools and community comply with the NCLB Act in three ways:
1. Programs must be chosen based on objective data about problem behaviors in the communities served. The CCYS reports these data in the substance use and antisocial behavior charts and tables presented on the following pages.

9
6th grd Fav. Attitude to Drugs (Peer/Indiv. Scale) @ 15% (8% > national av.)
10th grd - Rewards for prosocial involvm. (School Domain) 40% (down 5% from 2 yrs ago & 16% below state av.)
12th grd - Drunk/High at School @ 21% ( about same as state, but remains a priority.)
Priority Rate 3Priority Rate 2Priority Rate 1 Sample
30-day SubstanceAbuse
RiskFactors
ProtectiveFactors
AntisocialBehavior
8th grd Binge Drinking@13% (5% above state av.)
Prioritize problems for your area according to the issues you�ve identified. Which can be realistically addressed with the funding available to your community? Which problems fit best with the prevention resources at hand?
Determine the standards and values held within your community. For example: Is it acceptable in your community for a percentage of high school students to drink alcohol regularly as long as that percentage is lower than the overall state rate?
Use these data for planning. Once priorities are established, use data to guide your prevention efforts.
Substance use and antisocial behavior data are excellent tools to raise awareness about the problems and promote dialogue.
Risk and protective factor data can be used toidentify exactly where the community needs to take action.
Promising approaches for any prevention goal are available for through resources listed on the last page of this report. These contacts are a great resource for information about programs that have been proven effective in addressing the risk factors that are high in your community, and improving the protective factors that are low.
What are the numbers telling you? Review the charts and data tables presented in this report. Note your findings as you discuss the following questions.
Which 3-5 risk factors appear to be higher than you would want when compared to the Bach Harrison Norm?
Which 3-5 protective factors appear to be lower than you would want when compared to the Bach Harrison Norm?
Which levels of 30-day drug use are increasing and/or unacceptably high? Which substances are your students using the most? At which grades do you see unacceptable usage levels?
Which antisocial behaviors are increasing and/or unacceptably high? Which behaviors are your students exhibiting the most? At which grades do you see unacceptable behavior levels?
How to identify high priority problem areasOnce you have familiarized yourself with the data, you can begin to identify priorities.
Look across the charts for items that stand out as either much higher or much lower than the others.
Compare your data with statewide, and/or national data. Differences of 5% between local and other data are probably significant.
Using CCYS Data for Prevention Planning

10
There are three major categories of data presented in this report, representing eight types of charts:
Drug use profiles:
1. Gateway drug use charts 2. Other illicit drug use charts 3. Severe substance use indicator charts
Antisocial behavior and gambling profiles:
4. Antisocial behavior (ASB) charts 5. Gambling charts
Risk and protective factors and alcohol causal variables:
6. Risk factor charts 7. Protective factor charts. 8. Alcohol causal variable charts
Drug Use Profiles There are three types of use measured on the drug use charts.
� Gateway drug use measures lifetime and 30-day use rates for alcohol, tobacco, marijuana and inhalants.
� Other illicit drug use measures lifetime and 30-day use rates for a variety of illicit drugs, including cocaine, heroin, and methamphetamine.
� Severe substance use indicators offer estimates of youth in need of alcohol and drug treatment, the percentage of youth indicating having been drunk or high at school, and youth indicating drinking alcohol and driving or reporting riding with a driver who had been drinking alcohol.
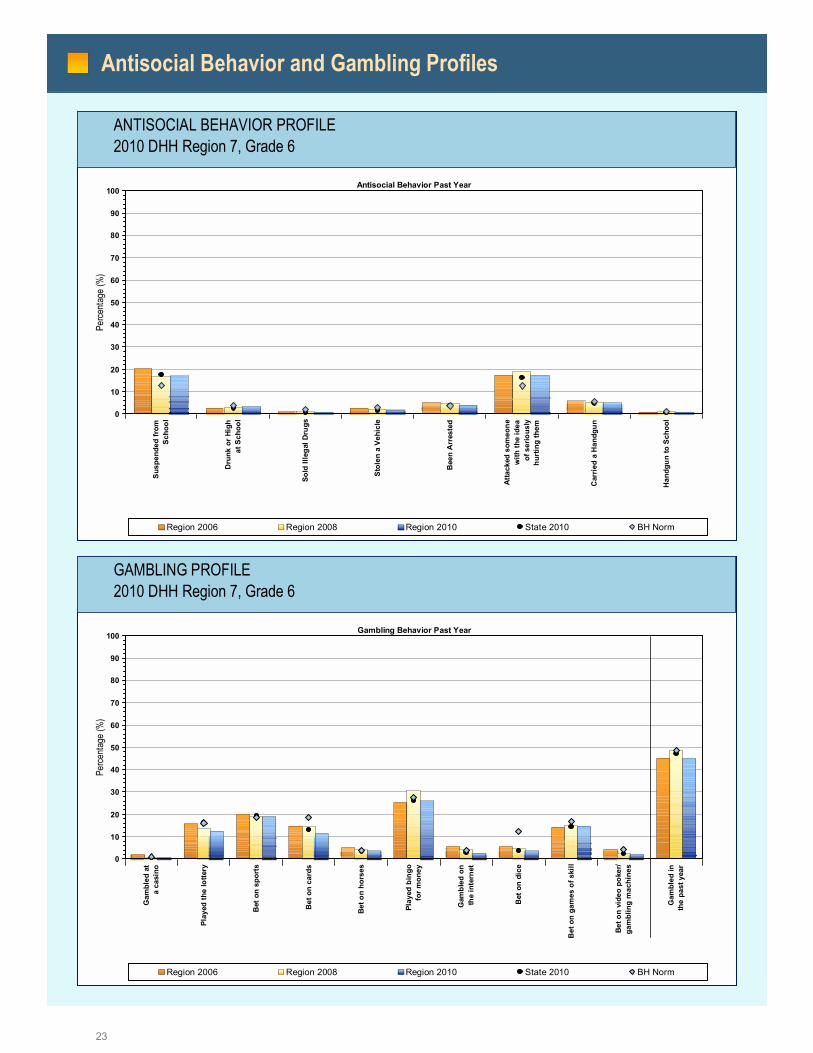
Antisocial Behavior and Gambling Profiles � Antisocial behavior (ASB) profiles show the
percentage of youth who reported antisocial behaviors, including suspension from school, selling illegal drugs, and attacking another person with the intention of doing them serious harm. zzzzzz
� Gambling profiles show the percentage of youth who gambled in the past year, and the specific types of gambling they engaged in.
Risk and Protective Factors and Alcohol Causal Variables � Risk factor charts show the percentage of youth who
are considered �higher risk� across a variety of risk factor scales.
Understanding the Charts in this Report
� Protective factor charts show the percentage of youth who are considered high in protection across a variety of protective factor scales.
� Alcohol causal variable charts show alcohol availability and consumption patterns in the community, and insights into community norms on alcohol related issues.
Data corresponding to each of these categories are also presented in tabular format following each set of charts (tables 3 through 10).
Additional Tables in this Report Additional data useful for prevention planning arefound in Tables 11 and 12.
Table 11 contains prevention indicators from the CCYS relevant to the issues of violence, bullying and mental health.
Table 12 contains information required by communities with Drug Free Communities Grants, such as the perception of the risks of ATOD use, perception of parent and peer disapproval of ATOD use, past 30-day use, and average age of first use.
Understanding the Format of the Charts There are several graphical elements common to all the charts. Understanding the format of the charts and what these elements represent is essential in interpreting the results of the 2010 CCYS survey.
� The Bars on substance use and antisocial behavior charts represent the percentage of students in that grade who reported a given behavior. The bars on the risk and protective factor charts represent the percentage of students whose answers reflect significant risk or protection in that category. zz zz zz zz zz zz zz zz
Each set of differently colored bars represents one of the last three administrations of the CCYS: 2006, 2008, and 2010. By looking at the percentages over time, it is possible to identify trends in substance use and antisocial behavior. By studying the percentage of youth at risk and with protection over time, it is possible to determine whether the percentage of students at risk or with protection is increasing, decreasing, or staying the same. This information is important when deciding which risk and protective factors warrant attention.

11
How to Read the Charts in this Report (cont�d)Understanding the Charts in this Report (cont'd)
to its share of the national population. Bach Harrison analysts then calculated rates for antisocial behavior and for students at risk and with protection. The results appear on the charts as BH Norm. In order to keep the Bach Harrison Norm relevant, it is updated approximately everytwo years as new data become available. zz zz zz zz
A comparison to state-wide and national results provides additional information for your community in determining the relative importance of levels of alcohol, tobacco and other drug (ATOD) use, antisocial behavior, risk, and protection. Information about other students in the state and the nation can be helpful in determining the seriousness of a given level of problem behavior. Scanning across the charts, it is important to observe the factors that differ the most from the Bach Harrison Norm. This is the first step in identifying the levels of risk and protection that are higher or lower than those in other communities. The risk factors that are higher than the Bach Harrison Norm and the protective factors that are lower than the Bach Harrison Norm are probably the factors your community should consider addressing when planning prevention programs.
� Dots and Diamonds provide points of comparison to larger samples. The dots on the charts represent the percentage of all of the youth surveyed across Louisiana who reported substance use, problem behavior, elevated risk, or elevated protection. zz zz
For the 2010 CCYS Survey, there were 105,532participants in grades 6, 8, 10, and 12, out of 193,496enrolled, a participation rate of 54.5%. The fact that over 100,000 students across the state participated in the CCYS make the state dot a good estimate of the rates of ATOD use and levels of risk and protective factors of youth in Louisiana. The survey results provide considerable information for communities to use in planning prevention services. zz zz zz zz zz
The diamonds represent national data from either the Monitoring the Future (MTF) Survey or the Bach Harrison Norm. The Bach Harrison Norm was developed by Bach Harrison L.L.C. to provide states and communities with the ability to compare their results on risk, protection, and antisocial measures with more national measures. Survey participants from eight statewide surveys and five large regional surveys across the nation were combined into a database of approximately 460,000 students. The results were weighted to make the contribution of each state and region proportional

12
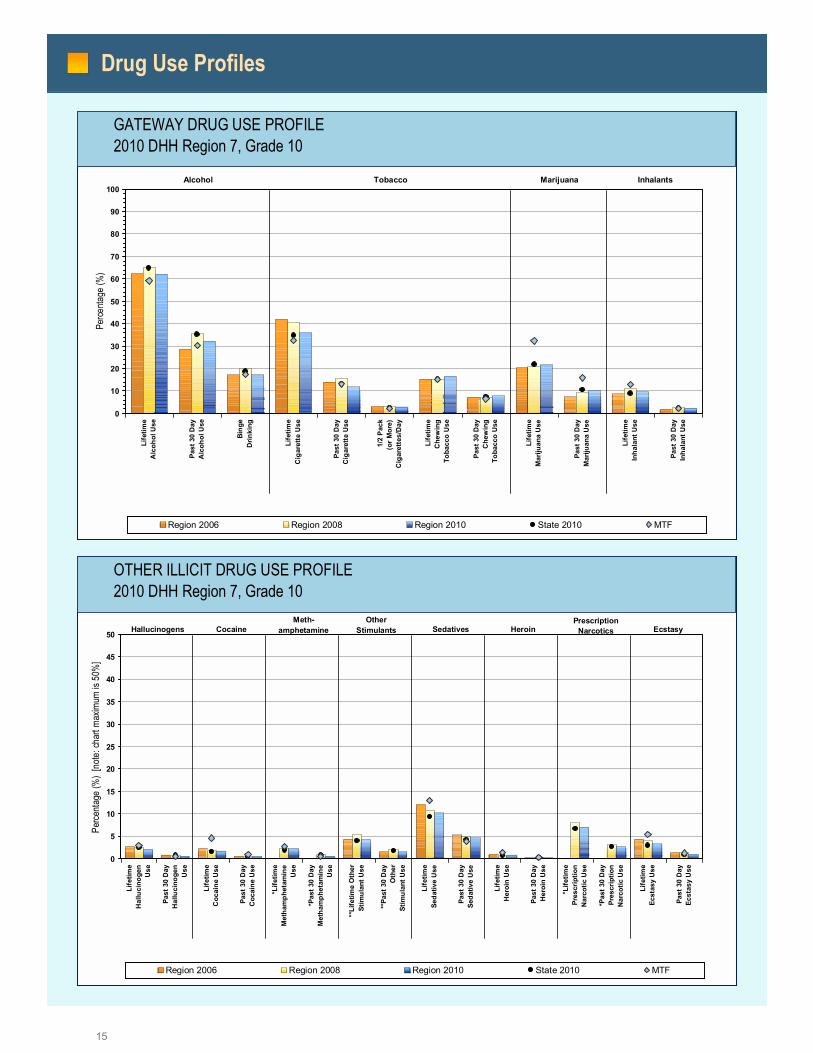
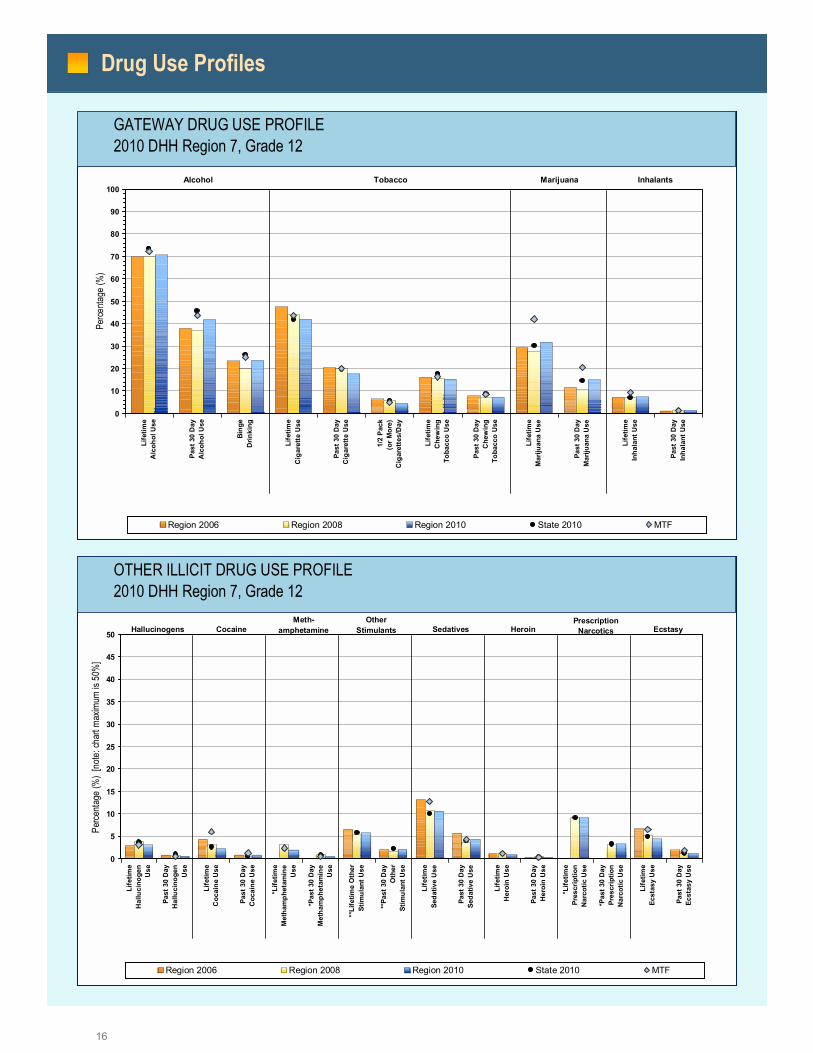
The charts and tables that follow present the substance use rates for your community for 6th, 8th, 10th and 12th
grade students who completed the survey. The first set of substance use charts cover the �Gateway Drugs� most commonly used by youth (alcohol, tobacco, marijuana and inhalants). The second set of substance use chartsinclude a variety of important, but less commonly used illicit drugs such as cocaine, heroin, methamphetamine, and prescription narcotics. Finally, the last set of substance use charts present indicators of severe (or extremely dangerous) substance use, including the youth in need of substance abuse treatment, the percentage indicating they used substances in school, and students involved in drinking and driving.
Each chart represents students from a single grade. The bars on each chart represent the percentage of students in the indicated sample (ie school, parish or region) reporting substance use, and related behaviors or perceptions. The dots on the charts represent the same data for all students of that grade surveyed in the state of Louisiana. The diamonds represent national data included to allow a comparison of your data to a national sample of students, either the Monitoring the Future (MTF) Survey (lifetime use and 30-day use), or the Bach Harrison Norm (heavy use and severe substance use). The Bach Harrison Norm is available for grades 6 through 12 while MTF only surveys grades 8, 10, and 12.
A comparison to state and national results provides additional information for your community in determining the relative importance of levels of ATOD use. Information about other students in the region and the nation can be helpful in determining the seriousness of a given level of problem behavior. Scanning across the charts will help you gain a better understanding of the substance use (consumption) issues affecting your community.
The following definitions and descriptions provide information for the substance use and severe substance use charts that follow.
Drug Use Profiles
� Lifetime use is a measure of the percentage of students who tried the particular substance at least once in their lifetime and is used to show the percentage of students who have had experience with a particular substance.
� 30-day use is a measure of the percentage of students who used the substance at least once in the 30 days prior to taking the survey and is a more sensitive indicator of the level of current use of the substance.
� Heavy use includes binge drinking (having five or more drinks in a row during the two weeks prior to the survey) and smoking one-half a pack or more of cigarettes per day.
� Severe Substance Use indicators include student responses regarding drinking alcohol and driving, riding with a drinking driver, being drunk or high at school, and the need for substance abuse treatment(alcohol, drug, and the total in need of any treatment -alcohol or drug). zzzzzzzzzzzzzzzzzzzzzzzzzzzzzzzz
The need for treatment is defined as students who have used alcohol or drugs on 10 or more occasions in their lifetime and marked at least three of the following items specific to their drug or alcohol use in the past year:
• Spent more time using than intended;
• Neglected some of your usual responsibilities because of use
• Wanted to cut down on use
• Others objected to your use
• Frequently thought about using
• Used alcohol or drugs to relieve feelings such as sadness, anger, or boredom
Students could mark whether these items related to their drug use and/or their alcohol use.

13
Drug Use Profiles
Life
time
Alc
ohol
Use
Past
30
Day
A
lcoh
ol U
se
Bin
ge
Drin
king
Life
time
Ciga
rette
Use
Past
30
Day
Ci
gare
tte U
se
1/2
Pack
(o
r Mor
e)Ci
gare
ttes/
Day
Life
time
Che
win
g To
bacc
o U
se
Past
30
Day
C
hew
ing
Toba
cco
Use
Life
time
Mar
ijuan
a U
se
Past
30
Day
M
ariju
ana
Use
Life
time
Inha
lant
Use
Past
30
Day
In
hala
nt U
se
0
10
20
30
40
50
60
70
80
90
100
Perce
ntag
e (%
)
Region 2006 Region 2008 Region 2010 State 2010 MTF*
GATEWAY DRUG USE PROFILE2010 DHH Region 7, Grade 6
Alcohol InhalantsMarijuanaTobacco
Life
time
Hal
luci
noge
n U
se
Past
30
Day
H
allu
cino
gen
Use
Life
time
Coc
aine
Use
Past
30
Day
C
ocai
ne U
se
*Life
time
Met
ham
phet
amin
eU
se
*Pas
t 30
Day
M
etha
mph
etam
ine
Use
**Li
fetim
e O
ther
St
imul
ant U
se
**Pa
st 3
0 D
ay
Oth
er
Stim
ulan
t Use
Life
time
Seda
tive
Use
Past
30
Day
Seda
tive
Use
Life
time
Her
oin
Use
Past
30
Day
Her
oin
Use
*Life
time
Pres
crip
tion
Nar
cotic
Use
*Pas
t 30
Day
Pr
escr
iptio
n N
arco
tic U
se
Life
time
Ecst
asy
Use
Past
30
Day
Ec
stas
y U
se
0
5
10
15
20
25
30
35
40
45
50
Perce
ntag
e (%
) [n
ote: c
hart
max
imum
is 5
0%]
Region 2006 Region 2008 Region 2010 State 2010 MTF*
OTHER ILLICIT DRUG USE PROFILE2010 DHH Region 7, Grade 6
Hallucinogens CocaineMeth-
amphetamine HeroinPrescription
Narcotics EcstasySedativesOther
Stimulants
Life
time
Alc
ohol
Use
Past
30
Day
A
lcoh
ol U
se
Bin
ge
Drin
king
Life
time
Ciga
rette
Use
Past
30
Day
Ci
gare
tte U
se
1/2
Pack
(o
r Mor
e)Ci
gare
ttes/
Day
Life
time
Che
win
g To
bacc
o U
se
Past
30
Day
C
hew
ing
Toba
cco
Use
Life
time
Mar
ijuan
a U
se
Past
30
Day
M
ariju
ana
Use
Life
time
Inha
lant
Use
Past
30
Day
In
hala
nt U
se
0
10
20
30
40
50
60
70
80
90
100
Perce
ntag
e (%
)
Region 2006 Region 2008 Region 2010 State 2010
GATEWAY DRUG USE PROFILE2010 DHH Region 7, Grade 6
Alcohol InhalantsMarijuanaTobacco
Life
time
Hallu
cino
gen
Use
Past
30
Day
Ha
lluci
noge
n U
se
Life
time
Coc
aine
Use
Past
30
Day
C
ocai
ne U
se
*Life
time
Met
ham
phet
amin
eU
se
*Pas
t 30
Day
M
etha
mph
etam
ine
Use
**Li
fetim
e O
ther
St
imul
ant U
se
**Pa
st 3
0 D
ay
Oth
er
Stim
ulan
t Use
Life
time
Seda
tive
Use
Past
30
Day
Seda
tive
Use
Life
time
Her
oin
Use
Past
30
Day
Her
oin
Use
*Life
time
Pres
crip
tion
Nar
cotic
Use
*Pas
t 30
Day
Pr
escr
iptio
n N
arco
tic U
se
Life
time
Ecst
asy
Use
Past
30
Day
Ec
stas
y U
se
0
5
10
15
20
25
30
35
40
45
50
Perce
ntage
(%)
[not
e: ch
art m
axim
um is
50%
]
Region 2006 Region 2008 Region 2010 State 2010
OTHER ILLICIT DRUG USE PROFILE2010 DHH Region 7, Grade 6
Hallucinogens CocaineMeth-
amphetamine HeroinPrescription
Narcotics EcstasySedativesOther
Stimulants

14
Drug Use Profiles
Life
time
Alc
ohol
Use
Past
30
Day
A
lcoh
ol U
se
Bin
ge
Drin
king
Life
time
Ciga
rette
Use
Past
30
Day
Ci
gare
tte U
se
1/2
Pack
(o
r Mor
e)Ci
gare
ttes/
Day
Life
time
Che
win
g To
bacc
o U
se
Past
30
Day
C
hew
ing
Toba
cco
Use
Life
time
Mar
ijuan
a U
se
Past
30
Day
M
ariju
ana
Use
Life
time
Inha
lant
Use
Past
30
Day
In
hala
nt U
se
0
10
20
30
40
50
60
70
80
90
100
Perce
ntag
e (%
)
Region 2006 Region 2008 Region 2010 State 2010 MTF
GATEWAY DRUG USE PROFILE2010 DHH Region 7, Grade 8
Alcohol InhalantsMarijuanaTobacco
Life
time
Hallu
cino
gen
Use
Past
30
Day
Ha
lluci
noge
n U
se
Life
time
Coc
aine
Use
Past
30
Day
C
ocai
ne U
se
*Life
time
Met
ham
phet
amin
eU
se
*Pas
t 30
Day
M
etha
mph
etam
ine
Use
**Li
fetim
e O
ther
St
imul
ant U
se
**Pa
st 3
0 D
ay
Oth
er
Stim
ulan
t Use
Life
time
Seda
tive
Use
Past
30
Day
Seda
tive
Use
Life
time
Her
oin
Use
Past
30
Day
Her
oin
Use
*Life
time
Pres
crip
tion
Nar
cotic
Use
*Pas
t 30
Day
Pr
escr
iptio
n N
arco
tic U
se
Life
time
Ecst
asy
Use
Past
30
Day
Ec
stas
y U
se
0
5
10
15
20
25
30
35
40
45
50
Perce
ntage
(%)
[not
e: ch
art m
axim
um is
50%
]
Region 2006 Region 2008 Region 2010 State 2010 MTF
OTHER ILLICIT DRUG USE PROFILE2010 DHH Region 7, Grade 8
Hallucinogens CocaineMeth-
amphetamine HeroinPrescription
Narcotics EcstasySedativesOther
Stimulants
15
Drug Use Profiles
Life
time
Alc
ohol
Use
Past
30
Day
A
lcoh
ol U
se
Bing
e D
rinki
ng
Life
time
Cig
aret
te U
se
Past
30
Day
C
igar
ette
Use
1/2
Pack
(o
r Mor
e)C
igar
ette
s/D
ay
Life
time
Che
win
g To
bacc
o U
se
Past
30
Day
C
hew
ing
Toba
cco
Use
Life
time
Mar
ijuan
a U
se
Past
30
Day
M
ariju
ana
Use
Life
time
Inha
lant
Use
Past
30
Day
In
hala
nt U
se
0
10
20
30
40
50
60
70
80
90
100
Perce
ntage
(%)
Region 2006 Region 2008 Region 2010 State 2010 MTF
GATEWAY DRUG USE PROFILE2010 DHH Region 7, Grade 10
Alcohol InhalantsMarijuanaTobacco
Life
time
Hal
luci
noge
n U
se
Past
30
Day
H
allu
cino
gen
Use
Life
time
Coc
aine
Use
Past
30
Day
C
ocai
ne U
se
*Life
time
Met
ham
phet
amin
eU
se
*Pas
t 30
Day
M
etha
mph
etam
ine
Use
**Li
fetim
e O
ther
St
imul
ant U
se
**Pa
st 3
0 D
ay
Oth
er
Stim
ulan
t Use
Life
time
Seda
tive
Use
Past
30
Day
Seda
tive
Use
Life
time
Her
oin
Use
Past
30
Day
Her
oin
Use
*Life
time
Pres
crip
tion
Nar
cotic
Use
*Pas
t 30
Day
Pr
escr
iptio
n N
arco
tic U
se
Life
time
Ecst
asy
Use
Past
30
Day
Ec
stas
y U
se
0
5
10
15
20
25
30
35
40
45
50
Perce
ntag
e (%
) [n
ote: c
hart
max
imum
is 5
0%]
Region 2006 Region 2008 Region 2010 State 2010 MTF
OTHER ILLICIT DRUG USE PROFILE2010 DHH Region 7, Grade 10
Hallucinogens CocaineMeth-
amphetamine HeroinPrescription
Narcotics EcstasySedativesOther
Stimulants
16
Drug Use Profiles
Life
time
Alc
ohol
Use
Past
30
Day
A
lcoh
ol U
se
Bing
e D
rinki
ng
Life
time
Cig
aret
te U
se
Past
30
Day
C
igar
ette
Use
1/2
Pack
(o
r Mor
e)C
igar
ette
s/D
ay
Life
time
Che
win
g To
bacc
o U
se
Past
30
Day
C
hew
ing
Toba
cco
Use
Life
time
Mar
ijuan
a U
se
Past
30
Day
M
ariju
ana
Use
Life
time
Inha
lant
Use
Past
30
Day
In
hala
nt U
se
0
10
20
30
40
50
60
70
80
90
100
Perce
ntage
(%)
Region 2006 Region 2008 Region 2010 State 2010 MTF
GATEWAY DRUG USE PROFILE2010 DHH Region 7, Grade 12
Alcohol InhalantsMarijuanaTobacco
Life
time
Hal
luci
noge
n U
se
Past
30
Day
H
allu
cino
gen
Use
Life
time
Coc
aine
Use
Past
30
Day
C
ocai
ne U
se
*Life
time
Met
ham
phet
amin
eU
se
*Pas
t 30
Day
M
etha
mph
etam
ine
Use
**Li
fetim
e O
ther
St
imul
ant U
se
**Pa
st 3
0 D
ay
Oth
er
Stim
ulan
t Use
Life
time
Seda
tive
Use
Past
30
Day
Seda
tive
Use
Life
time
Her
oin
Use
Past
30
Day
Her
oin
Use
*Life
time
Pres
crip
tion
Nar
cotic
Use
*Pas
t 30
Day
Pr
escr
iptio
n N
arco
tic U
se
Life
time
Ecst
asy
Use
Past
30
Day
Ec
stas
y U
se
0
5
10
15
20
25
30
35
40
45
50
Perce
ntag
e (%
) [n
ote: c
hart
max
imum
is 5
0%]
Region 2006 Region 2008 Region 2010 State 2010 MTF
OTHER ILLICIT DRUG USE PROFILE2010 DHH Region 7, Grade 12
Hallucinogens CocaineMeth-
amphetamine HeroinPrescription
Narcotics EcstasySedativesOther
Stimulants

17
Drug Use Profiles
Table 3. Percentage of Students Who Used Gateway Drugs
Region2006
Region2008
Region2010
State2010
MTF* Region2006
Region2008
Region2010
State2010
MTF Region2006
Region2008
Region2010
State2010
MTF Region2006
Region2008
Region2010
State2010
MTF
Lifetime Alcohol had alcoholic beverages (beer, wine or hard liquor) to drink in your lifetime -- more than just a few sips?
21.7 23.4 20.7 22.8 n/a 47.7 46.7 43.4 46.5 36.6 62.4 65.3 62.1 64.9 59.1 69.9 70.0 70.7 73.5 72.3
Past 30 Day Alcohol
had beer, wine or liquor to drink during the past 30 days? 4.6 8.2 7.7 8.1 n/a 17.9 22.4 19.4 21.8 14.9 28.7 35.8 32.2 35.3 30.4 37.9 37.0 41.9 45.7 43.5
Binge Drinking How many times have you had 5 or more alcoholic drinks in a row in the past 2 weeks? (One or more times)
5.3 4.8 4.9 4.8 n/a 13.1 12.9 11.1 11.4 7.8 17.3 20.0 17.3 18.8 17.5 23.5 19.9 23.7 26.3 25.2
Lifetime Cigarettes Have you ever smoked cigarettes? 15.2 12.7 10.8 10.6 n/a 33.2 29.6 23.7 24.6 20.1 42.1 40.7 36.1 34.9 32.7 47.6 44.3 42.1 41.9 43.6
Past 30 Day Cigarettes
How frequently have you smoked cigarettes during the past 30 days? 3.7 3.1 2.4 2.3 n/a 9.4 9.3 7.9 7.8 6.5 14.1 15.6 11.9 13.1 13.1 20.4 19.9 17.7 19.7 20.1
1/2 Pack of Cigarettes/Day
During the past 30 days, how many cigarettes did you smoke per day? (About one-half pack a day or more)
0.5 0.4 0.3 0.3 n/a 1.7 1.7 1.8 1.4 1.0 3.0 2.9 2.8 2.8 2.4 6.5 5.7 4.6 5.8 5.0
Lifetime Chewing Tobacco
used smokeless tobacco (chew, snuff, plug, dipping tobacco, chewing tobacco) in your lifetime?
6.3 5.9 5.3 4.7 n/a 12.6 12.0 12.0 10.9 9.6 15.4 15.4 16.5 15.3 15.2 16.1 15.6 15.4 17.6 16.3
Past 30 Day Chewing Tobacco
used smokeless tobacco (chew, snuff, plug, dipping tobacco, chewing tobacco) during the past 30 days?
2.2 1.8 1.8 1.7 n/a 5.3 5.5 4.5 4.9 3.7 7.3 7.2 7.9 7.5 6.5 7.9 7.3 7.3 8.8 8.4
Lifetime Marijuana have you used marijuana in your lifetime? 2.3 2.0 1.4 1.8 n/a 10.6 10.3 9.1 10.2 15.7 20.4 20.9 21.7 22.0 32.3 29.3 27.8 31.8 30.3 42.0
Past 30 Day Marijuana
have you used marijuana during the past 30 days? 0.7 0.6 0.6 0.7 n/a 4.4 4.5 4.2 5.1 6.5 7.5 9.3 10.3 10.6 15.9 11.6 10.6 15.0 14.6 20.6
Lifetime Inhalants
sniffed glue, breathed the contents of an aerosol spray can, or inhaled other gases or sprays, in order to get high in your lifetime?
7.5 8.8 7.7 7.6 n/a 11.0 13.5 13.2 11.7 14.9 8.8 11.3 9.8 9.0 12.8 7.3 7.1 7.5 6.9 9.5
Past 30 Day Inhalants
sniffed glue, breathed the contents of an aerosol spray can, or inhaled other gases or sprays, in order to get high during the past 30 days?
2.6 3.7 3.2 2.8 n/a 3.9 5.2 5.1 4.4 3.8 1.8 2.6 2.1 2.2 2.2 1.0 1.3 1.3 1.2 1.2
*
Grade 6 Grade 10
Monitoring the Future does not survey 6th graders.
On how many occasions (if any) have you� (One or more occasions)
Grade 12Grade 8
18
Drug Use Profiles
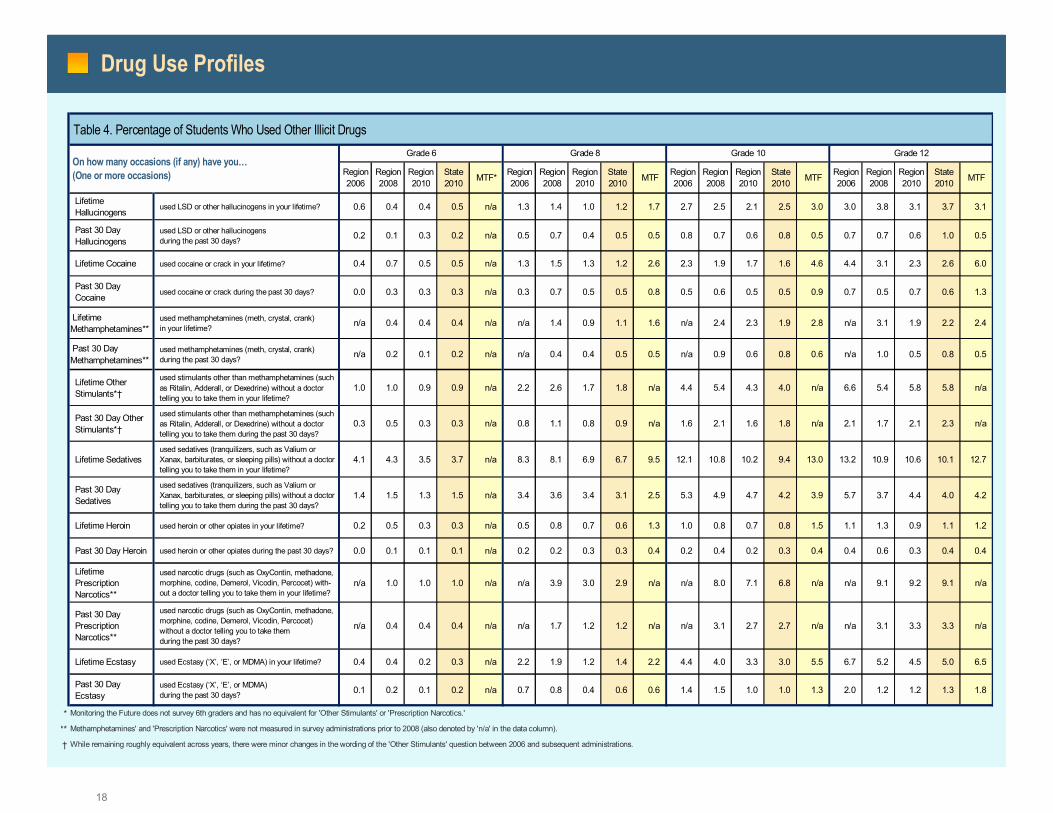
Table 4. Percentage of Students Who Used Other Illicit Drugs
Region2006
Region2008
Region2010
State2010 MTF* Region
2006Region2008
Region2010
State2010 MTF Region
2006Region2008
Region2010
State2010 MTF Region
2006Region2008
Region2010
State2010 MTF
Lifetime Hallucinogens
used LSD or other hallucinogens in your lifetime? 0.6 0.4 0.4 0.5 n/a 1.3 1.4 1.0 1.2 1.7 2.7 2.5 2.1 2.5 3.0 3.0 3.8 3.1 3.7 3.1
Past 30 Day Hallucinogens
used LSD or other hallucinogens during the past 30 days? 0.2 0.1 0.3 0.2 n/a 0.5 0.7 0.4 0.5 0.5 0.8 0.7 0.6 0.8 0.5 0.7 0.7 0.6 1.0 0.5
Lifetime Cocaine used cocaine or crack in your lifetime? 0.4 0.7 0.5 0.5 n/a 1.3 1.5 1.3 1.2 2.6 2.3 1.9 1.7 1.6 4.6 4.4 3.1 2.3 2.6 6.0
Past 30 Day Cocaine
used cocaine or crack during the past 30 days? 0.0 0.3 0.3 0.3 n/a 0.3 0.7 0.5 0.5 0.8 0.5 0.6 0.5 0.5 0.9 0.7 0.5 0.7 0.6 1.3
Lifetime Methamphetamines**
used methamphetamines (meth, crystal, crank) in your lifetime? n/a 0.4 0.4 0.4 n/a n/a 1.4 0.9 1.1 1.6 n/a 2.4 2.3 1.9 2.8 n/a 3.1 1.9 2.2 2.4
Past 30 Day Methamphetamines**
used methamphetamines (meth, crystal, crank) during the past 30 days? n/a 0.2 0.1 0.2 n/a n/a 0.4 0.4 0.5 0.5 n/a 0.9 0.6 0.8 0.6 n/a 1.0 0.5 0.8 0.5
Lifetime Other Stimulants*�
used stimulants other than methamphetamines (such as Ritalin, Adderall, or Dexedrine) without a doctor telling you to take them in your lifetime?
1.0 1.0 0.9 0.9 n/a 2.2 2.6 1.7 1.8 n/a 4.4 5.4 4.3 4.0 n/a 6.6 5.4 5.8 5.8 n/a
Past 30 Day Other Stimulants*�
used stimulants other than methamphetamines (such as Ritalin, Adderall, or Dexedrine) without a doctor telling you to take them during the past 30 days?
0.3 0.5 0.3 0.3 n/a 0.8 1.1 0.8 0.9 n/a 1.6 2.1 1.6 1.8 n/a 2.1 1.7 2.1 2.3 n/a
Lifetime Sedatives used sedatives (tranquilizers, such as Valium or Xanax, barbiturates, or sleeping pills) without a doctor telling you to take them in your lifetime?
4.1 4.3 3.5 3.7 n/a 8.3 8.1 6.9 6.7 9.5 12.1 10.8 10.2 9.4 13.0 13.2 10.9 10.6 10.1 12.7
Past 30 Day Sedatives
used sedatives (tranquilizers, such as Valium or Xanax, barbiturates, or sleeping pills) without a doctor telling you to take them during the past 30 days?
1.4 1.5 1.3 1.5 n/a 3.4 3.6 3.4 3.1 2.5 5.3 4.9 4.7 4.2 3.9 5.7 3.7 4.4 4.0 4.2
Lifetime Heroin used heroin or other opiates in your lifetime? 0.2 0.5 0.3 0.3 n/a 0.5 0.8 0.7 0.6 1.3 1.0 0.8 0.7 0.8 1.5 1.1 1.3 0.9 1.1 1.2
Past 30 Day Heroin used heroin or other opiates during the past 30 days? 0.0 0.1 0.1 0.1 n/a 0.2 0.2 0.3 0.3 0.4 0.2 0.4 0.2 0.3 0.4 0.4 0.6 0.3 0.4 0.4
Lifetime Prescription Narcotics**
used narcotic drugs (such as OxyContin, methadone, morphine, codine, Demerol, Vicodin, Percocet) with- out a doctor telling you to take them in your lifetime?
n/a 1.0 1.0 1.0 n/a n/a 3.9 3.0 2.9 n/a n/a 8.0 7.1 6.8 n/a n/a 9.1 9.2 9.1 n/a
Past 30 Day Prescription Narcotics**
used narcotic drugs (such as OxyContin, methadone, morphine, codine, Demerol, Vicodin, Percocet) without a doctor telling you to take them during the past 30 days?
n/a 0.4 0.4 0.4 n/a n/a 1.7 1.2 1.2 n/a n/a 3.1 2.7 2.7 n/a n/a 3.1 3.3 3.3 n/a
Lifetime Ecstasy used Ecstasy (�X�, �E�, or MDMA) in your lifetime? 0.4 0.4 0.2 0.3 n/a 2.2 1.9 1.2 1.4 2.2 4.4 4.0 3.3 3.0 5.5 6.7 5.2 4.5 5.0 6.5
Past 30 Day Ecstasy
used Ecstasy (�X�, �E�, or MDMA) during the past 30 days? 0.1 0.2 0.1 0.2 n/a 0.7 0.8 0.4 0.6 0.6 1.4 1.5 1.0 1.0 1.3 2.0 1.2 1.2 1.3 1.8
*
**
�
Monitoring the Future does not survey 6th graders and has no equivalent for 'Other Stimulants' or 'Prescription Narcotics.'
On how many occasions (if any) have you� (One or more occasions)
Grade 8 Grade 12Grade 6 Grade 10
While remaining roughly equivalent across years, there were minor changes in the wording of the 'Other Stimulants' question between 2006 and subsequent administrations.
Methamphetamines' and 'Prescription Narcotics' were not measured in survey administrations prior to 2008 (also denoted by 'n/a' in the data column).

19
Drug Use Profiles
Needs Alcohol Treatment
Needs Drug Treatment
Alcohol or Drug Treatment
Drunk or High at school
(Past Year)
DRIVE a car or other vehicle when
you had been drinking alcohol?*
(Past 30 Days)
RIDE in a car or other vehicle driven
by someone who had been drinking alcohol?*
(Past 30 Days)
0
10
20
30
40
50
60
70
80
90
100
Perce
ntag
e (%
)
Region 2008 Region 2010 State 2010 BH Norm
SEVERE SUBSTANCE USE INDICATORS2010 DHH Region 7, Grade 6
Additional Alcohol-Related IndicatorsTreatment Needs
Needs Alcohol Treatment
Needs Drug Treatment
Alcohol or Drug Treatment
Drunk or High at school
(Past Year)
DRIVE a car or other vehicle when
you had been drinking alcohol?*
(Past 30 Days)
RIDE in a car or other vehicle driven
by someone who had been drinking alcohol?*
(Past 30 Days)
0
10
20
30
40
50
60
70
80
90
100
Perce
ntage
(%)
Region 2008 Region 2010 State 2010 BH Norm
SEVERE SUBSTANCE USE INDICATORS2010 DHH Region 7, Grade 8
Additional Alcohol-Related IndicatorsTreatment Needs

20
Drug Use Profiles
Needs Alcohol Treatment
Needs Drug Treatment
Alcohol or Drug Treatment
Drunk or High at school
(Past Year)
DRIVE a car or other vehicle when
you had been drinking alcohol?*
(Past 30 Days)
RIDE in a car or other vehicle driven
by someone who had been drinking alcohol?*
(Past 30 Days)
0
10
20
30
40
50
60
70
80
90
100
Perce
ntag
e (%
)
Region 2008 Region 2010 State 2010 BH Norm
SEVERE SUBSTANCE USE INDICATORS2010 DHH Region 7, Grade 10
Additional Alcohol-Related IndicatorsTreatment Needs
Needs Alcohol Treatment
Needs Drug Treatment
Alcohol or Drug Treatment
Drunk or High at school
(Past Year)
DRIVE a car or other vehicle when
you had been drinking alcohol?*
(Past 30 Days)
RIDE in a car or other vehicle driven
by someone who had been drinking alcohol?*
(Past 30 Days)
0
10
20
30
40
50
60
70
80
90
100
Perce
ntage
(%)
Region 2008 Region 2010 State 2010 BH Norm
SEVERE SUBSTANCE USE INDICATORS2010 DHH Region 7, Grade 12
Additional Alcohol-Related IndicatorsTreatment Needs

21
Drug Use Profiles
Table 5. Severe Substance Use Indicators
Region2008
Region2010
State2010
Region2008
Region2010
State2010
Region2008
Region2010
State2010
Region2008
Region2010
State2010
Needs Alcohol Treatment
Answered "Yes" to at least 3 alcohol treatment questions and has used alcohol on 10 or more occasions
0.5 0.6 0.6 3.9 3.0 3.0 8.4 6.2 7.0 8.9 9.6 9.2
Needs Drug Treatment
Answered "Yes" to at least 3 drug treatment questions and has used alcohol on 10 or more occasions
0.2 0.2 0.2 1.9 1.9 2.0 5.2 5.2 5.1 5.3 6.8 6.3
Needs Alcohol or Drug Treatment
Needs alcohol and/or drug treatment 0.6 0.7 0.7 5.3 4.5 4.5 11.7 9.5 10.4 12.3 13.9 13.3
Drunk or High At School*
How many times in the past year have you been drunk or high at school? 3.1 3.2 2.7 9.9 8.6 8.7 14.3 14.7 13.0 13.2 16.4 15.0
Drinking and Driving
During the past 30 days, how many times did you DRIVE a car or other vehicle when you had been drinking alcohol?
2.6 2.9 2.7 5.9 4.4 4.4 6.4 7.7 6.1 13.7 15.5 15.3
Riding with a Drinking Driver
During the past 30 days, how many times did you RIDE in a car or other vehicle driven by someone who had been drinking alcohol?
23.3 20.8 24.6 32.0 26.7 30.1 32.1 31.6 33.0 30.6 31.4 29.9
* Rates for the 'Drunk or High at School' variable are presented here for comparison with other severe substance use variables. Please note that 2006 data for that question are available in the Antisocial Behavior charts and tables in the following section.
Grade 6 Grade 8 Grade 10 Grade 12

22
The charts and tables that follow present the rates of a variety of antisocial behaviors, as well as gambling behavior among youth in your community who completed the survey. The first set of charts in this section present the percentage of youth who reported engaging in several forms of antisocial behavior (e.g., attacked someone with the idea of seriously hurting them, stolen a vehicle) or related consequences (e.g., been suspended from school, been arrested). The second set of charts in this section highlight the percentage of youth who indicated engaging in a variety of gambling behaviors. Rates of both antisocial behavior and gambling reflect reported behavior in the past year.
As with the substance use profile charts presented earlier, the bars on the following charts represent the percentage of students in that grade who reported the behavior, while the dots on the charts represent the percentage of all of the youth surveyed in Louisiana who reported the problem behavior. The diamonds represent national data from the Bach Harrison Norm and allow a comparison of your antisocial and gambling behavior data to a national sample of students.
Antisocial Behavior and Gambling Profiles
A comparison to state and national results provides additional information for your community in determining the relative importance of levels of antisocial and gambling behavior. Information about other students in the region and the nation can be helpful in determining the seriousness of a given level of problem behavior. Scanning across the charts will help you gain a better understanding of the issues affecting your community.
The following definitions and descriptions provide information for the substance use and severe substance use charts that follow.
� Antisocial behavior (ASB) is a measure of the percentage of students who report any involvement with the eight antisocial behaviors listed in the charts during the past year. In the charts, antisocialbehavior is referred to as ASB.
� Gambling behavior charts show the percentage of students who engaged in each of the 10 types of gambling along with the percentage for any gambling behavior during the past year.
23
Susp
ende
d fr
om
Scho
ol
Dru
nk o
r Hig
h at
Sch
ool
Sold
Ille
gal D
rugs
Stol
en a
Veh
icle
Bee
n A
rres
ted
Atta
cked
som
eone
w
ith th
e id
ea
of s
erio
usly
hu
rting
them
Car
ried
a H
andg
un
Han
dgun
to S
choo
l0
10
20
30
40
50
60
70
80
90
100
Perce
ntag
e (%
)
Region 2006 Region 2008 Region 2010 State 2010 BH Norm
ANTISOCIAL BEHAVIOR PROFILE2010 DHH Region 7, Grade 6
Antisocial Behavior Past Year
Gam
bled
at
a ca
sino
Play
ed th
e lo
ttery
Bet
on
spor
ts
Bet
on
card
s
Bet o
n ho
rses
Play
ed b
ingo
for m
oney
Gam
bled
on
the
inte
rnet
Bet
on
dice
Bet
on
gam
es o
f ski
ll
Bet o
n vi
deo
poke
r/ g
ambl
ing
mac
hine
s
Gam
bled
inth
e pa
st y
ear
0
10
20
30
40
50
60
70
80
90
100
Perce
ntag
e (%
)
Region 2006 Region 2008 Region 2010 State 2010 BH Norm
GAMBLING PROFILE2010 DHH Region 7, Grade 6
Gambling Behavior Past Year
Antisocial Behavior and Gambling Profiles

24
Susp
ende
d fr
om
Scho
ol
Dru
nk o
r Hig
h at
Sch
ool
Sold
Ille
gal D
rugs
Stol
en a
Veh
icle
Bee
n A
rres
ted
Atta
cked
som
eone
w
ith th
e id
ea
of s
erio
usly
hu
rting
them
Car
ried
a H
andg
un
Han
dgun
to S
choo
l0
10
20
30
40
50
60
70
80
90
100
Perce
ntag
e (%
)
Region 2006 Region 2008 Region 2010 State 2010 BH Norm
ANTISOCIAL BEHAVIOR PROFILE2010 DHH Region 7, Grade 8
Antisocial Behavior Past Year
Gam
bled
at
a ca
sino
Play
ed th
e lo
ttery
Bet
on
spor
ts
Bet
on
card
s
Bet o
n ho
rses
Play
ed b
ingo
for m
oney
Gam
bled
on
the
inte
rnet
Bet
on
dice
Bet
on
gam
es o
f ski
ll
Bet o
n vi
deo
poke
r/ g
ambl
ing
mac
hine
s
Gam
bled
inth
e pa
st y
ear
0
10
20
30
40
50
60
70
80
90
100
Perce
ntag
e (%
)
Region 2006 Region 2008 Region 2010 State 2010 BH Norm
GAMBLING PROFILE2010 DHH Region 7, Grade 8
Gambling Behavior Past Year
Antisocial Behavior and Gambling Profiles

25
Antisocial Behavior and Gambling Profiles
Susp
ende
d fr
om
Scho
ol
Dru
nk o
r Hig
h at
Sch
ool
Sold
Ille
gal D
rugs
Stol
en a
Veh
icle
Bee
n A
rres
ted
Atta
cked
som
eone
w
ith th
e id
ea
of s
erio
usly
hu
rting
them
Car
ried
a H
andg
un
Han
dgun
to S
choo
l0
10
20
30
40
50
60
70
80
90
100
Perce
ntag
e (%
)
Region 2006 Region 2008 Region 2010 State 2010 BH Norm
ANTISOCIAL BEHAVIOR PROFILE2010 DHH Region 7, Grade 10
Antisocial Behavior Past Year
Gam
bled
at
a ca
sino
Play
ed th
e lo
ttery
Bet
on
spor
ts
Bet
on
card
s
Bet o
n ho
rses
Play
ed b
ingo
for m
oney
Gam
bled
on
the
inte
rnet
Bet
on
dice
Bet
on
gam
es o
f ski
ll
Bet o
n vi
deo
poke
r/ g
ambl
ing
mac
hine
s
Gam
bled
inth
e pa
st y
ear
0
10
20
30
40
50
60
70
80
90
100
Perce
ntag
e (%
)
Region 2006 Region 2008 Region 2010 State 2010 BH Norm
GAMBLING PROFILE2010 DHH Region 7, Grade 10
Gambling Behavior Past Year

26
Antisocial Behavior and Gambling Profiles
Susp
ende
d fr
om
Scho
ol
Dru
nk o
r Hig
h at
Sch
ool
Sold
Ille
gal D
rugs
Stol
en a
Veh
icle
Bee
n A
rres
ted
Atta
cked
som
eone
w
ith th
e id
ea
of s
erio
usly
hu
rting
them
Car
ried
a H
andg
un
Han
dgun
to S
choo
l0
10
20
30
40
50
60
70
80
90
100
Perce
ntag
e (%
)
Region 2006 Region 2008 Region 2010 State 2010 BH Norm
ANTISOCIAL BEHAVIOR PROFILE2010 DHH Region 7, Grade 12
Antisocial Behavior Past Year
Gam
bled
at
a ca
sino
Play
ed th
e lo
ttery
Bet
on
spor
ts
Bet
on
card
s
Bet o
n ho
rses
Play
ed b
ingo
for m
oney
Gam
bled
on
the
inte
rnet
Bet
on
dice
Bet
on
gam
es o
f ski
ll
Bet o
n vi
deo
poke
r/ g
ambl
ing
mac
hine
s
Gam
bled
inth
e pa
st y
ear
0
10
20
30
40
50
60
70
80
90
100
Perce
ntag
e (%
)
Region 2006 Region 2008 Region 2010 State 2010 BH Norm
GAMBLING PROFILE2010 DHH Region 7, Grade 12
Gambling Behavior Past Year

27
Antisocial Behavior and Gambling Profiles
Table 6. Percentage of Students With Antisocial Behavior
Region2006
Region2008
Region2010
State2010
BH Norm
Region2006
Region2008
Region2010
State2010
BH Norm
Region2006
Region2008
Region2010
State2010
BH Norm
Region2006
Region2008
Region2010
State2010
BH Norm
20.5 17.0 17.1 17.7 13.0 25.4 24.8 19.9 21.7 15.1 18.1 15.7 19.3 17.2 12.6 12.0 14.2 13.8 13.1 9.2
2.6 3.1 3.2 2.7 3.9 9.0 9.9 8.6 8.7 7.5 12.9 14.3 14.7 13.0 15.0 13.5 13.2 16.4 15.0 17.7
1.1 1.1 0.8 0.6 2.1 3.6 3.2 2.2 2.7 2.5 4.4 5.2 5.8 5.6 6.5 6.1 5.3 6.4 6.6 7.8
2.4 2.3 1.8 1.7 2.9 3.1 3.9 2.7 2.7 2.3 3.2 3.0 4.0 2.8 2.6 1.8 2.2 2.0 2.1 1.9
5.3 4.8 4.0 3.7 3.7 7.6 9.6 8.0 7.5 5.2 6.8 7.9 8.4 7.1 6.7 6.4 6.3 7.5 6.2 6.1
17.5 19.2 17.3 16.4 12.7 23.2 24.0 20.7 19.1 16.0 17.6 18.4 20.9 17.0 15.1 14.2 15.0 16.4 13.3 11.9
5.9 5.3 5.0 4.9 5.7 7.5 8.5 5.8 6.0 4.8 6.4 6.5 7.5 5.7 5.2 6.0 7.1 6.6 5.5 5.2
0.9 1.1 0.8 0.6 1.3 1.0 1.3 0.7 0.9 0.8 0.7 0.8 1.4 1.1 0.9 0.9 1.5 1.2 1.3 1.0
Stolen or Tried to Steal a Motor Vehicle
Carried a Handgun to School
Been Arrested
Attacked Someone with the Idea of Seriously Hurting Them
Carried a Handgun
Grade 12
Been Suspended from School
Been Drunk or High at School
Sold Illegal Drugs
How many times in the past year (12 months) have you: (One or more times)
Grade 6 Grade 8 Grade 10

28
Antisocial Behavior and Gambling Profiles
Table 7. Gambling Behavior
Region2006
Region2008
Region2010
State2010
BH Norm
Region2006
Region2008
Region2010
State2010
BH Norm
Region2006
Region2008
Region2010
State2010
BH Norm
Region2006
Region2008
Region2010
State2010
BH Norm
2.0 0.5 0.6 0.8 1.0 2.0 1.2 1.1 1.1 1.8 1.8 1.4 1.4 1.2 2.3 2.2 1.4 1.3 1.5 6.3
15.9 13.6 12.4 16.1 16.1 16.3 15.0 14.1 16.6 24.0 13.5 15.1 11.7 14.2 23.5 10.0 12.7 10.6 11.5 23.9
20.1 19.2 19.1 19.3 18.5 25.9 23.2 22.4 21.8 22.8 24.1 22.9 22.7 20.4 22.5 19.4 20.5 18.5 17.5 20.5
14.8 14.7 11.5 13.2 18.7 21.9 23.4 19.1 19.8 25.8 22.0 22.3 17.9 19.7 27.0 19.9 21.2 17.4 19.0 26.7
5.3 4.1 3.7 3.5 4.0 5.2 4.4 3.7 3.4 4.6 4.2 3.7 3.7 2.8 4.7 4.1 3.4 2.6 2.8 4.6
25.3 30.7 26.1 26.2 27.7 25.2 28.6 24.1 24.3 22.7 18.0 19.4 20.6 18.8 17.7 13.1 15.8 14.0 14.5 14.0
5.8 4.1 2.6 3.0 4.0 5.9 4.7 3.9 3.5 4.5 4.7 3.0 3.1 2.9 4.0 4.3 2.6 3.0 2.7 3.7
5.8 4.7 3.7 3.7 12.3 9.4 9.0 7.1 6.4 12.1 8.4 9.1 8.1 6.8 11.2 8.2 8.0 8.4 6.4 10.0
14.4 14.9 14.8 14.5 16.8 17.7 17.4 16.8 15.2 20.1 15.7 15.5 14.5 13.6 20.5 12.4 14.4 12.3 12.4 18.8
4.5 2.6 2.0 2.4 4.4 3.7 3.0 2.4 2.5 5.7 3.3 2.1 2.2 1.8 5.3 3.1 1.6 2.2 1.8 5.4
45.2 48.8 45.1 47.1 48.7 51.8 54.1 49.6 50.1 55.0 47.5 49.4 46.5 46.5 53.8 41.0 44.6 40.3 41.0 52.6
bet on dice games such as craps?
Total Gambling
Grade 12
gambled at a casino?
played the lottery or lottery scratch-off tickets?
bet on sporting events?
How often have you done the following for money, posessions or anything of value:
Grade 6 Grade 8 Grade 10
played cards for money?
bet on games of personal skill such as pool, darts or bowling?
bet on video poker or other gambling machines?
Any gambing in the past year
bet money on horse races?
played bingo for money or prizes?
gambled on the internet?

29
The charts and tables that follow are intended to provide prevention professionals with data that are helpful in understanding the predictors and causes of substance use in your community. Data in the risk and protective factor profiles will provide you with an overview of the levels of risk and protection in your community. The alcohol causal variables charts present data relevant to several community domain variables associated with increased alcohol consumption.
Risk and Protective Factor Profiles The risk and protective factor charts show the percentage of students at risk and with protection for each of the risk and protective factor scales. The risk and protective factor scales measure specific aspects of a youth�s life experience that are predictive of whether he/she will engage in problem behaviors. Higher risk and lower protection predict a greater likelihood that a youth with engage in problem behaviors, while lower risk and higher protection predict a greater likelihood that youth will not engage in problem behaviors.
The factors are grouped into four domains: community, family, school, and peer/individual. Brief definitions of the risk and protective factors scales are provided in Table 13 at the end of this report. For more information about risk and protective factors, please refer to the resources listed on the last page of this report under Contacts for Prevention.
Consistent with the other charts in this report the barsrepresent your community�s levels of risk and protection, the dots represent the Louisiana state average, and the diamonds represent a national comparison through the Bach Harrison norm, where available. Scanning across the charts, it is important to observe the factors that differ the most from the Bach Harrison Norm. This is the first step in identifying the levels of risk and protection that are higher or lower than those in other communities. The risk factors that
Risk and Protective Factor & Alcohol Causal Variable Profiles
are higher than the Bach Harrison Norm and the protective factors are lower than the Bach Harrison Norm are probably the factors that your community should consider addressing when planning prevention programs. By looking at the percentage of youth at risk and with protection over time, it is possible to determine whether the percentage of students at risk or with protection is increasing, decreasing, or staying the same. This information is important when deciding which risk and protective factors warrant attention.
Along with the risk and protective factor scales, there is a bar for each chart that shows total risk for each risk factor chart and total protection for each protective factor chart. The percentage of youth at high risk (Total Risk) is defined as the percentage of students who have more than a specified number of risk factors operating in their lives. For 6th grade students, it is the percentage of students who have 7 or more risk factors, for 8th grade it is 8 or more risk factors, and for 10th and 12th grades it is 9 or more risk factors. The percentage of youth with high protection is defined as the percentage of 6th grade students who have 4 or more protective factors operating in their lives, and 8th-12th grades students who have 5 or more protective factors operating in their lives.
Alcohol Causal Variable Profiles The Alcohol Causal Variables profiles include the percentage of students who obtained alcohol from specific sources, the percentage who used alcohol in specific places in the past year, and survey data gathered to shed light on the community norms about alcohol use. Percentages for the sources of alcohol and places of use are based upon only those students who reported having used alcohol in the past year. (Sample sizes are noted in the chart legend.)
Student perceptions of community norms are drawn from all students surveyed, regardless of whether they reported any alcohol use.

30
** High Risk youth are defined as the percentage of students who have more than a specified number of risk factors operating in their lives.** (6th grade: 7 or more risk factors, 8th grade: 8 or more risk factors, 10th & 12th grades: 9 or more risk factors.)
Risk and Protective Factor Profiles
Low
Nei
ghbo
rhoo
dA
ttach
men
t
Law
s &
Nor
ms
Favo
r Dru
g U
se
Perc
eive
d A
vaila
bilit
yof
Dru
gs
Perc
eive
d A
vaila
bilit
yof
Han
dgun
s
Poor
Fam
ilyM
anag
emen
t
Fam
ily C
onfli
ct
Fam
ily H
isto
ryof
Ant
isoc
ial B
ehav
ior
Pare
nt A
ttitu
des
Favo
rabl
e to
ASB
Pare
nt A
ttitu
des
Favo
r Dru
g U
se
Aca
dem
ic F
ailu
re
Low
Com
mitm
ent
to S
choo
l
Reb
ellio
usne
ss
Early
Initi
atio
nof
ASB
Early
Initi
atio
nof
Dru
g U
se
Atti
tude
s Fa
vora
ble
to A
SB
Atti
tude
s Fa
vora
ble
to D
rug
Use
Inte
ntio
ns to
Use
Perc
eive
d R
isk
of D
rug
Use
Inte
ract
ion
with
Ant
isoc
ial P
eers
Frie
nd's
Use
of D
rugs
Rew
ards
for A
SB
Dep
ress
ive
Sym
ptom
s
Gan
g In
volv
emen
t
*Stu
dent
s at
Hig
h R
isk
0
10
20
30
40
50
60
70
80
90
100
Perce
ntage
(%) o
f you
th at
risk
Region 2006 Region 2008 Region 2010 State 2010 BH Norm
RISK PROFILE2010 DHH Region 7, Grade 6
Peer/IndividualCommunity Family School Total

31
** High Protection youth are defined as the percentage of students who have more than a specified number of protective factors operating in their lives.** (6th grade: 4 or more protective factors, 8th, 10th & 12th grades: 5 or more protective factors.)
Risk and Protective Factor Profiles
Rew
ards
fo
r Pro
soci
alIn
volv
emen
t
Fam
ily A
ttach
men
t
Opp
ortu
nitie
s fo
r Pro
soci
alIn
volv
emen
t
Rew
ards
fo
r Pro
soci
alIn
volv
emen
t
Opp
ortu
nitie
s fo
r Pro
soci
alIn
volv
emen
t
Rew
ards
fo
r Pro
soci
alIn
volv
emen
t
Bel
ief i
n th
e M
oral
Ord
er
Rel
igio
sity
Inte
ract
ion
with
Pr
osoc
ial P
eers
Pros
ocia
lIn
volv
emen
t
Rew
ards
fo
r Pro
soci
alIn
volv
emen
t
*Stu
dent
s w
ith
Hig
h Pr
otec
tion
0
10
20
30
40
50
60
70
80
90
100
Perce
ntage
(%) o
f you
th wi
th pr
otecti
on
Region 2006 Region 2008 Region 2010 State 2010 BH Norm
PROTECTIVE PROFILE2010 DHH Region 7, Grade 6
Peer/IndividualCommunity Family School Total

32
** High Risk youth are defined as the percentage of students who have more than a specified number of risk factors operating in their lives.** (6th grade: 7 or more risk factors, 8th grade: 8 or more risk factors, 10th & 12th grades: 9 or more risk factors.)
Risk and Protective Factor Profiles
Low
Nei
ghbo
rhoo
dA
ttach
men
t
Law
s &
Nor
ms
Favo
r Dru
g U
se
Perc
eive
d A
vaila
bilit
yof
Dru
gs
Perc
eive
d A
vaila
bilit
yof
Han
dgun
s
Poor
Fam
ilyM
anag
emen
t
Fam
ily C
onfli
ct
Fam
ily H
isto
ryof
Ant
isoc
ial B
ehav
ior
Pare
nt A
ttitu
des
Favo
rabl
e to
ASB
Pare
nt A
ttitu
des
Favo
r Dru
g U
se
Aca
dem
ic F
ailu
re
Low
Com
mitm
ent
to S
choo
l
Reb
ellio
usne
ss
Early
Initi
atio
nof
ASB
Early
Initi
atio
nof
Dru
g U
se
Atti
tude
s Fa
vora
ble
to A
SB
Atti
tude
s Fa
vora
ble
to D
rug
Use
Inte
ntio
ns to
Use
Perc
eive
d R
isk
of D
rug
Use
Inte
ract
ion
with
Ant
isoc
ial P
eers
Frie
nd's
Use
of D
rugs
Rew
ards
for A
SB
Dep
ress
ive
Sym
ptom
s
Gan
g In
volv
emen
t
*Stu
dent
s at
Hig
h R
isk
0
10
20
30
40
50
60
70
80
90
100
Perce
ntage
(%) o
f you
th at
risk
Region 2006 Region 2008 Region 2010 State 2010 BH Norm
RISK PROFILE2010 DHH Region 7, Grade 8
Peer/IndividualCommunity Family School Total
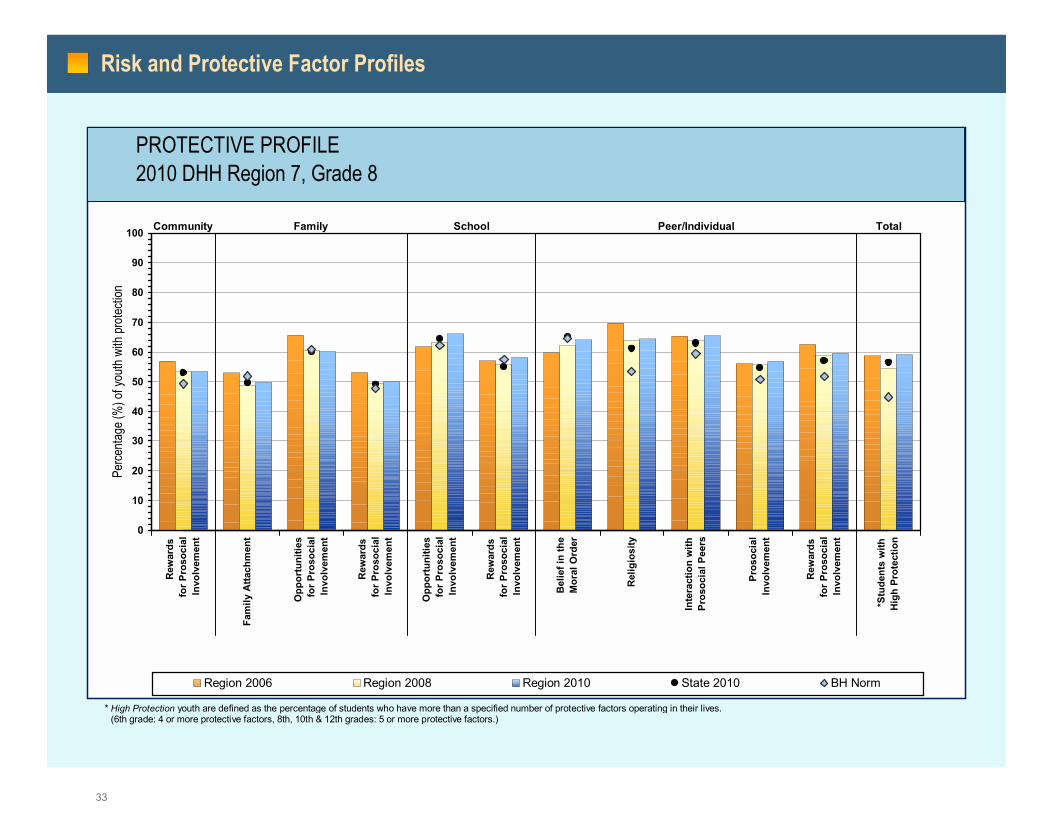
33
** High Protection youth are defined as the percentage of students who have more than a specified number of protective factors operating in their lives.** (6th grade: 4 or more protective factors, 8th, 10th & 12th grades: 5 or more protective factors.)
Risk and Protective Factor Profiles
Rew
ards
fo
r Pro
soci
alIn
volv
emen
t
Fam
ily A
ttach
men
t
Opp
ortu
nitie
s fo
r Pro
soci
alIn
volv
emen
t
Rew
ards
fo
r Pro
soci
alIn
volv
emen
t
Opp
ortu
nitie
s fo
r Pro
soci
alIn
volv
emen
t
Rew
ards
fo
r Pro
soci
alIn
volv
emen
t
Bel
ief i
n th
e M
oral
Ord
er
Rel
igio
sity
Inte
ract
ion
with
Pr
osoc
ial P
eers
Pros
ocia
lIn
volv
emen
t
Rew
ards
fo
r Pro
soci
alIn
volv
emen
t
*Stu
dent
s w
ith
Hig
h Pr
otec
tion
0
10
20
30
40
50
60
70
80
90
100
Perce
ntage
(%) o
f you
th wi
th pr
otecti
on
Region 2006 Region 2008 Region 2010 State 2010 BH Norm
PROTECTIVE PROFILE2010 DHH Region 7, Grade 8
Peer/IndividualCommunity Family School Total
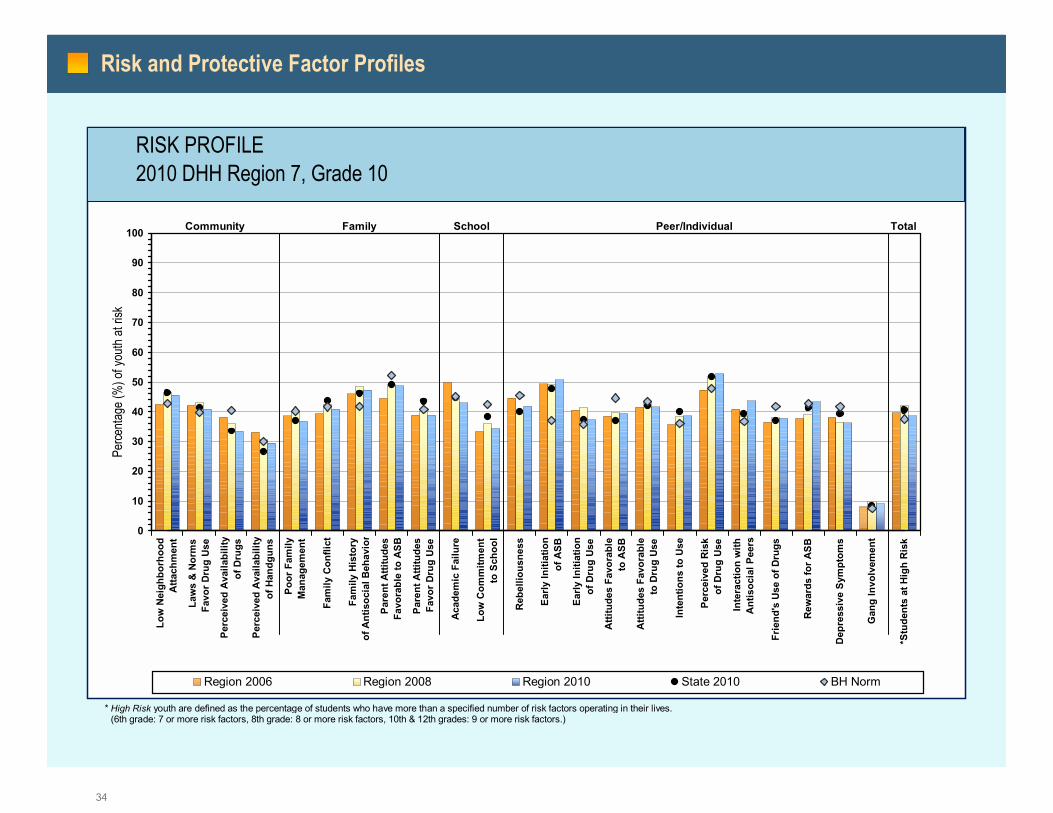
34
** High Risk youth are defined as the percentage of students who have more than a specified number of risk factors operating in their lives.** (6th grade: 7 or more risk factors, 8th grade: 8 or more risk factors, 10th & 12th grades: 9 or more risk factors.)
Risk and Protective Factor Profiles
Low
Nei
ghbo
rhoo
dA
ttach
men
t
Law
s &
Nor
ms
Favo
r Dru
g U
se
Perc
eive
d A
vaila
bilit
yof
Dru
gs
Perc
eive
d A
vaila
bilit
yof
Han
dgun
s
Poor
Fam
ilyM
anag
emen
t
Fam
ily C
onfli
ct
Fam
ily H
isto
ryof
Ant
isoc
ial B
ehav
ior
Pare
nt A
ttitu
des
Favo
rabl
e to
ASB
Pare
nt A
ttitu
des
Favo
r Dru
g U
se
Aca
dem
ic F
ailu
re
Low
Com
mitm
ent
to S
choo
l
Reb
ellio
usne
ss
Early
Initi
atio
nof
ASB
Early
Initi
atio
nof
Dru
g U
se
Atti
tude
s Fa
vora
ble
to A
SB
Atti
tude
s Fa
vora
ble
to D
rug
Use
Inte
ntio
ns to
Use
Perc
eive
d R
isk
of D
rug
Use
Inte
ract
ion
with
Ant
isoc
ial P
eers
Frie
nd's
Use
of D
rugs
Rew
ards
for A
SB
Dep
ress
ive
Sym
ptom
s
Gan
g In
volv
emen
t
*Stu
dent
s at
Hig
h R
isk
0
10
20
30
40
50
60
70
80
90
100
Perce
ntage
(%) o
f you
th at
risk
Region 2006 Region 2008 Region 2010 State 2010 BH Norm
RISK PROFILE2010 DHH Region 7, Grade 10
Peer/IndividualCommunity Family School Total

35
** High Protection youth are defined as the percentage of students who have more than a specified number of protective factors operating in their lives.** (6th grade: 4 or more protective factors, 8th, 10th & 12th grades: 5 or more protective factors.)
Risk and Protective Factor Profiles
Rew
ards
fo
r Pro
soci
alIn
volv
emen
t
Fam
ily A
ttach
men
t
Opp
ortu
nitie
s fo
r Pro
soci
alIn
volv
emen
t
Rew
ards
fo
r Pro
soci
alIn
volv
emen
t
Opp
ortu
nitie
s fo
r Pro
soci
alIn
volv
emen
t
Rew
ards
fo
r Pro
soci
alIn
volv
emen
t
Bel
ief i
n th
e M
oral
Ord
er
Rel
igio
sity
Inte
ract
ion
with
Pr
osoc
ial P
eers
Pros
ocia
lIn
volv
emen
t
Rew
ards
fo
r Pro
soci
alIn
volv
emen
t
*Stu
dent
s w
ith
Hig
h Pr
otec
tion
0
10
20
30
40
50
60
70
80
90
100
Perce
ntage
(%) o
f you
th wi
th pr
otecti
on
Region 2006 Region 2008 Region 2010 State 2010 BH Norm
PROTECTIVE PROFILE2010 DHH Region 7, Grade 10
Peer/IndividualCommunity Family School Total

36
** High Risk youth are defined as the percentage of students who have more than a specified number of risk factors operating in their lives.** (6th grade: 7 or more risk factors, 8th grade: 8 or more risk factors, 10th & 12th grades: 9 or more risk factors.)
Risk and Protective Factor Profiles
Low
Nei
ghbo
rhoo
dA
ttach
men
t
Law
s &
Nor
ms
Favo
r Dru
g U
se
Perc
eive
d A
vaila
bilit
yof
Dru
gs
Perc
eive
d A
vaila
bilit
yof
Han
dgun
s
Poor
Fam
ilyM
anag
emen
t
Fam
ily C
onfli
ct
Fam
ily H
isto
ryof
Ant
isoc
ial B
ehav
ior
Pare
nt A
ttitu
des
Favo
rabl
e to
ASB
Pare
nt A
ttitu
des
Favo
r Dru
g U
se
Aca
dem
ic F
ailu
re
Low
Com
mitm
ent
to S
choo
l
Reb
ellio
usne
ss
Early
Initi
atio
nof
ASB
Early
Initi
atio
nof
Dru
g U
se
Atti
tude
s Fa
vora
ble
to A
SB
Atti
tude
s Fa
vora
ble
to D
rug
Use
Inte
ntio
ns to
Use
Perc
eive
d R
isk
of D
rug
Use
Inte
ract
ion
with
Ant
isoc
ial P
eers
Frie
nd's
Use
of D
rugs
Rew
ards
for A
SB
Dep
ress
ive
Sym
ptom
s
Gan
g In
volv
emen
t
*Stu
dent
s at
Hig
h R
isk
0
10
20
30
40
50
60
70
80
90
100
Perce
ntage
(%) o
f you
th at
risk
Region 2006 Region 2008 Region 2010 State 2010 BH Norm
RISK PROFILE2010 DHH Region 7, Grade 12
Peer/IndividualCommunity Family School Total

37
** High Protection youth are defined as the percentage of students who have more than a specified number of protective factors operating in their lives.** (6th grade: 4 or more protective factors, 8th, 10th & 12th grades: 5 or more protective factors.)
Risk and Protective Factor Profiles
Rew
ards
fo
r Pro
soci
alIn
volv
emen
t
Fam
ily A
ttach
men
t
Opp
ortu
nitie
s fo
r Pro
soci
alIn
volv
emen
t
Rew
ards
fo
r Pro
soci
alIn
volv
emen
t
Opp
ortu
nitie
s fo
r Pro
soci
alIn
volv
emen
t
Rew
ards
fo
r Pro
soci
alIn
volv
emen
t
Bel
ief i
n th
e M
oral
Ord
er
Rel
igio
sity
Inte
ract
ion
with
Pr
osoc
ial P
eers
Pros
ocia
lIn
volv
emen
t
Rew
ards
fo
r Pro
soci
alIn
volv
emen
t
*Stu
dent
s w
ith
Hig
h Pr
otec
tion
0
10
20
30
40
50
60
70
80
90
100
Perce
ntage
(%) o
f you
th wi
th pr
otecti
on
Region 2006 Region 2008 Region 2010 State 2010 BH Norm
PROTECTIVE PROFILE2010 DHH Region 7, Grade 12
Peer/IndividualCommunity Family School Total
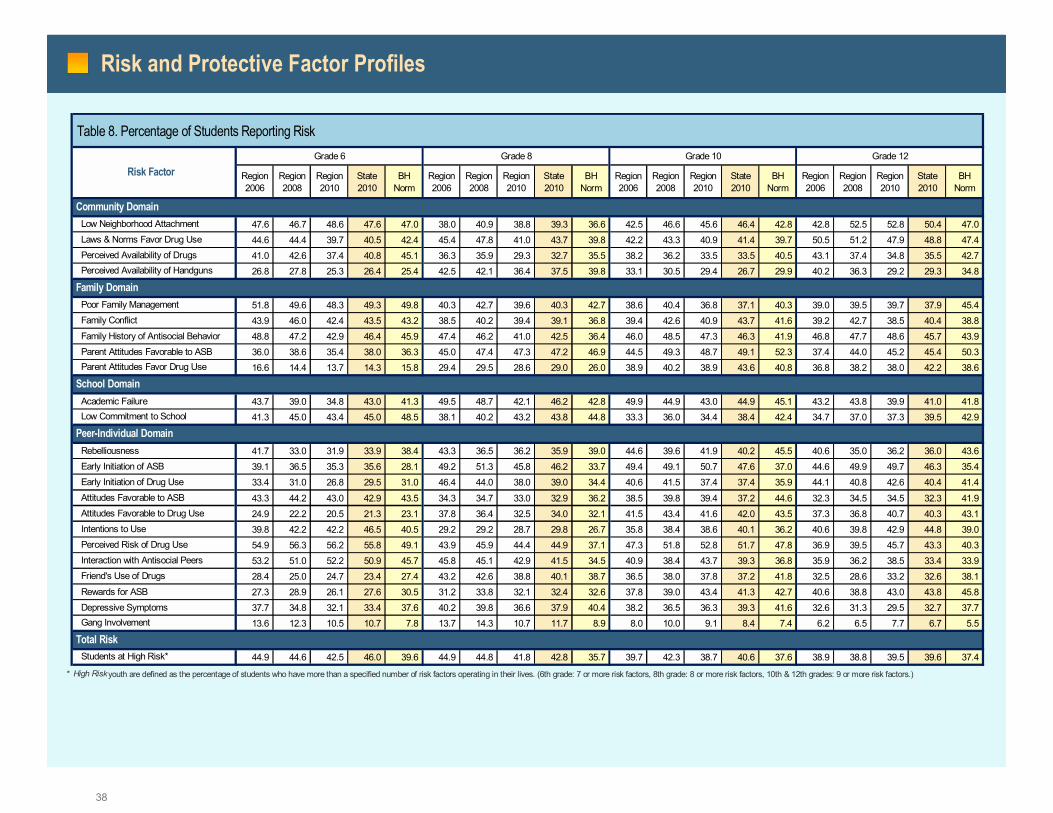
38
Risk and Protective Factor Profiles
Table 8. Percentage of Students Reporting Risk
Region2006
Region2008
Region2010
State2010
BH Norm
Region2006
Region2008
Region2010
State2010
BH Norm
Region2006
Region2008
Region2010
State2010
BH Norm
Region2006
Region2008
Region2010
State2010
BH Norm
47.6 46.7 48.6 47.6 47.0 38.0 40.9 38.8 39.3 36.6 42.5 46.6 45.6 46.4 42.8 42.8 52.5 52.8 50.4 47.0 44.6 44.4 39.7 40.5 42.4 45.4 47.8 41.0 43.7 39.8 42.2 43.3 40.9 41.4 39.7 50.5 51.2 47.9 48.8 47.4 41.0 42.6 37.4 40.8 45.1 36.3 35.9 29.3 32.7 35.5 38.2 36.2 33.5 33.5 40.5 43.1 37.4 34.8 35.5 42.7 26.8 27.8 25.3 26.4 25.4 42.5 42.1 36.4 37.5 39.8 33.1 30.5 29.4 26.7 29.9 40.2 36.3 29.2 29.3 34.8
51.8 49.6 48.3 49.3 49.8 40.3 42.7 39.6 40.3 42.7 38.6 40.4 36.8 37.1 40.3 39.0 39.5 39.7 37.9 45.4 43.9 46.0 42.4 43.5 43.2 38.5 40.2 39.4 39.1 36.8 39.4 42.6 40.9 43.7 41.6 39.2 42.7 38.5 40.4 38.8 48.8 47.2 42.9 46.4 45.9 47.4 46.2 41.0 42.5 36.4 46.0 48.5 47.3 46.3 41.9 46.8 47.7 48.6 45.7 43.9 36.0 38.6 35.4 38.0 36.3 45.0 47.4 47.3 47.2 46.9 44.5 49.3 48.7 49.1 52.3 37.4 44.0 45.2 45.4 50.3 16.6 14.4 13.7 14.3 15.8 29.4 29.5 28.6 29.0 26.0 38.9 40.2 38.9 43.6 40.8 36.8 38.2 38.0 42.2 38.6
43.7 39.0 34.8 43.0 41.3 49.5 48.7 42.1 46.2 42.8 49.9 44.9 43.0 44.9 45.1 43.2 43.8 39.9 41.0 41.8 41.3 45.0 43.4 45.0 48.5 38.1 40.2 43.2 43.8 44.8 33.3 36.0 34.4 38.4 42.4 34.7 37.0 37.3 39.5 42.9
41.7 33.0 31.9 33.9 38.4 43.3 36.5 36.2 35.9 39.0 44.6 39.6 41.9 40.2 45.5 40.6 35.0 36.2 36.0 43.6 39.1 36.5 35.3 35.6 28.1 49.2 51.3 45.8 46.2 33.7 49.4 49.1 50.7 47.6 37.0 44.6 49.9 49.7 46.3 35.4 33.4 31.0 26.8 29.5 31.0 46.4 44.0 38.0 39.0 34.4 40.6 41.5 37.4 37.4 35.9 44.1 40.8 42.6 40.4 41.4
43.3 44.2 43.0 42.9 43.5 34.3 34.7 33.0 32.9 36.2 38.5 39.8 39.4 37.2 44.6 32.3 34.5 34.5 32.3 41.9 24.9 22.2 20.5 21.3 23.1 37.8 36.4 32.5 34.0 32.1 41.5 43.4 41.6 42.0 43.5 37.3 36.8 40.7 40.3 43.1 39.8 42.2 42.2 46.5 40.5 29.2 29.2 28.7 29.8 26.7 35.8 38.4 38.6 40.1 36.2 40.6 39.8 42.9 44.8 39.0 54.9 56.3 56.2 55.8 49.1 43.9 45.9 44.4 44.9 37.1 47.3 51.8 52.8 51.7 47.8 36.9 39.5 45.7 43.3 40.3 53.2 51.0 52.2 50.9 45.7 45.8 45.1 42.9 41.5 34.5 40.9 38.4 43.7 39.3 36.8 35.9 36.2 38.5 33.4 33.9 28.4 25.0 24.7 23.4 27.4 43.2 42.6 38.8 40.1 38.7 36.5 38.0 37.8 37.2 41.8 32.5 28.6 33.2 32.6 38.1 27.3 28.9 26.1 27.6 30.5 31.2 33.8 32.1 32.4 32.6 37.8 39.0 43.4 41.3 42.7 40.6 38.8 43.0 43.8 45.8 37.7 34.8 32.1 33.4 37.6 40.2 39.8 36.6 37.9 40.4 38.2 36.5 36.3 39.3 41.6 32.6 31.3 29.5 32.7 37.7 13.6 12.3 10.5 10.7 7.8 13.7 14.3 10.7 11.7 8.9 8.0 10.0 9.1 8.4 7.4 6.2 6.5 7.7 6.7 5.5
44.9 44.6 42.5 46.0 39.6 44.9 44.8 41.8 42.8 35.7 39.7 42.3 38.7 40.6 37.6 38.9 38.8 39.5 39.6 37.4
*
Family History of Antisocial Behavior Parent Attitudes Favorable to ASB
Family Domain Poor Family Management Family Conflict
Parent Attitudes Favor Drug Use
School Domain
Friend's Use of Drugs
Rebelliousness
Grade 12
Perceived Availability of Handguns
Community Domain Low Neighborhood Attachment
Perceived Availability of Drugs Laws & Norms Favor Drug Use
Grade 10
Risk FactorGrade 6 Grade 8
Early Initiation of ASB Early Initiation of Drug Use
Academic Failure Low Commitment to School
Peer-Individual Domain
Students at High Risk*
High Riskyouth are defined as the percentage of students who have more than a specified number of risk factors operating in their lives. (6th grade: 7 or more risk factors, 8th grade: 8 or more risk factors, 10th & 12th grades: 9 or more risk factors.)
Perceived Risk of Drug Use
Total Risk
Rewards for ASB Depressive Symptoms Gang Involvement
Attitudes Favorable to ASB Attitudes Favorable to Drug Use Intentions to Use
Interaction with Antisocial Peers
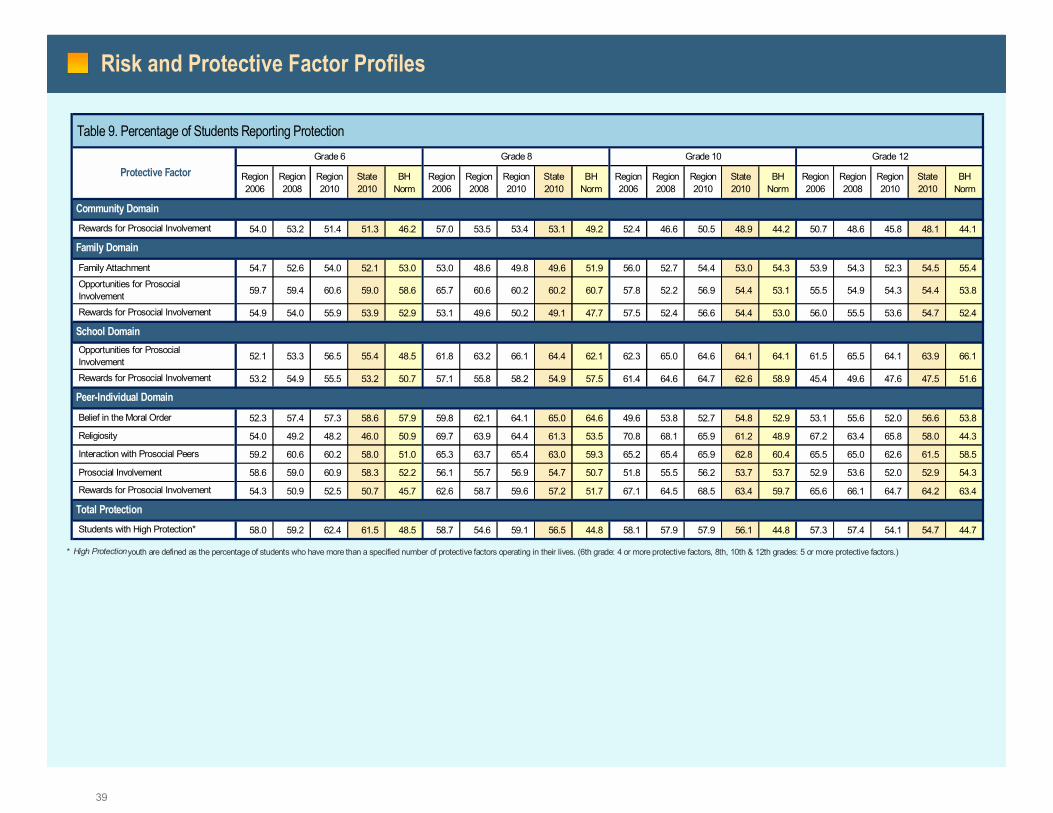
39
Risk and Protective Factor Profiles
Table 9. Percentage of Students Reporting Protection
Region2006
Region2008
Region2010
State2010
BH Norm
Region2006
Region2008
Region2010
State2010
BH Norm
Region2006
Region2008
Region2010
State2010
BH Norm
Region2006
Region2008
Region2010
State2010
BH Norm
54.0 53.2 51.4 51.3 46.2 57.0 53.5 53.4 53.1 49.2 52.4 46.6 50.5 48.9 44.2 50.7 48.6 45.8 48.1 44.1
54.7 52.6 54.0 52.1 53.0 53.0 48.6 49.8 49.6 51.9 56.0 52.7 54.4 53.0 54.3 53.9 54.3 52.3 54.5 55.4
59.7 59.4 60.6 59.0 58.6 65.7 60.6 60.2 60.2 60.7 57.8 52.2 56.9 54.4 53.1 55.5 54.9 54.3 54.4 53.8
54.9 54.0 55.9 53.9 52.9 53.1 49.6 50.2 49.1 47.7 57.5 52.4 56.6 54.4 53.0 56.0 55.5 53.6 54.7 52.4
52.1 53.3 56.5 55.4 48.5 61.8 63.2 66.1 64.4 62.1 62.3 65.0 64.6 64.1 64.1 61.5 65.5 64.1 63.9 66.1
53.2 54.9 55.5 53.2 50.7 57.1 55.8 58.2 54.9 57.5 61.4 64.6 64.7 62.6 58.9 45.4 49.6 47.6 47.5 51.6
52.3 57.4 57.3 58.6 57.9 59.8 62.1 64.1 65.0 64.6 49.6 53.8 52.7 54.8 52.9 53.1 55.6 52.0 56.6 53.8
54.0 49.2 48.2 46.0 50.9 69.7 63.9 64.4 61.3 53.5 70.8 68.1 65.9 61.2 48.9 67.2 63.4 65.8 58.0 44.3
59.2 60.6 60.2 58.0 51.0 65.3 63.7 65.4 63.0 59.3 65.2 65.4 65.9 62.8 60.4 65.5 65.0 62.6 61.5 58.5
58.6 59.0 60.9 58.3 52.2 56.1 55.7 56.9 54.7 50.7 51.8 55.5 56.2 53.7 53.7 52.9 53.6 52.0 52.9 54.3
54.3 50.9 52.5 50.7 45.7 62.6 58.7 59.6 57.2 51.7 67.1 64.5 68.5 63.4 59.7 65.6 66.1 64.7 64.2 63.4
58.0 59.2 62.4 61.5 48.5 58.7 54.6 59.1 56.5 44.8 58.1 57.9 57.9 56.1 44.8 57.3 57.4 54.1 54.7 44.7
*
Grade 8
Community Domain
Opportunities for Prosocial Involvement
Grade 10
Family Domain
High Protectionyouth are defined as the percentage of students who have more than a specified number of protective factors operating in their lives. (6th grade: 4 or more protective factors, 8th, 10th & 12th grades: 5 or more protective factors.)
Rewards for Prosocial Involvement
Religiosity
Grade 12Grade 6
Peer-Individual Domain
Rewards for Prosocial Involvement
Total Protection
Protective Factor
Students with High Protection*
Prosocial Involvement
Belief in the Moral Order
Family Attachment
Rewards for Prosocial Involvement
Interaction with Prosocial Peers
School Domain Opportunities for Prosocial Involvement
Rewards for Prosocial Involvement

40
* Students were initially asked if they drank alcohol in the past year. Students marking "no" were instructed to skip the two questions regarding sources of obtaining alcohol and places of alcohol * consumption. Sample size represents the number of youth who chose at least one source of obtaining alcohol or at least one place of alcohol consumption. Students who indicated they had not * drank alcohol in the past year are not included in the sample. In the case of smaller sample sizes, caution should be exercised before generalizing results to the entire community.
Alcohol Causal Variables
I bou
ght i
t mys
elf
with
a fa
ke ID
I bou
ght i
t mys
elf
with
out a
fake
ID
I got
it fr
om s
omeo
neI k
now
age
21
or o
lder
I got
it fr
om s
omeo
ne
I kno
w u
nder
age
21
I got
it fr
om h
ome
with
m
y pa
rent
s' p
erm
issi
on
I got
it fr
om h
ome
with
out
my
pare
nts'
per
mis
sion
I got
it fr
om a
fam
ily
mem
ber o
r rel
ativ
e ot
her t
han
my
pare
nts
A s
tran
ger b
ough
t it
for m
e
I got
it a
noth
er w
ay
My/
Som
eone
els
e's
hom
e w
ithou
t any
pa
rent
per
mis
sion
My
hom
e w
ith m
ypa
rent
's p
erm
issi
on
Som
eone
els
e's
hom
e w
ith th
eir p
aren
t's
perm
issi
on
In a
car
At a
n op
en a
rea
like
a pa
rk, b
each
, bac
k ro
ad,
or a
str
eet c
orne
r
At a
rest
aura
nt, b
aror
a n
ight
club
At p
ublic
eve
nts
such
as
a s
port
ing
even
t, fe
stiv
al, o
r con
cert
At a
n em
pty
build
ing
ora
cons
truc
tion
site
In s
ome
othe
r pla
ce
0
10
20
30
40
50
60
70
80
90
100
Perce
ntage
(%)
Region 2008Sources sample: 267Places sample: 298
Region 2010Sources sample: 260Places sample: 306
State 2010Sources sample: 2,086Places sample: 2,391
ALCOHOL CAUSAL VARIABLES*2010 DHH Region 7, Grade 6
Sources of Obtaining Alcohol Places Where Alcohol is Used

41
* Students were initially asked if they drank alcohol in the past year. Students marking "no" were instructed to skip the two questions regarding sources of obtaining alcohol and places of alcohol * consumption. Sample size represents the number of youth who chose at least one source of obtaining alcohol or at least one place of alcohol consumption. Students who indicated they had not * drank alcohol in the past year are not included in the sample. In the case of smaller sample sizes, caution should be exercised before generalizing results to the entire community.
Alcohol Causal Variables
I bou
ght i
t mys
elf
with
a fa
ke ID
I bou
ght i
t mys
elf
with
out a
fake
ID
I got
it fr
om s
omeo
neI k
now
age
21
or o
lder
I got
it fr
om s
omeo
ne
I kno
w u
nder
age
21
I got
it fr
om h
ome
with
m
y pa
rent
s' p
erm
issi
on
I got
it fr
om h
ome
with
out
my
pare
nts'
per
mis
sion
I got
it fr
om a
fam
ily
mem
ber o
r rel
ativ
e ot
her t
han
my
pare
nts
A s
tran
ger b
ough
t it
for m
e
I got
it a
noth
er w
ay
My/
Som
eone
els
e's
hom
e w
ithou
t any
pa
rent
per
mis
sion
My
hom
e w
ith m
ypa
rent
's p
erm
issi
on
Som
eone
els
e's
hom
e w
ith th
eir p
aren
t's
perm
issi
on
In a
car
At a
n op
en a
rea
like
a pa
rk, b
each
, bac
k ro
ad,
or a
str
eet c
orne
r
At a
rest
aura
nt, b
aror
a n
ight
club
At p
ublic
eve
nts
such
as
a s
port
ing
even
t, fe
stiv
al, o
r con
cert
At a
n em
pty
build
ing
ora
cons
truc
tion
site
In s
ome
othe
r pla
ce
0
10
20
30
40
50
60
70
80
90
100
Perce
ntage
(%)
Region 2008Sources sample: 948Places sample: 965
Region 2010Sources sample: 798Places sample: 814
State 2010Sources sample: 6,337Places sample: 6,371
ALCOHOL CAUSAL VARIABLES*2010 DHH Region 7, Grade 8
Sources of Obtaining Alcohol Places Where Alcohol is Used
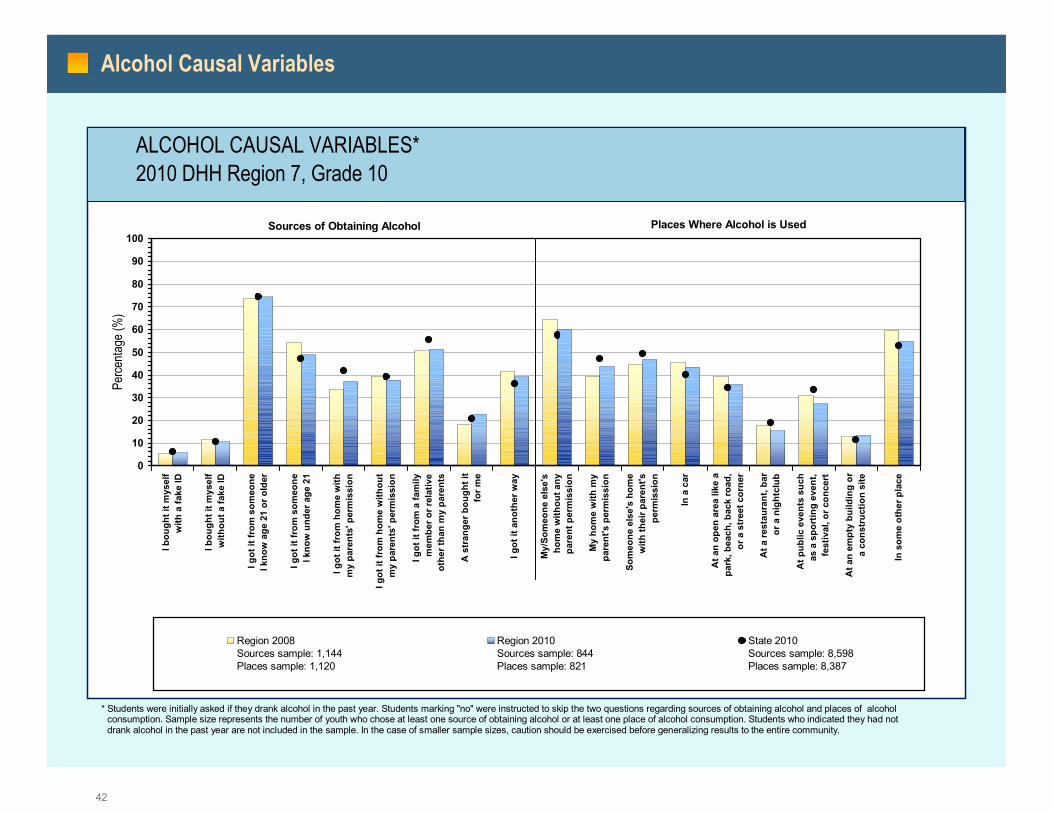
42
* Students were initially asked if they drank alcohol in the past year. Students marking "no" were instructed to skip the two questions regarding sources of obtaining alcohol and places of alcohol * consumption. Sample size represents the number of youth who chose at least one source of obtaining alcohol or at least one place of alcohol consumption. Students who indicated they had not * drank alcohol in the past year are not included in the sample. In the case of smaller sample sizes, caution should be exercised before generalizing results to the entire community.
Alcohol Causal Variables
I bou
ght i
t mys
elf
with
a fa
ke ID
I bou
ght i
t mys
elf
with
out a
fake
ID
I got
it fr
om s
omeo
neI k
now
age
21
or o
lder
I got
it fr
om s
omeo
ne
I kno
w u
nder
age
21
I got
it fr
om h
ome
with
m
y pa
rent
s' p
erm
issi
on
I got
it fr
om h
ome
with
out
my
pare
nts'
per
mis
sion
I got
it fr
om a
fam
ily
mem
ber o
r rel
ativ
e ot
her t
han
my
pare
nts
A s
tran
ger b
ough
t it
for m
e
I got
it a
noth
er w
ay
My/
Som
eone
els
e's
hom
e w
ithou
t any
pa
rent
per
mis
sion
My
hom
e w
ith m
ypa
rent
's p
erm
issi
on
Som
eone
els
e's
hom
e w
ith th
eir p
aren
t's
perm
issi
on
In a
car
At a
n op
en a
rea
like
a pa
rk, b
each
, bac
k ro
ad,
or a
str
eet c
orne
r
At a
rest
aura
nt, b
aror
a n
ight
club
At p
ublic
eve
nts
such
as
a s
port
ing
even
t, fe
stiv
al, o
r con
cert
At a
n em
pty
build
ing
ora
cons
truc
tion
site
In s
ome
othe
r pla
ce
0
10
20
30
40
50
60
70
80
90
100
Perce
ntage
(%)
Region 2008Sources sample: 1,144Places sample: 1,120
Region 2010Sources sample: 844Places sample: 821
State 2010Sources sample: 8,598Places sample: 8,387
ALCOHOL CAUSAL VARIABLES*2010 DHH Region 7, Grade 10
Sources of Obtaining Alcohol Places Where Alcohol is Used

43
* Students were initially asked if they drank alcohol in the past year. Students marking "no" were instructed to skip the two questions regarding sources of obtaining alcohol and places of alcohol * consumption. Sample size represents the number of youth who chose at least one source of obtaining alcohol or at least one place of alcohol consumption. Students who indicated they had not * drank alcohol in the past year are not included in the sample. In the case of smaller sample sizes, caution should be exercised before generalizing results to the entire community.
Alcohol Causal Variables
I bou
ght i
t mys
elf
with
a fa
ke ID
I bou
ght i
t mys
elf
with
out a
fake
ID
I got
it fr
om s
omeo
neI k
now
age
21
or o
lder
I got
it fr
om s
omeo
ne
I kno
w u
nder
age
21
I got
it fr
om h
ome
with
m
y pa
rent
s' p
erm
issi
on
I got
it fr
om h
ome
with
out
my
pare
nts'
per
mis
sion
I got
it fr
om a
fam
ily
mem
ber o
r rel
ativ
e ot
her t
han
my
pare
nts
A s
tran
ger b
ough
t it
for m
e
I got
it a
noth
er w
ay
My/
Som
eone
els
e's
hom
e w
ithou
t any
pa
rent
per
mis
sion
My
hom
e w
ith m
ypa
rent
's p
erm
issi
on
Som
eone
els
e's
hom
e w
ith th
eir p
aren
t's
perm
issi
on
In a
car
At a
n op
en a
rea
like
a pa
rk, b
each
, bac
k ro
ad,
or a
str
eet c
orne
r
At a
rest
aura
nt, b
aror
a n
ight
club
At p
ublic
eve
nts
such
as
a s
port
ing
even
t, fe
stiv
al, o
r con
cert
At a
n em
pty
build
ing
ora
cons
truc
tion
site
In s
ome
othe
r pla
ce
0
10
20
30
40
50
60
70
80
90
100
Perce
ntage
(%)
Region 2008Sources sample: 1,106Places sample: 1,066
Region 2010Sources sample: 891Places sample: 840
State 2010Sources sample: 8,946Places sample: 8,654
ALCOHOL CAUSAL VARIABLES*2010 DHH Region 7, Grade 12
Sources of Obtaining Alcohol Places Where Alcohol is Used

44
* Community norms data represents the perceptions of all students surveyed, regardless of whether they indicated any alcohol use in the past year.
Alcohol Causal Variables
It is not wrong at allfor adults over 21 to drink alcohol in public
It is not wrong at all for adults over 21 to getdrunk or be drunk in public
In my community, it wouldbe very easy or sort of easy for someone under 21 to buy alcohol from a store
Students answering "NO!" or "no" to the following question:If someone was drinking anddriving in your neighborhood,would they get caught by the police?
Students answering "NO!" or "no" to the following question:If the police caught a kid drinking alcohol in your neighborhood, would he or she be in serious trouble?
0
10
20
30
40
50
60
70
80
90
100
Perce
ntage
(%)
Region 2008 Region 2010 State 2010
COMMUNITY NORMS REGARDING ALCOHOL USE*2010 DHH Region 7, Grade 6
Sample Size: All Students Surveyed*

45
* Community norms data represents the perceptions of all students surveyed, regardless of whether they indicated any alcohol use in the past year.
Alcohol Causal Variables
It is not wrong at allfor adults over 21 to drink alcohol in public
It is not wrong at all for adults over 21 to getdrunk or be drunk in public
In my community, it wouldbe very easy or sort of easy for someone under 21 to buy alcohol from a store
Students answering "NO!" or "no" to the following question:If someone was drinking anddriving in your neighborhood,would they get caught by the police?
Students answering "NO!" or "no" to the following question:If the police caught a kid drinking alcohol in your neighborhood, would he or she be in serious trouble?
0
10
20
30
40
50
60
70
80
90
100
Perce
ntage
(%)
Region 2008 Region 2010 State 2010
COMMUNITY NORMS REGARDING ALCOHOL USE*2010 DHH Region 7, Grade 8
Sample Size: All Students Surveyed*

46
* Community norms data represents the perceptions of all students surveyed, regardless of whether they indicated any alcohol use in the past year.
Alcohol Causal Variables
It is not wrong at allfor adults over 21 to drink alcohol in public
It is not wrong at all for adults over 21 to getdrunk or be drunk in public
In my community, it wouldbe very easy or sort of easy for someone under 21 to buy alcohol from a store
Students answering "NO!" or "no" to the following question:If someone was drinking anddriving in your neighborhood,would they get caught by the police?
Students answering "NO!" or "no" to the following question:If the police caught a kid drinking alcohol in your neighborhood, would he or she be in serious trouble?
0
10
20
30
40
50
60
70
80
90
100
Perce
ntage
(%)
Region 2008 Region 2010 State 2010
COMMUNITY NORMS REGARDING ALCOHOL USE*2010 DHH Region 7, Grade 10
Sample Size: All Students Surveyed*

47
* Community norms data represents the perceptions of all students surveyed, regardless of whether they indicated any alcohol use in the past year.
Alcohol Causal Variables
It is not wrong at allfor adults over 21 to drink alcohol in public
It is not wrong at all for adults over 21 to getdrunk or be drunk in public
In my community, it wouldbe very easy or sort of easy for someone under 21 to buy alcohol from a store
Students answering "NO!" or "no" to the following question:If someone was drinking anddriving in your neighborhood,would they get caught by the police?
Students answering "NO!" or "no" to the following question:If the police caught a kid drinking alcohol in your neighborhood, would he or she be in serious trouble?
0
10
20
30
40
50
60
70
80
90
100
Perce
ntage
(%)
Region 2008 Region 2010 State 2010
COMMUNITY NORMS REGARDING ALCOHOL USE*2010 DHH Region 7, Grade 12
Sample Size: All Students Surveyed*
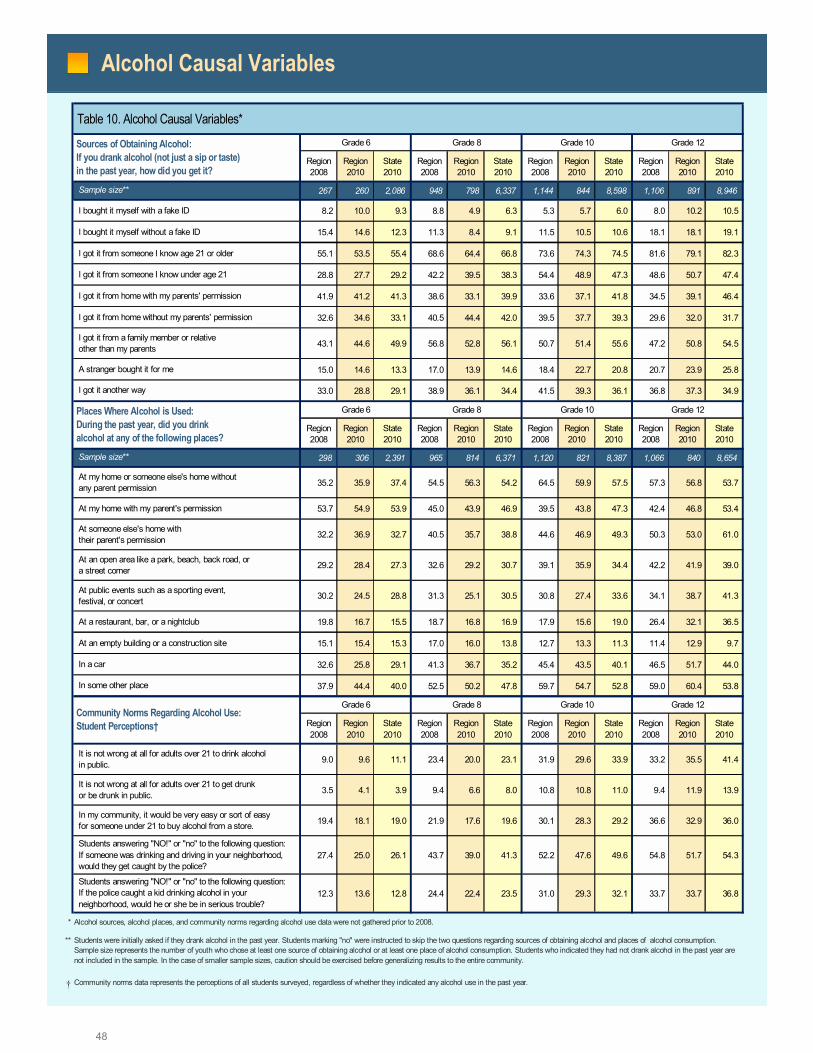
48
Alcohol Causal Variables
Table 10. Alcohol Causal Variables*
Region2008
Region2010
State2010
Region2008
Region2010
State2010
Region2008
Region2010
State2010
Region2008
Region2010
State2010
267 260 2,086 948 798 6,337 1,144 844 8,598 1,106 891 8,946
8.2 10.0 9.3 8.8 4.9 6.3 5.3 5.7 6.0 8.0 10.2 10.5
15.4 14.6 12.3 11.3 8.4 9.1 11.5 10.5 10.6 18.1 18.1 19.1
55.1 53.5 55.4 68.6 64.4 66.8 73.6 74.3 74.5 81.6 79.1 82.3
28.8 27.7 29.2 42.2 39.5 38.3 54.4 48.9 47.3 48.6 50.7 47.4
41.9 41.2 41.3 38.6 33.1 39.9 33.6 37.1 41.8 34.5 39.1 46.4
32.6 34.6 33.1 40.5 44.4 42.0 39.5 37.7 39.3 29.6 32.0 31.7
43.1 44.6 49.9 56.8 52.8 56.1 50.7 51.4 55.6 47.2 50.8 54.5
15.0 14.6 13.3 17.0 13.9 14.6 18.4 22.7 20.8 20.7 23.9 25.8
33.0 28.8 29.1 38.9 36.1 34.4 41.5 39.3 36.1 36.8 37.3 34.9
Region2008
Region2010
State2010
Region2008
Region2010
State2010
Region2008
Region2010
State2010
Region2008
Region2010
State2010
298 306 2,391 965 814 6,371 1,120 821 8,387 1,066 840 8,654
35.2 35.9 37.4 54.5 56.3 54.2 64.5 59.9 57.5 57.3 56.8 53.7
53.7 54.9 53.9 45.0 43.9 46.9 39.5 43.8 47.3 42.4 46.8 53.4
32.2 36.9 32.7 40.5 35.7 38.8 44.6 46.9 49.3 50.3 53.0 61.0
29.2 28.4 27.3 32.6 29.2 30.7 39.1 35.9 34.4 42.2 41.9 39.0
30.2 24.5 28.8 31.3 25.1 30.5 30.8 27.4 33.6 34.1 38.7 41.3
19.8 16.7 15.5 18.7 16.8 16.9 17.9 15.6 19.0 26.4 32.1 36.5
15.1 15.4 15.3 17.0 16.0 13.8 12.7 13.3 11.3 11.4 12.9 9.7
32.6 25.8 29.1 41.3 36.7 35.2 45.4 43.5 40.1 46.5 51.7 44.0
37.9 44.4 40.0 52.5 50.2 47.8 59.7 54.7 52.8 59.0 60.4 53.8
Region2008
Region2010
State2010
Region2008
Region2010
State2010
Region2008
Region2010
State2010
Region2008
Region2010
State2010
9.0 9.6 11.1 23.4 20.0 23.1 31.9 29.6 33.9 33.2 35.5 41.4
3.5 4.1 3.9 9.4 6.6 8.0 10.8 10.8 11.0 9.4 11.9 13.9
19.4 18.1 19.0 21.9 17.6 19.6 30.1 28.3 29.2 36.6 32.9 36.0
27.4 25.0 26.1 43.7 39.0 41.3 52.2 47.6 49.6 54.8 51.7 54.3
12.3 13.6 12.8 24.4 22.4 23.5 31.0 29.3 32.1 33.7 33.7 36.8
*
**
� Community norms data represents the perceptions of all students surveyed, regardless of whether they indicated any alcohol use in the past year.
Grade 8 Grade 12 Sources of Obtaining Alcohol: If you drank alcohol (not just a sip or taste) in the past year, how did you get it?
Grade 6 Grade 10
Sample size**
A stranger bought it for me
I got it from someone I know age 21 or older
I got it from someone I know under age 21
I got it from home with my parents' permission
I bought it myself without a fake ID
I bought it myself with a fake ID
Students were initially asked if they drank alcohol in the past year. Students marking "no" were instructed to skip the two questions regarding sources of obtaining alcohol and places of alcohol consumption. Sample size represents the number of youth who chose at least one source of obtaining alcohol or at least one place of alcohol consumption. Students who indicated they had not drank alcohol in the past year are not included in the sample. In the case of smaller sample sizes, caution should be exercised before generalizing results to the entire community.
Alcohol sources, alcohol places, and community norms regarding alcohol use data were not gathered prior to 2008.
I got it another way
I got it from home without my parents' permission
I got it from a family member or relative other than my parents
Places Where Alcohol is Used: During the past year, did you drink alcohol at any of the following places?
Grade 6 Grade 8 Grade 10 Grade 12
Sample size**
At my home or someone else's home without any parent permission
At my home with my parent's permission
At someone else's home with their parent's permission
At an open area like a park, beach, back road, or a street corner
At public events such as a sporting event, festival, or concert
At a restaurant, bar, or a nightclub
At an empty building or a construction site
In a car
In some other place
Students answering "NO!" or "no" to the following question: If the police caught a kid drinking alcohol in your neighborhood, would he or she be in serious trouble?
Students answering "NO!" or "no" to the following question: If someone was drinking and driving in your neighborhood, would they get caught by the police?
In my community, it would be very easy or sort of easy for someone under 21 to buy alcohol from a store.
Grade 12
It is not wrong at all for adults over 21 to drink alcohol in public.
It is not wrong at all for adults over 21 to get drunk or be drunk in public.
Community Norms Regarding Alcohol Use: Student Perceptions�
Grade 6 Grade 8 Grade 10

49
Additional Data for Prevention Planning
Table 11. Percent of Students Responding to Violence, Bullying, and Mental Health Prevention Indicators
Region2006
Region2008
Region2010
State2010
Region2006
Region2008
Region2010
State2010
Region2006
Region2008
Region2010
State2010
Region2006
Region2008
Region2010
State2010
Violence on School Grounds (Answered "no" or "NO!" to statement�)
I feel safe at my school. 22.4 21.7 20.1 21.1 26.0 27.3 23.8 25.7 29.4 21.7 25.7 25.7 28.7 19.4 20.7 21.9
Prevalence of Violence (Answered one or more times in the past year)
How many times in the past year have you attacked someone with the idea of seriously hurting them?
17.5 19.2 17.3 16.4 23.2 24.0 20.7 19.1 17.6 18.4 20.9 17.0 14.2 15.0 16.4 13.3
Perception of Peer Disapproval (Answered "Wrong" or "Very Wrong" to question�)
How wrong do you think it is for someone your age to attack someone with the idea of seriously hurting them?
90.2 90.2 90.3 91.7 82.9 83.2 84.1 85.7 82.1 82.5 79.5 84.1 85.2 86.2 84.7 87.4
Avoidance of School in the Past Month Due to Bullying (Answered 1 or more days to question...)
During the past 30 days, on how many days did you NOT got to school because you felt you would be unsafe at school or on the way to or from school?
n/a 10.6 10.5 10.0 n/a 10.0 8.5 9.1 n/a 7.5 7.1 7.4 n/a 6.2 6.3 6.1
Bullying in the Past Year (Answered 1 or more days to question�)
During the past 12 months, how often have you been picked on or bullied by a student ON SCHOOL PROPERTY?
n/a 24.7 26.8 27.9 n/a 21.3 20.7 22.8 n/a 11.1 13.6 15.7 n/a 7.0 9.3 9.7
Suicidal Ideation (Answered "Yes" to question�)
During the past 12 months, did you ever seriously consider attempting suicide?
n/a 7.5 8.7 8.5 n/a 13.3 13.7 14.2 n/a 13.0 14.8 14.9 n/a 10.3 11.3 10.9
High Depressive Symptoms 2.3 2.4 2.2 2.4 3.2 4.5 4.2 4.4 3.4 3.6 3.5 4.3 2.6 2.4 2.0 2.4
Moderate Depressive Symptoms 82.1 79.1 74.9 76.7 79.6 75.7 71.8 73.1 77.3 75.5 74.3 74.8 73.6 73.2 72.0 70.9
No Depressive Symptoms 15.5 18.5 22.9 20.9 17.2 19.8 24.0 22.5 19.3 20.9 22.1 21.0 23.8 24.3 25.9 26.7
* The four depressive symptoms that were asked on the survey questionnaire were: 1) Sometimes I think that life is not worth it, 2) At times I think I am no good at all, 3) All in all, I am inclined to think that I am a failure, and 4) In the past year, have you felt depressed or sad MOST days, even if you felt OK sometimes? The questions were scored on a scale of 1 to 4 (NO!, no, yes, YES!). The survey respondents were divided into three groups. The first group was the High Depressive Symptoms group who scored at least a mean of 3.75 on the depressive symptoms. This meant that those individuals marked �YES!� to all four items or marked �yes� to one item and �YES!� to three. The second group was the No Depressive Symptoms group who marked �NO!� to all four of the items, and the third group was a middle group who comprised the remaining respondents.
Grade 12Grade 8 Grade 10Grade 6
Depressive Symptoms Calculation (Calculated from student responses to four depressive symptoms questions*)

50
Additional Data for Prevention Planning
Table 12. Perceived Parent/Peer Disapproval, Risk Perception and Age of Initiation
Percent Sample Percent Sample Percent Sample Percent Sample Percent Sample Percent Sample
drink 1 or two drinks nearly every day
Alcohol 60.3 4,195 60.7 3,857 62.3 2,170 65.9 1,832 57.9 5,495 65.1 6,272
smoke 1 or more packs of cigarettes per day Cigarettes 72.0 4,296 79.1 3,974 81.7 2,213 85.0 1,881 77.1 5,658 79.1 6,409
smoke marijuana regularly Marijuana 76.7 4,098 80.9 3,791 73.7 2,133 66.5 1,830 73.1 5,425 78.7 6,149
drink beer, wine, or hard liquor regularly Alcohol 95.9 3,940 89.4 3,810 84.4 2,098 78.2 1,804 89.3 5,271 88.6 6,099
smoke cigarettes Cigarettes 97.7 3,922 94.7 3,793 93.8 2,091 86.0 1,805 93.9 5,248 94.4 6,081
smoke marijuana Marijuana 98.7 3,850 96.5 3,737 94.3 2,058 93.1 1,781 96.2 5,154 96.4 5,994
drink beer, wine, or hard liquor regularly Alcohol 94.1 4,585 81.2 4,075 66.6 2,304 62.4 1,966 81.1 5,959 79.8 6,644
smoke cigarettes Cigarettes 95.8 4,563 87.8 4,066 77.9 2,310 67.8 1,964 85.4 5,939 86.2 6,641
smoke marijuana Marijuana 97.8 4,560 90.7 4,067 78.9 2,308 73.0 1,958 87.3 5,939 89.5 6,631
Alcohol 7.7 4,326 19.4 3,994 32.2 2,211 41.9 1,878 19.5 5,693 22.3 6,416
Cigarettes 2.4 4,189 7.9 3,961 11.9 2,177 17.7 1,855 8.7 5,560 7.7 6,325
Marijuana 0.6 4,306 4.2 3,979 10.3 2,206 15.0 1,864 6.5 5,671 4.8 6,386
Average Age of Onset**Percent Sample Percent Sample Percent Sample Percent Sample Percent Sample Percent Sample
Alcohol 23.3 4,581 45.9 4,079 64.6 2,323 72.8 1,971 43.7 5,983 46.9 6,639 Average age:
Cigarettes 11.9 4,589 26.8 4,098 41.7 2,324 48.0 1,975 27.8 5,997 26.9 6,657 Average age:
Marijuana 2.1 4,605 10.5 4,105 24.6 2,327 35.7 1,973 15.0 6,009 12.7 6,665 Average age:
*
**
� The male and female values allow a gender comparison for youth who completed the survey. However, unless the percentage of students who participated from each grade is similar, the gender results are not necessarily representative of males and females in the community. In order to preserve confidentiality, male or female values may be omitted if the total number surveyed for that gender is under 20.
For Average Age of Onset, the �Sample� column represents the overall sample size: the total number of people that responded to the questions about Age of Onset. This includes responses that are not used to calculate the average age of onset (i.e., youth that have never used alcohol, tobacco, and marijuana). The "Percent" column represents the percentage of youth in the sample reporting any age of first use for the specified substance. "Average age" is calculated by averaging the ages of first use of students reporting any use.
For Past 30-Day Use, Perception of Risk, and Perception of Parental/Peer Disapproval, the �Sample� column represents the sample size - the number of people who answered the question and whose responses were used to determine the percentage. The "Percent" column represents the percentage of youth in the sample answering the question as specified in the definition.
13.9 years
12.7 years
12.3 years
Male � Female �
12.0 years
13.0 years
12.5 years 13.4 years
14.6 years 13.2 years
12.1 years 14.1 years
13.5 years
at least one use in the past 30 daysPast 30-Day Use*
Perception of Peer Disapproval* (I think it is Wrong or Very Wrong for someone my age to...)
Perception of Risk* (People are at Moderate or Great Risk of harming themselves if they...)
Perception of ParentDisapproval* (Parents feel it would be Wrong or Very Wrong to... )
smoked a cigarette, even just a puff?
had more than a sip or two of beer, wine or hard liquor?
smoked marijuana?12.2 years
11.5 years
10.7 years (How old were you when you first�)
11.5 years
10.6 years
11.7 years
SubstanceDefinitionOutcome
Region 2010
Grade 10 Grade 12Grade 8Grade 6

51
Risk and Protective Scale Definitions
1 Low Neighborhood Attachment Research has shown that youth who don't like the neighborhoods in which they live are more likely to becomeinvolved in juvenile crime and drug selling.
1 Laws and Norms Favorable Toward Drug Use
Research has shown that legal restrictions on alcohol and tobacco use, such as raising the legal drinking age, restrictingsmoking in public places, and increased taxation have been followed by decreases in consumption. Moreover, nationalsurveys of high school seniors have shown that shifts in normative attitudes toward drug use have preceded changes inprevalence of use.
1
1 Perceived Availability of Drugs and Handguns
The availability of cigarettes, alcohol, marijuana, and other illegal drugs has been related to the use of these substancesby adolescents. The availability of handguns is also related to a higher risk of crime and substance use by adolescents.
1 Rewards for Prosocial Involvement
Rewards for positive participation in activities helps youth bond to the community, thus lowering their risk forsubstance use.
1 Poor Family Management Parents� use of inconsistent and/or unusually harsh or severe punishment with their children places them at higher riskfor substance use and other problem behaviors. Also, parents� failure to provide clear expectations and to monitor theirchildren�s behavior makes it more likely that they will engage in drug abuse whether or not there are family drugproblems.
1 Family Conflict Children raised in families high in conflict, whether or not the child is directly involved in the conflict, appear at riskfor both delinquency and drug use.
1 Family History of Antisocial Behavior
When children are raised in a family with a history of problem behaviors (e.g., violence or ATOD use), the children aremore likely to engage in these behaviors.
1 Parental Attitudes Favorable Toward Antisocial Behavior & Drugs
In families where parents use illegal drugs, are heavy users of alcohol, or are tolerant of children�s use, children aremore likely to become drug abusers during adolescence. The risk is further increased if parents involve children intheir own drug (or alcohol) using behavior, for example, asking the child to light the parent�s cigarette or get the parenta beer from the refrigerator.
1 Family Attachment Young people who feel that they are a valued part of their family are less likely to engage in substance use and otherproblem behaviors.
1 Opportunities for Prosocial Involvement
Young people who are exposed to more opportunities to participate meaningfully in the responsibilities and activitiesof the family are less likely to engage in drug use and other problem behaviors.
1 Rewards for Prosocial Involvement
When parents, siblings, and other family members praise, encourage, and attend to things done well by their child,children are less likely to engage in substance use and problem behaviors.
1 Academic Failure Beginning in the late elementary grades (grades 4-6) academic failure increases the risk of both drug abuse anddelinquency. It appears that the experience of failure itself, for whatever reasons, increases the risk of problembehaviors.
1 Low Commitment to School Surveys of high school seniors have shown that the use of drugs is significantly lower among students who expect toattend college than among those who do not. Factors such as liking school, spending time on homework, andperceiving the coursework as relevant are also negatively related to drug use.
Community Domain Protective Factors
Family Domain Risk Factors
Family Domain Protective Factors
School Domain Risk Factors
Table 13. Scales that Measure the Risk and Protective Factors Shown in the ProfilesCommunity Domain Risk Factors

52
Risk and Protective Scale Definitions
1 Opportunities for Prosocial Involvement
When young people are given more opportunities to participate meaningfully in important activities at school, they areless likely to engage in drug use and other problem behaviors.
1
1 Rewards for Prosocial Involvement
When young people are recognized and rewarded for their contributions at school, they are less likely to be involved insubstance use and other problem behaviors.
1 Rebelliousness Young people who do not feel part of society, are not bound by rules, don�t believe in trying to be successful orresponsible, or who take an active rebellious stance toward society, are at higher risk of abusing drugs. In addition,high tolerance for deviance, a strong need for independence and normlessness have all been linked with drug use.
1
1 Early Initiation of Antisocial Behavior and Drug Use
Early onset of drug use predicts misuse of drugs. The earlier the onset of any drug use, the greater the involvement inother drug use and the greater frequency of use. Onset of drug use prior to the age of 15 is a consistent predictor ofdrug abuse, and a later age of onset of drug use has been shown to predict lower drug involvement and a greaterprobability of discontinuation of use.
1 Attitudes Favorable Toward Antisocial Behavior and Drug Use
During the elementary school years, most children express anti-drug, anti-crime, and pro-social attitudes and havedifficulty imagining why people use drugs or engage in antisocial behaviors. However, in middle school, as more youthare exposed to others who use drugs and engage in antisocial behavior, their attitudes often shift toward greateracceptance of these behaviors. Youth who express positive attitudes toward drug use and antisocial behavior are morelikely to engage in a variety of problem behaviors, including drug use.
1 Intention to Use ATODs Many prevention programs focus on reducing the intention of participants to use ATODs later in life. Reduction ofintention to use ATODs often follows successful prevention interventions.
1 Perceived Risk of Drug Use Young people who do not perceive drug use to be risky are far more likely to engage in drug use.
1 Interaction with Antisocial Peers Young people who associate with peers who engage in problem behaviors are at higher risk for engaging in antisocialbehavior themselves.
1 Friends' Use of Drugs Young people who associate with peers who engage in alcohol or substance abuse are much more likely to engage inthe same behavior. Peer drug use has consistently been found to be among the strongest predictors of substance useamong youth. Even when young people come from well-managed families and do not experience other risk factors,spending time with friends who use drugs greatly increases the risk of that problem developing.
1
1 Rewards for Antisocial Behavior Young people who receive rewards for their antisocial behavior are at higher risk for engaging further in antisocialbehavior and substance use.
1 Depressive Symptoms Young people who are depressed are overrepresented in the criminal justice system and are more likely to use drugs.Survey research and other studies have shown a link between depression and youth problem behaviors.
1 Gang Involvement Youth who belong to gangs are more at risk for antisocial behavior and drug use.
1 Belief in the Moral Order Young people who have a belief in what is �right� or �wrong� are less likely to use drugs.
1 Religiosity Young people who regularly attend religious services are less likely to engage in problem behaviors.
1 Interaction with Prosocial Peers Young people who associate with peers who engage in prosocial behavior are more protected from engaging inantisocial behavior and substance use.
1 Prosocial Involvement Participation in positive school and community activities helps provide protection for youth.
1 Rewards for Prosocial Involvement
Young people who are rewarded for working hard in school and the community are less likely to engage in problembehavior.
Peer-Individual Protective Factors
Peer-Individual Risk Factors
Table 13. Scales that Measure the Risk and Protective Factors Shown in the Profiles (cont'd)School Domain Protective Factors
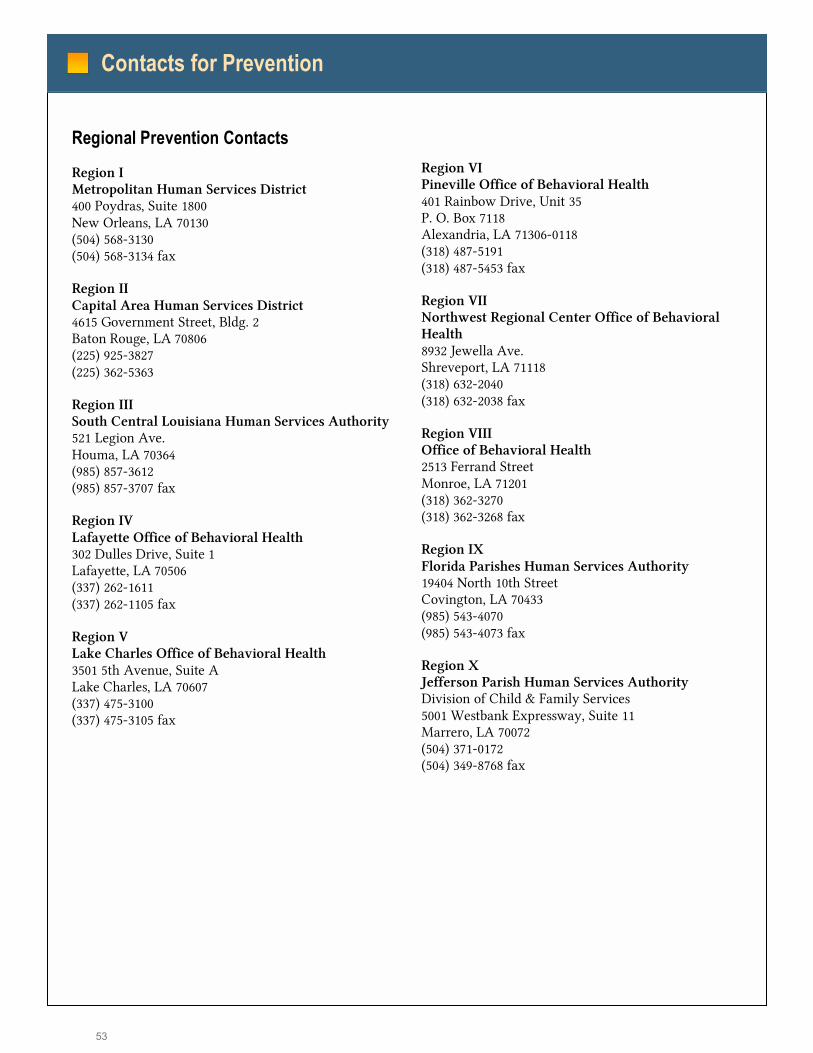
53
Region VI Pineville Office of Behavioral Health 401 Rainbow Drive, Unit 35 P. O. Box 7118 Alexandria, LA 71306-0118 (318) 487-5191 (318) 487-5453 fax
Region VII Northwest Regional Center Office of Behavioral Health 8932 Jewella Ave. Shreveport, LA 71118 (318) 632-2040 (318) 632-2038 fax
Region VIII Office of Behavioral Health 2513 Ferrand Street Monroe, LA 71201 (318) 362-3270 (318) 362-3268 fax
Region IX Florida Parishes Human Services Authority 19404 North 10th Street Covington, LA 70433 (985) 543-4070 (985) 543-4073 fax
Region X Jefferson Parish Human Services Authority Division of Child & Family Services 5001 Westbank Expressway, Suite 11 Marrero, LA 70072 (504) 371-0172 (504) 349-8768 fax
Regional Prevention Contacts
Region I Metropolitan Human Services District 400 Poydras, Suite 1800 New Orleans, LA 70130 (504) 568-3130 (504) 568-3134 fax
Region II Capital Area Human Services District 4615 Government Street, Bldg. 2 Baton Rouge, LA 70806 (225) 925-3827 (225) 362-5363
Region III South Central Louisiana Human Services Authority521 Legion Ave. Houma, LA 70364 (985) 857-3612 (985) 857-3707 fax
Region IV Lafayette Office of Behavioral Health 302 Dulles Drive, Suite 1 Lafayette, LA 70506 (337) 262-1611 (337) 262-1105 fax
Region V Lake Charles Office of Behavioral Health 3501 5th Avenue, Suite A Lake Charles, LA 70607 (337) 475-3100 (337) 475-3105 fax
Contacts for Prevention
54
National Contacts & Resources
Center for Substance Abuse Prevention (CSAP) prevention.samhsa.gov
Office of Juvenile Justice and Delinquency Prevention (OJJDP) www.ojjdp.ncjrs.org
Safe and Drug Free Schools and Communities Program U.S. Department of Education www.ed.gov/offices/OESE/SDFS
Substance Abuse and Mental Health Services Administration (SAMHSA) Prevention Platform preventionplatform.samhsa.gov/
Social Development Research Group, University of Washington depts.washington.edu/sdrg/
National Clearing House for Alcohol & Drug Information www.health.org
Southwest Center for the Application of Prevention Technology www.swcapt.org
For more information about this report or the information it contains, please contact the Louisiana Department of Health and Hospitals Office of Behavioral Health (OBH), Addictive Disorders Services: (225) 342-1079
State Contacts
DHH/Office of Behavioral Health 628 North 4th Street, Fourth Floor P. O. Box 4049 Baton Rouge, LA 70802-4049 (225) 342-2540 phone (225) 342-3931 fax www.dhh.state.la.us/oada
Governor's Office Office of Community Programs State Office Building 150 North Third Street, 1st Floor Baton Rouge, LA 70802 (225) 342-3423 / (800) 827-5885 (225) 342-7081 fax www.ladrugpolicy.org
Louisiana Office for Behavioral Health Caring Communities Youth Survey Partners in Prevention www.dhh.state.la.us/oada
Louisiana Department of Education Division of School and Community Support 1201 North Third Street Baton Rouge, LA 70802 (225) 342-3338 phone (225) 219-1691 fax www.louisianaschools.net
This LCCYS was conducted for the State of Louisiana by Cecil J. Picard Center for Child Development and Lifelong Learning, University of Louisiana at Lafayatte (337) 482-1567 www.picardcenter.org
This Report was Prepared for the State of Louisiana by Bach Harrison, L.L.C. 116 South 500 East Salt Lake City, Utah 84102 (801) 359-2064 www.bach-harrison.com
Contacts for Prevention