dfma - diva-portal.org728131/fulltext01.pdf · dfma is a beneficial method for vcc to use, how dfma...
TRANSCRIPT

I
DFMA A Methodology Study and Method Development DFMA En Metodikstudie och Metodutveckling
Bachelor Degree Project in Integrated Product Development G2E 30 ECTS Spring term 2014 Markus Dauksz Olle Torkelsson Supervisor: Dan Högberg Examiner: Peter Thorvald

II
Certificate of Originality
This thesis has been submitted 2014-06-18 by Markus Dauksz and Olle Torkelsson to
Bachelor Degree Project in Integrated Product Development.
We certify that all material in this bachelor degree project report which is not our own work has
been identified and that no material is included for which a degree has previously been conferred on
me.
Markus Dauksz Olle Torkelsson

III
Abstract
Volvo Cars Corporation (VCC) is devoted to Lean and Six Sigma, and has lately considered an imple-
mentation of Design for Manufacturing and Assembly (DFMA) with the purpose of improving their
product design process and production. The goal for this project work is therefore to investigate if
DFMA is a beneficial method for VCC to use, how DFMA can be used and suggest a DFMA method.
A literature study is performed as a starting point to understand DFMA methods and its possibilities.
Scientific articles, technical books and online sources is used during the study in order to gather in-
formation regarding DFMA implementations, application areas, approaches and potential risks that
need to be eliminated for a successful implementation.
In order to map the product development and manufacturing processes of VCC interviews are per-
formed. The interviews also gathered information regarding what VCC employees thinks of DFMA
and how they wish to use it. This information is compiled into a demand specification where the de-
mands are weighted after importance by the interviewees.
After the pre-study, three idea generation sessions is performed with three different focus groups.
The generated ideas are then evaluated and classified. The remaining ideas are classified with the
purpose of enabling the possibility to use a morphological chart to build whole concepts from the
single ideas.
Three concepts are chosen amongst the generated concepts. These concepts are then evaluated
against the weighted demand specification. The concept considered most suitable is further devel-
oped which resulted in a proposed DFMA method for VCC. A case study on a product is performed in
order to communicate, test and evaluate the final DFMA method.
The project is rounded off with discussions regarding DFMA and the suggested method from sustain-
ability point of view and how to motivate usage. All results and discussions from the project are
handed over to the company, enabling further research on a possible implementation of DFMA in the
organization.

IV
Sammanfattning
Volvo Cars Corporation arbetar hängivet efter metoderna Lean och Sex Sigma och har avsikt att im-
plementera Design for Manufacturing and Assembly (DFMA) i syfte att förbättra deras produkt- och
produktutvecklingsprocess. Målet med detta arbete är att undersöka om DFMA är en värdefull me-
tod för VCC att använda och hur metoden kan tänkas användas och implementeras inom organisat-
ionen.
Som utgångspunkt för att förstå DFMA metoden och dess möjligheter genomförs en litteraturstudie.
Under studien granskades aktuella vetenskapliga artiklar, tekniska böcker och webbkällor i syfte att
samla information om DFMA-implementeringar, användningsområden, tillvägagångsätt och potenti-
ella risker som behövs elimineras för en lyckad implementation av metoden.
Vidare utförs intervjuer i syfte att kartlägga produktutvecklings- och tillverkningsprocessen samt
samla information om hur anställda ställer sig till, och önskar använda DFMA. Denna information
sammanställs sedan till en kravspecifikation där kraven i sin tur viktas av intervjuobjekten efter hur
viktiga de anses vara.
Tre idégenereringssessioner utförs därefter med tre olika fokusgrupper. Dessa idéer gallras sedan ut
och klassificeras för att sedan kombineras med hjälp av en morfologisk tabell i syfte att bygga kon-
cept av de enskilda idéerna.
Tre koncept väljs ut bland de genererade koncepten. Dessa koncept utvärderas sedan mot varandra
med kravspecifikationen som bedömningsskala. Det koncept som bedöms som mest lämpligt vidare-
utvecklas och en föreslagen metod för VCC tas fram. För att testa och illustrera den slutgiltiga meto-
den genomförs en fallstudie på en produkt.
Arbetet rundas av med diskussioner kring DFMA och den föreslagna metoden ur både hållbarhets-
synpunkt och motivationssynpunkt. Samtliga resultat och diskussioner överlämnas sedan till företa-
get för att möjliggöra vidare undersökningar kring en eventuell implementation av DFMA.

V
The Authors Would Like to Thank
We would like to thank our supervisors at the University of Skövde - Dan Högberg and Lennart Ljung-
berg for their participation and guidance during this thesis.
We would also like to thank the supervisors at Volvo Cars Engine – Bengt Wirfelt and Håkan Sterner
for their cooperation, valuable input and for the opportunity to perform our final project work at
Volvo Cars.
We would also like to thank Volvos employees for their time, input and opportunity to hold inter-
views to collect their knowledge.
Finally we would like to thank our friends and fellow students for the support and the opportunity to
lively discussions.

VI
List of acronyms
DFMA – Design for Manufacturing and Assembly
DFA – Design for Assembly
DFA2 (or DFAA) – Design for Automatic Assembly
DFA S2 – Design for Assembly Skövde 2
DFM – Design for Manufacturing
DFE – Design for Environment
FMEA – Failure Mode Effect Analysis
P-FMEA – Production (or Process) FMEA
D-FMEA – Design FMEA
VCC – Volvo Cars Corporation
VCE – Volvo Cars Engine
VCMS – Volvo Cars Manufacturing System
QAM – Quality Assurance Matrix
DFX – D g “X”
BHAG – Big Hairy Audacious Goals
R&D – Research and Development

VII
Table of Contents
1 Introduction .............................................................................................................................................. 1
1.1 Goal and Purpose ............................................................................................................................ 1
1.2 Objectives........................................................................................................................................ 1
1.3 Initial Strategy ................................................................................................................................. 1
2 Pre-study ................................................................................................................................................... 3
2.1 Literature Study ............................................................................................................................... 3
Concurrent Engineering and DFX ...................................................................................................... 3 2.1.1
Presentation of DFA .......................................................................................................................... 4 2.1.2
Presentation of DFM ......................................................................................................................... 5 2.1.3
Presentation of DFMA ....................................................................................................................... 7 2.1.4
Presentation of DFE and its Connections to DFMA ......................................................................... 10 2.1.5
Presentation of Lean and its Connections to DFMA........................................................................ 11 2.1.6
Presentation of FMEA and its Connections to DFMA ...................................................................... 11 2.1.7
DFMA from a Sustainable Perspective ............................................................................................ 12 2.1.8
Motivating Execution of DFMA ....................................................................................................... 13 2.1.9
Existing DMFA Software .............................................................................................................. 13 2.1.10
2.2 Summary of the Literature Study ................................................................................................... 14
2.3 Empirical Study and Data Collection .............................................................................................. 15
International DFMA Implementation .............................................................................................. 15 2.3.1
Initial Strategy for Interviews .......................................................................................................... 16 2.3.2
Interview Results ............................................................................................................................. 17 2.3.3
2.4 Demand Specification .................................................................................................................... 20
Breaking Down Employees Wishes into Metrics and Approaches .................................................. 20 2.4.1
Importance of Wishes ..................................................................................................................... 21 2.4.2
Weighted Demand Specification ..................................................................................................... 21 2.4.3
3 Concept Generation ................................................................................................................................ 23
3.1 Idea Generation ............................................................................................................................. 23
First Brainstorming Session ............................................................................................................. 24 3.1.1
Second Brainstorming Session ........................................................................................................ 24 3.1.2
Third Brainstorming Session ............................................................................................................ 24 3.1.3
3.2 Idea Selection ................................................................................................................................ 25
Pick Chart ........................................................................................................................................ 25 3.2.1
3.3 Further Development .................................................................................................................... 26
Morphological Chart........................................................................................................................ 26 3.3.1
3.4 Result of the Morphological Chart and Evaluation......................................................................... 28
Concept: Cross-functional Meeting ................................................................................................. 28 3.4.1
Concept: Software ........................................................................................................................... 28 3.4.2
Concept: Checklist ........................................................................................................................... 28 3.4.3
3.5 Weighted Evaluation of Concepts .................................................................................................. 28
4 Suggested DFMA Method ........................................................................................................................ 30
4.1 Exploration Phase .......................................................................................................................... 30
BHAG ............................................................................................................................................... 30 4.1.1
Pareto Principle ............................................................................................................................... 31 4.1.2

VIII
4.2 Generation Phase .......................................................................................................................... 32
4.3 Evaluation Phase ........................................................................................................................... 33
Checklist .......................................................................................................................................... 33 4.3.1
4.4 Communication Phase ................................................................................................................... 35
Cross-functional Meeting ................................................................................................................ 35 4.4.1
Implement in QAM .......................................................................................................................... 36 4.4.2
5 Demonstrating the Suggested Method .................................................................................................... 37
5.1 Exploration Phase .......................................................................................................................... 37
5.2 Generation Phase .......................................................................................................................... 38
5.3 Evaluation Phase ........................................................................................................................... 38
5.4 Communication Phase ................................................................................................................... 38
5.5 Determining if the DFMA Re-design is Sub Optimized ................................................................... 38
6 Conclusion ............................................................................................................................................... 42
6.1 Suggested Method ........................................................................................................................ 42
6.2 Why Volvo Should Implement DFMA ............................................................................................ 43
7 Discussion ............................................................................................................................................... 44
7.1 Problem Specification .................................................................................................................... 44
7.2 Weighted Demand Specification ................................................................................................... 44
7.3 Concept generation ....................................................................................................................... 44
Morphological Chart........................................................................................................................ 44 7.3.1
7.4 Concept evaluation........................................................................................................................ 45
Pick chart method ........................................................................................................................... 45 7.4.1
Weighted Concept Evaluation ......................................................................................................... 45 7.4.2
7.5 FMEA ............................................................................................................................................. 45
7.6 Case Study ..................................................................................................................................... 45
7.7 Time and Planning ......................................................................................................................... 46
7.8 Result ............................................................................................................................................ 46
8 Suggestions for further investigation ....................................................................................................... 47
References ..................................................................................................................................................... 48
Appendices .................................................................................................................................................... 51

1
1 Introduction Volvo Cars Corporation (henceforth VCC) is dedicated to work by the Lean philosophy and Six Sigma
to ensure that VCC have a strong competitiveness on the market. The company is continuously chal-
lenged by their competitors, which forces VCC to develop and continuously introduce new and more
efficient methods to maintain and improve their competitiveness.
Lean, as VCC is currently working with is mainly about accomplishing more with fewer resources. Six
Sigma is a method aimed to continuously improve the organization, and product quality by minimiz-
ing the defects and variations in the manufacturing process (Groover, 2008).
Volvo Cars Engine (VCE) is a part of VCC and is the promoters for this project work. The thesis mostly
covers Volvo Cars Engine but since interviews have been performed at other departments the com-
pany in the report is referred to as VCC.
Goal and Purpose 1.1VCC have considered implementing a Design for Manufacturing and Assembly (DFMA) method into
their product development process and thereby improve the product design and minimize the pro-
duction costs, lead and cycle time.
The purpose of this thesis is to present DFMA and establish if it is a beneficial method to implement
within VCC’ product development and manufacturing process, investigate different ways to perform
DFMA work and to suggest a DFMA method suitable for VCC.
Objectives 1.2The major tasks carried out in this thesis work are the following:
Suggest a suitable DFMA method for VCC
Perform a case study in order to demonstrate the suggested DFMA method
Describe DFMA, DFA and DFM
Describe DFE, Lean and FMEA and their connections to DFMA
Present international DFMA implementations
Present existing DFMA software
Clarify the product design departments’ influence on the manufacturing process, compo-
nents and environmental impact
Clarify why Volvo Cars Corporation should implement DFMA within its product development
process. What is there for VCC to gain?
What is the impact on VCC if DFMA is implemented with respect to:
o Staff
o Organization
o Costs
o Other
Initial Strategy 1.3This thesis is set up by different main chapters that begin with a short presentation of h ch p ’
contents and the goal with each chapter.
The thesis first outlines the literature study and presents DFMA and other relevant methods and is
followed by an empirical study used to establish the demand specification through interviews and
other personal communications. The pre-study is formed by the literature and empirical study.

2
The generation phase is performed after the pre-study and aims to search for ideas on how and
when in a design process DFMA can be implemented and used. The generation phase contains con-
vergent activities but primarily divergent activities. The outcome of the generation phase is a sug-
gested DFMA method.
The thesis is rounded up with a conclusion and discussion regarding the suggested method and the
thesis. Lastly, the thesis contains suggestions for further development for VCC regarding a DFMA
method.
Th h g c b p N g l C ’ u g m l (2008) bu c m c m-
plex. This is because an early brainstorming session is performed in the research phase before the
pre-study is completed. The literature study representing an explorative design activity is also an
ongoing part of the thesis since new information constantly is needed.

3
2 Pre-study The objective with the pre-study is to map VCC’ p uc l pm m u c u g p c
and to gather necessary information needed in order to develop a demand specification that later
came to function as control measurements when evaluating different DFMA methods before select-
ing the most appropriate one in this context.
The pre-study phase is divided into three main areas – literature study, collecting of empirical data,
and interviews and discussions through focus groups.
Literature Study 2.1This following section presents DFA, DFM, DFMA, DFE (acronyms will be explained in later chapters)
and its connections to DFMA, Lean and its connections to DFMA, and FMEA and its connections to
DFMA.
The literature study aimed to gather as much information regarding international DFMA implementa-
tions, DFMA, DFA, DFM, DFE and other methods that can influence the final result.
The literature study resulted in deeper knowledge on how and why methods and tools are used.
Information on international DFMA implementations and the following results is also gathered along
with potential risks, effects, root causes and how to avoid the problems when implementing DFMA
within an organization.
Concurrent Engineering and DFX 2.1.1Th c mp ’ m c c mp u h b qu pm ch qu
available in order to produce well designed high quality products at lower prices and in less time
(Parsaei & Sullivan, 1993). Products fail to take shares in the market for several different reasons.
According to Corbett, Dooner, Meleka and Pym (1991) the reasons are; poor quality, poor timing,
poor communications, unexpected competition, insufficient investment and high product cost.
In order to minimize production costs and development time, companies have been moving from
“Traditional Engineering” towards “Concurrent Engineering” (Erixon, 1998) in order to work integrat-
ed with product development. Traditional Engineering or “Over-the-Wall pp ch” as it might be
referred to (Boothroyd, Dewhurst & Knight, 2011) is the organizational way to work when the pro-
cesses of development occurs after each other (Erixon, 1998). Traditional Engineering is, according to
Boothroyd et al. (2011), c mp bl h u “W g , u bu l ”, wh g
hand over concepts to the manufacturing department who has to deal with occurring problems since
manufacturing engineers was not part of the design process. Concurrent Engineering is a systematic
approach towards integrated product development where work processes overlap and cross-
disciplinary teams of designers and engineers work in parallel (Eskilander, 2001) to minimize the de-
velopment time and time-to-market. Product development speed is important for project organiza-
tions to be efficient (Ulrich & Eppinger, 2012). The ability to coordinate tasks and activities between
individuals from different disciplines and to quickly solve conflicts allows the teams to develop prod-
ucts within short time. Concurrent engineering teams need analysis tools to study and evaluate de-
signs from a manufacturing and cost-efficient perspective (Boothroyd et al., 2011).
Design for X (henceforth DFX) is the collective name used for goal focused activities organizations use
with the purpose to focus specifically on different phases of a products life cycle or a specific proper-
ty (e.g., cost and environmental effects) (Eskilander, 2001). Two of the most common of these DFX-
methods are Design for Assembly (DFA) and Design for Manufacturing (DFM). One possible explana-
tion for this is that many of the DFX-methods are rather young and are not spread as wide as others.

4
Figure 2.1 shows how DFX-methods are linked together in hierarchy based on their focus areas (Eski-
lander, 2001).
Figure 2.1. The hierarchical link between DFA, DFM among other DFX-methods (Eskilander, 2001)
According to Eskilander (2001) DFX-methods are w cu h g ’ p
a common language for company departments, which can simplify the communication and collabora-
tion of developing teams.
Presentation of DFA 2.1.2Design for Assembly (henceforth DFA) is a method used to analyse and evaluate designs in order to
simplify the assembly operations and thereby reduce assembly time (Ma & Kim, 2008). DFA is accord-
ing to Ma and Kim applied in the early stages of the design process. Boothroyd et al. (2011) states
that DFA should be considered at all stages, but especially during the early stages since the design
team that develop concepts should give serious consideration to the simplification of products from
an assembly perspective. Ideal DFA is hard to achieve since DFA is used in the early stages a lot of
information regarding the project is incomplete (Ma & Kim, 2008).
Boothroyd et al. (2011) have developed a list of basic DFA guidelines to follow whilst designing prod-
ucts. The guidelines can be divided into two areas – Guidelines for part handling, and Guidelines for
insertion and fastening.
The design guideline for part handling is set up by five points;
Try to design parts with end-to-end-, and rotational symmetry along the axis of insertion
Parts that cannot be designed symmetric should be designed clearly asymmetric
Design in features that prevent parts from jamming, nest or stacked when stored in bulk
Avoid using features that enable parts to tangle when stored in bulk
Avoid using parts that are slippery, sticky, flexible, very small, very large or that are hazard-
ous to the handler (i.e., sharp, splinter easily, etc.)

5
The design guideline for insertion and fastening is set up by two points;
Design parts so there is little or no resistance when inserting. Provide chamfers to simplify
the insertion of two mating parts. Distinct clearance should be given but one should also be
careful to avoid clearances that can result in parts jamming during insertion.
Standardize common parts, processes and methods for all models and also for other product
lines to enable the use of higher volume processes – that normally result in lower product
cost.
DFA index (or Design Efficiency) is a method to estimate the efficiency of assembly (Ulrich & Epping-
er, 2012). The index is a ratio between minimum theoretical numbers of parts and estimated total
assembly time, multiplied by three seconds (equation 2.1). The three seconds is the theoretical min-
imum time required to handle a part that is easy to grasp, requires no particular orientation and does
not require any effort to insert.
(( ) ( )
According to Ulrich and Eppinger (2008) three questions needs to be asked in order to determine the
minimum theoretical number of parts:
Does the part need to move relative to the rest of the assembly? Small motions that can be
accomplished using compliance (e.g., elastic hinges of springs) do not count
Must the part be made of a different material from the rest of the assembly for fundamental
physical reasons?
Does the part have to be separated from the assembly for assembly access, replacement or
repair?
Note that Ulrich and Eppinger (2012) do not distinguish between manual and automatic assembly.
DFAA (or DFA2) is, according to Eskilander (2001), a qualitative method to ease automatic assembly
where automatic assembly is the kind of assembly that can be performed without human interaction.
After performing the DFA2 evaluation a DFA2-index can be calculated via equation 2.2 (Eskilander,
2001).
[ ]
With DFA2 being a qualitative method means that the evaluation gives an answer on how well the
product fits for assembly while a quantitative evaluation (e.g. DFA) give answers that can be quanti-
fied (i.e., time, part count and cost) (Eskilander, 2001).
Presentation of DFM 2.1.3Design for Manufacturing (henceforth DFM) is according to Boothroyd et al. (2011) a method used to
ease the manufacturing of a product and make the manufacturing more efficient by adapting the
products design to manufacturing conditions. The DFM method starts during the conceptual design
phase and ends during the detailed design phase (Fabricius, 2003).

6
Manufacturability is, according to Fabricius (2003), measured in seven different ways. The reason
that manufacturability is set up by these seven points is to allow a complete evaluation and minimize
the chances of over-the-wall engineering. The seven measurement points are:
Direct and indirect production costs (Labour, materials, quality control, logistics, purchase,
etc.)
Quality (Ability to match products with the specification, with simple quality control, rework,
waste and scrap)
Flexibility (Easy to make changes in the manufacturing output)
Risk (The largest manufacturing risk should be in the product design)
Lead time (Reach low manufacturing lead time)
Efficiency (Efficiency in the use of personnel and resources)
Environmental effects (Environmental consequences of the manufacturing process)
Designers have a large responsibility when DFM is performed. A designer can for example decide to
use two different screws on two different places and thereby create increased workload for other
departments such as logistics and purchasing (Fabricius, 2003).
Fabricius (2003) states that the idea of DFM is to improve the feedback from the manufacturing de-
partment to the design department in order to improve the awareness of manufacturability during
the design phase. The increased manufacturability of a product can be obtained in different ways.
Example of approaches: redo the product design using different methods, use a cross-functional
team (concurrent engineering), use computer tools for early cost estimation, use design procedures
that aims at improving product manufacturability (Fabricius, 2003). According to Ulrich and Eppinger
(2012) DFM is one of the most integrative processes in the product development and therefore it is
required that a cross-functional team perform DFM.
The DFM method is based largely on common sense, according to Corbett, Dooner, Meleka and Pym
(1991). It is an easy method that is quickly accepted by most organizations. The challenge lies instead
m g h m h h x g c mp ’ p l c m u . Th is DFM a
method that needs change in how manufacturing businesses are run (Corbett et al., 1991).
DFA and DFM are methods that are strongly connected since DFA often is considered as a step in
DFM according to Ulrich and Eppinger (2012), and describes the DFM process in five iterative steps;
reduce the costs of components, reduce the costs of assembly, reduce the costs of supporting pro-
duction, consider the impact of DFM decisions on other factors and recomputed the manufacturing
costs (Figure 2.2).

7
Figure 2.2. The five iterative steps of the DFM process according to Ulrich and Eppinger (2012)
Presentation of DFMA 2.1.4DFMA is a method where DFA and DFM are used together in a process. According to Otto and Wood
(2001) DFMA is the most effective method to reduce product cost and summarize the method as:
The basic techniques to improve design are mostly a collection of common-sense rules
One can determine the most effective approach for re-design through stacked-up cost analy-
sis
Modularize to minimize part count, design for top-down insertion with alignment features
Think thoroughly and simplify the fabrication difficulty of each feature on every part
In order to make a product easy to manufacture it needs simple parts. Simple parts are easy to man-
ufacture but has relatively low functionality. So in order to make a product easy to manufacture
many simple parts will be needed in order to reach the functionality requested, but the assembly will
be more complex when more parts are needed. In order to make a product easy to assemble the
product needs few parts with high functionality – which is more complex to manufacture. Therefore
are DFM and DFA contradicting each other. But this is rarely a problem since it is almost always bet-
ter to simplify a design by eliminating parts (Salustri, 2001).
Companies all over the world are embracing the DFMA method. Case studies suggest that DFMA can
result in large savings throughout an organization (Curtis, 1997).
In the 1980’ Motorola introduced their MX Converta Com (a radio for base remote communication).
The product had 217 distinct parts and required a total of 2700 seconds of assembly time. The prod-
uct was later on re-designed using DFMA methods and managed to reduce the part count to 97 with
a total of 1350 seconds of assembly time which resulted in an 87% reduction in direct cost (Otto &
Wood, 2001).
8
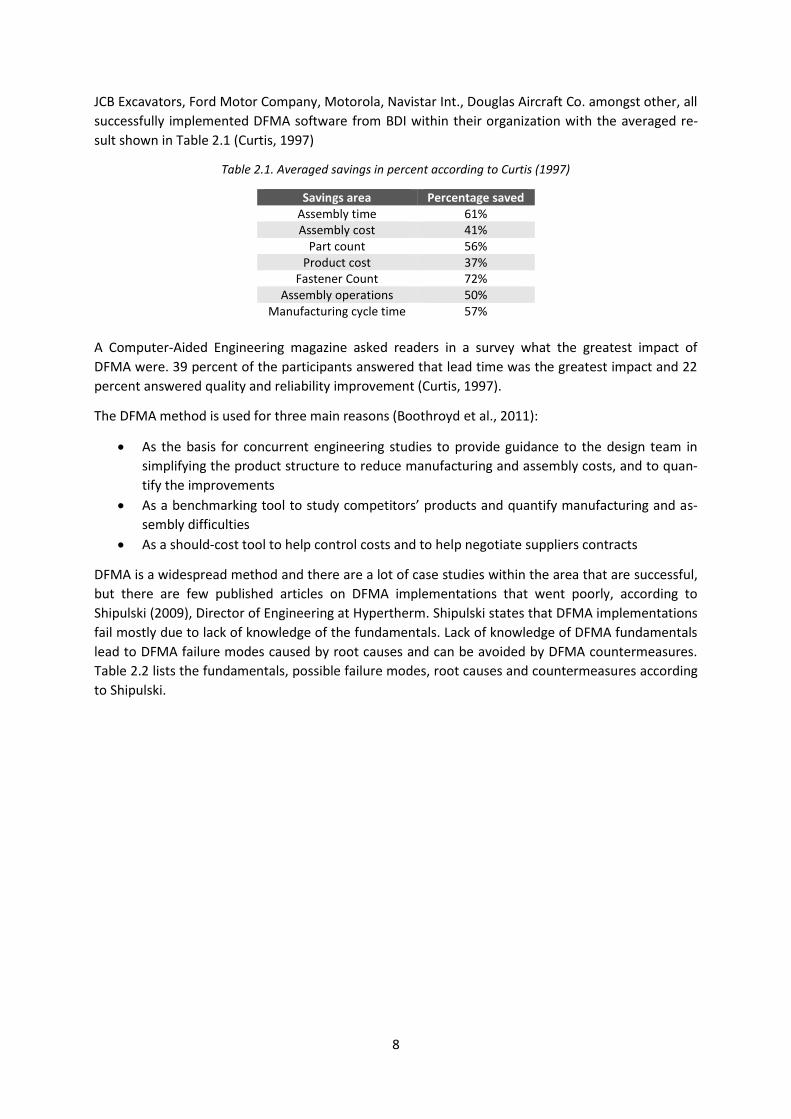
JCB Excavators, Ford Motor Company, Motorola, Navistar Int., Douglas Aircraft Co. amongst other, all
successfully implemented DFMA software from BDI within their organization with the averaged re-
sult shown in Table 2.1 (Curtis, 1997)
Table 2.1. Averaged savings in percent according to Curtis (1997)
Savings area Percentage saved Assembly time 61% Assembly cost 41%
Part count 56% Product cost 37%
Fastener Count 72% Assembly operations 50%
Manufacturing cycle time 57%
A Computer-Aided Engineering magazine asked readers in a survey what the greatest impact of
DFMA were. 39 percent of the participants answered that lead time was the greatest impact and 22
percent answered quality and reliability improvement (Curtis, 1997).
The DFMA method is used for three main reasons (Boothroyd et al., 2011):
As the basis for concurrent engineering studies to provide guidance to the design team in
simplifying the product structure to reduce manufacturing and assembly costs, and to quan-
tify the improvements
A b chm g l u c mp ’ p uc qu m u c u g s-
sembly difficulties
As a should-cost tool to help control costs and to help negotiate suppliers contracts
DFMA is a widespread method and there are a lot of case studies within the area that are successful,
but there are few published articles on DFMA implementations that went poorly, according to
Shipulski (2009), Director of Engineering at Hypertherm. Shipulski states that DFMA implementations
fail mostly due to lack of knowledge of the fundamentals. Lack of knowledge of DFMA fundamentals
lead to DFMA failure modes caused by root causes and can be avoided by DFMA countermeasures.
Table 2.2 lists the fundamentals, possible failure modes, root causes and countermeasures according
to Shipulski.

9
Table 2.2. The four fundamentals and what lack of knowledge of them lead to, what the failure modes are
caused by and how to avoid the failure modes, according to Shipulski (2009).
No. Fundamentals Lead
to
Failure modes Cau
sed
by
Root causes Avo
ided
by
Countermeasures 1 Design must change
or you are not using DFMA
Design Engineering not part of DFMA efforts
Design engineering re-sources are overbooked
All product development projects are late
Engineering leaders think DFMA takes too long
Review all DFMA proposals and plans to make sure design engineering re-sources are allocated to make the neces-sary design changes
2 Savings from DFA are significantly larger than from DFM
DFM projects are done instead of DFA projects
Design engineering re-sources are overbooked
All product development projects late
DFM savings are easy to measure and predict
DFA savings are difficult to measure and predict
Leadership wants to be-lieve that DFM can be done without design engineering resources
Find an engineering leader with a radical cost reduction goal and help them use DFA on their project
3 Irresponsible DFM bankrupts suppliers
Irresponsible DFM (DFM without chang-ing the design)
Significant cost reduction goal placed on manufactur-ing
Leadership wants to be-lieve that DFM can be done by the suppliers
Leadership wants to be-lieve that the DFM banner can be used to take profits from the suppliers
Secure engineering resources for DFM ’
4 DFMA requires sys-tems thinking
DFMA proposals and plans lack systems thinking
Systems thinking is not a formalized part of DFMA training
Learn how to use systems thinking with DFMA

10
Presentation of DFE and its Connections to DFMA 2.1.5Design for Environment (henceforth DFE) is defined as; systematic consideration of design perfor-
mance with respect to environmental health, and safety objectives over the full product life cycle
(Fiksel, 1996). DFE is a method used to analyse and minimize the environmental impact of products
by reducing the usage of non-renewable energy and materials as well as synthetic and inorganic
emissions and other toxic wastes at the end of the lifecycle (Ulrich & Eppinger, 2012).
The first step towards DFE was taken in the early 1970s (Ulrich & Eppinger, 2012), but gained mo-
mentum first after 1987 when the World commission on environmental and development defined
sustainable development in the Brundtland Report (Fiksel, 1996). However, the concept of DFE was
not established until 1992.
Just like DFMA, the practice of DFE can maintain or even improve the quality and cost of a product
while reducing the environmental impacts of the product (Ulrich & Eppinger, 2012). The environmen-
tal impacts falls under two categories - energy and materials, which can be further divided and speci-
fied (Ulrich & Eppinger, 2012).
According to Fiksel (1996), there are a number of overlapping disciplines that regards DFE methodol-
ogy, which includes:
Occupational health and safety
Consumer health and safety
Ecological integrity and resource protection
Pollution prevention and toxic use reduction
Transportability (safety and energy use)
Waste reduction or minimization
Disassembly and disposability
Recyclability and remanufacturing
Up to 80 percent of the lifecycle costs are determined during the design stages, according to Fiksel
(1996), which implies implementation of DFE early in the process and thereby reduce the environ-
mental impact but should not be isolated just to this but used throughout the whole development
and manufacturing process (Ulrich & Eppinger, 2012).
Ulrich & Eppinger (2012) describes the DFE as an iterative process with the seven steps bellow:
Identify the driving forces of DFE, both internal and external setting environmental goals and
set up a DFE team.
Identify potential environmental impacts during the products life cycle.
Select which guidelines to use in order to help the product design team make early decisions
about DFE.
Apply guidelines chosen earlier in the process onto the product design.
Evaluate the environmental impacts throughout the life cycle.
Improve the product designs so that the environmental impacts are minimized.
Reflect about of how well the DFE was implemented, if the environmental impact can be re-
duced even further.
According to Ulrich & Eppinger (2012), effective implementation of DFE can result in improves prod-
uct quality and cost while environmental impacts are reduced.

11
Presentation of Lean and its Connections to DFMA 2.1.6The general goal with Lean production is to accomplish more with fewer resources such as workers,
equipment, time, space and materials (Groover, 2008). Manufacturing can according to Groover be
divided into three activity categories depending on what value it adds to the product:
Value-adding activities - Processing and assembly operations that modify the product in a
way that the costumers value
Auxiliary activities - Activities that support the value-adding but does not contribute with
value for the customers. Auxiliary activities are e.g. loading and unloading a machine
Wasteful activities - Activities that does not support the value-adding or add value to the
product themselves. If these activities was not performed no disadvantageous effect will
come to the product
Muda is one area within Lean manufacturing and is aiming to eliminate the wasteful activities (Shao-
bo, Chunhua & Hongliang, 2009) and thereby perform the work in less time. A number of techniques
can be used to eliminate wasteful activities (Groover, 2008);
Just-in-time delivery of parts
Involve workers more and delegate more responsibility
Continuous improvement in products and manufacturing operations
Reduce setup times to allow smaller batches
Stopping the process when something is wrong
Error prevention in production (e.g. incorrect fixture)
Total production maintenance to avoid machine breakdowns that interrupt production oper-
ations.
So both Muda within Lean manufacturing and DFMA aim to eliminate wasteful activities in order to
increase the product quality and can therefore be used simultaneously in order to reach higher cost
savings.
Presentation of FMEA and its Connections to DFMA 2.1.7Failure Mode and Effect Analysis (henceforth FMEA) is an analytical method used to systematic iden-
tify possible failures, determine consequences, causes and occurrence with the goal to eliminate
failures before they occur (Pahl, Beitz, Feldhusen & Grote, 2007).
The method is often used during the development of new products. For this thesis there are two
different interesting types of FMEA. The first is Design FMEA (henceforth D-FMEA) which is used to
verify whether the product functions set out in the requirements list are fulfilled. The second is Pro-
cess or Production FMEA (Henceforth P-FMEA) which is used to establish if the planned production
process can produce the required product characteristics (Pahl et al., 2007).
A FMEA can be made in several different ways. The reason both P and D-FMEA are interesting for this
thesis is because they can be used in order to determine what parts can be hard to assemble or
manufacture and thereby acknowledge the design flaws and encourage re-design.
12
DFMA from a Sustainable Perspective 2.1.8Sustainable development can be based on three major components – Ecological, Economic and Cul-
tural (also referred to as social or human) sustainability (Thorpe, 2008).
Ecological sustainability aims to preserve the earth, its ecosystems and their reproduction ability
along with to minimize the human impact on nature and at the same time sustain a good health for
the people. Cultural (or social) sustainability aims to build a long term dynamic and stable society
where basic human social needs like well-being, standard of living and education is fulfilled. Econom-
ic sustainability aims to preserve human and material resources over a long term and at the same
time provide a reasonable profit for sold products (Thorpe, 2008).
The three components of sustainable development can work hand in hand or as an effect of each
other - if the willpower exists. For example; if a company changes the design of a product and there-
by use less material and machine time money can be saved – and if that money is used to either low-
er the final prize of the product, expand the organization, shortens the workday or increases salaries,
both ecological, economic and social sustainability is fulfilled. But the three components can also
draw attention from the others because of the human short-termism (Thorpe, 2008)
2.1.8.1 DFMA from an Ecological Sustainability Perspective DFMA is a method used to eliminate parts and ease the manufacturing in both cost and time through
fewer and smarter manufacturing steps and a lesser material spill. This clearly indicates that DFMA
goes hand in hand with the ecological sustainability component since lesser materials are needed
and a shorter time in a machine reduces the amount of energy needed for manufacturing. Both DFA
and DFM support ecological sustainability.
2.1.8.2 DFMA from an Economic Sustainability Perspective One advantage with a DFMA method is that it can and should be used by the purchasing department
to negotiate costs with the suppliers and reach the most profitable deal for the company (Boothroyd
et al., 2011), which improves the organizations economical profit. But keeping in mind that economic
sustainability also aims to preserve the human and material resources it is needed that more actions
are taken in addition to reaching a higher profit.
For example; if the increased profit in the company is spent by expanding the organizations via new
employment more unemployed people gets put to work which later on results in a higher tax income
for the government.
2.1.8.3 DFMA from a Social Sustainability Perspective DFMA is a method with a major focus on assemblability and the ease of assembly can result in more
ergonomic workstations which increase the well-being for the assemblers. A lower assembly time
also increases the profit within the organization which the company later can use to introduce short-
er working hours which also results in increasing the well-being amongst the employed.

13
Motivating Execution of DFMA 2.1.9There are many ways to motivate people to work and perform well, one of the most common moti-
vator is money. A typical motivation scheme involves money as a trade for performing a specific task,
which motivates to perform the task.
This motivation scheme of bonuses works fine as long as the task involves only mechanical skills,
(higher pay leads to better performance). But once the task calls for even elementary cognitive skills
larger rewards somehow leads to poorer performances according to Pink (2010), i.e. rewards does
not work the same way when trying to motivate creativity as for mechanical skills. Not only does it
not work, it has been shown that higher incentives lead to poorer performance, so in other words;
bonuses are counterproductive when it comes to motivating creativity Pink (2010). Money is alt-
hough a motivator but the best use of it as a motivator is to give enough to take the issue of money
off the table.
In addition of money there are three factors that motivates and leads to better performances and
personal satisfaction Pink (2010). The three factors of motivation are:
Autonomy- the desire to be self-directed
Mastery – the desire to get better at things
Purpose – that the task leads to improve things
The first factor autonomy (the desire to be self-directed) collides with the traditional notions of man-
agement. This collision between a desire to be self-directed and traditional management can easily
result in a lack of engagement in the work. If engagement is what you seek, self-direction is better –
Pink (2010). This factor is limited inside a method like DFMA at a corporation where the work must
lead to something that benefits the company in first hand but does not have to prohibit self-direction
within the limits of DFMA-methods.
The second factor mastery (the desire of develop and getting better at things) does not have to col-
lide with the principles of DFMA as long as the employees feels like they can develop and get better
at using the tools of DFMA.
The third factor purpose (task leads to improvement) is about motivating the employees to be crea-
tive while using DFMA in the development process. In order to be creative the employees must see
the purpose and understand that it leads to better products. The main purpose of implementing
DFMA is to reduce costs and develop better products, therefore in this case the employees must feel
like the methods of DFMA leads to a reduction of product costs and better products.
To motivate usage of a method or a system it should be usable. Usability is according to Löwgren
(1994) a result of relevance, efficiency, attitude and learnability, also called the REAL approach. This
REAL approach includes:
Relevance - H w w ll h u ’
Efficiency - How efficient the users can carry out their tasks
Attitude - The subjective feelings the users feel towards the system/ method
Learnability - How easy it is to learn the system/ method for initial use and remember the skills
over time
Existing DMFA Software 2.1.10A series of support software have been developed and two of these are according to Otto and Wood
(2001) DFMA® by Boothroyd Dewhurst Inc. and SEER for Manufacturing by Galorath.

14
2.1.10.1 DFMA® by Boothroyd Dewhurst Inc. The DFMA software pack by BDI includes DFM Concurrent Costing and DFA Product Simplification.
The DFA software enables the user to estimate the difficulty of assembly, benchmark existing prod-
ucts, integrate design with manufacturing and support in decision making.
The DFM software enables the user to perform a highly accurate cost estimation, benchmark the
g w h c mp ’ p uc l p c -negotiation aid.
The DFM software complements the DFA software so engineers can reduce the assembly cost of a
product before establishing the cost of producing the product with the new design and later on com-
pare it to competitors.
2.1.10.2 SEER for Manufacturing by Galorath SEER for Manufacturing (Henceforth SEER) from Galorath is a software that enables organizations to
p m z b h u c l g c p uc . Th w p “ h ul -c ” gu e-
lines in order to reduce bid preparations and error rates when negotiating with subcontractors.
SEER is used to enable users in engineering, industrial design and manufacturing to evaluate process
options and other factors as ease of assembly, availability of parts, materials selection and failure
rates. SEER covers a broad set of manufacturing processes such as: machining, moulding, casting,
forging, finishing, composites, mechanical assembly, and fabrication (Galorath, 2011).
Galorath reached an agreement with Dassault Systems to integrate SEER with the CAD systems CATIA
v5 and v6. This integration allows companies to initially model and test manufacturing processes and
trade-offs during the earliest and most preliminary stages of design (Galorath, 2014).
Summary of the Literature Study 2.2The literature study was performed in order to gather information and deeper knowledge about
DFMA, DFA, DFM, DFE and other methods that could affect the final result.
DFA is a method used to simplify the design or eliminate parts in order to simplify the assembly op-
erations and thereby reduce assembly time. DFA should be considered during the whole product
development process but especially in the early stages. Boothroyd, Dewhurst and Knight developed a
basic list of guidelines that can be divided into two areas – Part handling, and Insertion and fastening.
DFM is a method based largely on common sense and used to change a product’s design in order to
ease the manufacturing of a product and make the manufacturing more efficient. The DFM method
starts during the conceptual design phase and ends during the detail design phase. Manufacturability
can be measured in seven different ways. These ways are set up to allow a complete evaluation and
minimize the chances of over-the-wall engineering.
DFM and DFA used together constructs DFMA. DFMA is a method that aims to improve the design of
products in order to simplify the manufacturing and assembly and thereby reduce the product cost.
DFA should be performed before DFM since the large cost reduction lays within eliminating parts.
DFM and DFA can conflict with each other since the simplifying of assembly can result in parts that
are harder to manufacture.
DFMA is widespread and a successful method but an implementation can fail. The reasons for a
DFMA implementation to fail are mostly due to lack of knowledge of the fundamentals. Lack of
knowledge of DFMA fundamentals lead to DFMA failure modes caused by root causes and can be
avoided by DFMA countermeasures (see Table 2.2).

15
DFE is a method used to analyse and minimize the environmental impact of products by reducing the
usage of non-renewable energy and materials as well as synthetic and inorganic emissions and other
toxic wastes at the end of the lifecycle
Just like DFMA, the practice of DFE can maintain or even improve the quality and cost of a product
while reducing the environmental impacts of the product. The environmental impacts falls under two
categories - energy and materials.
Failure mode and effect analysis or FMEA is an analytical method used to systematically identify pos-
sible failure risks, determine consequences, causes and occurrence with the goal to eliminate failures
before they occur. A Design FMEA is used to establish if the functions set out in the requirement list
are fulfilled. A Process or Production FMEA is used to establish if the planned production process can
produce the required product characteristics.
A FMEA can be used in order to foresee what parts can be hard to assemble and thereby
acknowledge design flaws in a product and encourage re-designing.
Muda within Lean manufacturing is aiming to eliminate wasteful activities – just like DFMA. The dif-
ference is that DFMA focuses on the product design while Muda focuses on the production and the
surrounding areas.
Empirical Study and Data Collection 2.3The empirical collection of data aimed to use interviews in order to map VCC’ p uc l pm
and manufacturing processes and to collect wishes regarding how to use DFMA from the employees
of VCC. The empirical study also aimed to gather further information regarding international DFMA
implementations through contacting different companies.
A c c w bl h w h H p h m’ D c E g ing and DFMA advocate Dr. Mike
Shipulski. Dr. Shipulski shared information on how Hypertherm proceeded with a DFMA implementa-
wh l u ’ p uc l pm p c .
The empirical study resulted in eight interviews whereof two were held in focus groups while the
remaining six were held in private. The interviews led a mapping of VCC’ product development and
manufacturing processes. The interviews also collected wishes from VCC employees regarding use of
a DFMA method which later on became useful when setting up a demand specification for develop-
ing a DFMA method proposal.
International DFMA Implementation 2.3.1In order to gather information of how to implement DFMA in a development process, contact was
taken with companies that had already implemented the methodology in their process. Hypertherm
is a company that successfully implemented DFMA (Weber, 2009).
H p h m c mp h g m u c u h w l ’ m c pl m cu g
systems used in a variety of industries (Boothroyd et al., 2011). Hypertherm implemented DFMA in
2003 and has, because of the implementation, decreased labour costs by more than 50 percent (We-
ber, 2009). As a result of the implementation of DFMA Hypertherm is, according to Weber (2009), a
compa h “ u -l ” T , .g. better at applying and profiting from Lean manufacturing.
Hypertherm is out-leaning Toyota by applying lean tools and simplifying product design through
DFMA methods (Weber, 2009). This impressive reputation lead to establishment contact between
the authors of this degree project and H p h m’ c A c Development – Mike
Shipulski.

16
2.3.1.1 DFMA at Hypertherm The contact with Shipulski lead to information on how the implementation was conducted and how
the proceeding use of DFMA works at Hypertherm. DFA is the most used part of the DFMA method
at Hypertherm since it has a larger impact on the cost reduction than DFM (M. Shipulski, personal
c mmu c , F b u 10, 2014). DFM l u “wh m ” c
m p H p h m’ p c c lw l l g ings. One im-
portant rule is, according to Shipulski (2009), to always do DFA before DFM since DFA includes part
reduction and that often results in the largest cost reduction.
In order to understand what to improve on a product Hypertherm analyses the product from a DFA
perspective before a new model is developed. And in order to understand where the largest cost
reduction can be made a m h c ll "P m ” based on the Pareto principle (also called
“ h l w h l w” or 80/20-principle) is used.
This principle states that, according to Koch (1998), for many events, a majority of the effects comes
from a minority of the causes. This method shows where to focus the redesign in order to reduce
cost efficiently (M. Shipulski, personal communication, February 15, 2014).
At Hypertherm it is not only the manufacturing engineers that run the DFMA method, which other-
wise is the normal case in industries (M. Shipulski, personal communication, February 10, 2014). The
design engineers at Hypertherm are also involved with the DFA methods since design engineers play
a major role in the final detail design of a product. Hypertherm uses this strategy since 70 percent of
the final product costs are determined during the design phase (Boothroyd et al, 2011). The fact that
the designers have such large effect on the cost of a final product implies that DFMA should be taken
into account early in the process which coincides with Boothroyd et al. (2011) statement regarding
DFMA usage.
In order to help the engineers understand that conventional design is not enough, radical cost reduc-
tion goals are set upward of 50 percent and part count reduction goals 50 percent (M. Shipulski, per-
sonal communication, February 10, 2014). At the same time DFA and DFM are introduced which
helps them achieve the cost and part reduction goals.
uppl g w wh h g h cu h w h c “ g u c ”.
A successful example of this supplier invitation is a meeting between Hypertherm and a sheet metal
supplier, where the supplier came up with an idea that reduced the number of sheet metal parts
from twelve to seven. This idea led to reduced manufacturing costs for the products and in turn Hy-
pertherm gave them the contract.
At milestone meetings the engineers present the results of the DFMA methodology (cost and part
count). Part count and cost metrics are also added to Hypertherms design review process.
A DFMA method that is used during the product development at Hypertherm is the DFMA software
developed by Boothroyd Dewhurst Inc. (henceforth BDI). This software supports the application of
DFA and DFM during the development process.
Initial Strategy for Interviews 2.3.2The strategy chosen for the interviews during the thesis work is a semi-structured strategy, which is a
combination of both structured and unstructured strategy (Lanz, 2007). The purpose of the inter-
views is to extend the knowledge about the processes occurring at VCC which is, according to Lanz
(2007), an appropriate approach considering the purpose of the interviews.

17
The purpose with the interviews is to map and identify the processes within VCC. The mapping of
VCC will later be the foundation when further investigating if DFX-methods can be applied within the
organizations design process.
The initial phase during the interviews is to inform the person of interest about the purpose, struc-
ture and usage of the interviews results (Lanz, 2007). The ethics (e.g. anonymity and publicity) will
also be presented to the person of interest before the interview. The next phase of the interview
consists of warm-up questions and later on more complicated questions will be asked. The final
phase of the interview will consist of a short summary of the information gathered from the inter-
view.
One important factor for the interview is according to Lanz (2007) that the sequence of questions is
logical for the person of interest and is held within the frames of the purpose.
Interviews were documented via audio recordings when possible, since it was an easy and effective
way to document and recall the interviews. If audio recording for some reason was not an alternative
the documentation was performed in written text instead.
A visit to Industrial Development Center West1 was performed in order to collect important ques-
tions to ask when mapping a product development process.
Interview Results 2.3.3The following two chapters address the results from the interviews. The first part of the interview
ul ’ p uc l pm m u c u g processes at VCC. The second
part of the interview results contains the expressed wishes from the employees of VCC regarding the
use of a DFMA method.
2.3.3.1 Today’s Product Development and Manufacturing Processes at VCC The product development and manufacturing process at VCC today can be divided into three differ-
ent mains stages – Concept, Industrialization 1 and Industrialization 2. These three stages can later
on be divided into several program business level milestones and several build stages. Figure 2.3
shows the most relevant milestones and build stages for this thesis project.
Figure 2.3. Product development and manufacturing process with relevant program business milestone and
build stages at VCC
The program milestones acronyms stand for:
R0 - PS – Program start
R1 - PSC – Program strategy confirmed
R2 - PTC – Program target compatibility
R3 - PA – Program approval
R4 - LR – Launch readiness
R5 - FSR – Final status report
Note: 1 http://idcab.se/

18
The build stages abbreviations stand for:
X0 – Model of the product is built
X1 – Functional prototypes are built
M1 – Functional prototypes are built with the correct manufacturing of parts. Short term
tests are performed. Most flaws and errors should be eliminated during this phase
VP – Functional engines are built and long term testing is performed. No flaws are allowed on
the engines functionality after this phase
TT – Production ramp-up
PP – Full scale production
When it comes to new product development during the X0-ph ‘ h ul ’ ll w ‘b h
b ’ b c u h m c l h l pm p c VCC is a small player on the glob-
al market (Technical engine specialist, personal communication, 24 February, 2014). Therefore the
development process ‘qu c ’ m h h h ‘p c l w’ wh
comes to communications between the departments.
VCC works with the failure mode effect analysis (henceforth FMEA) in a broad matter. There are two
different types of FMEA performed at VCC – Design FMEA and Process FMEA (henceforth D-FMEA
and P-FMEA). The purpose with the D-FMEA is to establish and prevent potential failures that the
design of the product can create during production while the P-FMEA is performed to establish and
prevent potential failures that the process can create during the production. The downside with both
D-FMEA and P-FMEA are that both methods are performed too late in the process and the failures
that the methods are meant to prevent have already occurred - and corrected (FMEA and DFA coor-
dinator, personal communication, 12 February, 2014) (Team leader cylinder block, personal commu-
nication, 27 March, 2014). Another downside with the two different FMEA is that two different de-
partments perform the methods which often results in a stalemate between the two FMEA since
some demands can be requested in the D-FMEA that cannot be met in the P-FMEA (Component
team leader inner assembly, personal communication, 3 April, 2014). The general opinion about the
FMEA performed at VCC is that the method is time consuming, hard and sometimes confusing to use
(Component team leader crankshaft, personal communication, 25 March, 2014) (Technical engine
specialist, personal communication, 24 February, 2014). All the problems with performing the FMEA
result in that the FMEA analysis does not steer the solution (Component team leader inner assembly,
personal communication, 3 April, 2014).
DFM as a method is not used at all within the development process at the design department but a
kind of DFM guidelines are developed but not approved or spread within VCC’ g z (T ch-
nical engine specialist, personal communication, 24 February, 2014). DFA however is used to a cer-
tain extent within some departments of VCC and the method is a simplification of the method that
Boothroyd and Dewhurst developed. The problem with the method today is that it is not quantitative
and therefore it is hard to evaluate the product from an economic point of view (FMEA and DFA co-
ordinator, personal communication, 12 February, 2014). Also, the users do not always follow the
rules of the method because it is seen as uneventful. When the DFA method is used within the pro-
duction preparation process it is performed too late, which results in that the DFA method works
almost as a FMEA analysis (Component team leader outer assembly, personal communication, 27
March, 2014).
19
The design department at R&D is not working along a standardized structure. The design process is
based mainly on personal experience and differs m g g . “DFMA” u u g
the design process but not as a standardized method - but instead as common sense (e.g. eliminate
sharp corners that could be harmful for the assembler and others) (Senior design engineer, personal
connection, 25 March, 2014).
Production preparation at VCC in Skövde has an existing standardized work structure but it is not
always used by the book. Instead most of the work is based on personal and company experience.
DFMA as a standardized method is not used in the existing process – instead a mixture of common
sense and experience is used in order to reduce time and cost. But there are some examples of fail-
ures occurred as a result of miscommunication and poor decisions based on faulty theoretical
grounds.
The standardized work structure called VCMS (Volvo Cars Manufacturing System) is based on the
work principle frontloading where a lot of work is performed early to ease up the workload later in
the process.
The different departments at VCC work closely with each other through cross-functional meetings
that occur eight times a year. The cross functional meetings take a full day to complete and subjects
discussed are for example, current production (if any changes are needed), future products, and pro-
duction. Departments attending the meetings are R&D, prototype, assembly, manufacturing, and
production preparation. The meetings also address manufacturing and assembly design problems,
possible solutions and improvement work but without using standardized DFM and DFA methods
since all participants have large experience within their area (Manufacturing engineer, personal
communication, 17 March, 2014). The discussions during the meetings are being documented and
that document is the only common document between the departments. The communication be-
tween Gothenburg and Skövde works well in general but it would be better if all departments were
sharing location in order to simplify the discussions about different problems and eliminate the pos-
sibilities of misunderstandings (Team leader cylinder block, personal communication, 27 March,
2014).
One example of current improvement work performed at VCC is on the connecting rod where parts
are being removed. The downside about removing parts in this case means that other parts are in
need of more complex manufacturing (i.e. it improves the part from a DFA perspective but impairs
the part from a DFM perspective). The car industry focuses a lot on assembly time but not equally
much on manufacturing time (Manufacturing engineer, personal communication, 17 March, 2014).
The quality assurance work at VCC is done mostly through reporting into a quality assurance matrix
(henceforth QAM) developed by VCC. The QAM is divided into the different gates that VCC work with
(Manufacturing engineer, personal communication, 17 March, 2014)
2.3.3.2 Expressed Wishes for DFMA It is often too expensive to work with major design changes of an existing product and it is more im-
portant to work with minor simplifications. If a production process exists it is hard to make design
changes to a product (Manufacturing engineer, personal communication, 17 March, 2014).
It is important that production engineers have more contact with the design engineers and manufac-
turing engineers so the production engineers experience is acknowledged at a greater extent in the
development process and thereby reduce the number of late changes. It is also important to work
according to frontloading in all the projects in order to pinpoint problem areas early in the process
and thereby prevent late changes (Consulting production engineer, 25 March, 2014).

20
A DFMA implementation should involve milestones where information (e.g. restrictions and mount-
ing points) is automatically shared between the departments in order to eliminate the unnecessary
time demanded to find the counterparty responsible for the specific information in question (Senior
design engineer, personal connection, 25 March, 2014).
Design cookbooks should be written in order to collect all the knowledge regarding design and manu-
facturing at one place instead of at several different places, or in worst case scenario – ’ w
memory. It is also important for the design department to apply DFA and DFM early in the process so
all restrictions and constraints can be set before further development (Senior design engineer, per-
sonal connection, 25 March, 2014).
A DFMA implementation through policy documents is a good way to improve the work structure and
make it easier to eliminate problems before they appear since all involved personnel have the same
basis to work from. The advantage of using a standardized method is that users who skip steps will
know what steps they skipped (Senior design engineer, personal connection, 25 March, 2014).
It is hard to use a DFM method since the empirical knowledge is hard to build up. Each individual
needs proper competence and competence sharing is hard. It is important that the dialog between
the design department and manufacturing department is opened up so both departments work to-
wards the same goal (Component team leader inner assembly, personal communication, 27 March,
2014).
If DFMA is implemented the method should have a stricter and more direct responsibility (e.g. the
design or manufacturing department has direct responsibility in the development process) (Compo-
nent team leader outer assembly, personal communication, 27 March, 2014). Also, if DFMA is im-
plemented the method should be developed to eliminate another method in order to not create
additional work (Component team leader inner assembly, personal communication, 27 March, 2014).
Demand Specification 2.4The pre-study resulted in several wishes that were used to set up a weighted demand specification
(Table 2.3). The purpose of the weighted demand specification is to keep track of what a DFMA at
VCC needs to perform according to the literature review and empirical study. The list is later used as
objective measurement when evaluating and choosing the final suggested method.
Breaking Down Employees Wishes into Metrics and Approaches 2.4.1The interviews at VCC resulted in a lot of wishes regarding a DFMA method. Since some wishes were
asking for specific ways to use DFMA or specific ways of how DFMA should work the questions
“H w?”, “Wh ?” “Wh ?” were asked in order to map DFMA fundamentals and to break down
the employees wishes into metrics and approaches on how to fulfil the wishes. This method worked
in a similar way as when preparing a list of metrics for the Quality Function Deployment or QFD (Ul-
rich & Eppinger, 2012).
Since the interviews were delayed according to the project initial plan the identification of approach-
es and metrics was started before the interviews were held. This resulted in a lot of approaches and
metrics that later did not come to use for this project. It might be regarded as unnecessary but the
information was valuable and the thesis work needed to proceed.
An example of how it was chosen b h mpl ’ w h m c : w h g g
DFMA is that it should kill projects in time – Why do we need to kill projects in time? So unnecessary
money is not spent. How do we kill projects in time? Measure the money spent.

21
Example of how it was chosen to establish an approach to fulfil the wishes: one wish regarding
DFMA was that the method should help develop cheaper products – so the question how can we
create a cheaper product? By reducing parts – and how can we reduce parts? By using DFA guide-
lines.
So eventually a list with proposals on how to fulfil the wishes was developed and categorized under
three columns – increased quality, cost efficient manufacturing and cost efficient development (Ap-
pendix A).
Importance of Wishes 2.4.2After breaking down the expressed wishes regarding how to use DFMA into fundamentals some
wishes conflicted with each other while other wishes were able to be implemented without affecting
the other wishes. Therefore a questionnaire (Appendix B) was sent out to the interviewed employees
at VCC in order to determine the importance of the different wishes.
The questionnaire allowed the personnel to weigh the different wishes on a scale from 1-5 - where
five is the highest score and one is the lowest. See Appendix C for raw data collected via the ques-
tionnaire.
Weighted Demand Specification 2.4.3The questionnaire answers from the interviewed employees at VCC were compiled and summarized
in a weighted demand specification (Table 2.3). In order to sustain a better overview of the im-
portance the weights were divided by a common divider so that the added weights sum up to a total
of 100 on a percentage-scale instead of 538 on a point-scale.
Table 2.3 is regarded as a demand specification even though it only contains wishes for a DFMA
method. The only need for a DFMA method is to actually save more money than it costs to perform
it.
Table 2.3. Weighted demand specification derived from the interviews at VCC
The reason that h w h “Reduce development time” got such a low weight is because that the pro-
jects at VCC should be frontloaded and thereby might increase the development time but overall
minimize the total project time.
A couple of wishes such as “reduce development time”, “reduce assembly time”, “reduce manufactur-
ing time”, “cheaper product”, “fewer parts” “lead time” expressed in the unit percent (%).
This is because that the method will be applied to many different projects with different time span
and therefore a fix number will be misleading and unrealistic in some cases.

22
The wish ‘W w h L ’ c be considered as a less viable wish since both Lean and DFMA aims to
eliminate wasteful activities (Groover, 2008; Fabricius, 2003), but since that wish was especially ex-
pressed during the interviews it felt important to at least state it in order point out the importance of
the wish. Besides, DFMA can be considered as a need for Lean to function.
The wishes w h h w gh m w h ‘ lu ’ emerged after the weighting of the other wishes.
Unfortunately no additional time was accessible and the needs were marked with no value, but are
still regarded as needs needed to fulfil.

23
3 Concept Generation In this stage conceptual solutions of DFMA methods suitable for VCC are generated through a set of
methods. The goal with this phase is to develop rough concepts that potentially fulfil the wishes in
the weighted demand specification (Table 2.3).
This concept generation phase starts off with three brainstorming sessions where ideas are generat-
ed and later on evaluated via a Pick Chart diagram (Westling, 2013) over the axes payoff and effect.
The ideas are then classified in different parts of a process in order to generate more concepts
through a morphological chart. The concepts generated through the morphological chart are then
evaluated with respect to the demand specification in two steps.
Finally only one method is left and that method goes on to be the suggested method.
Idea Generation 3.1This phase is a divergent phase of product development. The goal for this phase is to develop ideas
and investigate all possible solutions for the problem – how and where to use DFMA in the processes
at VCC.
In order to develop these ideas three brainstorming sessions were performed; one session early in
the project before deeper knowledge in DFMA and VCC’ p c w g h w
later on in the process where the amount of knowledge would not disturb the divergent thinking.
This strategy was followed since the early brainstorming session gave the opportunity to generate
rather unconventional ideas that a person with experience about VCC’ p c m l l w ul
not acknowledge.
The first two brainstorming sessions were performed with product design engineering students from
the University of Skövde and the last session was performed with employees at VCC.
The essential rules of brainstorming, according to Cross (2008), were presented for the five partici-
pating persons;
No criticism is allowed during the session.
A large quantity of ideas is wanted.
Seemingly crazy ideas are quite welcome.
Keep all ideas short and snappy.
Try to combine and improve on the ideas of others. The brainstorming method used was a method derived from the 635-method (Curedale, 2013). All
participants were handed a paper and a pencil with the task to generate three or more ideas for five
minutes.
When the time ran out it took a few minutes for the participants to describe their ideas for the rest
of the group and when finished, a new round of idea generation started. This pattern was repeated
two to four times until the participants could not generate more ideas. Then the session was round-
ed up with free discussion to see if further ideas still would be generated.

24
First Brainstorming Session 3.1.1The first idea generation method used was brainstorming together with a focus group of five product
design engineering students. The problem specification presented to the participants of the creative
m h w ; “How and where in a process can DFMA be implemented”. Th p bl m p c c
was set rather unspecified in order to create a larger divergence of ideas.
After the participants had been introduced to the problem the brainstorming sessions started. The
session took about 30 minutes to complete and ended with a short summary of the characteristics of
ideas that had been presented during the session. The papers were then collected and further ana-
lysed and categorized.
The result of the first brainstorming session was a broad line of different ideas with varying quality of
feasibility. Many of the ideas generated during the first brainstorming session were about how to
motivate employees to work efficiently with DFMA and different ways to use DFMA in the develop-
ment process at VCC. O g w g “ b u ” h mpl wh
they had carried out DFMA improvements to the product in order to motivate DFMA work. Some of
the ideas generated were followed up during later brainstorming sessions in order to generate and
further analyse the potential of the ideas.
One of the ideas that were especially interesting was to only focus on the components that cost most
and thereby making a DFMA more efficient and less of an obstacle. This idea is similar to the value
analysis method which is a scaled down version of the value engineering method and is usually only
applied to refine an existing product. Value analysis aims to increase the difference between the cost
and the value of a product (Cross, 2008). Another interesting idea that came up was to develop a
DFMA-software that automatically simplified products so that they would become easier to manu-
facture and assembly.
Second Brainstorming Session 3.1.2Before the second brainstorming session more information regarding DFMA and how it can be used
was presented for the group in order to narrow the partic p ’ g h g approach
convergent and solution focused thinking.
The result of the second brainstorming session was ideas much closer to each other than the first
brainstorming session. The generated ideas from the second session were focused more on how a
DFMA method could be used in a development process than the earlier session. Some of the ideas
were later on regarded as highly interesting and were therefore followed up during the third brain-
storming session. One of these ideas was education on broad spectra in the company creating an
environment where DFMA would be a cornerstone. Some other generated ideas were based on cre-
ating DFMA guidelines that the design engineers would use.
Third Brainstorming Session 3.1.3During the third brainstorming session the group consisted of four VCC employees. The participants
were two manufacturing engineers, a FMEA & DFA coordinator and a quality engineer.
The main goal for the third brainstorming session was to gather the mpl ’ ideas on DFMA and
to generate narrow and solution based ideas of how DFMA could be used in the process and where it
could be implemented.
All the participating employees had some knowledge of DFMA and of the thesis work but a short
presentation of DFMA and the thesis work was still performed before the brainstorming session
started so all participants had the same definition of DFM and DFA.

25
As a final step the third brainstorming session was rounded up with a discussion about if and how
DFMA could be implemented in already existing tools such as FMEA at VCC and if DFMA could com-
plicate other methods and tools at VCC. The response to this question was that an implementation in
other methods would most likely not affect other methods in a negative way.
The result of the third brainstorming session was a smaller number of well-defined and feasible ideas
of how DFMA could be used at the development and manufacturing processes at VCC. Some of the
ideas were products of refined ideas that had been generated in the earlier brainstorming sessions.
Idea Selection 3.2Idea selection is a convergent phase where ideas from the idea generation phase (divergent phase)
are objectively reviewed and sorted (Ulrich & Eppinger, 2012). Either the idea is kept for further de-
velopment or sorted out.
Pick Chart 3.2.1Pick chart is a quick subjective based method for sorting ideas in four different categories: Possible,
Implement, Challenge and Kill (Westling, 2013). An idea ends up in one of the categories depending
on how it corresponds to two different measurements – Payoff and Work effort from an implemen-
tation point of view. When the method is implemented and fully functioning, the work effort for
most ideas will have low work effort. Figure 3.1 shows a standard model of the pick chart method.
Figure 3.1. A standard model of the Pick chart method
The ideas that up h ”Kill-z ” h g are disregarded directly while the other ideas
advance to the next sorting method.
The method resulted in disregarding complex ideas such as using sensors on the assemblers in order
to develop animations that later could be used to evaluate the postures from an ergonomic point of
view that later on could be used for weighting what parts of the product that needed a DFA evalua-
tion and improvement. The work effort seemed unrealistically high compared to the effect it would
return to the products value.
Another idea that was disregarded during this method was a suggestion that a list should follow the
product throughout the development and production stages that shows everybody what has been
changed by using a DFMA method. The idea was disregarded since it added unnecessary goods to
keep track of and in return generated very low effect on improving the products quality or price.

26
Further Development 3.3The selection process left a couple of ideas for further development and concept building. It was
recognized through discussion of the ideas that most of the ideas were not intervening with each
other and could work alongside each other. Therefore a morphological chart was performed in order
to mix the different ideas with each other and build further concepts.
Morphological Chart 3.3.1In order to create concepts consisting of several DFMA tools and also generate all possible combina-
tions of these tools, a Morphological chart according to Cross (2008) was performed.
The ideas generated during the generation phase were sorted within the four phases of the devel-
opment process according to Cross (2008), (Exploration, Generation, Evaluation and Communication)
depending on where in the development process the idea should be used.
Big Hairy Audacious Goals, or BHAG (see chapter 4.1.1), was one of the ideas in the exploration phase
and was considered as a very basic but valuable way to set goals that motivates big changes in the
development process (Antony & Coronado, 2002). Because of this, BHAG fell directly into the result
without being used in the morphological chart.
Because the great number of ideas in each of the four groups, some of the ideas were removed from
the morphological chart in order to make it more manageable. The ideas that were reduced were
ideas that were considered to have a smaller chance to affect the DFMA work. The number of ideas
in each group was reduced to between one to three ideas each. By performing the morphological
chart on these ideas (combining the ideas from all groups in all possible combinations) twelve con-
cepts of DFMA-methods were created (Table 3.1).
Wh c b “ w ” n the morphological chart h w w p g m “DFMA®”
by Boothroyd & Dewhurst Inc. and “SEER® for Manufacturing” b Galorath Inc. The reason for com-
bining these two software programs were because the optimal software could not be appointed be-
cause of shortage of accessible facts especially about the software SEER for manufacturing.

27
Table 3.1. Twelve concepts generated with Morphological chart
1 2 3
Exploration Pareto chart Pareto chart Pareto chart
Generation Guidelines Guidelines Guidelines
Evaluation Cross-func. meeting Software Checklist
Communic. Cross-func. meeting Cross-func. meeting Feedback
4 5 6
Exploration Pareto chart Pareto chart Pareto chart
Generation Guidelines Guidelines Software
Evaluation Checklist Cross-func. meeting Checklist
Communic. Cross-func. meeting Feedback Feedback
7 8 9
Exploration Pareto chart Pareto chart Pareto chart
Generation Software Software Software
Evaluation Software Checklist Software
Communic. Cross-func. meeting Cross-func. meeting Feedback
10 11 12
Exploration Pareto chart Pareto chart Pareto chart
Generation Software Software Guidelines
Evaluation Cross-func. meeting Cross-func. meeting Software
Communic. Cross-func. meeting Feedback Feedback
These twelve concepts were evaluated subjectively based on how well the combinations of the ideas
would cover the DFMA guidelines. Out of the twelve concepts three concepts (1, 2 and 4) were se-
lected for further specification based on the needs in the demand specification. The concepts chosen
for further specification concept 1, 2 4 (h c h c ll “C - u c l m g”, “ w ”
“Ch c l ”) shown in Table 3.2 below.
Table 3.2. The three concepts chosen for further specification
Concept name
Phase Cross functional meeting Software Checklist
Exploration Pareto chart Pareto chart Pareto chart
BHAG BHAG BHAG
Generation Guidelines Guidelines Guidelines
Evaluation Cross functional meeting Software Checklist
Communic. Cross functional meeting Cross functional meeting Cross functional meeting

28
Result of the Morphological Chart and Evaluation 3.4This section presents the three concepts chosen from the Morphological chart. The only difference
between the concepts is the evaluation tool (Table 3.2).
Concept: Cross-functional Meeting 3.4.1The exploration phase consists of the BHAG method for setting goals and motivating big changes of
the design (Antony & Coronado, 2002), and a Pareto chart in order to identify where to set focus in
order to reach the best DFMA-results. The generation phase consists of DFMA guidelines, facilitating
the design decisions during the generation phase. The evaluation and communication phases here
consist of cross-functional meetings where the design feasibility is evaluated in larger group meetings
with participants from across a large part of the development process. During the communication
phase the cross-functional meetings should be about documenting the results and presenting it for
the rest of the company.
Concept: Software 3.4.2The Software concept uses the BHAG method and a Pareto chart during the exploration phase and
DFMA guidelines during the generation phase - just like the concept: Cross-functional meeting. The
difference is that the Software concept uses a DFMA-software in the evaluation phase.
There are two interesting software found during this thesis that are included in this concept. The
software programs are DFMA® by Boothroyd & Dewhurst Inc. and SEER for Manufacturing by Ga-
lorath Inc.
One of the largest advantages with SEER is that it can be implemented into Catia V.5 (the CAD soft-
ware used at VCC) and Catia v6 in the future. This allows companies to initially model and test manu-
facturing processes and trade-offs also during the earliest stages of product development (Galorath
Inc., 2014)
In order to establish which of these two software programs are most suitable for the VCC further
research is necessary. The communication phase in this second concept consists of cross-functional
meetings where participants from across the development process discuss improvements and docu-
ment the result etc.
Concept: Checklist 3.4.3Just as the two previous concepts the Checklist concept consists of Pareto chart and BHAG in the
Exploration phase and Guidelines in the Generation phase. However, in the Evaluation phase it con-
tains of a DFMA checklist based on guidelines and the already existing DFA checklist used at VCC. The
Communication phase is the same as in the Software concept, discussing and documenting im-
provements etc.
Weighted Evaluation of Concepts 3.5When three concepts have been roughly selected subjectively during the morphological chart meth-
od, an objective evaluation took part and the concepts were evaluated against the weighted demand
specification. The evaluation method used here was ‘C c p c g’ cc g l ch Ep-
pinger (2012). The method is useful when increased values will make it easier to differentiate be-
tween concepts. To establish whether or not concepts are improving the product development at
VCC, a reference of VCC’ cu p uc l pm process is included. The weight was earlier
determined via the interviews held at VCC.

29
The scale used in the weighted evaluation goes from one to four. Where one is poor, two is OK, three
is good and four is very good. Each concept (incl. reference) was rated on how well each concept
performs the tasks in question. The higher total score the better.
The weighted evaluation showed that the concept Software got the highest score and was therefore
ranked as number one. The Checklist concept ranked as number two and the Cross-functional meet-
ing concept ranked as number four – not all scored higher than the current product development at
VCC (Table 3.3).
Table 3.3. A weighted evaluation of the three concepts compared to VCC’s current development
Even though the Checklist concept scored second highest it was determined to proceed with that
concept as the final result since the information and knowledge regarding DFMA software is hard to
collect and evaluate. DFMA software is a strong and upcoming method on the market and should
therefore be considered as an interesting alternative to further study. It scored the highest in the
weighted evaluation matrix.

30
4 Suggested DFMA Method A design process can be divided into four fundamental phases: exploration, generation, evaluation
and communication (Figure 4.1). The process is iterative, i.e. it is allowed to move back and forth
between phases when needed. Typically a design project needs to do iterative feedback loops in
order to generate and develop a more satisfactory product (Cross, 2008).
Accordingly, the application of DFMA can also be associated to the four fundamental phases since
the methodology does not only concern one or a few phases. The result of this thesis therefore sug-
gests a DFMA model as an iterative process where different tasks need to be performed in the differ-
ent steps in order to develop a better product.
Figure 4.1. Four step iterative design process according to Cross (2008)
The checklist evaluation related to assembly in this result focuses exclusively on manual assembly
due to h u h ’ lack of knowledge within automated assembly.
The following chapters describe the suggested DFMA method and its ingoing tools in detail organized
under the respective title of each of the four fundamental phases for a design process.
Exploration Phase 4.1The exploration phase of DFMA is where goals are set and information is gathered and the pathway
for the project is determined. DFMA should be a method that provides ground-breaking products
and in order to develop ground-breaking products a new development approach is needed.
BHAG 4.1.1BHAG is a way to set goals for the new product development and stands for: Big Hairy Audacious
Goals (Antony & Coronado, 2002). The purpose of the method is to stimulate bold steps in the devel-
opment process by setting unrealistically high goals (Curedale, 2013). At Hypertherm a form of BHAG
was used in order to force the development process to involve DFMA tools (Shipulski, personal
communication, 18 February, 2014). The BHAG needs to put the developer out of their comfort zone
and motivate them to think outside the box (Curedale, 2013). At Hypertherm Inc. the BHAG consists
of a fifty percent reduction in both cost and number of parts (Shipulski, personal communication, 18
February, 2014).
BHAG works in line with Six Sigma that also pushes an organization to redesign their products, pro-
cesses and services completely since 75 percent of the product cost is defined during the design
phase (Antony & Coronado, 2002).

31
Pareto Principle 4.1.2Th P ch lu m h b ” h P p c pl ” l c ll 80/20-principle
(Koch, 1997), which asserts that the world is an imbalance between the cause and the effect. The
Pareto principle asserts that a minority of causes usually leads to a majority of the results, that
“ w p c h c u p uc gh p c h c ” cc g K ch (1997), s-
tematic and predictable imbalance in the world so to say. The most common saying is that eighty
percent of the results come out of twenty percent of the work, but this is just a benchmark. In prac-
tice the imbalance does not have to be twenty to eighty but there is almost always a minority of
causes that produces the majority of results (Koch, 1997).
Th P p c pl u “ h P ch ” “ h 20/80- l ”. I qu m h
used to determine the ratio between cause and effect. This is an empirical process that can lead to
any results between 50/50 to 99.9/0.1 (Koch, 1997).
Data (e.g., parts and costs) for a product is sorted from largest to smallest in the Pareto chart. The
percentage of the whole cost of the components are set on a secondary axis. By doing this it is possi-
ble to see how big the percentage of the total amount is due to a certain number of parts.
By performing the Pareto chart it is possible to evaluate and determine where to focus the DFMA-
work in order to reduce the costs (M. Shipulski, personal communication, February 17, 2014).
This fictive example contains eight different parts in a fictive product that is analysed with the Pareto
chart in order to map which parts that affects the total cost the most.
By placing all the parts in a falling order of cost (largest cost first), calculate the cumulative costs and
the cumulative percentage of the total cost the first step in the Pareto chart is performed (see Table
4.1.
Table 4.1. Table for the Pareto chart
Parts Cost Cumulative amount Cumulative percentage
Part 1 5 kr 5 kr 30 %
Part 2 4,7 kr 9,7 kr 58 %
Part 3 2,3 kr 12 kr 71 %
Part 4 1,3 kr 13,3 kr 79 %
Part 5 1,2 kr 14,5 kr 86 %
Part 6 1 kr 15,5 kr 92 %
Part 7 0,8 kr 16,3 kr 97 %
Part 8 0,5 kr 16,8 kr 100 %
By creating a chart from the data processed in Table 4.1 the Pareto charts visualize the non-linear
ratio. In the Pareto chart shown in Figure 4.2 the primary axis (left side) shows the cost of the parts
and the secondary axis (right side) shows the cumulative percentage costs of the parts.

32
Figure 4.2. Fictive Pareto diagram over the cost of components based on data in Table 4.1
When analysing the result of the Pareto chart, it shows that the first two parts (25 percent of all
parts) represents almost 60 percent of the total cost of all the parts. This means that reducing cost
for these 25 percent of the parts will most likely result in the biggest cost reduction of the product.
Like all other tools the Pareto chart can be used incorrectly which can lead to wrong conclusions.
According to Koch (1997) it is very important to think through how the tool is applied. During the
application one should be selective and not use it as a linear tool. The tool should in fact cover non-
linear events and effects (Koch, 1997).
Generation Phase 4.2The generation phase of DFMA is a creative phase where new ideas are generated and developed.
The result of this thesis does not suggest any creativity methods in order to develop ideas. No crea-
tivity methods is suggested since DFMA will be used for several different product developments and
the preferred choice of idea generation method can differ from project to project and person to per-
son. But still, some parts still need to be acknowledged during this phase and that is the DFA guide-
lines.
The DFA guidelines are a list of basic statements that need to be considered during idea generation in
order to minimize the work effort in the evaluation phase. The reason DFMA guidelines is suggested
is because the users of the suggested DFMA method needs to be reminded what to focus on and not
diverge from the objective. DFMA guidelines will also let the products emerge together with DFMA
thinking and not just evaluated with DFMA thinking.
The guidelines proposed is developed from several different sources and if a product design concept
is compatible with these guidelines one can be assured that the design evaluation will be easier per-
formed (Otto & Wood, 2001). The guidelines put together by Otto and Wood corresponds with the
three questions presented by Ulrich and Eppinger (2012) in order to establish theoretical minimum
of parts as well as with Boothroyd et al. (2011) DFA guidelines for handling, and insertion and fas-
tening. The following guidelines do also match some of the manufacturability measurements pre-
sented by Fabricius (2003) such as colour coding similar parts and thereby allowing for simple quality
control and efficient use of personnel and resources.
0%
10%
20%
30%
40%
50%
60%
70%
80%
90%
100%
0
1
2
3
4
5
6
Part 1 Part 2 Part 3 Part 4 Part 5 Part 6 Part 7 Part 8
cost
Cumulative percent

33
The guidelines are as follows:
Minimize part count by incorporating multiple functions into single parts
Modularize multiple parts into single subassemblies
Assemble in open space and never bury important components
Make parts to identify how to orient them for insertion
Standardize to reduce part variety
Maximize part symmetry
Design in geometric or weight polar properties if non symmetrical
Eliminate parts that tend to tangle
Colour code parts that are different but shaped similarly
Prevent nesting of parts
Provide orienting features on non-symmetrical parts
Design the mating feature for easy insertion
Provide alignment features
Insert new parts into an assembly from above
Eliminate fasteners
Place fasteners away from obstructions
Deep channels should be sufficiently wide to provide access to fastening tools. No channel is
the best
Providing flats for uniform fastening and fastening ease
Proper spacing ensures allowance for a fastening tool
Evaluation Phase 4.3As a result of this thesis a DFMA software should be suggested as an evaluation tool since that meth-
od scored the highest in the weighted evaluation matrix – but since such little information was able
to be gathered within the area a checklist is suggested instead. Important to keep in mind is that
software seems to be the best method for evaluating a design based on the knowledge collected and
it is suggested that further investigation within the area is performed.
Checklist 4.3.1A DFA evaluation method developed by Martin Gustavsson in 2003 is already in use at VCC even if it
is not performed as it should be. The result of this thesis suggests that VCC continue to use a modi-
fied version the DFA Skövde 2 (Henceforth DFA S2) method since it is a thorough method that gives
two different approaches and thereby will ease the decision making with a better overview as a base.
The DFA S2 method starts off with a qualitative approach with inputs from FMEA and finishes of with
a quantitative method (Gustavsson, 2003).
The DFA S2 analysis is divided into five parts – criteria for integration, handling and assembly, quality,
total assembly time, total cost and design efficiency. The quality part derived from FMEA is seemingly
unnecessary since the DFA2 part can cover the importance of change in design by itself.
For example; if one or several aspects in handling and assembly are ranked with a high number it is
because a detail is difficult to assemble and the error intensity in the quality part will increase auto-
matically. Therefore the quality part of DFA S2 is withdrawn from the result in this thesis.
The suggested DFA evaluation is therefore divided into four parts (see updated layout in Appendix
D).

34
The first part is determination of criteria for integration and is derived from the Boothroyd, Dewhurst
and Knight DFA method (2011) and the following questions are asked and answered (yes or no);
Movement necessary?
Other material necessary?
Separate assembly necessary?
Theoretically possible to remove one/several details?
The second part of the DFA S2 method is handling and assembly which is derived from Eskilanders
DFA2 method (2001) and is determining a score along the scale 0 to 3 regarding handling, position-
ing, insertion, symmetry, hidden assembly, need to hold down assembled detail and adjustment after
assembly. The higher score indicates how much the assembly fulfils the question asked. For example;
if it is a hidden assembly and the question is: Hidden assembly? The score will be three.
The third part is a result of the Boothroyd, Dewhurst and Knight classification system (2011) where
the number of operation repetition is determined together with manual handling time per part,
manual insertion time per part, operation time, operational cost, two-digit manual insertion, and
handling code.
The two-digit manual insertion, and handling code is a result of a classification system developed by
Boothroyd, Dewhurst and Knight (2011) in order to get a quick overview of the insertion and han-
dling complexity (Appendix E).
When all these questions are answered and established total assembly time, operational cost and
design efficiency can be calculated. The assembly time (TM) is calculated using equation 4.1 opera-
tional cost (TK) via equation 4.2 and design efficiency (DE) via equation 4.3.
[ ] [ ]
[ ]
The last part of the evaluation checklist is a comment-field where small notes can be left in order to
backtrack the work and get a quick overview even if it is an outsider looking back on the checklist.

35
This checklist focuses exclusively on evaluating a design from a DFA perspective. There are two rea-
sons this checklist was suggested as a design evaluation tool. Firstly because DFA stands for the larg-
est cost savings within DFMA (Shipulski, 2009), and secondly because DFM is mostly based on com-
mon sense and experience within the specific manufacturing (Otto & Wood, 2001). However, there
are, as earlier mentioned, seven guidelines and measurements developed by Fabricius (2003) that
are important to keep in mind when evaluating a design with respect to DFM:
Direct and indirect production costs (Labour, materials, quality control, logistics, purchase,
etc.)
Quality (Ability to match products with the specification, with simple quality control, rework,
waste and scrap)
Flexibility (Easy to make changes in the manufacturing output)
Risk (The largest manufacturing risk should be in the product design)
Lead time (Reach low manufacturing lead time)
Efficiency (Efficiency in the use of personnel and resources)
Environmental effects (Environmental consequences of the manufacturing process)
There are also two basic DFM evaluating questions that should be asked after considering design
changes with respect to DFA:
Does this design change weigh up the cost savings in assembly contra the added cost in
manufacturing?
Does this design change weigh up the time savings in assembly contra the added time in
manufacturing?
Communication Phase 4.4
Cross-functional Meeting 4.4.1The cross-functional meeting requires participants with specific knowledge and competences along
the development process at VCC, together they cover a large area of knowledge about the develop-
ment process at VCC. The cross-functional meeting is illustrated under the dashed line in Figure 4.3.
Figure 4.3. Illustration of the iterative process of the cross-functional meeting
When the DFMA work has been performed and evaluated the result is presented at a cross-
functional meeting to the participants. At this meeting it is meant that the participants can ask ques-
tions regarding the DFMA developed product in order to further analyse the improvements made.

36
If the participants of the cross-functional meeting consider further DFMA development is economi-
cally justifiable, or that the project goals are not fulfilled, the DFMA process should continue until the
goals are met (DFMA is an iterative process). Otherwise the DFMA process should be considered as
completed and a quality assurance should be performed, documenting that the DFMA process has
been successfully performed.
The results of the DFMA process should later on be presented at VCC, so that all employees become
aware of the improvements made with the DFMA process, which could motivate employees at VCC
to continue the DFMA work.
Implement in QAM 4.4.2The final step of this DFMA method is to implement a step in the Quality Assurance Matrix (hence-
forth QAM) wh h qu “Has DFMA b p m ?” h cum
backtracking of the development and manufacturing processes is possible.

37
5 Demonstrating the Suggested Method In order to demonstrate the suggested DFMA method and establish if it covers all intended areas a
case study on a child safety gate was performed. The original gate was set up by 22 unique parts
with a total part count of 48 (Appendix F) and the re-designed gate was set up by 8 unique parts and
a total of 26 parts (Appendix G).
Analytical calculations in additional product property areas are also performed in order to establish
so the new product development do not sub optimize the products strength properties through the
re-design.
Exploration Phase 5.1Firstly goals were set according to BHAG and the goal was to achieve a 50 percent part- and cost re-
duction. Secondly the child safety gates functions and features were clustered together in order to
perform the Pareto diagrams. The gate was divided into three function groups – Hinge, Gate and
Lock. E ch u c g up’ p c u was then established and sorted in a list with decreasing order
and cumulative percentage of the total amount resulting in the Pareto diagram. Because of difficul-
ties in estimating the part cost and the time was running out, no Pareto chart of part cost was estab-
lished. See Table 5.1 for clustered functions and number of ingoing parts and cost.
Table 5.1. Function groups, part count and unique parts
Function group Part count Unique parts
Gate 18 5
Lock 16 11
Hinges 14 9
Total 48 25 (22)
The Pareto chart over the part count was established to visualize were the largest part reduction
could be made (Figure 5.1).
Figure 5.1. Pareto chart of part count in the child safety gate.
The Pareto chart revealed that the gate contained the largest number of parts and therefore became
priority number one to reduce parts from when it was time to perform the DFMA in the generation
phase.
0%
10%
20%
30%
40%
50%
60%
70%
80%
90%
100%
0
2
4
6
8
10
12
14
16
18
20
Gate Lock Hinges
Par
t co
un
t
Functions
Part count
cumulative pct

38
Generation Phase 5.2During the generation ordinary brainstorming was performed. The main concern at first was to re-
duce the number of parts in the product since this has the largest effect on the product cost.
The part reduction was performed during a brainstorming session and was based on the data gath-
ered from the Pareto chart and DFMA guidelines. By first reducing the number of parts in the func-
tion group the Pareto chart had shown that the gate consisted of most parts and was therefore the
best area to focus in. By using DFMA guidelines the number of parts was reduced from 18 to 6 parts.
Further part reduction resulted in a part reduction of 50 percent of the product.
Ideas and suggestion on the re-designed gate is shown in Appendix H.
Note that since this is a simple illustration on how the suggested DFMA method works no specific
design strategy with selection and evaluation methods is performed on the different ideas. The ideas
are just picked through discussion.
Evaluation Phase 5.3When performing the DFA-checklist evaluation on the original design of the child safety gate it ob-
tained an estimated design efficiency ratio of 0.1157 and an assembly time of 389 seconds.
The redesigned child safety gate obtained an estimated design efficiency ratio of 0.2925 and an as-
sembly time of 154 seconds. See Appendix I for complete comparison between the two evaluations.
The total operational cost was not estimated for either of the designs due to absence of data.
The evaluation method showed that the redesign reduced the assembly time by 60 percent while
increased the design efficient ratio by 60 percent compared to the original design.
A final attempt to estimate the parts cost was executed in order to determine if the redesign would
reach the goal of a 50 percent cost reduction. By creating a subjective cost ratio between each rede-
sign part and the original parts it replaced, it was meant that an approximate ratio between the two
products could be performed. By contacting an expert in the area of materials and production tech-
niques it was meant to make a quick estimation of the cost ration between the products but because
of lack in time the attempt to estimate the product cost reduction was not followed through. Any
further cost reductions were not performed due to shortage of time.
Communication Phase 5.4The Communication phase contains a cross-functional meeting with participating experts discussing
the result and fulfilling of the project goals. Discussion with any experts was not possible due to lack
of time so the cross-functional meeting was performed amongst the authors whom have no specific
expertise in manufacturing processes.
Although the reduction of production cost could not be estimated the re-design was considered as
good enough. The only area where doubts occurred was if the bolts in the new design was a good
solution or if it would cause the child safety gate to break. In order to determine this the bolted area
was calculated against yielding.
Determining if the DFMA Re-design is Sub Optimized 5.5Sub optimization is when one or more properties of a product are optimized in a product develop-
ment process without regards to the whole product. Sub optimization can end up in improving few
aspects but leave a worse final product (Gröndahl & Svanström, 2012).

39
In order to be sure that the re-design from a DFMA perspective during the case study do not ignore
the strength properties of the child safety gate analytical calculations over the gate with the intended
load is performed. In other words; making sure that the gate is not sub optimized for manufacturing
and assembly but useless or poor related to the intended use for the user.
The reason these analytical calculations needs to be performed is because of a seemingly bold deci-
sion to put piercing bolts to fasten the two gate parts together. Due to the simplified fastening tech-
nique the material might not withstand the intended load.
Therefore, three different cases of loading were set up – pulling the gates apart, leaning on the gate
and pressing the gate down. Since the gate is designed in order to eliminate the chance of a kid
standing on the gate and it is difficult to try and pull the gates apart these cases were eliminated and
calculations were only performed on the scenario where a kid is leaning on the gate.
For these overviewing analytical calculations several simplifications were made. The simplifications
made were (in order);
Only calculating the two top bars as one (since they were fixed together) when establishing
the reaction forces and momentum
Th ch l ’s two hands were regarded as one point force
When calculating the largest bending stresses the bolts were removed from the holes due to
lack of knowledge regarding build-up of stress concentration
For complete calculations see Appendix J.
The gate is only designed to protect kids up to 24 months so a large estimation of weight was per-
formed and set to 20 kg. The friction against the floor differs depending on what material the floor is
and if the child is barefoot or wearing socks. For a floor with roughness of 2 micrometre and a bare-
foot child the friction coefficient is approximately (Ezzat, Hasouna & Ali, 2008). A barefoot
child on a standard floor was the worst case scenario and therefore used in the calculations.
See Figure 5.2 for illustration on how the child leans on the gate.
Figure 5.2 Child leaning towards gate
The force ( ) provided on the gate by the child was calculated to be
By setting up a holistic free body diagram of the gate (Figure 5.3) it was determined that the reaction
forces were .

40
Figure 5.3. Holistic free body diagram of the gate (seen from the top)
In the next step the cross sectional force ( ) was determined by a cut free body diagram (Figure 5.4)
that later was used to set up a cross sectional diagram and momentum diagram over the gate.
Figure 5.4. The cut free body diagram
The momentum was calculated around a point in the cut section and resulted in , since
the cut section was performed on an infinite small distance on the left side of force F.
The last step was to establish one hole to focus on. Since the momentum is the same over each hole
it does not matter which one that is picked – so the hole to the left is chosen for the final step (Figure
5.5).
Figure 5.5. Illustration of that both holes got the same momentum

41
For the last calculations a formula to convert the nominal stress to maximum stress is used
(Sundström, 1999). Figure 5.6 shows the direction of the momentum applied and the measurements
used.
Figure 5.6. Illustration of the chosen hole with measurements and direction of momentum
( )
is a constant gathered from the top table 33.3 on page 356 in (Sundström, 1999).
The maximum stress is 11.7 MPa, which is significantly lower than the allowed bending stress that is
75MPa (Fröbel, 2004). But good to keep in mind is that in these calculations the hole is allowed to
deform freely but in real cases stress concentrations will build up since a stiff bolt is eliminating free
deformation of the holes which leaves this result lower than the actual stress.
From these calculations we can determine that the design simplification will withhold the applied
force and the DFMA re-design is not a sub optimization.

42
6 Conclusion This conclusion covers both the suggested method where the method contra the wishes from the
employees is discussed, and why VCC should implement the proposed DFMA method.
Suggested Method 6.1The suggested method covers more phases than the previous method used at VCC that only covered
the evaluation phase. The difference between the previous evaluation method and the suggested
evaluation method is small since the previous method is developed specifically for VCC and is a good
and well-developed method. The only difference between the suggested evaluation and previous
evaluation is that the previous method has an extra evaluation column (The FMEA column) that was
regarded as unnecessary since the FMEA part followed qualitative questions and if a qualitative ques-
tion gets a high score immediate action is required.
Table 6.1. Weighted demand specification
Regarding the “Early in process” wish; it is clearly up to the user when to perform the DFMA method
but the method is designed to be used in the product development process different phases (when
goals are to be set the DFMA method should be used) where the designers work to generate new
product designs – and therefore that demand is seen as fulfilled.
Regarding the manufacturing time reduction no objective conclusion can be given since the
knowledge of the manufacturing process was unavailable. The same goes for the cheaper product
demand since no cost could be determined but since the part count reduction was 50 percent one
could suppose that the product cost was significantly lower since reduction of parts stand for the
largest cost savings (Shipulski, personal communication, 18 February, 2014).
The need of DFMA to work with Lean, as previously mentioned, goes without saying since both Lean
and DFMA aims to eliminate any wasteful activities. DFMA can be regarded as a need for Lean to
function correctly.
The need to be able to kill projects in time goes hand h w h h ”Early in process” demand set
in the weighted demand specification. If the method is used at an early product development stage
the cross-functional meeting in the communication phase will also be performed early and since the
product development itself does not cost much (in relation to later activities) it is easy to kill of the
project if it is regarded as necessary.
The DFMA method therefore fulfils the weighted demand specification and is a well-functioning
method that could be suggested to VCC.

43
Why Volvo Should Implement DFMA 6.2When studying both the results of the i l mpl m DFMA H p h m ’ u
of DFMA it is clear that DFMA can result in large savings for an organization. Volvo Cars Corporation
is no exception.
The impact on the organisation if DFMA worked on VCC as it works on Hypertherm the organisation
can expect large product cost savings along with higher product quality. Regarding the previous dom-
inant methods such as Lean and Six Sigma no changes will be necessary since DFMA does not inter-
fere with neither of the methods but instead enhance the effect.
The impact on the staff is difficult to foresee but will undoubtedly result in a change of work tasks
since DFMA is a method that needs to be performed. If it will add extra workload is hard to establish.
Maybe an implementation will reduce the workload since the part reduction and manufacturing sim-
plification will be performed in a structured way and lead to less need for redesigns.
The impact on VCC regarding the costs is impossible to establish but DFMA is a method with the ob-
jective to reduce the product cost. So if DFMA do not reduce the product cost maybe the method
should not be performed at all. But that is a constant weighing amongst different factors such as:
quality, product cost and lead time etc.

44
7 Discussion This chapter contains discussions regarding the methods used in this thesis and reflections about
what could be done differently in order to improve the result.
Problem Specification 7.1The problem specification originally set up for this thesis has changed in some way during the thesis.
What was originally set up as criteria for what the thesis would cover, changed over time because of
several factors, e.g. time and qualifications regarding specific criteria. Goals regarding VCCs economic
profit and loss were removed or revised due to lack of knowledge and time to determine these ob-
jectives. One of the goals that were removed was estimated of how much VCC economically forfeit if
the organisation would not implement DFMA. This objective was hard to calculate and therefore this
goal was removed in consultation with the supervisors at VCC.
Weighted Demand Specification 7.2The weighted demand specification only contains wishes, which can be seen as strange. The reason
that it only contains wishes is because that the demands for an implementation of DFMA can be real-
ly hard to determine in an objective way. Perhaps the weighted demand specification should contain
at least one demand in order to determine if an implementation is in question.
The demand could be that the method had to perform a larger total cost reduction than what it costs
to perform it. The method itself is free of costs to perform per se, but it still takes time and time is
money for a company.
It was rather difficult to set up a weighted demand specification for a method (compared to a prod-
uct) since it was the first time for us and the demands that the method actually needed to perform
seemed too subjective.
Concept generation 7.3The decision of dividing the generation phase into three brainstorming sessions with varying partici-
pants and amount of information gave a wide range of ideas. The ideas from the first session were
more spread than the other and the later sessions generated more solution-based ideas built partly
from the earlier sessions. This was considered as a good approach that definitely will be used in fu-
ture projects. The generation phase should have contained a larger amount of creative methods in
order to (approach the problem from a greater number of angles and possibly obtain even more
interesting solutions with from more perspectives.
Morphological Chart 7.3.1The morphological chart was used in order to generate a large amount of possible concepts in a short
period of time from the remaining ideas. This was considered as an effective idea due to that the
number of ideas had already been reduced and the number of concepts generated was therefore
manageable.
In order to gather a larger amount of ideas one could have combined the different ideas further than
what was handled in the morphological chart. If this additional combination of ideas would have
been performed, it is possible that the result could have been another.

45
Concept evaluation 7.4
Pick chart method 7.4.1During the first stage of evaluation, Pick chart was used in order to reduce the number of ideas that
either were unrealistic or would simply not have enough of a chance to improve the development.
The reason that this method was chosen was because the method was seen as a quick and easy way
to reduce the number of ideas to get a more manageable amount of ideas to further investigate.
Even though the ideas that were eliminated with this method were clearly not good enough to pro-
ceed with, using a subjective method like Pick chart for this task involves a risk. Instead of using the
subjective method Pick Chart, one should have used a more objective method, assuring objectively
instead of subjectively which ideas that was not good enough to proceed with. The problem with
using a subjective method is that one might be fixated with one or several ideas that subconsciously
are chosen over the others. An objective method allows one to kill ideas based on objective meas-
u m ’ w l g . A ubj c m h c b p m h qu c l u
an objective method that needs time to be performed.
Weighted Concept Evaluation 7.4.2Although the concept Software was the concept that got the best score in the weighted concept
evaluation the suggested concept was the concept Checklist. The reason for this perhaps odd choice
of suggested method was because the software that was considered as the most interesting (SEER by
Galorath, Inc.) but the information about this software was obtained in a late stage in the project and
could therefore not be used as the suggested method. For this reason the concept obtained the sec-
ond best score in the weighted concept evaluation (Checklist) was chosen for the suggested method.
FMEA 7.5When redesigning a product the product features e.g. assembly- and manufacturing possibilities of
components can change. In order to investigate if a redesign could cause problems later on in the
process it is possible to add a FMEA in the suggested method. By using FMEA or a similar method one
could validate the product quality in both assembly and manufacturing and minimize the risk and
effects of errors.
This thesis does not mention the combined usage of DFMA and FMEA in any greater extent but any
further work related to this thesis should regard this combination further as a possible improvement
of the suggested method where the FMEA suggestively will be located in the cross-functional meet-
ing.
Case Study 7.6The purpose of the case study performed in this thesis was to demonstrate and test if the suggested
method would cover the intended areas.
The result of the case study was in a way satisfying but because it is such a simple product compared
to what is developed at VCC it can be misleading for how well it performed on the product in the
case study. A similar result as in the case study could have been achieved when redesigning the
product even without the suggested DFMA method and since no reference DFMA method was used
one could only draw the conclusion that the suggested DFMA method can be used to improve a
product but does not establish how efficient this suggested DFMA method actually is compared to a
traditional design process.

46
There were two reasons for using the child safety gate in the performed case study: The first reason
was the aspect of time; the time that remained for the thesis when the method was developed did
not allow any major product to perform a case study on. The second reason was a theory that by
choosing a simple product the result would be easier to evaluate and any deficiencies in the method
would be easier to detect. This second reason was however not the central factor for using the child
safety gate in the case study but still a reason for not choosing a complicated product.
In order to roughly evaluate the efficiency of the suggested method a case study should have been
performed with a traditional approach in the beginning of this thesis as a reference before the infor-
mation about DFMA was gathered and a second case study in the final stages of the thesis when the
method was developed. By doing this one could compare the results from the case study and from
that estimate whether the suggested method is more effective than a traditional approach.
Time and Planning 7.7The initial time plan was a big obstruction for the thesis work as it was constructed as a traditional
design process demanding a bit varying approach. The time plane was adjusted a few weeks into the
thesis in order to match the proceeding thesis better much due to late reservations of interviews and
meetings at VCC.
Much of the information with significance in this thesis was discovered in late stages of the phases,
this resulted in that further investigations and examinations were hard to find time for and therefore
not fully analysed at the end of the project.
If more time was given at the end of this thesis work, further information and investigate the soft-
ware more thoroughly.
Result 7.8The result of this thesis is considered as successful even if it was difficult to develop a method from
already existing methods. Taking parts of other methods and linking them together towards the ob-
jectives and the wishes of the employees at VCC was a large part of the development of the suggest-
ed DFMA method.
It seems that the main problem with the development at VCC is more than just implementing DFMA
as a method. The lack of interest when performing methods like DFA contributes to a product that
does not reach its full potential.
DFA qu ’ p c , wh ch leads to that the existing DFA method is not being
used to its full potential. One reason why DFA is not requested could be that it is considered as cum-
bersome to perform on a product. This is one of the reasons why this thesis suggests a Pareto chart.
The Pareto chart is used in order to analyse where the major focus of a DFA method should be placed
in order to minimize both the workload and time.
The result of this thesis is information and facts about DFMA and how other organisations have im-
plemented DFMA but also a suggested DFMA method for VCC.
The information that would most likely be of interest for VCC is the software mentioned in the thesis
which can be used in their process but also other parts in the suggested method. The information
gathered during this thesis is DFMA related data and information gathered from interviews of per-
sonnel at VCC about DFMA.

47
8 Suggestions for further investigation Since DFMA software was the winning concept even though the checklist concept was proceeded
with we suggest that VCC continues to investigate the software even further.
The software we suggest to investigate further is the SEER for Manufacturing by Galorath since that
software is to be integrated within Catia v5 and later in v6.
The rest of the DFMA method suggested for VCC should be tested and evaluated in VCC’ w p d-
uct development process.
A desire that was discussed during the presentation of the thesis was a so-called DFM-database that
can be used as a product development aid and reduce the dependence of persons with specific
knowledge in manufacturing processes during development projects. How such a DFM-tool would be
developed or how it would be used was not specified. Because of this desire from VCC to develop
some kind of DFM-database, further information regarding possibilities to develop and use a DFM-
tool like this should be examined.

48
References Antony, J. & Banuelas R. C. (2002) Design for Six Sigma. Manufacturing Engineer, 81 (1), pp. 24-26
Boothroyd, G., Dewhurst, P. & Knight, W. A. (2011) Product Design for Manufacture and Assembly
(3rd edition). Boca Raton: Taylor and Francis Group, LLC
Chan, V., & Salustri, F. A. (2005) DFA: The Lucas Method. [Website] Available at:
http://deed.ryerson.ca/~fil/t/dfmlucas.html [Retrieved: 8 May 2014].
Corbett, J., Dooner, M., Meleka, J. & Pym, C. (1991) Design for Manufacture: Strategies, Principles
and Techniques. Workingham: Addison-Wesley
Cross, N. (2008) Engineering Design Methods: Strategies for Product Design (4th edition). Chichester:
John Wiley & Sons Ltd
Curedale, R. (2013) 50 selected design method to transform your design. Topanga, CA: Design Com-
munity College Inc.
Curtis, M.S. (1997) Boothroyd Dewhurst's DFMA and JCB excavators. Proceedings of IEE Colloquium
on Successful Cases of Integrated Product Design with Manufacturing Technology, Birmingham,
UK, 27 May 1997, pp. 1-7
Erixon, G. (1998) Modular Function Deployment – A Method for Product Modularization. PhD Thesis,
Royal Institute of Technology, KTH, Production system
Eskilander, S. (2001) Design For Automatic Assembly – A Method for Product Design: DFA2. PhD The-
sis, Royal Institute of Technology, KTH. Industrial Production
Ezzat, F.H., Hasouna, A.T., & Ali, W. (2008) Friction Coefficient of Rough Indoor Flooring Materials.
JKAU: Eng. Sci., 19(1), 53-70.
Fabricius, F. (2003) Design for Manufacturing DFM: Guide for improving the manufacturability of
industrial products. Lyngby: Institute for Product Development, Technical University of Denmark
Fiksel, J. (1996) Design for Environment – Creating Eco-Efficient Products and Processes. New York:
McGraw-Hill
Fröbel, J. (ed.) (2004) Att välja trä (8th edition). Skogsindustrierna: Stockholm
Galorath (2011) SEER Cost Estimation Software for Manufacturing Projects – Galorath. [Website]
Available at: http://www.galorath.com/index.php/products/manufacturing/C6/ [Retrieved: 2
Jun 2014]
Galorath (2014) Galorath’s SEER for Manufacturing Integrated into Dassault Systems 3DEXPERIENCE
Platform. [Press release] February 27 2014. Available online:
http://www.galorath.com/index.php/news/press/galoraths-seer-for-manufacturing-integrated-
into-dassault-systemes-3de [Retrieved 28 Apr 2014]
Groover, M. P. (2008) Automation, Production Systems, and Computer-Integrated Manufacturing
(3rd edition). New Jersey: Pearson
Gröndahl, F., & Svanström, M. (2012) Hållbar utveckling – en introduktion för ingenjörer och andra
problemlösare (2nd edition). Liber: Stockholm
49
Gustavsson, M. (2003) Evaluation of DFA methods in the automotive industry. MSc thesis, University
of Skövde, HIS. School of Engineering Science
Hypertherm (2008) Boothroyd Dewhurst DFMA Helps Slash Warranty Costs and Boost Factory Floor
Profits 600 Percent at Hypertherm. [Press release] 2 June 2008. Available online:
http://www.dfma.com/news/hypertherm.htm [Retrieved: 26 Feb 2014]
Idcab.se (2014) Våra områden | IDC West Sweden. [Website] Available online: http://idcab.se/vara-
omraden [Retrieved: 5 Mar 2014]
Koch, R. (1997) The 80/20-principle- the secret of achieving more with less. UK: Nicholas Brealey Pub-
lishing Ltd
Lantz, A. (2007) Intervjumetodik (2nd edition). Lund: Studentlitteratur
Löwgren, J (1994) Human-computer interaction- what every system developer should know. Sweden:
Studentlitteratur AB
Ma, X., & Kim, M. (2008) A systematic Design for Assembly Method through the combination of sub-
assemblies in Product Family. International Conference on Smart Manufacturing Application,
KINTEX, Gyeonggi-do, Korea, 9-11 May 2008, pp. 261-266
Otto, K., & Wood, K. (2001) Product Design – Techniques in Reverse Engineering and New Product
Development. New Jersey: Prentice Hall
Pahl, G., Beitz, W., Feldhusen, J & Grote, K. H. (2007) Engineering Design. A Systematic Approach (3rd
edition). Springer: London
Parsaei, H. R. & Sullivan, W. G. (1993) Concurrent Engineering: Contemporary Issues and Modern
Design Tools. London: Chapman & Hall
Pink, D. H. (2010) Drivkraft : den överraskande sanningen om vad som motiverar oss. Stockholm:
Bookhouse
Salustri, F. A. (2001) Contradictions between DFM and DFA. [Website] Available at:
http://deed.ryerson.ca/~fil/t/cs-dfma-contradiction.html [Retrieved: 24 May 2014].
Shaobo, L., Chunhua, W. & Hongliang, Z. (2009) Key technology analysis of implementing lean pro-
duction, paper presented at 2009 IEEE 16th International Conference on Industrial Engineering
and Engineering Management, Beijing, 21-23 October. Beijing: IEEE Press, pp. 1993-1996
Shipulski, M. (2009) Why DFMA Efforts fail. Unpublished paper, Presented May 15th. Available
online: http://www.shipulski.com/wp-content/uploads/2009/08/Why-DFMA-Efforts-Fail.pdf
[Retrieved 2014.02.10]
Shipulski, M. (2007) Design for Manufacturing - what is it and how does it fit with Design for Function,
Design for Assembly and Design for Cost?, paper presented at 2007 International Forum on
DFMA, Providence, R.I., USA, 19-20 June. Providence: Boothroyd Dewhurst Inc.
Sundström, B. (1999). Handbok och formelsamling i hållfasthetslära. 1st ed. Stockholm: Institutionen
för hållfasthetslära KTH
Thorpe, A. (2008) Design för Hållbar Utveckling. Raster: Stockholm
Ulrich, K. T. & Eppinger, S. D. (2012) Product Design and Development (5th edition). New York:
McGraw-Hill

50
Weber, A. (2009) Can Anyone Out-Lean Toyota? Assemblymag.com, [blog] 2 November 2009, Availa-
ble online: http://www.assemblymag.com/blogs/14-assembly-blog/post/86975-can-anyone-
out-lean-toyota [Retrieved 26 Feb 2014]
Westling, M. (2013) PICK-graf (PICK-chart) prioriteringsverktyg. [Website] Metodbanken. Available
Online: http://www.metodbanken.se/2013/06/11/pick-graf-pick-chart-
prioriteringsverktyg/#more-2669 [Retrieved: 4 Jun 2014]
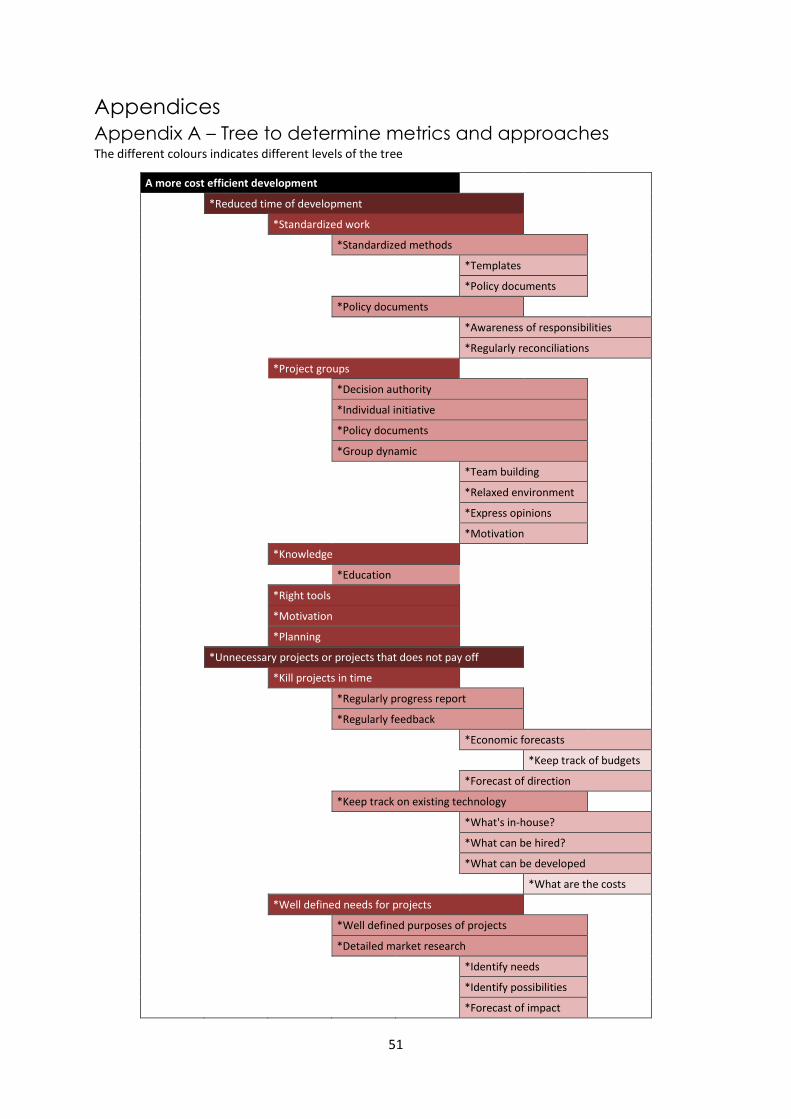
51
Appendices
Appendix A – Tree to determine metrics and approaches The different colours indicates different levels of the tree
A more cost efficient development
*Reduced time of development
*Standardized work
*Standardized methods
*Templates
*Policy documents
*Policy documents
*Awareness of responsibilities
*Regularly reconciliations
*Project groups
*Decision authority
*Individual initiative
*Policy documents
*Group dynamic
*Team building
*Relaxed environment
*Express opinions
*Motivation
*Knowledge
*Education
*Right tools
*Motivation
*Planning
*Unnecessary projects or projects that does not pay off
*Kill projects in time
*Regularly progress report
*Regularly feedback
*Economic forecasts
*Keep track of budgets
*Forecast of direction
*Keep track on existing technology
*What's in-house?
*What can be hired?
*What can be developed
*What are the costs
*Well defined needs for projects
*Well defined purposes of projects
*Detailed market research
*Identify needs
*Identify possibilities
*Forecast of impact

52
*Cost efficient manufacturing
*Minimized time of manufacturing
*Manufacturing adapted design
*DFM
*Education
*Templates
*Minimize number of parts
*DFA
*Education
*Templates
*Well-functioning line
*Knowledge
*Education
*Correct placement of tools
*Right tools
*Standardized products
*Standardized work
*Optimized material
*Manufacturing adapted materials
*Knowledge
*Library of materials
*Cheap materials
*Knowledge
*Library of materials
*Standardized materials
*Don't use higher quality of materials than the product needs
*Increased quality
*The product must not break
*Fewer parts that can break
*Minimize number of moving parts
*DFA
*Focus on customer values
*Don’t focus on less essential function or details
*Focus on customer requests
*What does the customer want?
*What does the customer need?
*What gives the product customer value?
*Is customer value needed?
*Product is safe to use
*Eliminate risk of injuries
*FMEA
*Redesign for safety

53
Appendix B – Questionnaire for DFMA grading

54
Appendix C – Raw Data from Questionnaire
P1 P2 P3 P4 P5 P6 P7
1.1 5 4 4 3 2 5 3
a. 1 4 3 3 3 2 3
b. 5 4 5 4 2 3 3
c. 1 4 3 4 2 5 2
1.2 3 4 3 4 2 5 3
a. 3 5 3 1 1 1 4
b. 1 3 3 4 3 5 3
c. 1 3 3 1 2 3 1
1.3 4 4 3 5 3 3 3
a. 1 4 4 4 3 3 3
b. 4 4 3 4 3 3 3
2 yes yes yes yes yes yes yes
3 yes yes yes yes yes no N/A
4 manuf both design manuf design manuf design
5 yes yes yes yes yes yes yes
6 no yes yes yes no yes yes
7.1 4 4 5 2 5 5 3
7.2 3 3 2 1 2 3 3
7.3 5 5 4 4 3 5 3
7.4 3 3 5 2 1 3 3
7.5 5 5 4 4 4 5 3
7.6 5 5 5 3 1 4 3
7.7 4 3 3 4 4 5 3
Question 4: The design engineer is responsible for the design and part, so he should be re-sponsible, but the manufacturing engineer has the knowledge how things can be assembled in an easy way and circumstances in the actual factory that must be considered. So who should have the main responsibility is a difficult question. Both design engineer and manu-facturing engineer has to be highly involved.
Question 5: In early stages design department could work more independent from manu-facturing department to find interesting designs/design combinations.
Important that the system is easy to use Goal must be to lower total costs External suppliers need to be involved Report to Quality assurence matrix

55
Appendix D – Suggested layout DFA evaluation

56
Appendix E – Two-digit manual insertion and handling code
Two-digit handling code

57
Two-digit insertion code

58
Appendix F – Ingoing parts on child safety gate

59
Appendix G – New ingoing parts in child safety gate
x2
x 4x 4 x 8
x 2
x 2 x 2
x 2

60
Appendix H – Parts of the re-designed child safety gate

61
Appendix I - Evaluation of case study with suggested method

62

63
Appendix J – Strength calculations on child safety gate
For these overviewing analytical calculations several simplifications had to be made. The simplifica-
tions made were (in order);
Only calculating the two top bars as one (since they were fixed together) when establishing
the reaction forces.
Th ch l ’ w h w g w p c wh z m in detail and one
point force when calculating analytically.
When calculating shear forces in the fixed area the holes were disregarded and the shear
forces in the holes were calculated afterwards when the cross section forces were estab-
lished.
When calculating shear forces in the fixed area one bar was simplified and seen as a distrib-
uted load.
Constant μ l Kt m r S L σ m x
Value 0.6 0.95 2.1 20 0.003 0.25 0.7 75
Unit - m - kg m m m MPa
Constant B h
Value 0.035 0.025
Unit m m
is a constant gathered from the table 33.3 on page 356 in (Sundström, 1999).
Step 1: Determining external force applied by child. The gravitational pull on the child is estimated to
w m h l pl xu ( pp x m l 2/3 h ch l ’ h ul h gh ).
(1)
(2)
( )
(3)
(4)
( ) ( ) ( ( ) )
Which gives

64
Step 2: Determining the reaction forces
(5)
(6)
( ) ( )
Step 3: Drawing of cross sectional diagram
It is clear that the highest momentum is in the middle of the bar

65
Step 4: Sectional free body diagram to determine maximum momentum
(7)
Step 5: Determine hole to calculate
Now when it is clear what to calculate we can use the following equation (8) (Sundström, 1999) to
determine the bending stresses occurring in the hole;

66
( ) (8)
This is significantly lower than the allowed bending stress that is 75MPa. But good to keep in mind is
that in these calculation the hole is allowed to deform freely but in real cases stress concentrations
will build up since a stiff bolt is eliminating free deformation of the holes.