df contour®© - dynaflow, inc
TRANSCRIPT

DF_CONTOUR®©
VERSION 2
User Manual
A CONTOUR AND VECTOR PLOTTING TOOL FOR SCIENTIFIC DATA VISUALIZATION
DYNAFLOW, INC. RESEARCH AND DEVELOPMENT IN APPLIED SCIENCES
10621-J IRON BRIDGE ROAD
JESSUP, MD 20794 U.S.A.
Tel: (301) 604-3688 Fax: (301) 604-3689
E-mail: [email protected]
URL: http://www. dynaflow-inc.COM
DF_CONTOUR is a © Copyright of DYNAFLOW, INC. 2003. All rights reserved.

License Agreement This agreement governs your use of the DF_CONTOUR®© product and any material enclosed with it, including any manuals, disks, and computer program. Grant of License. This agreement permits you to use one copy of the Software, which is licensed as a single product. The software is “in use” on a computer when it is loaded into the temporary memory (i.e. RAM) or installed into the permanent memory (e.g., hard disk or other storage device) of that computer. You may use the Software on a network provided you have purchased one copy for each user. (Contact us about multiple user discounts.) Copyright and Restrictions. The software is owned by DYNAFLOW, INC. or its suppliers and is protected by United States copyright laws. You must treat the Software like any other copyrighted material, except that you may make one copy of the Software solely for backup archival purposes. You may not reverse engineer, decompile or disassemble the Software, except to the extent applicable law expressly prohibits the foregoing restriction. DYNAFLOW, INC. may have patents and/or pending patent applications covering subject matters in this document. The furnishing of this document does not give you any license to these patents. DYNAFLOW, INC. grants you a non-exclusive license to use one cop of the DF_CONTOUR®© software program. Limited Warranty. For 30 thirty days from your date of purchase, DYNAFLOW, INC. warrants that the media on which the Software is distributed are free from defects in materials and workmanship. DYNAFLOW, INC. will, at its option, refund the amount you paid for the Software or repair or replace the Software provided that (a) the defective Software is returned to DYNAFLOW, INC. or an authorized dealer within 60 days from the date of purchase and (b) you have completed and returned the enclosed registration. Limitation of Liabilities. In no event will DYNAFLOW, INC. be liable for any indirect, special, incidental, economic or consequential damages arising out of the use or inability to use the Software. In no event will DYNAFLOW, INC.’s liability exceed the amount paid by you for the Software. Restricted Rights. No part of this document may be reproduced or transmitted any form or by any means, electronic or mechanical, for any purpose, without the express written permission of DYNAFLOW, INC. Other brands or product names are trademarks or registered trademarks of their respective holders.

Table of Contents
OVERVIEW 1
HIGHLIGHTS OF DF_CONTOUR FEATURES 2
HOW TO… 3
INSTALLING DF_CONTOUR 3 FAST START 3
MENU COMMANDS 4
FILE MENU 4 NEW 4 OPEN... 4 SAVE... 4 SAVE AS... 4 ADD GRAPH... 4 PRINT... 5 PRINT PREVIEW 5 PRINT SETUP... 5 PAGE SETUP... 5 SEND... 6 MOST RECENTLY USED FILES 6 EXIT 6 EDIT MENU 7 UNDO 7 COPY 7 DELETE 7 TOOLS MENU 7 SELECT 7 ZOOM 7 OPTIONS MENU 8 LAYOUT 8 GRAPH PROPERTIES 8 ANIMATE OUTLINES 13 OUTLINE ANIMATION SETUP 13 ZOOM ORIGIN 13
APPENDIX A A-1
‘.CPV’ FILE FORMAT A-1
TAGS AND DESCRIPTION A-1 #TITLE A-1 #COMMENT A-2 #TIME A-2 #LEFTLABEL A-2 #RIGHTLABEL A-2 #OUTLINE A-3 #FIELD1 OR #SCALAR A-3 #FIELD2 OR #VECTOR A-4 #FIELD3 OR #PRESSVEL OR #SCALAR&VECTOR A-4 #FIELD4 A-5 #FIELD5 A-5 #MARKER A-6 ‘.CPV’ EXAMPLES A-7 EXAMPLE 1 A-7 EXAMPLE 2 A-8 EXAMPLE 3 A-9 EXAMPLE 4 (2DCONTC.CPV) A-10
APPENDIX B B-1
DF_CONTOUR DOCUMENT FILE FORMAT B-1 ‘.STG’ EXAMPLE B-3
APPENDIX C C-1
PRINTF FORMAT SPECIFICATION C-1 FLAG C-1 WIDTH C-2 .PRECISION C-2 TYPE C-3
APPENDIX D D-1
THE COLOR PALETTE D-1

DF_CONTOUR User Manual
OOVVEERRVVIIEEWW DF_CONTOUR is a Microsoft Windows® 95/NT® program for color contour plot representation for the visualization of scientific data. It uses a simple ASCII file format for the description of the DATA to represent. Scientists and engineers at DYNAFLOW, INC. faced with the complexity and limitations of existing contour and vector plotting programs developed their own easy to use software package for visualizing scientific data.
DF_CONTOUR generates publication ready visualizations from numerical or experimental result data. At DYNAFLOW, INC. we use this tool to represent results from laboratory experiments and to analyze the results of fluid dynamic programs we have developed such as 2DYNAFS© and 3DYNAFS© (please visit our web site http://www.dynaflow-inc.com/2-3DynaFS.htm for more information).
Overview 1

DF_CONTOUR User Manual
Specifically designed to be user friendly, efficient and flexible, DF_CONTOUR quickly allows the user to produce color graphic representation of the data in the format chosen, such as ‘Vector Fields’, ‘Scalar Fields’, ‘Shapes or Curves’, ‘Markers’, ‘XY graphs’, etc. DF_CONTOUR recognizes a simple user generated ASCII file format for the representation of numerical data. Only a one-word descriptor is required at the beginning of each data set to let DF_CONTOUR identify what type of data is being represented. Also, DF_CONTOUR can represent normal XY ASCII files with unlimited number of columns.
HIGHLIGHTS OF DF_CONTOUR FEATURES • Up to 16 different data sets can be viewed simultaneously • Sets of data can be displayed on a page in rows and columns • Results are printed as displayed • Simple point and click graph property modification • On the fly selection of color palettes • User defined color palettes in a very friendly and intuitive manner • Easy modification of scales • Color scalar and vector contours. • Color scalar and vector “ISO-contours” • Vector plotting mode • Interpolation scheme to enhance poorly described data • Outlines • Outline animation • Easy control of all visual aspects of data sets • Markers • Easy control of the Size and Color of Markers • X-Y graph with unlimited number of columns • Segment, Dots and Polyline modes for X-Y graph representation • Drag and Drop • Etc.
Overview 2

DF_CONTOUR User Manual
HHOOWW TTOO……
IINNSSTTAALLLLIINNGG DDFF__CCOONNTTOOUURR DF_CONTOUR is a Windows 95/NT program and uses an InstallShield wizard for the installation. • Insert DF_CONTOUR diskette in your floppy drive, • Click the Windows Start menu command, • Select Run…, • Type A:\Setup and follow the instructions.
FFAASSTT SSTTAARRTT DF_CONTOUR is an easy to use contouring and graphing program. It comes with several sample files installed in the Examples directory under DF_CONTOUR’s path. After you load DF_CONTOUR, double click the grayed rectangular zone in the center of the program window and choose a file from the Example directory. Once the sample is loaded and drawn on the screen, double-click the graph to edit its properties (see Graph Properties in Options Menu section). DF_CONTOUR accepts two types of private file formats with the extensions ‘.CPV’ and ‘.STG’, as well as simple ASCII DATA files. ‘.CPV’ files are simple ASCII data files preformatted with tags describing the data they contain (see Appendix A for details). ‘.STG’ files are the DF_CONTOUR document file format. They are based on the standard initialization file format (see Appendix B for details).
How To… 3

DF_CONTOUR User Manual
MMEENNUU CCOOMMMMAANNDDSS
FFIILLEE MMEENNUU
NEW Creates a new DF_CONTOUR document. A DF_CONTOUR document is a layout of different graphs organized in rows and columns. If the currently loaded document has changed, the user will be prompted to save his work. Keyboard: Ctrl+N Toolbar:
OPEN... Opens a DF_CONTOUR document and makes it as the active document. If the currently loaded document has changed, the user will be prompted to save his work. DF_CONTOUR uses a standard file format based on the Initialization (.INI) file format (see Appendix B for a full description of DF_CONTOUR documents file format). Keyboard: Ctrl+O Toolbar:
SAVE... Saves the active DF_CONTOUR document. If the active document was created with the New command, the user will be prompted to give a name to this document (see Save As in the next paragraph and Appendix B for a full description of DF_CONTOUR documents file format) Keyboard: Ctrl+S Toolbar:
SAVE AS... Saves the active document under a different name. If the chosen name already exists DF_CONTOUR will prompt the user to overwrite the file. (see Appendix B for a full description of DF_CONTOUR documents file format) Keyboard: none Toolbar: none
ADD GRAPH... Adds a graph from a file to the active document. The graph can be a DF_Contour special .CPV file (see Appendix A for a full description of .CPV files) or a standard ASCII Data file.
File Menu Menu Commands 4
DF_CONTOUR User Manual
The graph will be hosted in the currently selected ‘graph zone’ if this zone is free, if not it will be hosted by the first free ‘graph zone’. Graphs can be dropped in DF_CONTOUR from the Windows
Explorer. The selected ‘graph zone’ has this arrow on its upper-left corner Keyboard: Insert Toolbar:
PRINT... Use this command to print a document. This command presents a standard Windows ‘Print Dialog Box’ (figure 4), where you may specify the range of pages to be printed, the number of copies, the destination printer, and other printer setup options. Keyboard: Ctrl+P Toolbar:
PRINT PREVIEW Use this command to display the active document as it would appear when printed. When you choose this command, the main window will be replaced with a print preview window in which one or two pages will be displayed in their printed format. The print preview toolbar offers you options to view either one or two pages at a time; move back and forth through the document; zoom in and out of pages; and initiate a print job. Keyboard: none Toolbar:
PRINT SETUP... Use this command to select a printer and a printer connection. This command presents a standard Windows ‘Print Setup Dialog Box’ (figure 4), where you specify the printer and its connection. Keyboard: none Toolbar: none
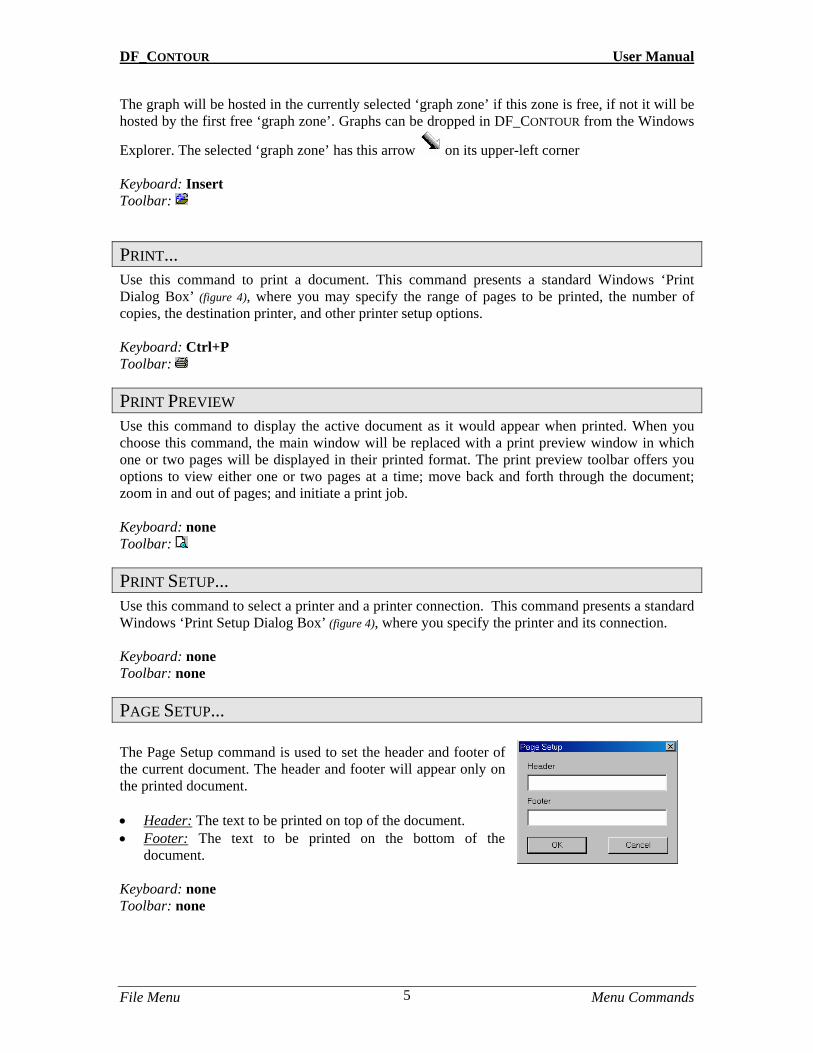
PAGE SETUP... The Page Setup command is used to set the header and footer of the current document. The header and footer will appear only on the printed document.
• Header: The text to be printed on top of the document. • Footer: The text to be printed on the bottom of the
document. Keyboard: none Toolbar: none
File Menu Menu Commands 5
DF_CONTOUR User Manual
SEND... Use this command to send the active document through electronic mail. This command presents a mail window with the active document attached to it. You may then fill out the “To:” field, “Subject:” field, etc., and add text to the body of the message if you wish. When you are finished you may click the “Send” button to send the message. Keyboard: none Toolbar: none
MOST RECENTLY USED FILES The numbers and filenames listed at the bottom of the File menu form a list of the Most Recently Used files. This list stores up to 9 different document names. Choose the number that corresponds with the document you want to open. Keyboard: none Toolbar: none
EXIT Use this command to end your DF_CONTOUR session. You can also use the Close command on the application Control menu. DF_CONTOUR prompts you to save documents with unsaved changes. Keyboard: Alt+F4 Mouse: Double-click the application's Control menu button Toolbar: none
File Menu Menu Commands 6
DF_CONTOUR User Manual
EEDDIITT MMEENNUU
UNDO Use this command to reverse the last editing action, if possible. The name of the command changes, depending on what the last action was. The “Undo” command changes to “Can't Undo” on the menu if you cannot reverse your last action. Keyboard: Ctrl+Z Toolbar: none
COPY Use this command to copy selected ‘graph zone’ onto the clipboard. This command is unavailable if the selected ‘graph zone’ has no data associated with it. Copying data to the clipboard replaces the contents previously stored there. Keyboard: Ctrl+C Toolbar:
DELETE Use this command to remove the graph from the currently selected ‘graph zone’. Removing data from a ‘graph zone’ will delete all the settings associated with this graph zone. Keyboard: Delele Toolbar:
TTOOOOLLSS MMEENNUU
SELECT Use this command to switch to select mode. In the select mode, using the mouse you can double-click an empty ‘graph zone’ to associate data to it (see Add Graph... section), double-click a valid ‘graph-zone’ and edit/change its properties (see Graph properties... section), and click and drag to move around ‘graph zones’. Keyboard: none Toolbar:
ZOOM Use this command to switch to zoom mode. In the zoom mode, you can click and drag to zoom on the defined rectangular area in a valid ‘graph zone’. Keyboard: none Toolbar:
Edit &Tools Menu Menu Commands 7

DF_CONTOUR User Manual
OOPPTTIIOONNSS MMEENNUU
LAYOUT Use this command to control the layout of the ‘graph zones’ in DF_CONTOUR. The user can select any combination of a layout between 4 rows and 4 columns. Keyboard: none Toolbar:
GRAPH PROPERTIES Use this command to control the properties of the currently selected ‘graph zone’. Depending on the type of data of the ‘graph zone’, .CPV file or an ASCII file, the properties would have more or less available options. Keyboard: F5 Toolbar: General:
• File Name is the name of the file associated with the currently edited ‘graph zone’. • Title is the title of the ‘graph zone’. Check the box at the left to make the title visible. The
text of the title will be shown at the top center of the ‘graph zone’. • Label (left) is the label to be shown on the upper-left corner of the ‘graph zone’. Check the
box at the left to make it visible. • Label (right) is the label to be shown on the upper-right corner of the ‘graph zone’. Check the
box at the left to make it visible. • Show Grid shows/hides a grid on top of the ‘graph zone’ • Font… invokes a Dialog Box to choose a different font. Only TrueType fonts are accepted.
Options Menu Menu Commands 8

DF_CONTOUR User Manual
Scale:
This Property page is used to precisely control the scales of the current ‘graph zone’. You can use the zoom mode to visually zoom or scale a rectangular region on the graph. Axis:
This property page controls the appearance of the vertical and horizontal axis of the current ‘graph zone’. • Legend shows/hides the legend text. The text is entered in the input box below the Legend. • Show Scale shows/hides the tick marks on the axis. • Show Values shows/hides the values on the axis. • Values Format is the format of the values shown on the axis. This follows the ‘C’ language
printf format. Refer to Appendix C for details. • Color Scale | Values Format is the format of the values shown on the color scale. • Color Scale | Label is the text used for the color scale label.
Options Menu Menu Commands 9
DF_CONTOUR User Manual
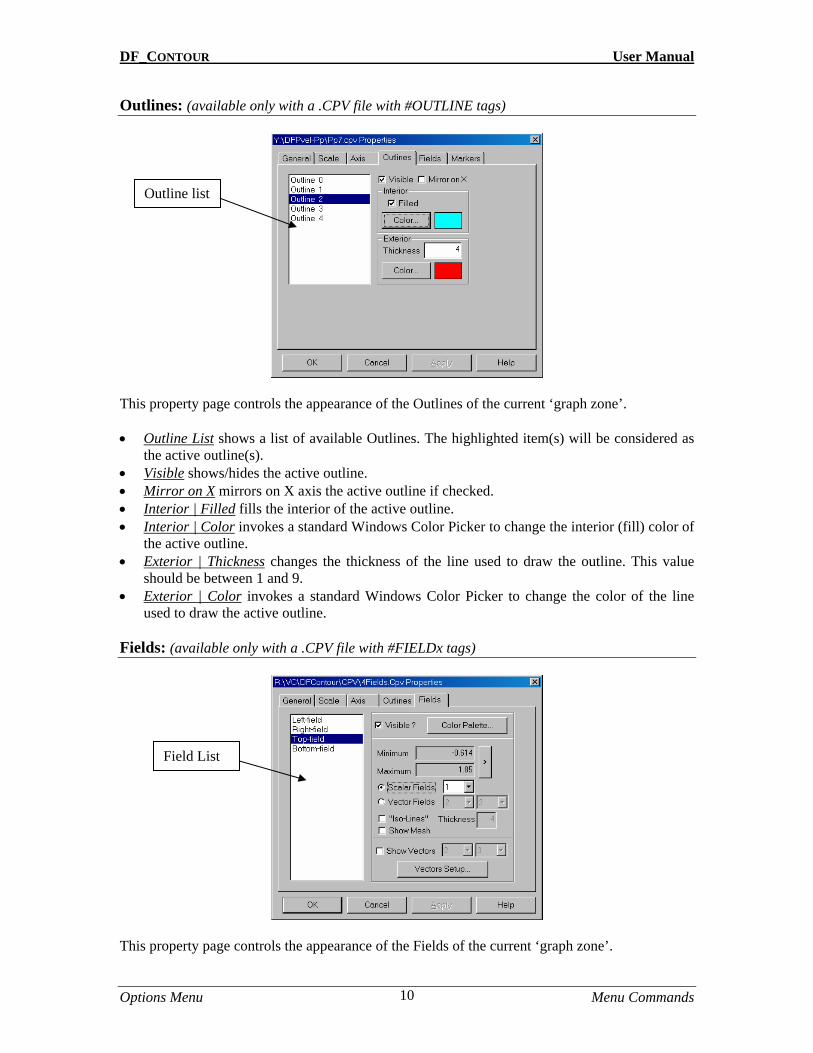
Outlines: (available only with a .CPV file with #OUTLINE tags)
Outline list
This property page controls the appearance of the Outlines of the current ‘graph zone’. • Outline List shows a list of available Outlines. The highlighted item(s) will be considered as
the active outline(s). • Visible shows/hides the active outline. • Mirror on X mirrors on X axis the active outline if checked. • Interior | Filled fills the interior of the active outline. • Interior | Color invokes a standard Windows Color Picker to change the interior (fill) color of
the active outline. • Exterior | Thickness changes the thickness of the line used to draw the outline. This value
should be between 1 and 9. • Exterior | Color invokes a standard Windows Color Picker to change the color of the line
used to draw the active outline. Fields: (available only with a .CPV file with #FIELDx tags)
Field List
This property page controls the appearance of the Fields of the current ‘graph zone’.
Options Menu Menu Commands 10

DF_CONTOUR User Manual
• Fields List shows a list of all the available fields. The highlighted item(s) will be considered as the active field(s).
• Visible shows/hides the active fields(s). • Color Palette edits the colors used for the fields in the active filed(s). (see Appendix D for a full
description) • Minimum/Maximum shows the current limits of the chosen contour (Scalar or Vector). To
change the limits of the quantities included with the active field click the (>) button. • Scalar Field interpolates and plots Scalar Contours using the Quantity defined in the ‘drop-
down control’ on the right. • Vector Fields interpolates and plots Vector Contours using the Quantities defined in the
‘drop-down controls’ on the right. The first ‘drop-down control’ being the U component and the second the V component.
• “ISO-Lines” plots using “ISO-contours”. • Thickness is the thickness of the line used to plot the “ISO-contours”. • Show Mesh shows/hides the Mesh used to generate the contours. • Show Vectors plots Velocity Vectors using the Quantities defined in the ‘drop-down controls’
on the right. The first ‘drop-down control’ being the U component and the second the V component.
• Vectors Setup controls the visual appearance of the vectors.
• Sizing Factor is the multiplier used on the length of the vectors.
• Thickness is the thickness of the line used to plot the vectors.
• X, Y step controls the density of the drawn velocity vectors.
• Color Change is used to change the color of the drawn vectors.
Markers: (available only with a .CPV file with #MARKER tag) Use this property page to control the appearance of the markers.
• Sizing-Factor is the multiplier used on
the size of the markers. • Negative Marker Color is the color in
which markers with negative values are drawn.
• Null Marker Color is the color in which marker with a ‘zero’ value are drawn.
• Positive Marker Color is the color in which markers with positive values are drawn.
Options Menu Menu Commands 11

DF_CONTOUR User Manual
X-Y Graph (available only with X-Y Graphs) Use this property page to control the appearance of X-Y graphs. By default, DF_CONTOUR will choose data column 1 as the X axis and data column 2 as the Y axis. Where the data consists of only one column file, the data column will be assigned to the Y axis and the line number the X axis. Using this property page you add graphs to the current ‘graph zone’, change the visual aspects and the connection type used to draw the graphs.
Graph List
Multiplierfactor
Column combo-box
Graph Name
• Graph List shows a list of the available XY Graphs. The highlighted item(s) will be
considered as the active graph(s). • Add creates a new graph and adds it to the graph list. The new graph name will be the name
entered in the Graph Name input box. • Change changes the name of the active graph. • Delete deletes the active graph. • Line Thickness changes the thickness of the line used to draw the graph. • X axis | column # is the column used for the X axis. • X axis | Column combo-box is the list of the available columns. • X axis | multiplier is a multiplier used on the X axis. Five types of multipliers are available:
none, *, /, + and -. • X axis | Multiplier factor is the factor associated with the multiplier on the X axis. • Y axis | column # is the column used for the X axis. • Y axis | Column combo-box is the list of the available columns. • Y axis | multiplier is a multiplier used on the X axis. Five types of multipliers are available:
none, *, /, + and -. • Y axis | Multiplier factor is the factor associated with the multiplier on the Y axis. • Color is the color used to draw the active graph. • Connection Type is the type of connection between the XY points used to plot the graph. The
connection can be: Segments (point1 connected to point2, point3 connected to point4 …), Polyline (point1 connected to point2, point2 connected to point3 ….), and Dots (no connection between points, a marker is drawn of the point position).
Options Menu Menu Commands 12

DF_CONTOUR User Manual
ANIMATE OUTLINES Use this command to animate the outlines of the current ‘graph zone’. For this option to be available the associated .CPV should have at least 3 #OUTLINE tags. See the included 2DContc.CPV file and the next section (Outline Animation Setup). Keyboard: none Toolbar:
OUTLINE ANIMATION SETUP Use this command to control the behavior of the Outline Animation. Time Step is the delay between frames in the outline animation. Show is the number of successive outlines to show in each frame. Skip is the number of successive outlines to skip between frames. Keyboard: none Toolbar:
ZOOM ORIGIN Use this command to force the scales to the values read from the original file. Keyboard: none Toolbar:
Options Menu Menu Commands 13

DF_CONTOUR User Manual
AAPPPPEENNDDIIXX AA
‘‘..CCPPVV’’ FFIILLEE FFOORRMMAATT Document conventions: \n new line \t tab character [...] optional parameter The .CPV file format is a simple ASCII file with special tags. Each tag has a special meaning and indicates the type of the data it is describing. Tags start with a # sign and ends with a new line (\n). Some tags accept a descriptor before the (\n). They are always followed by at least one line describing the data. For instance, the following two lines describe a 'title' tag with 'My Title' as data:
#TITLE My Title
Tags don't have to be on the first column, but they can only be preceded by the space character (ASCII 32) or \t. Empty lines are allowed anywhere in .CPV files. A .CPV file should always have a new line after the last data. DF_CONTOUR generates error messages in the case it encounters a problem in a file. In the error message a line number will be given. This line number indicates in reality the tag number (in the order it was read) in the file. DF_CONTOUR may confuse a normal ASCII data file with a .CPV and generate an error message if the ASCII file has a line with the # sign as the first character.
TTAAGGSS AANNDD DDEESSCCRRIIPPTTIIOONN
#TITLE This is a tag describing a title for the graph. It has to be followed by a string containing the text of the title. Only one title tag is allowed in a file (in the case of the existence of multiple titles the last one will be used). Format: #TITLE string
Appendix A A-1

DF_CONTOUR User Manual
#COMMENT This is a tag describing a ‘comment’. It has to be followed by a string containing the text of the ‘comment’. Only one ‘comment’ tag is allowed in a file (in the case of the existence of multiple ‘comments’ the last one will be used). The text of the ‘comment’ will be used at run-time whenever the user moves the mouse cursor over the zone hosting the .CPV file. This comment will be shown in the StatusBar. Format: #COMMENT string
#TIME This is a tag describing time of the .CPV file. It has to be followed by a real number containing the ‘time’ then by a string describing the unit to be used. This tag is very useful when using successive .CPV files for animation. The difference between time tags will be used as a delay between images. Only one ‘time’ tag is allowed in a file (in the case of the existence of multiple 'times' the last one will be used). Format: #TIME real string
#LEFTLABEL This is a tag describing a label to be shown on the upper-left corner of the zone hosting the .CPV file. Only one ‘leftlabel’ tag is allowed in a file (in the case of the existence of multiple ‘leftlabels’ the last one will be used). Format: #LEFTLABEL string
#RIGHTLABEL This is a tag describing a label to be shown on the upper-right corner of the zone hosting the .CPV file. Only one ‘rightlabel’ tag is allowed in a file (in the case of the existence of multiple ‘rightlabels’ the last one will be used). Format: #RIGHTLABEL string
Appendix A A-2
DF_CONTOUR User Manual
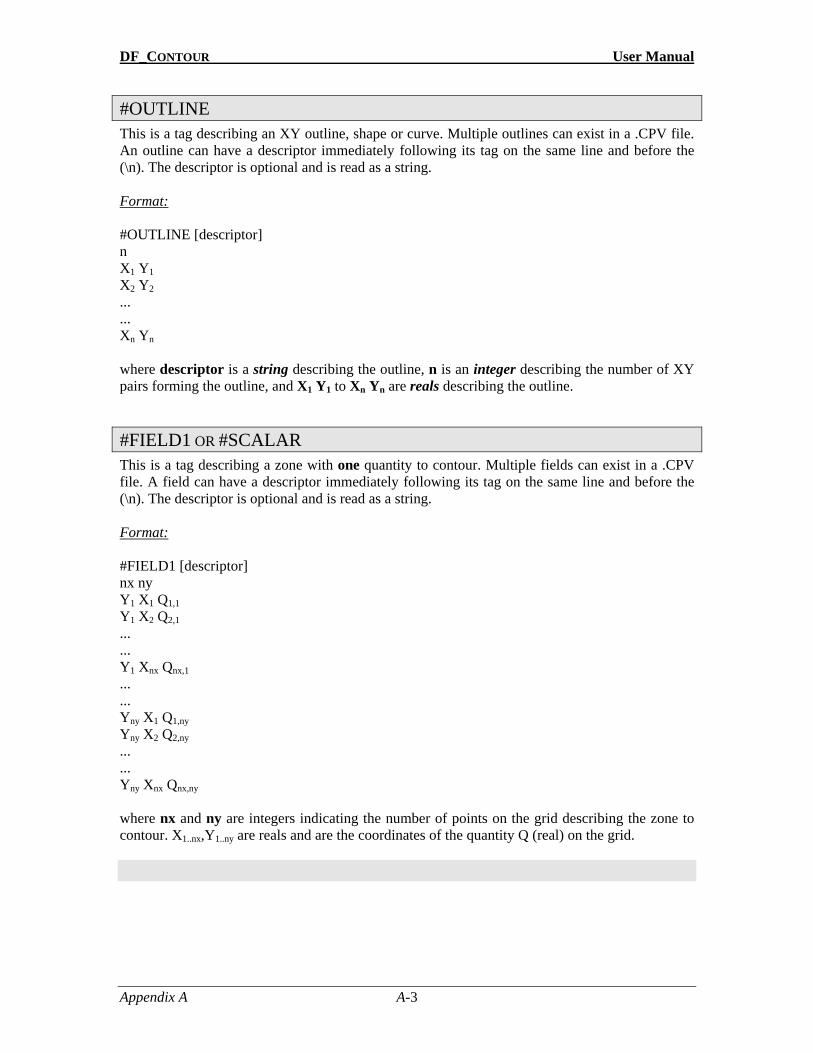
#OUTLINE This is a tag describing an XY outline, shape or curve. Multiple outlines can exist in a .CPV file. An outline can have a descriptor immediately following its tag on the same line and before the (\n). The descriptor is optional and is read as a string. Format: #OUTLINE [descriptor] n X1 Y1X2 Y2... ... Xn Yn where descriptor is a string describing the outline, n is an integer describing the number of XY pairs forming the outline, and X1 Y1 to Xn Yn are reals describing the outline.
#FIELD1 OR #SCALAR This is a tag describing a zone with one quantity to contour. Multiple fields can exist in a .CPV file. A field can have a descriptor immediately following its tag on the same line and before the (\n). The descriptor is optional and is read as a string. Format: #FIELD1 [descriptor] nx ny Y1 X1 Q1,1Y1 X2 Q2,1... ... Y1 Xnx Qnx,1... ... Yny X1 Q1,nyYny X2 Q2,ny... ... Yny Xnx Qnx,ny where nx and ny are integers indicating the number of points on the grid describing the zone to contour. X1..nx,Y1..ny are reals and are the coordinates of the quantity Q (real) on the grid.
Appendix A A-3

DF_CONTOUR User Manual
#FIELD2 OR #VECTOR This is a tag describing a zone with two quantities to contour. Multiple fields can exist in a .CPV file. A field can have a descriptor immediately following its tag on the same line and before the (\n). The descriptor is optional and is read as a string. Format: #FIELD2 [descriptor] nx ny Y1 X1 Q11,1 Q21,1Y1 X2 Q12,1 Q22,1... ... Y1 Xnx Q1nx,1 Q2nx,1... ... Yny X1 Q11,ny Q21,nyYny X2 Q12,ny Q22,ny... ... Yny Xnx Q1nx,ny Q2nx,ny where nx and ny are integers indicating the number of points on the grid describing the zone to contour. X1..nx,Y1..ny are reals and are the coordinates of the quantities Q1 and Q2 (reals) on the grid.
#FIELD3 OR #PRESSVEL OR #SCALAR&VECTOR This is a tag describing a zone with three quantities to contour. Multiple fields can exist in a .CPV file. A field can have a descriptor immediately following its tag on the same line and before the (\n). The descriptor is optional and is read as a string. Format: #FIELD3 [descriptor] nx ny Y1 X1 Q11,1 Q21,1 Q31,1Y1 X2 Q12,1 Q22,1 Q32,1... ... Y1 Xnx Q1nx,1 Q2nx,1 Q3nx,1... ... Yny X1 Q11,ny Q21,ny Q31,nyYny X2 Q12,ny Q22,ny Q32,ny... ... Yny Xnx Q1nx,ny Q2nx,ny Q3nx,ny
Appendix A A-4

DF_CONTOUR User Manual
where nx and ny are integers indicating the number of points on the grid describing the zone to contour. X1..nx,Y1..ny are reals and are the coordinates of the quantities Q1, Q2 and Q3 (reals) on the grid.
#FIELD4 This is a tag describing a zone with four quantities to contour. Multiple fields can exist in a .CPV file. A field can have a descriptor immediately following its tag on the same line and before the (\n). The descriptor is optional and is read as a string. Format: #FIELD4 [descriptor] nx ny Y1 X1 Q11,1 Q21,1 Q31,1 Q41,1Y1 X2 Q12,1 Q22,1 Q32,1 Q42,1... ... Y1 Xnx Q1nx,1 Q2nx,1 Q3nx,1 Q4nx,1... ... Yny X1 Q11,ny Q21,ny Q31,ny Q41,nyYny X2 Q12,ny Q22,ny Q32,ny Q42,ny... ... Yny Xnx Q1nx,ny Q2nx,ny Q3nx,ny Q4nx,ny where nx and ny are integers indicating the number of points on the grid describing the zone to contour. X1..nx,Y1..ny are reals and are the coordinates of the quantities Q1, Q2, Q3 and Q4 (reals) on the grid.
#FIELD5 This is a tag describing a zone with five quantities to contour. Multiple fields can exist in a .CPV file. A field can have a descriptor immediately following its tag, on the same line and before the (\n). The descriptor is optional and read as a string. Format: #FIELD5 [descriptor] nx ny Y1 X1 Q11,1 Q21,1 Q31,1 Q41,1 Q51,1Y1 X2 Q12,1 Q22,1 Q32,1 Q42,1 Q52,1... ... Y1 Xnx Q1nx,1 Q2nx,1 Q3nx,1 Q4nx,1 Q5nx,1... ... Yny X1 Q11,ny Q21,ny Q31,ny Q41,ny Q51,ny
Appendix A A-5

DF_CONTOUR User Manual
Yny X2 Q12,ny Q22,ny Q32,ny Q42,ny Q52,ny... ... Yny Xnx Q1nx,ny Q2nx,ny Q3nx,ny Q4nx,ny Q5nx,ny where nx and ny are integers indicating the number of points on the grid describing the zone to contour. X1..nx,Y1..ny are reals and are the coordinates of the quantities Q1, Q2, Q3, Q4 and Q5 (reals) on the grid.
#MARKER A tag describing markers or special points in the field to contour (exp. particles, vortices ...). Each marker is described by its position X Y, and a value I representing its intensity. The intensity is used to determine the size and the color of the marker. Only one marker tag is allowed in .CPV file. (in the case of the existence of multiple 'markers' DF_CONTOUR will generate an error and stops reading the file). Format: #MARKER n X1 Y1 I1X2 Y2 I2... ... Xn Yn In where X, Y and I are reals, and n an integer describing the number of following markers.
Appendix A A-6

DF_CONTOUR User Manual
‘‘..CCPPVV’’ EEXXAAMMPPLLEESS
EXAMPLE 1 #TITLE Example 1 #COMMENT Estimated Pressures on a Plate #FIELD1 Pressure 7 4 .300 -1.0 0 .400 -1.0 0 .500 -1.0 0.33 .600 -1.0 0.34 .750 -1.0 0.4 1.000 -1.0 0.4 1.500 -1.0 0.4 .300 -0.5 0 .400 -0.5 0 .500 -0.5 0.28 .600 -0.5 0.33 .750 -0.5 0.3 1.000 -0.5 0.4 1.500 -0.5 0.4 .300 0.0 0 .400 0.0 0 .500 0.0 0.23 .600 0.0 0.28 .750 0.0 0.3 1.000 0.0 0.36 1.500 0.0 0.4 .300 1.0 0 .400 1.0 0 .500 1.0 0 .600 1.0 0.27 .750 1.0 0.25 1.000 1.0 0.31 1.500 1.0 0.4
Appendix A A-7

DF_CONTOUR User Manual
EXAMPLE 2 #TITLE Non Rectangular Grid #FIELD1 pressure 7 4 .300 -1.00 0 .400 -0.90 0 .500 -0.8 0.33 .600 -0.7 0.34 .750 -0.8 0.4 1.000 -0.9 0.4 1.200 -1.00 0.4 .250 -0.5 0 .400 -0.5 0 .500 -0.5 0.28 .600 -0.5 0.33 .750 -0.5 0.3 1.100 -0.5 0.4 1.250 -0.5 0.4 .350 0.0 0 .400 0.0 0 .500 0.0 0.23 .600 0.0 0.28 .750 0.0 0.3 1.000 0.0 0.36 1.500 0.0 0.4 .300 1.0 0 .400 0.9 0 .500 0.8 0 .650 0.7 0.27 .750 0.8 0.25 1.000 0.9 0.31 1.200 1.0 0.4
Appendix A A-8

DF_CONTOUR User Manual
EXAMPLE 3 #contour outline1 6 750 0.5 1000 2.5 1200 3.2 1500 3.2 1500 0.5 750 0.5 #contour outline2 5 1400 0.5 1400 2.0 1600 3.2 1600 0.5 1400 0.5 #pressvel pressure-velocity 7 4 300 0.5 0 0 0 400 0.5 0 0 0 500 0.5 0.33 0 0 600 0.5 0.34 0 0 750 0.5 0.4 0 0 1000 0.5 0.4 0 0 1500 0.5 0.4 0 0 300 1.5 0 0 0 400 1.5 0 0 0 500 1.5 0.28 0 0 600 1.5 0.33 0 0 750 1.5 0.3 0 0 1000 1.5 0.4 0 0 1500 1.5 0.4 0 0 300 2.5 0 0 0 400 2.5 0 0 0 500 2.5 0.23 0 0 600 2.5 0.28 0 0 750 2.5 0.3 0 0 1000 2.5 0.36 0 0 1500 2.5 0.4 0 0 300 3.2 0 0 0 400 3.2 0 0 0 500 3.2 0 0 0 600 3.2 0.27 0 0 750 3.2 0.25 0 0 1000 3.2 0.31 0 0 1500 3.2 0.4 0 0
Appendix A A-9

DF_CONTOUR User Manual
EXAMPLE 4 (2DCONTC.CPV) Please note the file is not completely listed in the documentation. You can locate this file in Examples\2dcontc.cpv #OUTLINE Body1 33 0.0000000E+00 0.1055587 1.0346569E-02 0.1050504 2.0593498E-02 0.1035305 3.0642096E-02 0.1010134 4.0395595E-02 9.7523563E-02 #OUTLINE Bubble1 41 0.0000000E+00 2.147926 7.6775670E-02 2.145771 0.1530780 2.139320 0.2284365 2.128613 0.3023867 2.113716 0.3744725 2.094721 0.4442496 2.071743 #OUTLINE Body233
Click the Animation button to animate the Outlines
Outlines Mirrored on the X axis
33 0.0000000E+00 0.7397121 5.1427346E-02 0.7438111 0.1029342 0.7468863 0.1543137 0.7516404 0.2054772 0.7582446 0.2562981 0.7671769 #OUTLINE Bubble233 41 0.0000000E+00 2.147926 7.6775670E-02 2.145771 0.1530780 2.139320 0.2284365 2.128613 0.3023867 2.113716 0.3744725 2.094721 0.4442496 2.071743
Appendix A A-10

DF_CONTOUR User Manual
AAPPPPEENNDDIIXX BB
DDFF__CCOONNTTOOUURR DDOOCCUUMMEENNTT FFIILLEE FFOORRMMAATT DF_CONTOUR documents are based on the Initialization files. Initialization files are easy to create and manage, and are simple ASCII files. Initialization files are organized in ‘Sections’ and ‘Keys’. ‘Sections’ are always between square brackets and play the role of headers for ‘Keys’. For example the following paragraph describes a ‘Section’ named General with a ‘Key’ named version with a value equal to 2 and another ‘Key’ named Comment with the value DF_CONTOUR: [General] version=2.0 Comment=DF_CONTOUR The following table describes DF_CONTOUR Sections and Keys. [GENERAL] Section
Key Type Default value Version Real 2.0
NumberOfGrafs Integer 1 NumberOfCols Integer 1
NumberOfRows Integer 1 PrintHeader String empty string PrintFooter String empty string
16 GRAF sections are allowed [GRAF0], [GRAF1], …, GRAF[15]
Key Type Default value FileName String empty string
FontName String Arial Title String empty string
UnitLabel String empty string XScaleFormat String %g YScaleFormat String %g
ColorScaleFormat String %.3f XLabel String X axis YLabel String Y axis
LeftLabel String empty string RightLabel String empty string VisibleTitle Boolean 1
VisibleLeftLabel Boolean 0 VisibleRightLabel Boolean 0
VisibleUnitLabel Boolean 1 VisibleColorScale Boolean 1 VisibleScaleOnX Boolean 1 VisibleScaleOnY Boolean 1
Appendix B B-1

DF_CONTOUR User Manual
VisibleScaleOnXValue Boolean 1 VisibleScaleOnYValue Boolean
VisibleLegendOnX Boolean 1 VisibleLegendOnY Boolean 1
VisibleGrid Boolean 1 Xmin Real -1 Xmax Real 1 Ymin Real -1 Ymax Real 1
NumberOfFields Integer 0 n and k are integers and represent respectively the #FIELD and #OUTLINE described in a .CPV file.
FLD-Name(n) String Field FLD-Visible(n) Boolean 1
FLD-MeshVisible(n) Boolean 0 FLD-nColumns(n) Integer 1
FLD-Min(k)-(n) Real -1 FLD-Max(k)-(n) Real 1
FLD-ScalarField(n) Boolean 1 FLD-ScalarField(X)(n) Integer 1
FLD-VectorField(n) Boolean 0 FLD-VectorField(X)(n) Integer 2 FLD-VectorField(Y)(n) Integer 3
FLD-ShowVelocityVectors(n) Boolean 0 FLD-VelVector(X)(n) Integer 2 FLD-VelVector(y)(n) Integer 3
FLD-iso-lines(n) Boolean 0 FLD-iso-lines-thickness(n) Integer 4
FLD-VV-ArrowThickness(n) Integer 1 FLD-VV-ArrowColor(n) Long integer 167772151
FLD-VV-ArrowXStep(n) Integer 4 FLD-VV-ArrowYStep(n) Integer 4
FLD-VV-ArrowSizingFactor(n) Real 1 NumberOfOutlines Integer 0
OTL-Name(m) String Outline OTL-Visible(m) Boolean 1
OTL-SimmX(m) Boolean 0 OTL-Filled(m) Boolean 0
OTL-Thickness(m) Integer 4 OTL-Color(m) Long integer 01
OTL-FillColor(m) Long integer 2551
PalInd(0) Long integer 0 … Long integer …
PalInd(255) Long integer 167772151
Appendix B B-2

DF_CONTOUR User Manual
‘.STG’ EXAMPLE ; ******************************************************************** ; DF_Contour Version 2.0 Document File ; DF_Contour Copyright © Dynaflow, Inc. 1997, 98. All rights reserved. ; ; Date: Tuesday 11/20/1997 14:11:54 ; ; ******************************************************************** [GENERAL] Version=2 NumberOfGrafs=1 NumberOfCols=1 NumberOfRows=1 PrintHeader= PrintFooter= [GRAF0] FileName=Test.cpv FontName=Arial Title=Test file UnitLabel=psi XScaleFormat=%g YScaleFormat=%g ColorScaleFormat=%g XLabel=X YLabel=Y LeftLabel= RightLabel= VisibleTitle=1 VisibleLeftLabel=0 VisibleRightLabel=0 VisibleUnitLabel=1 VisibleColorScale=1 VisibleScaleOnX=1 VisibleScaleOnY=1 VisibleScaleOnXValue=1 VisibleScaleOnYValue=1 VisibleLegendOnX=1 VisibleLegendOnY=1 VisibleGrid=1 Xmin=0.3 Xmax=1.5 Ymin=-1 Ymax=1 NumberOfFields=1 FLD-Name(0)=pressure-velocity FLD-Visible(0)=1 FLD-MeshVisible(0)=0
Appendix B B-3

DF_CONTOUR User Manual
FLD-nColumns(0)=1 FLD-Min(0)-(0)=0 FLD-Max(0)-(0)=0.4 FLD-Min(1)-(0)=-6.27744e+066 FLD-Max(1)-(0)=-6.27744e+066 FLD-Min(2)-(0)=-6.27744e+066 FLD-Max(2)-(0)=-6.27744e+066 FLD-Min(3)-(0)=-6.27744e+066 FLD-Max(3)-(0)=-6.27744e+066 FLD-Min(4)-(0)=-6.27744e+066 FLD-Max(4)-(0)=-6.27744e+066 FLD-ScalarField(0)=1 FLD-ScalarField(X)(0)=0 FLD-VectorField(0)=0 FLD-VectorField(X)(0)=1 FLD-VectorField(Y)(0)=2 FLD-ShowVelocityVectors(0)=0 FLD-VelVector(X)(0)=1 FLD-VelVector(y)(0)=2 FLD-iso-lines(0)=0 FLD-iso-lines-thickness(0)=4 FLD-VV-ArrowThickness(0)=2 FLD-VV-ArrowColor(0)=16777215 FLD-VV-ArrowXStep(0)=4 FLD-VV-ArrowYStep(0)=4 FLD-VV-ArrowSizingFactor(0)=1 NumberOfOutlines=0 PalInd(0)=8388736 PalInd(1)=8519806 PalInd(2)=8650876 … … PalInd(251)=10495 PalInd(252)=8447 PalInd(253)=6399 PalInd(254)=4351 PalInd(255)=255
Appendix B B-4

DF_CONTOUR User Manual
Appendix C C-1
AAPPPPEENNDDIIXX CC
PPRRIINNTTFF FFOORRMMAATT SSPPEECCIIFFIICCAATTIIOONN A format specification, which consists of optional and required fields and has the following form:
%[flags] [width] [.precision] type Each field of the format specification is a single character or a number signifying a particular format option. The simplest format specification contains only the percent sign and a type character (for example, %f). The optional fields, which appear before the type character, control other aspects of the formatting, as follows: • flags: Optional character or characters that control justification of output and printing of
signs, blanks, and decimal points. • width: Optional number that specifies the minimum number of characters output. • precision: Optional number that specifies the maximum number of characters printed for all
or part of the output field, or the minimum number of digits printed for integer values. • type: Required character that determines whether the associated argument is interpreted as a
character, a string, or a number.
FLAG The first optional field of the format specification is flags. A flag directive is a character that justifies output and prints signs, blanks and decimal points. (see Table below).
Flag Meaning Default - Left align the result within the given field width. Right align + Prefix the output value with a sign (+ or –) if the output value is
of a signed type. Sign appears only for negative signed values
0 If width is prefixed with 0, zeros are added until the minimum width is reached. If 0 and – appear, the 0 is ignored.
No Padding.
blank (' ') Prefix the output value with a blank if the output value is signed and positive; the blank is ignored if both the blank and + flags appear.
No blank appears.
# When used with the e, E, or f format, the # flag forces the output value to contain a decimal point in all cases.
Decimal point appears only if digits follow it.
# When used with the g or G format, the # flag forces the output
value to contain a decimal point in all cases and prevents the truncation of trailing zeros.
Decimal point appears only if digits follow it.
Trailing zeros are truncated.

DF_CONTOUR User Manual
Appendix C C-2
WIDTH The second optional field of the format specification is the width specification. The width argument is a non-negative decimal integer controlling the minimum number of characters printed. If the number of characters in the output value is less than the specified width, blanks are added to the left or the right of the values — depending on whether the – flag (for left alignment) is specified — until the minimum width is reached. If width is prefixed with 0, zeros are added until the minimum width is reached (not useful for left-aligned numbers). The width specification never causes a value to be truncated. If the number of characters in the output value is greater than the specified width, or if width is not given, all characters of the value are printed (subject to the precision specification). If the width specification is an asterisk (*), an integer argument from the argument list supplies the value. The width argument must precede the value being formatted in the argument list. A nonexistent or small field width does not cause the truncation of a field; if the result of a conversion is wider than the field width, the field expands to contain the conversion result.
.PRECISION The third optional field of the format specification is the precision specification. It specifies a nonnegative decimal integer, preceded by a period (.), which specifies the number of characters to be printed, the number of decimal places, or the number of significant digits (see Table 2). Unlike the width specification, the precision specification can cause either truncation of the output value or rounding of a floating-point value.
Precision Meaning Default E, e The precision specifies the number of
digits to be printed after the decimal point. The last printed digit is rounded.
Default precision is 6; if precision is 0 or the period (.) appears without a number following it, no decimal point is printed.
f The precision value specifies the number of digits after the decimal point. If a decimal point appears, at least one digit appears before it. The value is rounded to the appropriate number of digits.
Default precision is 6; if precision is 0, or if the period (.) appears without a number following it, no decimal point is printed.
G, g The precision specifies the maximum number of significant digits printed.
Six significant digits are printed, with any trailing zeros truncated.

DF_CONTOUR User Manual
Appendix C C-3
TYPE The type character is the only required format field ; it appears after any optional format fields. The type character determines whether the associated argument is interpreted as a character, string, or number.
Character Type Output Format e double Signed value having the form [ – ] d. dddd e
[sign] ddd where d is a single decimal digit, dddd is one or more decimal digits, ddd is exactly three decimal digits, and sign is + or –.
E double Identical to the e format except that E rather than e introduces the exponent.
f double Signed value having the form [ – ] dddd. dddd, where dddd is one or more decimal digits. The number of digits before the decimal point depends on the magnitude of the number, and the number of digits after the decimal point depends on the requested precision.
g double Signed value printed in f or e format, whichever is more compact for the given value and precision. The e format is used only when the exponent of the value is less than –4 or greater than or equal to the precision argument. Trailing zeros are truncated, and the decimal point appears only if one or more digits follow it.
G double Identical to the g format, except that E, rather than e, introduces the exponent (where appropriate).

DF_CONTOUR User Manual
Table of Contents TOC-1
AAPPPPEENNDDIIXX DD
TTHHEE CCOOLLOORR PPAALLEETTTTEE
Selected Cell
DF_CONTOUR uses color palettes for the representation of color contours. With this option you can create new color palettes and edit existing ones. DF_CONTOUR is delivered with a variety of previously selected color palettes installed in the ‘PAL’ directory under the program path. Each color palette is composed on 256 different entries that you can edit individually or by group. To select a color entry, click on the entry with the mouse. Click and drag to select multiple entries. • Cut: Cuts the selected entries and stores a copy in the clipboard. • Copy: Copies the selected entries to the clipboard. • Paste: Pastes from the clipboard a previously Cut or Copied entries. • Invert Color: Inverts the color on the selected entries. • Invert Order: Inverts the order of the selected entries so the 1st one becomes the last one and
the last one becomes the 1st one. • Shade: Gradually changes the color in a selection from the selected 1st entry to the selected
last entry. To make a color palette with shades of gray; change the color of the 1st entry to Black, change the color of the last entry to White, select all the color entries and click Shade.
• Swap: Swaps color entries. This operation is done by making a selection, clicking swap and using the mouse clicking at the desired swap color cell. For example to swap the first 16 entries with the last ones, select the first row of entries, click swap and click the first column in the last row of the color entries.
• Add RGB…: Adds a certain amount of Red, Green and Blue to the selected cells. • Remove RGB…: Removes a certain amount of Red, Green and Blue from the selected cells. • Load…: Loads a color palette from a previously saved color palette file. • Save: Saves a color palette to a file. • Save As…: Saves a color palette to a file using a different name. • Set Default: The current color palette will be set as the default color palette. DF_CONTOUR
will assign that color palette to newly created contours.