dewetron automotive test & measurement solutions › centaur-wp › the... · 2015-12-14 ·...
TRANSCRIPT

www.dewetron.com
DEWETRON Automotive Applications & General Test and Measurements
Online data evaluation Combustion measurement on engine test stand
Analysis of measurement resultsMixed signal measurement
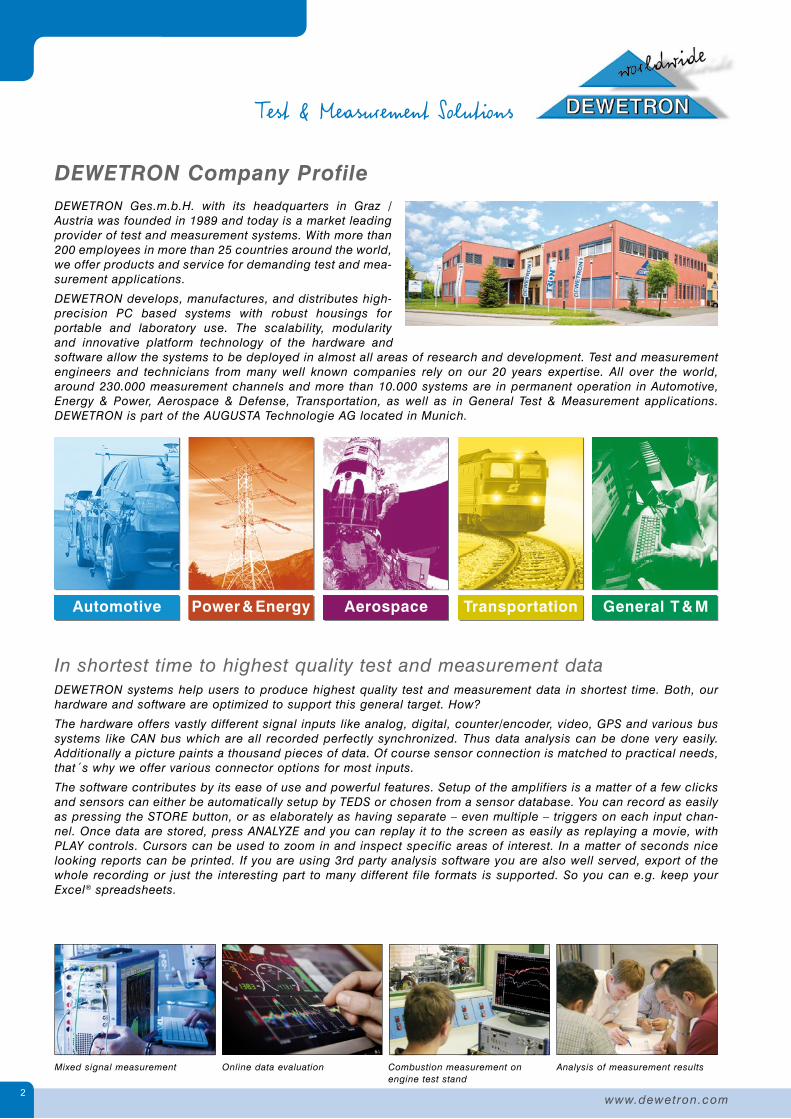
DEWETRON Company ProfileDEWETRON Ges.m.b.H. with its headquarters in Graz / Austria was founded in 1989 and today is a market leading provider of test and measurement systems. With more than 200 employees in more than 25 countries around the world, we offer products and service for demanding test and mea-surement applications.
DEWETRON develops, manufactures, and distributes high-precision PC based systems with robust housings for portable and laboratory use. The scalability, modularity and innovative platform technology of the hardware and software allow the systems to be deployed in almost all areas of research and development. Test and measurement engineers and technicians from many well known companies rely on our 20 years expertise. All over the world, around 230.000 measurement channels and more than 10.000 systems are in permanent operation in Automotive, Energy & Power, Aerospace & Defense, Transportation, as well as in General Test & Measurement applications. DEWETRON is part of the AUGUSTA Technologie AG located in Munich.
Automotive Power & Energy Aerospace Transportation General T & M
In shortest time to highest quality test and measurement dataDEWETRON systems help users to produce highest quality test and measurement data in shortest time. Both, our hardware and software are optimized to support this general target. How?
The hardware offers vastly different signal inputs like analog, digital, counter/encoder, video, GPS and various bus systems like CAN bus which are all recorded perfectly synchronized. Thus data analysis can be done very easily. Additionally a picture paints a thousand pieces of data. Of course sensor connection is matched to practical needs, that´s why we offer various connector options for most inputs.
The software contributes by its ease of use and powerful features. Setup of the amplifiers is a matter of a few clicks and sensors can either be automatically setup by TEDS or chosen from a sensor database. You can record as easily as pressing the STORE button, or as elaborately as having separate – even multiple – triggers on each input chan-nel. Once data are stored, press ANALYZE and you can replay it to the screen as easily as replaying a movie, with PLAY controls. Cursors can be used to zoom in and inspect specific areas of interest. In a matter of seconds nice looking reports can be printed. If you are using 3rd party analysis software you are also well served, export of the whole recording or just the interesting part to many different file formats is supported. So you can e.g. keep your Excel® spreadsheets.
www.dewetron.com2

3
Extensive temperature tests (-40 to +70 °C) Shaketest procedureEMI tests according to CE and other standards
Production of instrumentsDAQ module assembling
System assembling
Precision in all components
QualityOur commitment to Total Quality Management is based on the under-standing of what is important for the success of our customers. It starts with the definition of the technical specification, covers the develop-ment, production, quality control, shipment, and ends with support and service of our systems during operation.
DEWETRON is ISO 9001:2008 and ISO 14001:2009 certified. Environmental and quality management is more than just a compliance issue for us; it is an integral part of our business operations.
We take quality very seriously! That is why we have our own environ-mental test facilities in our building in Austria, where all DEWETRON products are tested repeatedly at several stages. Prototypes are tested for EMC, EMI, RFI, temperature extremes, shock and vibration. This helps us identify and correct problems before we start production. Each revision is tested until the DEWETRON quality standards are met. In addition if traceability is required we use certified labs for even more robust and compliance testing.
Total Quality ManagementWe have established a Quality Management framework that defines processes and assures the proper execution. It incorporates the responsibility of our employees and enables efficient execution across all parts of our global organization.
Quality

www.dewetron.com4
Combustion Analysis (page 7)
Key Features
In-vehicle and test-bed applications
Direct pressure and angle sensor connection
Battery powered
CAN-out, link to test-bed
Electrical power calculations, isolated voltage, current inputs
ADAS System (page 11)Advanced Driver Assistance Systems
Key Features
Easy mounting, setup, alignment and calibration
Online data transfer to master system
High accurate combined GPS and Gyro measurement
Comparable and reproducible tests
Automated report generation for predefined maneuvers
Quick and easy installation
Online calculation of relative distance, speed, acceleration etc.
High accurate combined GPS and Gyro measurement
3D representation of vehicles
Functional Safety Testing (page 15)
Road Load Data (page 19)
Key Features
Quick system installation and setup
Ready-to-print report generator
CAN, FlexRay and XCP support
Key Features
High channel count (16 to 1000 channels)
24 bit aliasing free sampling
Multiple inputs (voltage, acceleration, strain, etc.)
Support for Kistler RoaDyn® measurement wheels
Export to different file formats (supports RPC III )
Battery powered, portable system for in-vehicle use
Real-time analog output
Basic Brake Test (page 25)
Key Features
Integrated 100 Hz GPS receiver
Quick and easy test setup
Automated workflow with DEWESoft sequencer
Automated report generation
Ready-to-print report
Ride and Handling (page 31)
Key Features
Synchronized multichannel data acquisition without phase errors
Proven package due to DTA
Guaranteed compatibility of the whole system
Compact and rugged equipment for in-vehicle use
Easy mounting, setup, alignment, and calibration
Multisensor inputs (voltage, acceleration, strain, etc.)
Aliasing free sampling and flexible filtering capabilities
Real-time Mathematics
Support for Kistler RoaDyn® measurement wheels
Export to different file formats
5
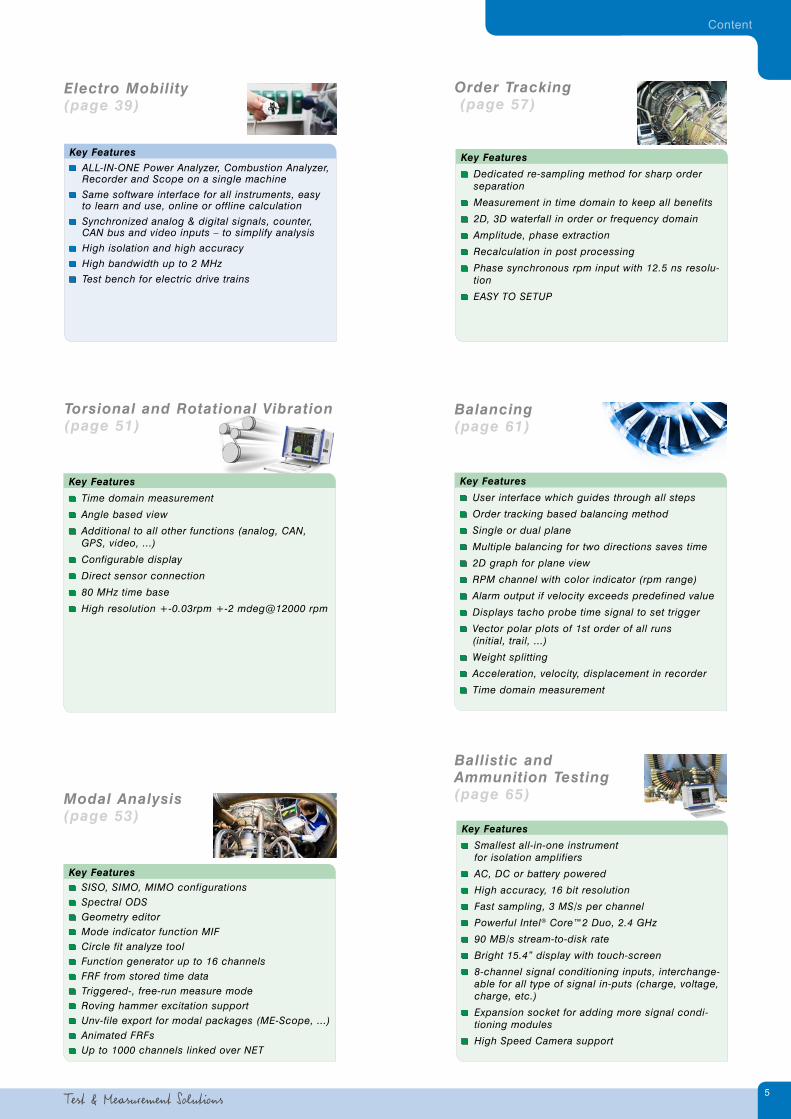
Electro Mobility (page 39)
Key Features
ALL-IN-ONE Power Analyzer, Combustion Analyzer, Recorder and Scope on a single machine
Same software interface for all instruments, easy to learn and use, online or offline calculation
Synchronized analog & digital signals, counter, CAN bus and video inputs – to simplify analysis
High isolation and high accuracy
High bandwidth up to 2 MHz
Test bench for electric drive trains
Torsional and Rotational Vibration (page 51)
Modal Analysis (page 53)
Order Tracking (page 57)
Balancing (page 61)
Ballistic and Ammunition Testing (page 65)
Key Features
Time domain measurement
Angle based view
Additional to all other functions (analog, CAN, GPS, video, ...)
Configurable display
Direct sensor connection
80 MHz time base
High resolution +-0.03rpm +-2 mdeg@12000 rpm
Key Features SISO, SIMO, MIMO configurations Spectral ODS Geometry editor Mode indicator function MIF Circle fit analyze tool Function generator up to 16 channels FRF from stored time data Triggered-, free-run measure mode Roving hammer excitation support Unv-file export for modal packages (ME-Scope, ...) Animated FRFs Up to 1000 channels linked over NET
Key Features
Dedicated re-sampling method for sharp order separation
Measurement in time domain to keep all benefits
2D, 3D waterfall in order or frequency domain
Amplitude, phase extraction
Recalculation in post processing
Phase synchronous rpm input with 12.5 ns resolu-tion
EASY TO SETUP
Key Features
User interface which guides through all steps
Order tracking based balancing method
Single or dual plane
Multiple balancing for two directions saves time
2D graph for plane view
RPM channel with color indicator (rpm range)
Alarm output if velocity exceeds predefined value
Displays tacho probe time signal to set trigger
Vector polar plots of 1st order of all runs (initial, trail, ...)
Weight splitting
Acceleration, velocity, displacement in recorder
Time domain measurement
Key Features
Smallest all-in-one instrument for isolation amplifiers
AC, DC or battery powered
High accuracy, 16 bit resolution
Fast sampling, 3 MS/s per channel
Powerful Intel® Core™2 Duo, 2.4 GHz
90 MB/s stream-to-disk rate
Bright 15.4” display with touch-screen
8-channel signal conditioning inputs, interchange-able for all type of signal in-puts (charge, voltage, charge, etc.)
Expansion socket for adding more signal condi-tioning modules
High Speed Camera support
Content

7www.dewetron.com/ca
E-M
OB
BT
RA
HR
LDA
DA
SFS
CA
Combustion Analysis
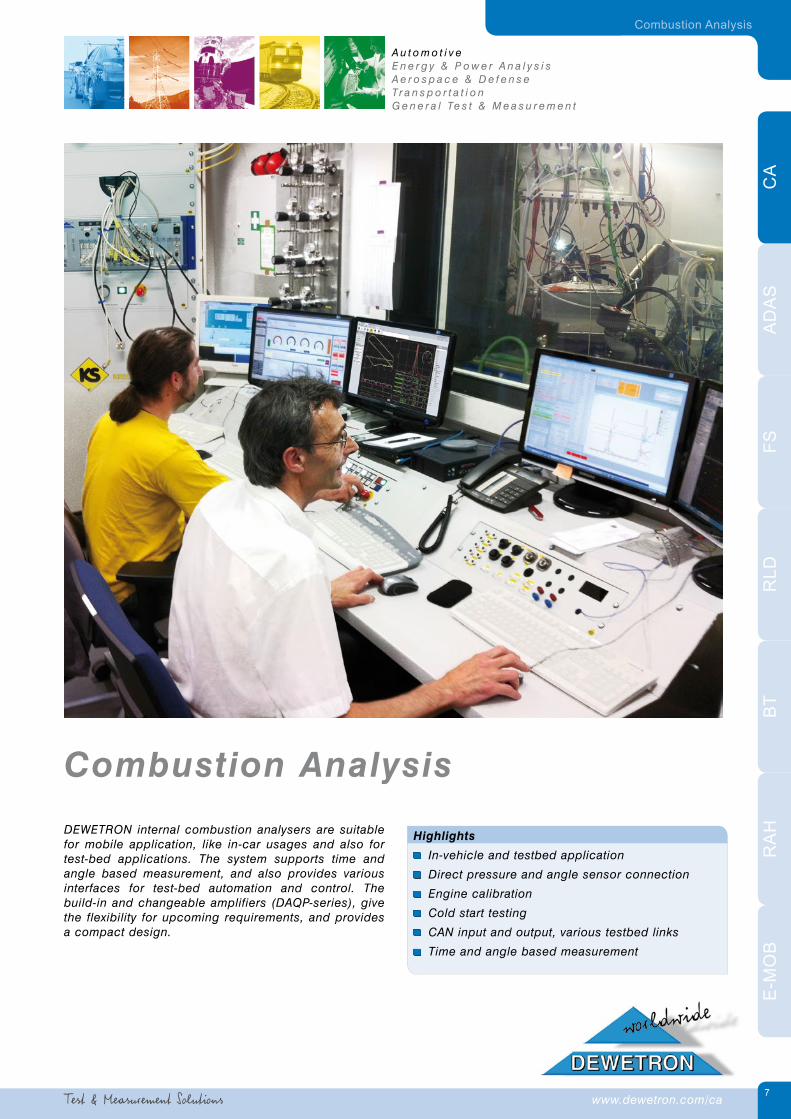
Combustion Analysis
Highlights
In-vehicle and testbed application
Direct pressure and angle sensor connection
Engine calibration
Cold start testing
CAN input and output, various testbed links
Time and angle based measurement
DEWETRON internal combustion analysers are suitable for mobile application, like in-car usages and also for test-bed applications. The system supports time and angle based measurement, and also provides various interfaces for test-bed automation and control. The build-in and changeable amplifiers (DAQP-series), give the flexibility for upcoming requirements, and provides a compact design.
A u t o m o t i v eE n e r g y & P o w e r A n a l y s i sA e r o s p a c e & D e f e n s eTr a n s p o r t a t i o nG e n e r a l Te s t & M e a s u r e m e n t

www.dewetron.com8
Synchronous Input SignalsIsolated charge amplifiers, bridge amplifiers with constant current supply feature, are used for high-pressure sensors and for the abso-lute pressure sensors of inlet and exhaust. Due to the changeable amplifier concept of the instrument, almost any signal like torque, current, acceleration, temperature, etc. can be measured. Voltage inputs cover, start of injection, end of injection and ignition, and any other additional signal captured in time or angle domain. The isolated voltage and current inputs can be used to calculate electrical power.
Crankangle CPU Included Crank Angle CPU, is able to handle all kinds of crank marker disc signals which provides CDM- and TRIG- signal. In case more angle resolution is required, Crank Angle CPU will do the interpolation up to 0,1deg. Pickup sensors, for the native CDM signals, like 60-2, can be directly connected. The isolated input can handle voltages from 0,5V up to 60V. Crank Angle CPU will do gap filling and interpolation.
Indicating pressure (charge)
Absolute pressure (bridge, voltage)
Injection, timing signals (voltage, current)
TDC Sensors (voltage)
CAN-in, CAN-out
Crank angle signals (CDM, TRG, tooth)
Vibration
Strain
Temperature
Electrical power
XCP via LAN
FlexRay, LIN
SO
I
SO
I
SO
I
EO
I
EO
I
EO
I

9
E-M
OB
BT
RA
HR
LDA
DA
SFS
CA
Combustion Analysis
Testbed InterfaceTestbed interface, via RS232 or TCP/IP is provided to link the analyzer to a testbed for automated measure-ments. An open AK-protocol, or native interfaces for AVL PUMA Open, DT2, .. is supported.
In addition, calculated results can be also transferred via CAN-out. Results can be recorded from mapping tools to get immediate feedback.
SoftwareSoftware provides easy to use user interface with pre-configured analyse screens. All major parameters are calculated online. All parameters can be corrected and recalculated in the Analyse mode.
File Export
Data can be exported into various file formats (.txt, .ifl, .xls …).
MEP values
Heat release, I5, I50, SOC, EOC
Min. max pressure and pos.
Thermodynamic zero correction
Various average possibilities of pressure (running, overall, .. )
Knocking
CA noise CA noise calculation is provided for time and angle based measurement. The open architecture allows the user to integrate an engine specific transfer filter.
Statistical values
User definable calculations In case additional results or special calculations, like custom volume, are required, the open architecture provides the possibility to adapt the configuration.
Suitable for Cold StartDEWETRON CA instrument can record time and angle based data simultaneously.
At cold start tests combustion analyser runs and records sig-nals already before piston make the first move. So the whole start process will be recorded, for further investigation.

www.dewetron.com10
DEWE-2600-CA2-PROF DEWE-800-CA2-PROFAnalog input channels 8, 16 (expandable to 32, 64) 8, 16 (expandable to 32, 64)
Optional low speed temperature and voltage inputs (5 Hz) voltage 64 (in groups of 8) 64 (in groups of 8)
Amplitude resolution 16 bit 16 bitSampling rate 1 MHz 1 MHzInput range ±10 V ±10 V
Charge inputs variable 1 to 16 depending on amplifier configuration (DAQP-CHARGE-B)
variable 1 to 16 depending on amplifier configuration (DAQP-CHARGE-B)
Charge input range 10 to 10000 pC 10 to 10000 pCDrift compensation AC coupling AC couplingCAN input input and output up to 1 Mb/s Input and output up to 1 Mb/sFlexRay optional optionalXCP interface optional optionalStorage memory 1 TB 1 TBDigital input channels 8 if digital out is used, 16 TTL -Digital outputs 8 TTL 8 TTL
Crank angle inputs
TTL based CDM and TRG (BNC)TTL based Encoder
(A,B,Z on Multicore connector)CA input for native pickup sensors like 60-2 (BNC)
TTL based CDM and TRG (BNC)TTL based Encoder
(A,B,Z on Multicore connector) CA input for native pickup sensors like 60-2 (BNC)
Temperature range 0 to +50 °C 0 to +50 °C
Power supply 100 to 240 VAC input (50/60 Hz) 120 W max.9 to 36 VDC, battery powered up to 2 h 100 to 240 VAC input (50/60 Hz) 120 W max.
Dimensions
Dimensions (W x D x H) 417 x 246 x 303 mm (16.4 x 9.6 x 11.9 in.)
437 x 443 x 181 mm (17.2 x 17.4 x 7.1 in.)
Weight without batteries Typ. 14 kg (31 lb.) Typ. 12 kg (26.4 lb.)1) Please find current specifications in the latest price list
Additional Measurements and AnalysesThe instrument is not limited to CA measurement only. Caused by the hard and software architecture it can be used for various other measurements too. Recorder, FFT analyser, scope, power measurement, long time measurement are only a few examples.
Recorder
FFT Analyser
Order tracking
Rotational and torsional vibration
Transient recorder
Electrical power (after frequency converter)
Configuration Examples
In-vehicle testing
Testbed
Battery powered
Portable
Large engines
High performance apps
19’’ mount
DEWETRON GmbH • Parkring 4 • A-8074 Graz-Grambach • Tel (0043) 316 3070 0 • Fax (0043) 316 3070 90 • [email protected]

11www.dewetron.com
Advanced Driver Assistance Systems
E-M
OB
BT
RA
HR
LDA
DA
SFS
CA
ADASAdvanced Driver Assistance Systems
Key Features
Easy mounting, setup, alignment and calibration
Online data transfer to master system
High accurate combined GPS and Gyro measurement
Comparable and reproducible tests
Automated report generation for predefined maneuvers
Quick and easy installation
Online calculation of relative distance, speed, acceleration etc.
High accurate combined GPS and Gyro measurement
3D representation of vehicles
DEWETRON provides the ideal solution for developing and benchmarking Advanced Driver Assistance Systems. Whether you are conducting ACC or FCW tests, where multiple vehicles are involved, or tests for LDW or LKA systems, where the distance to a given path is of main interest.
All data between one or more vehicles stays fully syn-chronized, can be used in online calculations and visualized in a live, 3D display. Based on high-precise measurement of position and movement with GPS based IMUs (Inertial Measurement Units), this system features position accuracy down to the centimeter range.
A u t o m o t i v eE n e r g y & P o w e r A n a l y s i sA e r o s p a c e & D e f e n s eTr a n s p o r t a t i o nG e n e r a l Te s t & M e a s u r e m e n t

www.dewetron.com12
Master Unit
DEWE-ORION card
CAN
WLAN
GPS
Video
Counterinput
Digitalinput
ADMAinterface
DEWE-ORION card
Analoginput
MEASUREMENT DATA SYNC-CLOCK Technology: Synchronisation via satellite clock
The master unit collects all synchronized data from the master vehicle and the slave unit via WLAN.
Data from all vehicles is recorded fully synchronized
Online checking of the measurement data quality
Master manages the measurement and the configuration of the slave – so the driver can concentrate on his task.
Online data transfer of selected channels from slave to master.
Measurement data is redundantly stored on each measurement unit and can be transferred after the measurement
The ADAS system uses the GeneSys inertial measurement system ADMA for six degree of freedom motion analysis in combination with high performance GPS position measurement. This combination avoids the drawbacks of each system – on one hand the drift of the gyro platform and on the other hand outages and jumps in GPS position. Kalman filters are used for optimizing the measured result.
Additional Sensors:
Multiple video cameras
Measurement steering wheel
Optical velocity sensors
Height level sensors
Wheel pulse sensor
Wheel vector sensor
Wheel force sensor
Tire temperature
Brake pressure
Acceleration
Temperature
Strain gages
Steering robot
Potentiometric sensors
CONFIGURATION
CameraData-Acquisition System ADMAGPS-Antenna WLAN-Antenna

13
Slave Units
DEWE-ORION card
CAN
WLAN
GPS
Video
Counterinput
Digitalinput
ADMAinterface
DEWE-ORION card
Analoginput
Advanced Driver Assistance Systems
E-M
OB
BT
RA
HR
LDA
DA
SFS
CA
MEASUREMENT DATA
MEASUREMENT DATA
MEASUREMENT DATA
The measurement systems are synchronized and send the data to the master mea-surement unit.
Differential GPS:
GPS base station and antennaDifferential GPS is required to gain the required accuracy for the vehicle or obstacle coordi-nates.
RF-modem:Interface DGPS data
Video Information
Synchronized video information
ADAS Channels
Relative vehicle distance, speed, heading
ADAS Display
The ADAS display visualises the distance between the cars, the relative position and the heading
CAN BusData
Synchronized data from CAN-bus
Analog Data
Synchronized data
SYNC-CLOCK Technology: Synchronisation via satellite clock
GPS Map
GPS data on map overlay

www.dewetron.com14
80 MHz clock
Selectable GPS time synchronization
GPS-Clock
Clock-Divider (Phase synchronous)
Definable Clock-Divider
A/D-converter CAN-bus Video Counter Dig. I/O Serial-busRS-232RS-485
ADAS Configuration
ADAS requires very high accuracy of the measured parameters, which is achieved using the latest technology of data acquisition, inertial measurement, GPS technology and test methodology.
SYNC-CLOCK™ technology: For the exact position of the vehicles or obstacles, synchronisation of the different systems is required. To achieve the required accuracy we implemented a high precision system clock. All data chan-nels, analog and digital signals, CAN information or video are synchronized.
DGPS - Differential GPSThis technology improves the measurement accuracy where a second stationary GPS receiver is required. Due to the known position of this base receiver errors in the GPS signal transmission can be calculated. The data of the DGPS corrections are transmitted vie WLAN to mobile GPS receiver for an online correction of the position data.
GPS-AntennaWLANAntenna
GPS base
Elimination of GPS outages
Suppression of jumps in GPS position
Residual accuracy is better than Inertial Measurement Unit or GPS accuracy on its own
Position data with high dynamic and bandwidth
Highly accurate motion states of a vehicle with low setup time
All motion states in body-fixed, levelled and NED coordinates
All motion states in 3D (t, a, v, p, d /dt, ) via CAN or RS-232 or Ethernet
Hardware Configuration
DEWE2-M4-ADAS DEWE-510-ADAS-16
Analog input channels 2 free slots for TRION™ series modules 16 DAQ series modules
Digital channels 8 DIO and 2 CTR or 8 DIChannel expansion YesCAN interfaces 4Video DEWE-CAM-GIGE-120 or USBDisplay External MOB-DISP-x
Power supply 11 to 32 VDC rated (max. 10 to 36 VDC) isolated; external AC power supply adapter included
Battery powered, 18 - 24 VDC (max)external AC power supply
Dimensions (W x D x H) 317 x 252 x 108 mm12.5 x 9.9 x 4.3 in.
439 x 308 x 181 mm17.28 x 12.13 x 7.13 in.
Weight Typ. 3.9 kg (8.6 lb) Typ. 8 kg (17.6 lb.)
Additionally required sensor GeneSys ADMA INS/Gyro system
TRION™ and MDAQ series modules are available for almost all kinds of sensors
15
E-M
OB
BT
RA
HR
LDA
DA
SFS
CA
www.dewetron.com
CAN
MOB-DISP
DEWE-CAM01
16 ANALOG INPUTS
8 DIGITAL INPUTS
2 COUNTER INPUTS
ADMA
SYNC
CAN
ECU
XCP
GPS-ANTENNA
CAN-BUS
Functional Safety Testing
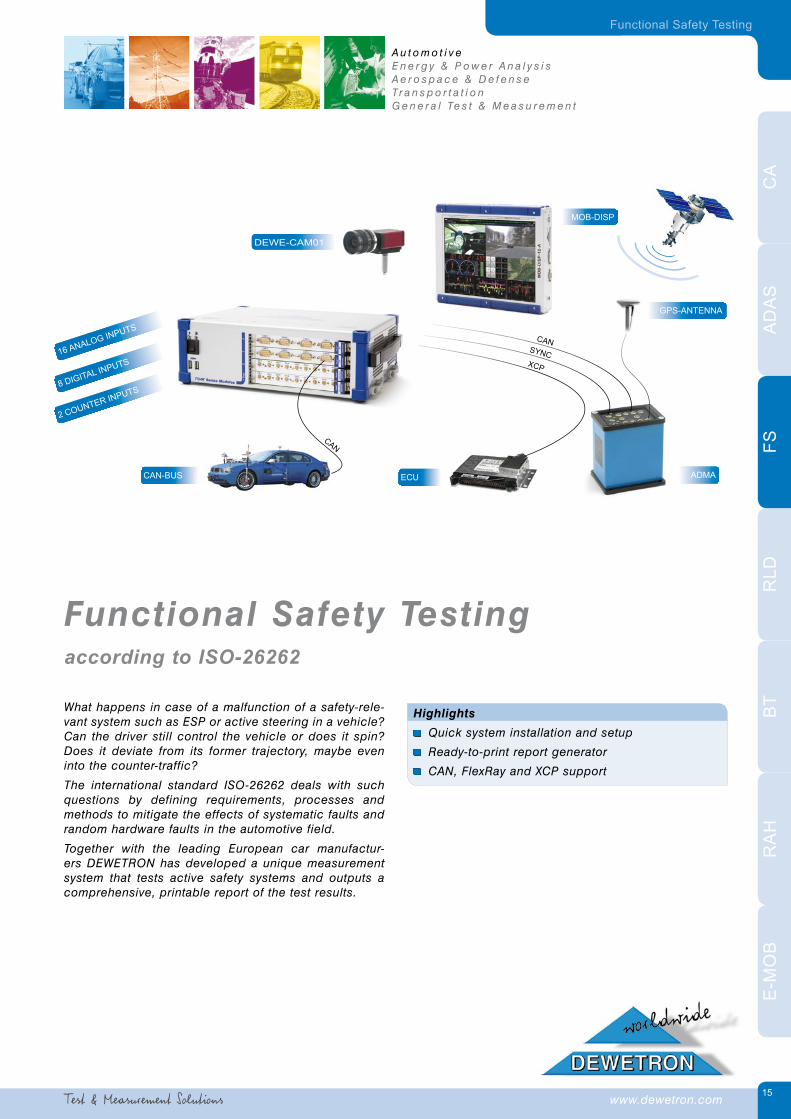
Functional Safety Testing according to ISO-26262
Highlights
Quick system installation and setup
Ready-to-print report generator
CAN, FlexRay and XCP support
What happens in case of a malfunction of a safety-rele-vant system such as ESP or active steering in a vehicle? Can the driver still control the vehicle or does it spin? Does it deviate from its former trajectory, maybe even into the counter-traffic?
The international standard ISO-26262 deals with such questions by defining requirements, processes and methods to mitigate the effects of systematic faults and random hardware faults in the automotive field.
Together with the leading European car manufactur-ers DEWETRON has developed a unique measurement system that tests active safety systems and outputs a comprehensive, printable report of the test results.
A u t o m o t i v eE n e r g y & P o w e r A n a l y s i sA e r o s p a c e & D e f e n s eTr a n s p o r t a t i o nG e n e r a l Te s t & M e a s u r e m e n t
www.dewetron.com16
CONFIGURATION PHASE
ANALYZE PHASE
DYNAMIC PHASE
CONSTANT PHASE
ARM MEASUREMENT
STOP STORING
TRIGGER
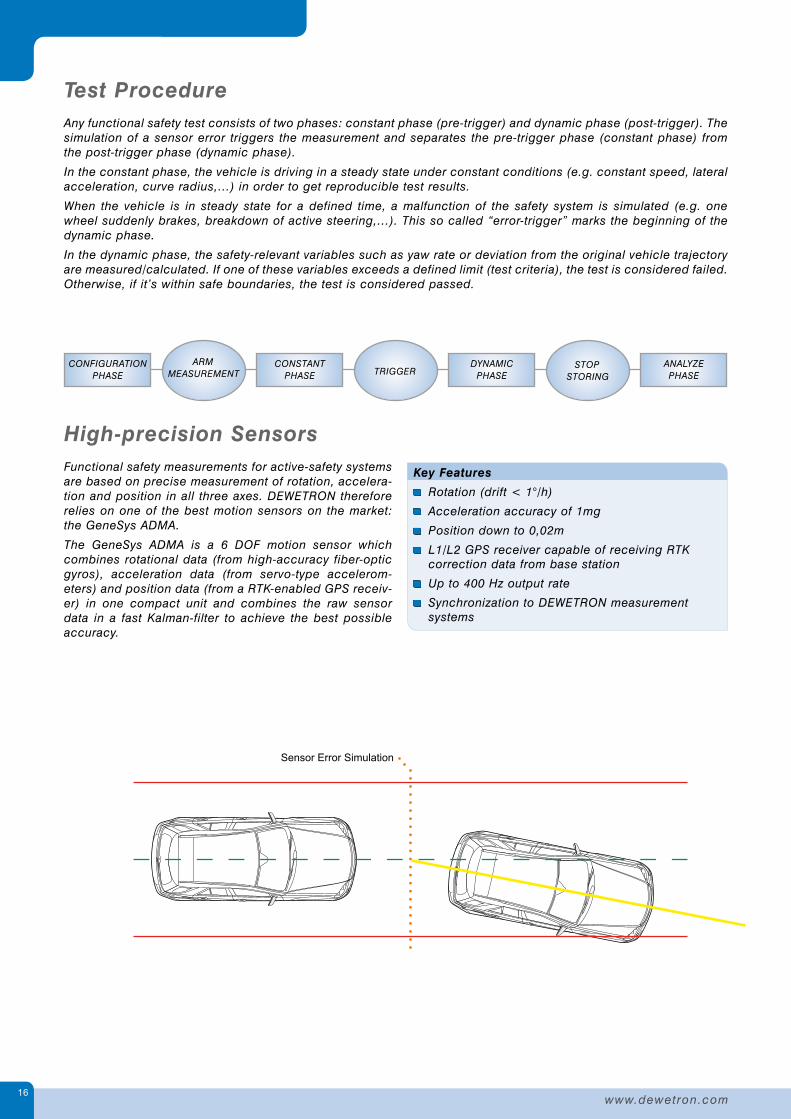
High-precision SensorsFunctional safety measurements for active-safety systems are based on precise measurement of rotation, accelera-tion and position in all three axes. DEWETRON therefore relies on one of the best motion sensors on the market: the GeneSys ADMA.
The GeneSys ADMA is a 6 DOF motion sensor which combines rotational data (from high-accuracy fiber-optic gyros), acceleration data (from servo-type accelerom-eters) and position data (from a RTK-enabled GPS receiv-er) in one compact unit and combines the raw sensor data in a fast Kalman-filter to achieve the best possible accuracy.
Test ProcedureAny functional safety test consists of two phases: constant phase (pre-trigger) and dynamic phase (post-trigger). The simulation of a sensor error triggers the measurement and separates the pre-trigger phase (constant phase) from the post-trigger phase (dynamic phase).
In the constant phase, the vehicle is driving in a steady state under constant conditions (e.g. constant speed, lateral acceleration, curve radius,…) in order to get reproducible test results.
When the vehicle is in steady state for a defined time, a malfunction of the safety system is simulated (e.g. one wheel suddenly brakes, breakdown of active steering,…). This so called “error-trigger” marks the beginning of the dynamic phase.
In the dynamic phase, the safety-relevant variables such as yaw rate or deviation from the original vehicle trajectory are measured/calculated. If one of these variables exceeds a defined limit (test criteria), the test is considered failed. Otherwise, if it’s within safe boundaries, the test is considered passed.
Key Features
Rotation (drift < 1°/h)
Acceleration accuracy of 1mg
Position down to 0,02m
L1/L2 GPS receiver capable of receiving RTK correction data from base station
Up to 400 Hz output rate
Synchronization to DEWETRON measurement systems
Sensor Error Simulation
17
E-M
OB
BT
RA
HR
LDA
DA
SFS
CA
Functional Safety Testing
Ready-to-Print ReportsEven though the test result (test criteria passed/failed) is available right after the measurement, a printed report is sometimes required to give an overview over the whole test series.
DEWETRON has created an MS-Excel based report that automatically creates a ready-to-print report of all performed test.
This report contains:
General test information such as vehicle data, environmental data, test engineer information etc.
A manoeuvre overview over all performed tests to immediately see the most important values of each test in one tabular view
Detailed report with graphs for each manoeuvre
XCP and FlexRay SupportThe DEWE2 systems also support the XCP protocol which allows you to record the ECU internal status during your tests and measurements. Also the upcoming FlexRay bus, the successor of the widespread but meanwhile over-loaded CAN bus, is supported.
Tough and ReliableThe industry-approved PXI standard and the new internal construction of the DEWE2 series make them our most rug-gedized measurement system so far. Tested for shock up to 30g and vibration up to 20 m/s² as well as an operating temperature range of -20°C to +50°C (-4°F to +122°F) they are well prepared for testing under harsh conditions.
Internal Buffer Battery to Bridge Supply Gaps or Independent Power SupplyIn most cases the measurement system and the sensors are supplied by the vehicle battery. This can be problematic however, because the power management of modern vehicles might suddenly cut the supply if a high-priority system (like active-safety systems) requires more battery power. Or the ECU unit might need a reset – turning the engine off and on again – after an error trigger or system malfunction. Or you need a gas refill but don’t want to turn off the engine because the measurement should not be stopped…
These short power outages can be cumbersome if you need to get your test-cycles done in time. To solve that, the DEWE2 systems can be upgraded with an internal buffer battery to bridge supply outages of up to 10 minutes.
The scarcity of available energy in modern vehicles might make it necessary to be independent from the vehicle power network. DEWETRON offers a fully battery powered solution with hot-swappable batteries for such applica-tions.

www.dewetron.com18
Configuration Examples
DEWE2-M4-FS DEWE2-A4-FS
Analog input channels 2 free slots for TRION™ series modules
Digital channels 8 DIO and 2 CTR or 8 DIChannel expansion YesCAN interfaces 4
Video DEWE-CAM-GIGE-120 or USB
Display External MOB-DISP-x Internal 13” display
Power supply 11 to 32 VDC rated (max. 10 to 36 VDC) isolated; external AC power supply adapter included
Dimensions (W x D x H) 318 x 253 x 108 mm (12.5 x 10 x 4.3 in.)
318 x 253 x 128 mm (12.5 x 10 x 5 in.)
Weight Typ. 3.9 kg (8.6 lb) Typ. 5.9 kg (13 lb.)
Additionally required sensor GeneSys ADMA INS/Gyro system
TRION™ and MDAQ series modules are available for almost all kinds of sensors

19www.dewetron.com
Road Load Data
E-M
OB
BT
RA
HR
LDA
DA
SFS
CA
Road Load DataThe DEWETRON RLD system is used to record road load data during real test drives or at test rigs – either for a whole vehicle or certain components. The mea-sured data can be replayed on a testbed to simulate all forces and vibrations in the laboratory. As an option, DEWETRON RLD systems can be equipped with a real time analog output for testbed integration.
DEWETRON devices offer a rugged and portable design for in-vehicle use and fulfill the requirement for high channel count. The devices cover a wide range of input types like voltage, strain, temperature, counters, GPS, Video, CAN and OBD II.
For testbed simulation the aquired data is exported to RPC III file format.
Key Features
High channel count (16 to 1000 channels)
24 bit aliasing free sampling
Multiple inputs (voltage, acceleration, strain, etc.)
Support for Kistler RoaDyn® measurement wheels
Export to different file formats (supports RPC III )
Battery powered, portable system for in-vehicle use
Real-time analog output
A u t o m o t i v eE n e r g y & P o w e r A n a l y s i sA e r o s p a c e & D e f e n s eTr a n s p o r t a t i o nG e n e r a l Te s t & M e a s u r e m e n t

www.dewetron.com20
DEWE-ORION card
Industrial PC
PC
DEWESoft
Road Load Data
DEWE-VGPS
Position interface
DEWE-CAM
Video
CAN
Analoginput
Counterinput
Digitalinput
Digital output
ext.clock
int.clock
Interface
USB, Ethernet, WLAN
External Clock
e.g. Kistler RoaDyn®
Dual UseReal time analog output for test rig
application
SensorsForcesAccelerationsStrain Gauges and RosettesTemperatures
Power SupplyACDCBattery powered
DAQ or MDAQ module
Signalconditioning
Sensorsupply
Overview

GPS Information
Position data
Video
Synchronized video information
Analog Channels
Strain, temperature, acceleration, force, torque, etc.
CAN-Bus Data/OBD II
Synchronous data from CAN-bus
CAN DBC export and import
J1939 decoding
Wheel Force Measurement
Telemetric recipient for all wheel forces
21
Road Load Data
E-M
OB
BT
RA
HR
LDA
DA
SFS
CA

www.dewetron.com22
Road Load Data ApplicationRoad Load Data measurement is used in material research, process and parts approvals and vehicle testing. The data collection is done on the test track on the road or on a test rig. This data is used to calibrate simulation models and to develope and optimize control loops.
The measured data can be replayed on a testbed to simulate all forces and vibrations in laboratory boundar-ies. Systems and components are tested under specific customer and environmental conditions (e.g. higher temperature, corrosive atmosphere, etc.) using road load data inputs as well as duty cycle inputs correlated to real world conditions on a test rig. To optimize mechanical components it is necessary to know the loads that the product undergo during its lifetime. Therefore precise and synchronous measurement of a high number of sensors is required.
The basic requirement for Road Load Data measurement systems are:
Simultaneous and aliasing free recording
High channel count
Connectivity for a broad range of sensors - including a flexible power supply for sensors
Sensor database, TEDS functionality
Shunt calibration
Amplifier and sensor blance
Offline instrument setup
Online overload detection and failure detection for e.g. damaged sensors
Various trigger options
Powerful online mathematics
Fast and efficient data analysis
Traceability of the measurement results
Compact and rugged hardware design
CAN Input Synchronous recording of data from the vehicle CAN bus or from sensors with CAN interface.
CAN .dbc import
J1939 decoding
The CAN setup dialog allows to set up the required CAN channels as measurement channels. These channel are treated like physical measurement channels and can be used for visualization, mathematics or to trig-ger an event.
Dual Use - Real Time Analog Output for Test Rig Application Dual-Use allows to use the DEWETRON RLD System also on the testbed.
The same measuring situation as on the road is measured on the test rig. Additionally, the system provides realtime conditioned and filtered (typ.±10 V) analog output sig-nals of each input signal.

23
Road Load Data
E-M
OB
BT
RA
HR
LDA
DA
SFS
CA
DEWESoft-NET DEWESoft-NET allows the communication between different DEWETRON instruments. Each unit can be configured as stand alone, as master or as slave. It’s also possible to use any PC to control a measurement unit remotely.
For road load data measurement DEWESoft-NET is used to com-bine several instruments and to increase the total amount of mea-surement channels
Offline SetupTo standardize and to simplify the setup procedure of a DEWETRON measurement system, it is possible to do this task using your office PC. Together with the sensor database, the setup can be performed independent from the measurement hardware. This feature allows you to use a central setup database. A standard office PC using DEWESoft 7 can export XML based file format with all this setup information. Simply loading this file on a DEWETRON measurement system adjusts all settings for this setup which is required for the measurement. The set-up time of the whole system can be significantly reduced and this also avoids user errors.
Shunt Calibration Shunt calibration is a very useful feature to quick check the measurement chain of bridge amplifiers.
The automated procedure starts per mouse click and in par-allel all amplifiers start the calibration procedure: Red and green indicators showthe result of the calibration.
Shunt check of all sensors
Red or green indicator to show the calibration result
Amplifier and Sensor BalanceThe amplifier balancing is integrated within the amplifier module – automatically the input is shorted and the offset of the amplifier is checked. This feature is a quick check of the amplifier and allows to measure absolute output from from a strain gage.
Amplifier balancing - for all amplifiers at a time:
Automated amplifier balancing
Check of the amplifier offset
Quick overview of adjust value
Absolute strain gage measurement
The sensor balancing allows a quick zero adjustment of all sensors. In static conditions the offset of the amplifiers are adjusted, to compensate the offset of the strain gage.
Sensor balancing - for all sensors at a time:
Automated sensor balancing
Quick overview of adjust value
Easy to detect fatigue of material
www.dewetron.com24
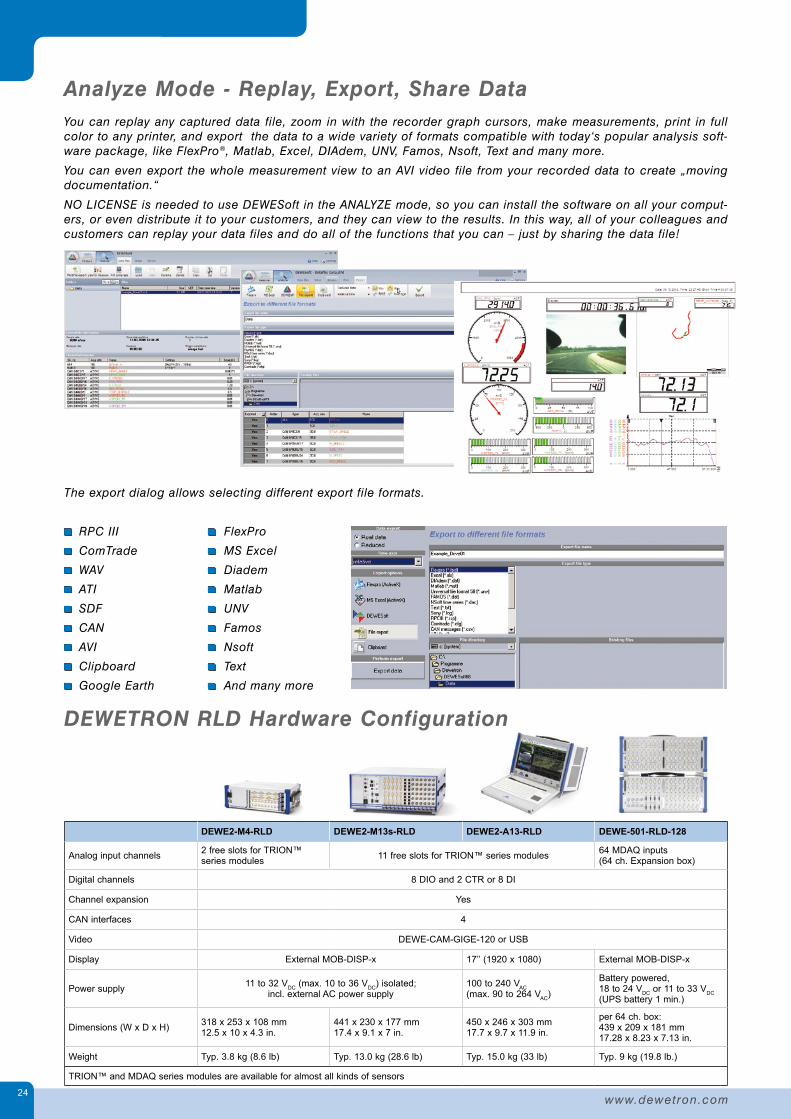
Analyze Mode - Replay, Export, Share DataYou can replay any captured data file, zoom in with the recorder graph cursors, make measurements, print in full color to any printer, and export the data to a wide variety of formats compatible with today‘s popular analysis soft-ware package, like FlexPro®, Matlab, Excel, DIAdem, UNV, Famos, Nsoft, Text and many more.
You can even export the whole measurement view to an AVI video file from your recorded data to create „moving documentation.“
NO LICENSE is needed to use DEWESoft in the ANALYZE mode, so you can install the software on all your comput-ers, or even distribute it to your customers, and they can view to the results. In this way, all of your colleagues and customers can replay your data files and do all of the functions that you can – just by sharing the data file!
The export dialog allows selecting different export file formats.
RPC III FlexPro
ComTrade MS Excel
WAV Diadem
ATI Matlab
SDF UNV
CAN Famos
AVI Nsoft
Clipboard Text
Google Earth And many more
DEWETRON RLD Hardware Configuration
DEWE2-M4-RLD DEWE2-M13s-RLD DEWE2-A13-RLD DEWE-501-RLD-128
Analog input channels 2 free slots for TRION™ series modules 11 free slots for TRION™ series modules 64 MDAQ inputs
(64 ch. Expansion box)
Digital channels 8 DIO and 2 CTR or 8 DI
Channel expansion Yes
CAN interfaces 4
Video DEWE-CAM-GIGE-120 or USB
Display External MOB-DISP-x 17’’ (1920 x 1080) External MOB-DISP-x
Power supply 11 to 32 VDC (max. 10 to 36 VDC) isolated; incl. external AC power supply
100 to 240 VAC (max. 90 to 264 VAC)
Battery powered, 18 to 24 VDC or 11 to 33 VDC (UPS battery 1 min.)
Dimensions (W x D x H) 318 x 253 x 108 mm 12.5 x 10 x 4.3 in.
441 x 230 x 177 mm 17.4 x 9.1 x 7 in.
450 x 246 x 303 mm 17.7 x 9.7 x 11.9 in.
per 64 ch. box: 439 x 209 x 181 mm 17.28 x 8.23 x 7.13 in.
Weight Typ. 3.8 kg (8.6 lb) Typ. 13.0 kg (28.6 lb) Typ. 15.0 kg (33 lb) Typ. 9 kg (19.8 lb.)
TRION™ and MDAQ series modules are available for almost all kinds of sensors
25
Brake Test
E-M
OB
BT
RA
HR
LDA
DA
SFS
CA
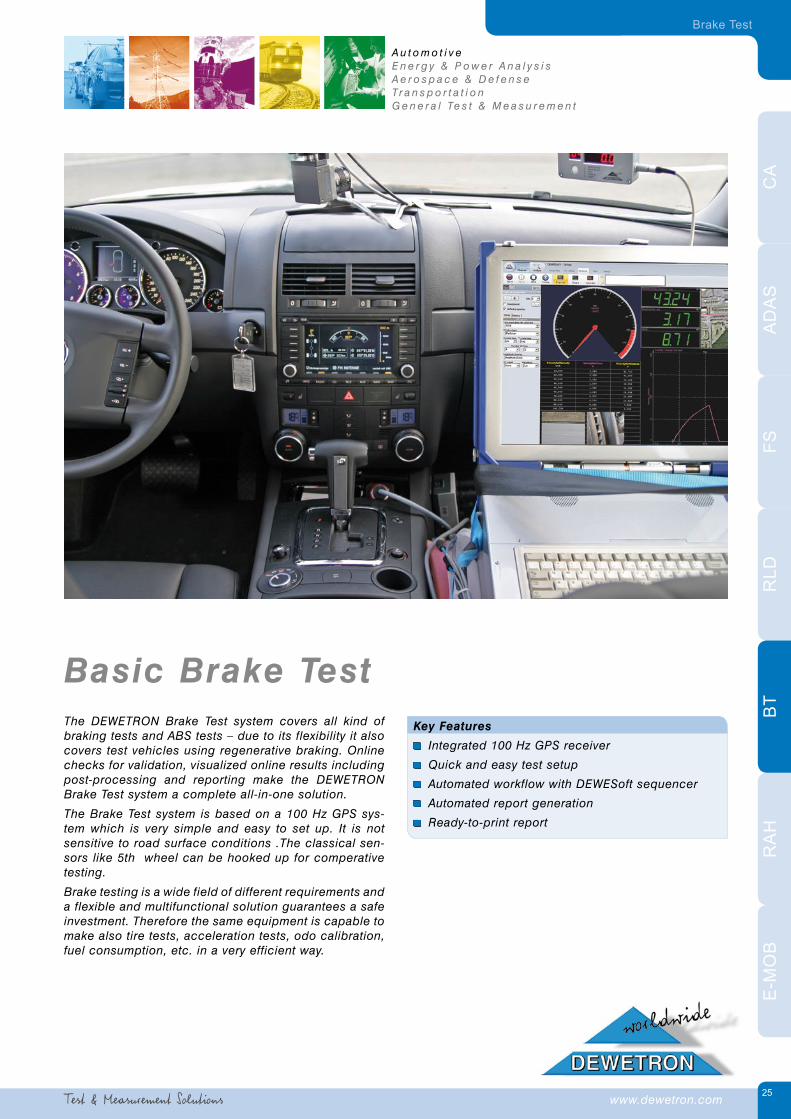
Basic Brake TestKey Features
Integrated 100 Hz GPS receiver
Quick and easy test setup
Automated workflow with DEWESoft sequencer
Automated report generation
Ready-to-print report
The DEWETRON Brake Test system covers all kind of braking tests and ABS tests – due to its flexibility it also covers test vehicles using regenerative braking. Online checks for validation, visualized online results including post-processing and reporting make the DEWETRON Brake Test system a complete all-in-one solution.
The Brake Test system is based on a 100 Hz GPS sys-tem which is very simple and easy to set up. It is not sensitive to road surface conditions .The classical sen-sors like 5th wheel can be hooked up for comperative testing.
Brake testing is a wide field of different requirements and a flexible and multifunctional solution guarantees a safe investment. Therefore the same equipment is capable to make also tire tests, acceleration tests, odo calibration, fuel consumption, etc. in a very efficient way.
A u t o m o t i v eE n e r g y & P o w e r A n a l y s i sA e r o s p a c e & D e f e n s eTr a n s p o r t a t i o nG e n e r a l Te s t & M e a s u r e m e n t
www.dewetron.com
www.dewetron.com26
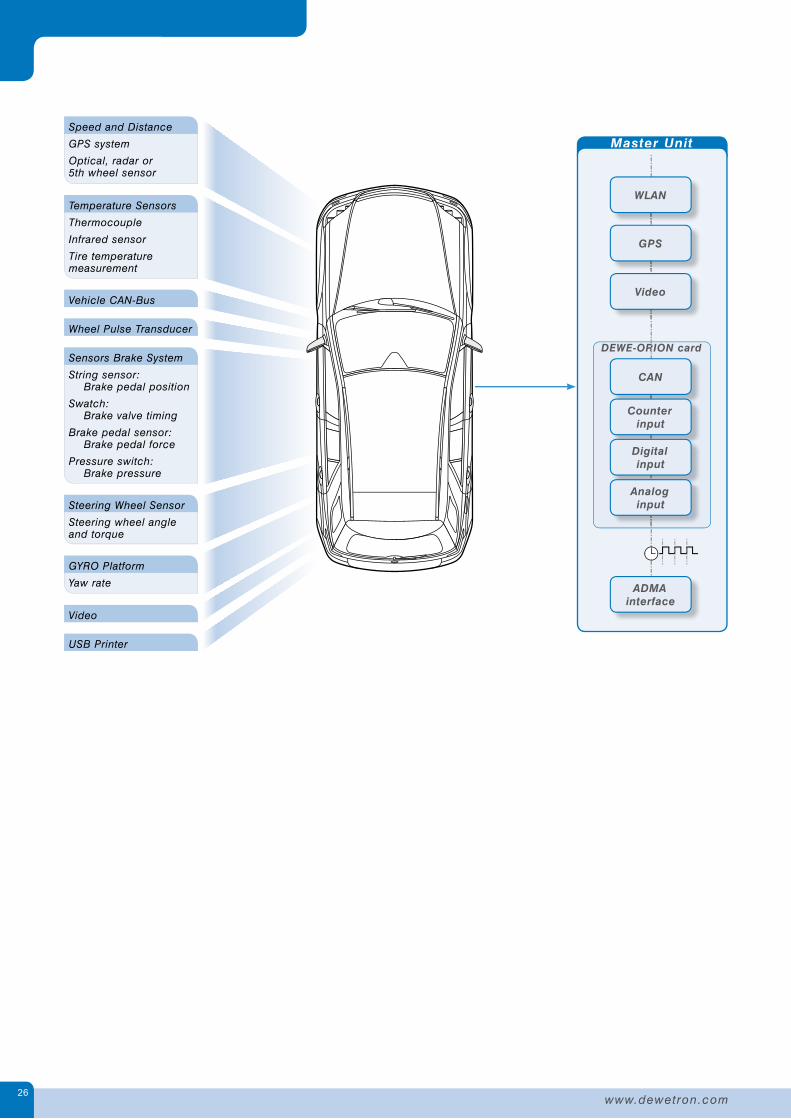
Master Unit
DEWE-ORION card
CAN
WLAN
GPS
Video
Counterinput
Digitalinput
ADMAinterface
Analoginput
Speed and Distance
GPS system
Optical, radar or 5th wheel sensor
Temperature Sensors
Thermocouple
Infrared sensor
Tire temperature measurement
Steering Wheel Sensor
Steering wheel angle and torque
Vehicle CAN-Bus
Wheel Pulse Transducer
Sensors Brake System
String sensor: Brake pedal position
Swatch: Brake valve timing
Brake pedal sensor: Brake pedal force
Pressure switch: Brake pressure
Video
GYRO Platform
Yaw rate
USB Printer
27
Brake Test
E-M
OB
BT
RA
HR
LDA
DA
SFS
CA
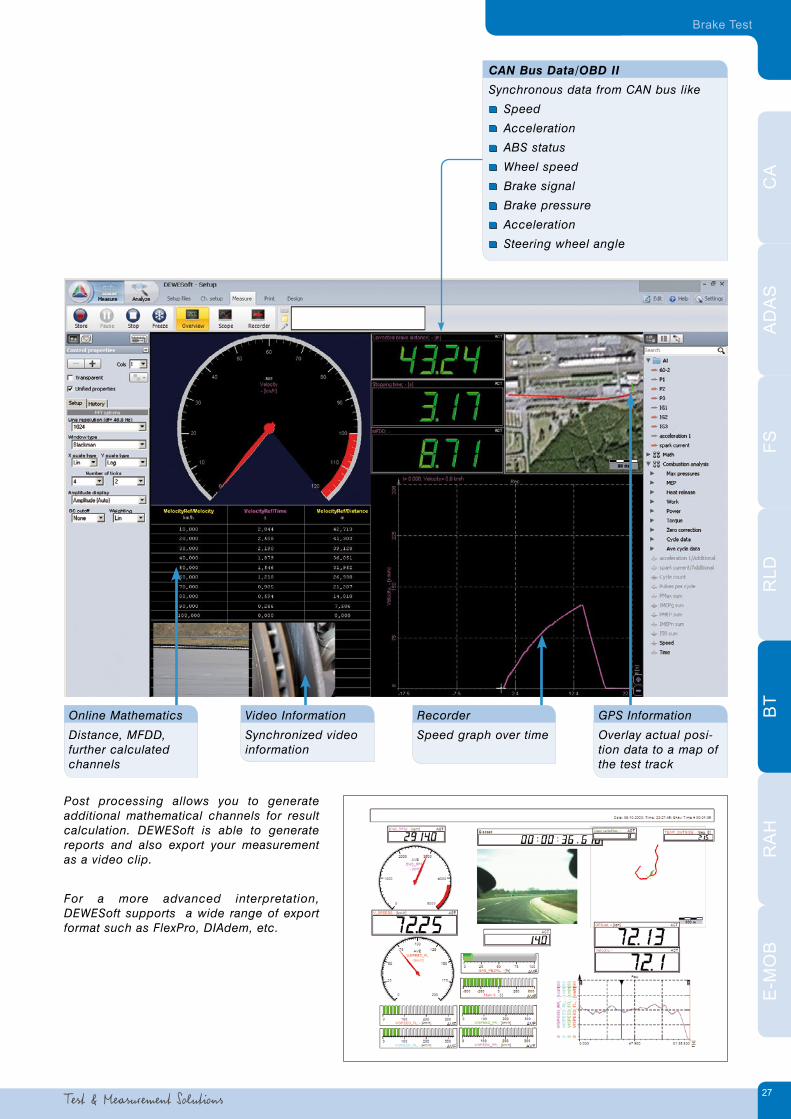
Post processing allows you to generate additional mathematical channels for result calculation. DEWESoft is able to generate reports and also export your measurement as a video clip.
For a more advanced interpretation, DEWESoft supports a wide range of export format such as FlexPro, DIAdem, etc.
CAN Bus Data/OBD II
Synchronous data from CAN bus like
Speed
Acceleration
ABS status
Wheel speed
Brake signal
Brake pressure
Acceleration
Steering wheel angle
Online Mathematics
Distance, MFDD, further calculated channels
Video Information
Synchronized video information
GPS Information
Overlay actual posi-tion data to a map of the test track
Recorder
Speed graph over time

www.dewetron.com28
Simple Brake Test ApplicationBrake testing is usually done according to standardized brake test procedures. Setting up a test sequence including the online check of the test boundaries allows performing the required tests for a standardized procedure. These tests are required for development and homologation of vehicles.
On the other hand, brake testing is a wide field of different requirements and a flexible and multifunctional solution guaranties a safe investment. The same equipment is also capable of performing tire testing, acceleration tests, odo calibration, fuel consumption, etc.
DEWETRON's measurement equipment is designed for highly robust data acquisition in the vehicle. All user interface and user interaction is done in an easy and economic way. Effective gadgets help the user to make the daily work simple and easy. Features like Offline Setup, Sensor Database, TEDS or Global Header and powerful Export Features integrate the measurement equipment in the whole process of testing.
The main steps performed for a brake test are supported with the DEWESoft sequencer:
Setup of the sensors
Setup the brake test conditions
Close the setup and start the test
Accelerate the vehicle to the start velocity
Press the brake pedal for maximum braking force
Perform the measurement within the braking phase
Validate the data and analyze
Finally generating a report or export the data.
The brake test requires simply the mounting of the GPS antenna and of the pedal switch. The DEWETRON measure-ment system can be mounted on the passanger seat via a belt using a snap closure. The display is mounted on the front screen via vacuum cups or on a telescopic pillar.
The channels for velocity, distance and acceleration need to be set up. The start and stop conditions of the test need to be defined in the brake test setup dialog. Starting the test aktivates the sequencer which guides you through the test and starts the measurement of the required data automatically.
For the simple brake test the vehicle accelerates to the defined speed. The sequencer now releases the brake phase which is detected by the switch on the brake pedal. The test is finished, when the car stands still and the software detected the stop chriteria. Now the report can be generated automatically and sent to a small printer
GPS SystemGPS System is the easiest and up to now the most elegant way to measure speed and position with the required accuracy. Other devices such as optical, radar or 5th wheel are also supported with DEWETRON Brake Test systems. GPS is the preferred one because it is easy to install, easy to use and gives robust and precise data. GPS is not sensitive to the road surface, it also can be used off road on muddy streets, snow, ice etc.
The GPS receiver is integrated inside a DEWETRON measurement device, so only the antenna has to be put on top of the vehicle and connected to the measurement device.
Features of the DEWETRON GPS system:
Easy to install and use
Real-time vehicle speed
Lowest latency time
No calibration required
GPS is not sensitive to road surface – therefore can be used even off-road, snow, ice etc.
Analog speed output and digital displacement output

29
Brake Test
E-M
OB
BT
RA
HR
LDA
DA
SFS
CA
Comparing GPS data with conventional optical sensor data shows that signal accuracy and signal latency of the GPS sig-nal is comparable – according its noise even better. A constant latency time of 8 ms of the optical sensor is corrected for this comparison.
A DEWETRON system can handle all types of those sensors whether it is an optical sensor, a radar sensor or a 5th wheel sensor.
Brake Test SequenceThe sequencer is a tool to predefine a process of steps in a sequential format. The interface can be graphically programmed or in a code oriented view. The sequence is stored in a file format. Therefore it is possible to manage these sequences centrally to guarantee a standardized and defined measurement procedure.
Within the sequencer you can access all relevant DEWESoft features. In addition you can apply actions, apply formulas and make decisions, wait for interaction or a preset delay and define your customized sequences. So it’s possible to define different sequences and fit them together in a single sequence, where the sub sequences are done sequentially. The sequences can be controlled by the user or by an event caused by a certain channel.
For a specific test which consists of different steps and loops it’s possible to configure such a test sequence. As shown in this simple example for brake testing.
Brake Test SetupThe setup of the Brake Test is shown in this screenshot. Start and stop conditions are set and also the required channels can be setup.
For each output channel you can choose a name and choose the proper unit. You can also configure the color and preset a minimum and a maximum value used as a preset for its indicat-ing instrument.
Clicking on the arrow you can scroll through all the brake test specific channels.

www.dewetron.com30
Calculated ParametersThe math for those tests will be done in custom math module of DEWESoft. The values which need to be calculated are interpolated tables of v, a, t, s (velocity, acceleration, time and distance) where the reference could be time, velocity or distance in predefined steps.
The additional parameters which are calculated are:
Start speed when pushing brake pedal
Stopping time
Corrected brake distance, calculated as Sc=Sm*Vd²/Va²
Mean fully developed deceleration MFDD (calculation see ECE R13-H)
Brake deceleration over complete measurement
Derivation of acceleration, used to check the passenger comfort
Where:
vo initial vehicle speed in km/h
vb vehicle speed at 0.8 vo in km/h
ve vehicle speed at 0.1 vo in km/h
Sb distance travelled between vo and vb in meters
Se distance travelled between vo and ve in meters
The speed and distance shall be determined using instrumentation having an accuracy of ± 1 % at the prescribed speed for the test. The dm may be determined by other methods than the measurement of speed and distance; in this case, the accuracy of the dm shall be within ± 3 %.
USB Printer for printing resultsThis printer is used to print the most important result parameters direct after the test and makes the documentation very easy.
DEWETRON BT Hardware Configuration
DEWE2-M4-BT
Analog input channels 2 free slots for TRION™ series modules
Digital channels 8 DIO and 2 CTR or 8 DI
Channel expansion Yes
CAN interfaces 4
Video DEWE-CAM-GIGE-120
Display External MOB-DISP-12-A
Power supply 11 to 32 VDC (10 to 36 VDC) isolated; incl. external AC power supply
Dimensions (W x D x H) 318 x 253 x 108 mm (12.5 x 10 x 4.3 in.)
Weight Typ. 3.8 kg (8.6 lb)
TRION™ series modules are available for almost all kinds of sensors

E-M
OB
BT
RA
HR
LDA
DA
SFS
CA
31
Ride and Handling
Ride and HandlingKey Features
Synchronized multichannel data acquisition without phase errors
Proven package due to DTA
Guaranteed compatibility of the whole system
Compact and rugged equipment for in-vehicle use
Easy mounting, setup, alignment, and calibration
Multisensor inputs (voltage, acceleration, strain, etc.)
Aliasing free sampling and flexible filtering capabilities
Real-time Mathematics
Support for Kistler RoaDyn® measurement wheels
Export to different file formats
DEWETRON systems offer a rugged and portable design for in-vehicle and fulfill the requirement of a high channel count for vehicle dynamics investigations. The system covers a wide range of input types e.g. for voltage, strain, temperature and also for GPS, Video, CAN and OBD II.
In addition to the application of Ride and Handling test-ing, the system is capable of being expanded with addi-tional hardware and software features. Further automotive measurement tasks such as hybrid testing on the power train, brake test, together with synchronized video are also possible.
A u t o m o t i v eE n e r g y & P o w e r A n a l y s i sA e r o s p a c e & D e f e n s eTr a n s p o r t a t i o nG e n e r a l Te s t & M e a s u r e m e n t
www.dewetron.com
DEWE2-M4-RLD DEWE-501-RLD-64 DEWE-501-PCI-64 DEWE-2601-RLD-64
Application Extremely compact RLD system
Analog input channels 2 free slots for TRION™ series modules 64 MDAQ inputs 64 MDAQ inputs 64 MDAQ inputs
Digital channels 8 DIO + 2 CTR + 8 DI 8 DIO + 2 CTR or 8 DI 8 DIO + 2 CTR or 8 DI 8 x DIO 2 CTR or 8 DI
Channel expansion Yes Yes No Yes
CAN interfaces 4 4 Up to 4 (opt.) 4
Video DEWE-CAM-GIGE-120 or USB DEWE-CAM-GIGE-120 or USB No DEWE-CAM-GIGE-120 or USB
Display External MOB-DISP-x External MOB-DISP-x No 15‘‘ 1024 x 768
Real time analog output Option ???? Option Option Option
Power supply11 to 32 VDC (10 to 36 VDC) iso-lated; incl. external AC power supply
Battery powered, 18 to 24 VDC or 11 to 33 VDC (UPS battery 1 min.)
Battery powered, 18 to 24 VDC or 11 to 33 VDC (UPS battery 1 min.)
Battery powered, 18 to 24 VDC, external AC power supply
Dimensions (W x D x H) 318 x 253 x 108 mm 12.5 x 10 x 4.3 in.
439 x 209 x 181 mm17.28 x 8.23 x 7.13 in.
439 x 209 x 181 mm17.28 x 8.23 x 7.13 in.
417 x 246 x 303 mm16.42 x 9.69 x 11.93 in.
Weight Typ. 3.8 kg (8.6 lb) Typ. 9 kg (19.8 lb.) Typ. 8 kg (17.6 lb.) Typ. 14 kg (31 lb.)
TRION™ and MDAQ series modules are available for almost all kinds of sensors
www.dewetron.com32
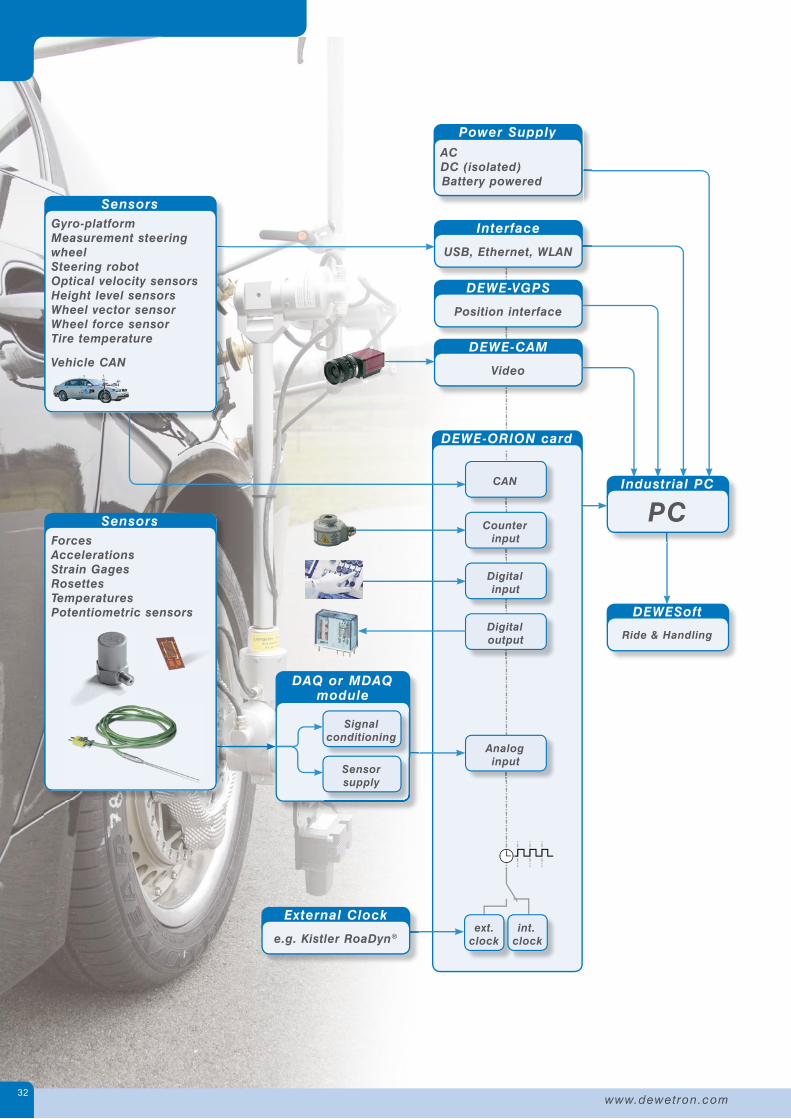
DEWE-ORION card
Industrial PC
PC
DEWESoft
Ride & Handling
DEWE-VGPS
Position interface
DEWE-CAM
Video
CAN
Analoginput
Counterinput
Digitalinput
Digital output
ext.clock
int.clock
Interface
USB, Ethernet, WLAN
External Clock
e.g. Kistler RoaDyn®
SensorsGyro-platformMeasurement steering wheelSteering robotOptical velocity sensorsHeight level sensorsWheel vector sensorWheel force sensorTire temperature
Vehicle CAN
Power SupplyACDC (isolated)Battery powered
DAQ or MDAQ module
Signalconditioning
Sensorsupply
SensorsForcesAccelerationsStrain GagesRosettesTemperaturesPotentiometric sensors

E-M
OB
BT
RA
HR
LDA
DA
SFS
CA
GPS Information
Position data
Video
Synchronized video information
Analog Channels
Strain, temperature, acceleration, force, torque, etc.
CAN-Bus Data/OBD II
Synchronous data from CAN-bus
CAN DBC export and import
J1939 decoding
Wheel Force Measurement
Telemetric recipient for all wheel forces
-220
-180
-140
-100
-60
-20
20
60
100
140
180
220
0 1 2 3 4 5 6 7-11
-9
-7
-5
-3
-1
1
3
5
7
9
11
Ste
erin
g a
ngle
(°)
Late
ral
acce
lera
tion
(m/s
²)
Ro
ll an
gle
(°)
Flo
at a
ngle
(°)
2 m/s² Right turn
R = 100 m
3 m/s² Right turn
4 m/s² Right turn
5 m/s² Right turn
6 m/s² Right turn
-150
-130
-110
-90
-70
-50
-30
-10
10
30
50
70
90
110
130
150
-12,0 -10,0 -8,0 -6,0 -4,0 -2,0 0,0 2,0 4,0 6,0 8,0 10,0 12,0
Right turn
Left turn
Lateral acceleration (m/s²)
Ste
erin
g a
ngle
(°)
33
Ride and Handling
Reports

www.dewetron.com34
Ride and Handling Application Cars and trucks are designed on computers, and built by robots under computer control. But there is no substitute for testing the car with a human being, under a wide variety of road conditions and environments. That‘s where ride handling tests start. Most vehicle manufacturers have their own test track or proving grounds, where they can put their creations to the test. What normal people would consider „subjective criteria“ like how a car „feels“ under certain conditions must be precisely quantified and then tested over and over again within an optimization loop, on every vehicle.
Standardized tests guarantee reproducible and comparable results. Those standards are available and supported with our measurement system. This is furthermore important for a globalised comparison of test results. For the mea-surement process – efficient setup time and simple system handling is a key to fulfill efficient measurement tasks. Our unique DEWESoft, the portable packages and rugged construction makes DEWETRON products popular for ride handling, drivability, vehicle dynamics, and related applications.
Typical tests for Ride and Handling are:
Stationary circle test (DIN ISO 4138)
ISO Lane Change Test (ISO 3888-1/2)
Braking from stationary circle test ( ISO 7975)
VDA-evasion test according to ISO 3888-2
Load change from stationary circle test according to ISO 9816
Steering angle step and sinus test according to ISO 7401, 13674-1,-2 (with steering robot)
Fishhook Test (NCAP)
FMVSS-126 (Sine with Dwell)
Ride and Handling – often also called vehicle dynamics - is a wide range of applications and investigations in the development process of an vehicle and its components. One goal of the investigations is an objective assessment of the vehicle behavior and the drivability. Furthermore also the development of control loops and the parameterization for the chassis control is within the view of the ride and handling application.
Ride and Handling Sensor InstallationDepending on the measurement goal, many different sensors are required for different tests. With a DEWETRON Ride and Handling System you can implement all established sensors available on the market. Together with the DTA (Drivability Testing Alliance) our system compatibility is proven. The table shows the required the minimum sensor equipment for each standardized tests. The following table is a suggestion for the sensor equipment of each test. The table beside shows the physical parameters of the main mea-surement systems. The synchronous and aliasing-free acquisition of the physical channels is guaranteed – furthermore all mathematical processing of additional channels can be done online.
E-M
OB
BT
RA
HR
LDA
DA
SFS
CA
35
Ride and Handling
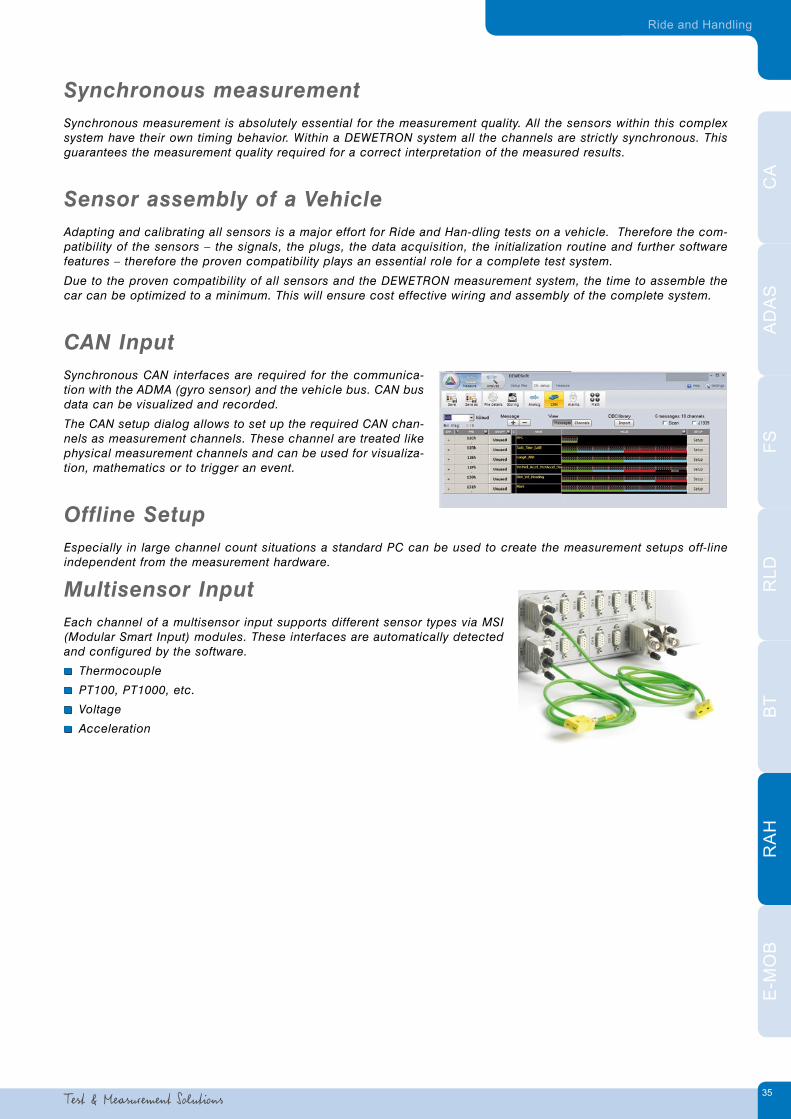
Synchronous measurementSynchronous measurement is absolutely essential for the measurement quality. All the sensors within this complex system have their own timing behavior. Within a DEWETRON system all the channels are strictly synchronous. This guarantees the measurement quality required for a correct interpretation of the measured results.
Sensor assembly of a VehicleAdapting and calibrating all sensors is a major effort for Ride and Han-dling tests on a vehicle. Therefore the com-patibility of the sensors – the signals, the plugs, the data acquisition, the initialization routine and further software features – therefore the proven compatibility plays an essential role for a complete test system.
Due to the proven compatibility of all sensors and the DEWETRON measurement system, the time to assemble the car can be optimized to a minimum. This will ensure cost effective wiring and assembly of the complete system.
CAN Input Synchronous CAN interfaces are required for the communica-tion with the ADMA (gyro sensor) and the vehicle bus. CAN bus data can be visualized and recorded.
The CAN setup dialog allows to set up the required CAN chan-nels as measurement channels. These channel are treated like physical measurement channels and can be used for visualiza-tion, mathematics or to trigger an event.
Offline SetupEspecially in large channel count situations a standard PC can be used to create the measurement setups off-line independent from the measurement hardware.
Multisensor InputEach channel of a multisensor input supports different sensor types via MSI (Modular Smart Input) modules. These interfaces are automatically detected and configured by the software.
Thermocouple
PT100, PT1000, etc.
Voltage
Acceleration

www.dewetron.com36
Sequence Control The sequencer is a tool to predefine process steps in a sequential format. The interface can be graphically programmed or in a code oriented view. It is possible to manage these sequences centrally to guarantee a standardized and defined measurement procedure.
Within the sequencer you can access all relevant DEWESoft features - apply actions and formulas and make decisions, wait for interaction or a preset delay and define your customized sequences. So it’s pos-sible to define different sequences and fit them together in a single sequence, where the sub sequences are done sequentially. The sequences can be controlled by the user or by an event caused by a trigger of a certain channel.
Sensor Database and TEDS The entire channel setup and scaling is just a click away, which keeps a comprehensive list of sensors and all their parameters, including scaling, units and calibration date info.
Linear scaling and offset
Non linear scaling
Polynomial scaling
Calibration table
The entire channel setup and scaling is just a click away. If necessary it’s possible to zero the sensor or even to renew the calibration parameters. This guarantees the reproducibility, traceability and quality of your measurement results.
To make the sensor setup even more automated, our signal conditioning modules support TEDS, which is the new „smart sensor interface". TEDS is an acronym for Transducer Electronic Datasheet. It is a table of parameters (manufacturer ID, model number, serial number, version, and many more) that identifies the transducer.
The screenshot shows a view to the sensor database dialog.
DEWESoft Net
DEWESoft Net allows the communication between different Dewetron Systems. The system can be configured as stand alone, as master or as a slave unit. It’s also possible to use another PC for remote control.
Cascading two or more devices in the vehicle – DEWESoft Net can synchronic and interface the devices. For testing in two or more vehicles, using a master slave configuration, the data can be send via WLAN to the master.
Global HeaderThe global header adds additional information to the measure-ment project for documentation. Entries like project name, test engineer, test description, unit under test and comments etc. can be configured. The setup of the header file can be stored and used as a standard header file.
All data and setup parameters are stored in the data file. This allows a traceable measurement procedure.

E-M
OB
BT
RA
HR
LDA
DA
SFS
CA
-220
-180
-140
-100
-60
-20
20
60
100
140
180
220
0 1 2 3 4 5 6 7-11
-9
-7
-5
-3
-1
1
3
5
7
9
11
Ste
erin
g a
ngle
(°)
Late
ral
acce
lera
tion
(m/s
²)
Ro
ll an
gle
(°)
Flo
at a
ngle
(°)
2 m/s² Right turn
R = 100 m
3 m/s² Right turn
4 m/s² Right turn
5 m/s² Right turn
6 m/s² Right turn
-150
-130
-110
-90
-70
-50
-30
-10
10
30
50
70
90
110
130
150
-12,0 -10,0 -8,0 -6,0 -4,0 -2,0 0,0 2,0 4,0 6,0 8,0 10,0 12,0
Right turn
Left turn
Lateral acceleration (m/s²)
Ste
erin
g a
ngle
(°)
37
Ride and Handling
Triggers and Alarms DEWESoft includes a versatile TRIGGER section, which includes with following types of trigger method:
Simple edge
Filtered edge
Window trigger
Pulse width trigger
Window and pulse width
Slope Trigger
The same type of dialog is available to set up an alarm event.
All of these sources are available to STOP the acquisition or con-figure a condition where no data will be stored. It's also possible to enter a pre-aquisition time, a post-acquisition time and a holdoff time.
Data VisualizationOne of the most powerful and yet easy to use aspect of DEWESoft is the creation of displays. Each of the standard displays mentioned above can be modified in seconds, as easily as clicking the DESIGN button and clicking widgets from the screen design tool bar!
Pictures Discrete displays Oscilloscope FFT chart
Digital meter Bar graphs Video GPS
Analog meter Recorder XY-chart Text
FlexPro Report FlexPro® combines the power of a high-end data analysis tool with the ease of use and familiar interface of Excel. But unlike Excel, there are no limits to the size of a file that FlexPro can open, analyze, chart, and print! Tightly integrated with DEWESoft, FlexPro is a worthy option for any DEWETRON data acquisition system.
Using a FlexPro template, your report is generated after the measurement sequence. Programming is as simple as usage of Excel and Word and at the same time very fast, even when dealing with large data volumes.The template defines all tables and graphes you want to see within ypur report – this has only to be done once.
Once you have defined the calculations and the layout, you have a template that you can be re-use for future tests. Simply import the data from a new test into FlexPro and update your documents with a mouse click.

www.dewetron.com38
DEWETRON RAH Hardware Configuration
DEWE2-M4-RAH DEWE2-M13s-RAH DEWE2-A13-RAH DEWE2-F13s-RAH DEWE-501-RAH-128
Analog input channels 2 free slots for opt. TRION™ series modules 11 free slots for opt. TRION™ series modules 64 MDAQ inputs
(64 ch. expansion box)
Digital channels 8 DIO and 2 CTR or 8 DI
Channel expansion Yes
CAN interfaces 4
Video DEWE-CAM-GIGE-120 or USB
Display External MOB-DISP-x 17’’ (1920 x 1080) External MOB-DISP-x
Power supply 11 to 32 VDC (max. 10 to 36 VDC) isolated; incl. external AC power supply 100 to 240 VAC (max. 90 to 264 VAC)
Battery powered, 18 to 24 VDC or 11 to 33 VDC (UPS battery 1 min.)
Dimensions (W x D x H) 318 x 253 x 108 mm 12.5 x 10 x 4.3 in.
441 x 230 x 177 mm 17.4 x 9.1 x 7 in.
450 x 246 x 303 mm 17.7 x 9.7 x 11.9 in.
441 x 230 x 177 mm 17.4 x 9.1 x 7 in.
per 64 ch. box439 x 209 x 181 mm17.28 x 8.23 x 7.13 in.
Weight Typ. 3.8 kg (8.6 lb) Typ. 13.0 kg (28.6 lb) Typ. 15.0 kg (33 lb) Typ. 8.0 kg (17.6 lb) Typ. 9 kg (19.8 lb.)
TRION™ and MDAQ series modules are available for almost all kinds of sensors

39
Electro-Mobility
E-M
OB
BT
RA
HR
LDA
DA
SFS
CA
Electro-MobilityDEWE-E-Mobile
In the race to produce an electric vehicle with a range practical for everyday use, the development of energy efficient components is an important focus for automo-tive research centres all over the globe. Consequently there is an enormous need for test and measurement systems to monitor the energy flow and storage through vehicle activity such as charging, startup, driving, par-king and potential misuse of the vehicle. DEWE-E-Mobile systems can do so much more than just capture voltage and current signals.
An extra library for power measurement (DEWESoft POWER Module) makes the calculation of, for example, power flow, losses, harmonics and voltage fluctuations possible. With the help of this functionality the user can - beside the DC measurement on batteries - make synchronized analysis of the other components like con-verters and motors.
Adding transducers such as accelerometers, rpm sen-sors or thermocouples can be handled through flexible and isolated signal conditioning, recorded in a synchro-nized way alongside hundreds of channels of vehicle CAN bus data. Add a GPS sensor to give information
Applications
ALL-IN-ONE Power Analyzer, Combustion Analyzer, Recorder and Scope on a single machine
Same software interface for all instruments, easy to learn and use, online or offline calculation
Synchronized analog & digital signals, counter, CAN bus and video inputs – to simplify analysis
High isolation and high accuracy
High bandwidth up to 2 MHz
Test bench for electric drive trains
A u t o m o t i v eE n e r g y & P o w e r A n a l y s i sA e r o s p a c e & D e f e n s eTr a n s p o r t a t i o nG e n e r a l Te s t & M e a s u r e m e n t
about position, distance, velocity and direction, along with video camera’s to monitor road or environmen-tal conditions and you have a very clear view of the “E-vehicles‘” performance characteristics.
www.dewetron.com40
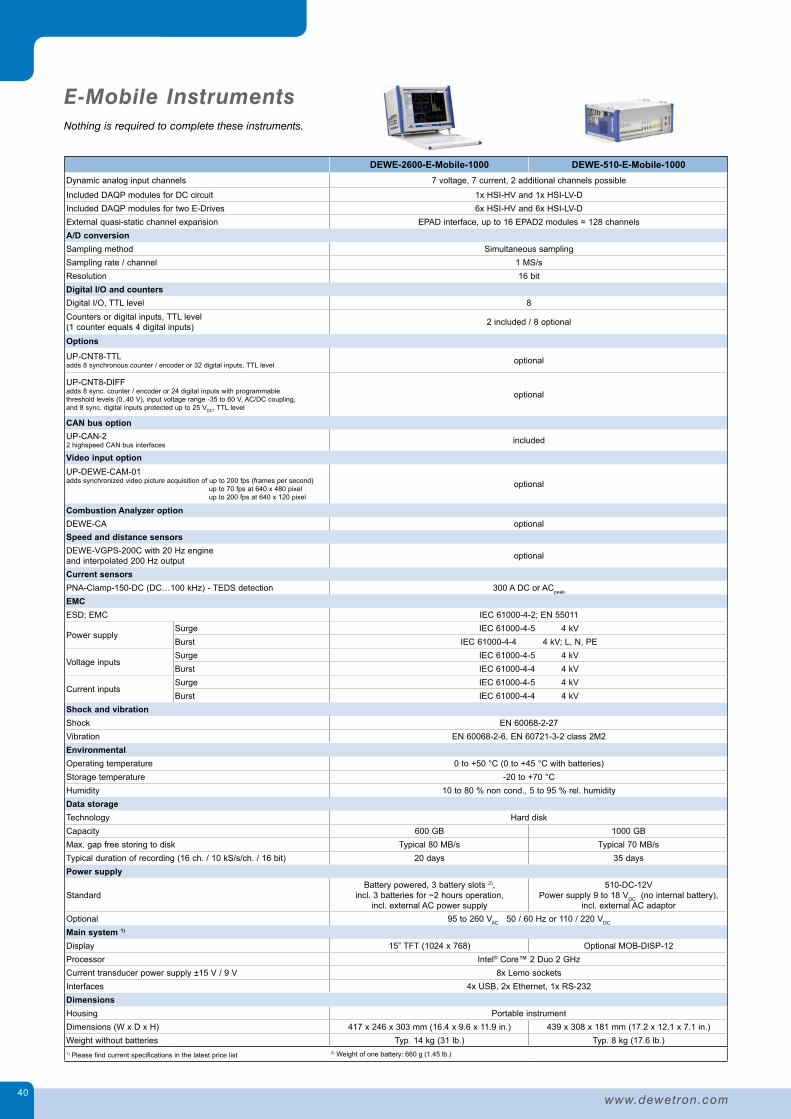
DEWE-2600-E-Mobile-1000 DEWE-510-E-Mobile-1000Dynamic analog input channels 7 voltage, 7 current, 2 additional channels possible
Included DAQP modules for DC circuit 1x HSI-HV and 1x HSI-LV-DIncluded DAQP modules for two E-Drives 6x HSI-HV and 6x HSI-LV-DExternal quasi-static channel expansion EPAD interface, up to 16 EPAD2 modules = 128 channelsA/D conversionSampling method Simultaneous samplingSampling rate / channel 1 MS/sResolution 16 bitDigital I/O and countersDigital I/O, TTL level 8Counters or digital inputs, TTL level (1 counter equals 4 digital inputs) 2 included / 8 optional
Options
UP-CNT8-TTL adds 8 synchronous counter / encoder or 32 digital inputs, TTL level optional
UP-CNT8-DIFF adds 8 sync. counter / encoder or 24 digital inputs with programmable threshold levels (0..40 V), input voltage range -35 to 60 V, AC/DC coupling, and 8 sync. digital inputs protected up to 25 VDC, TTL level
optional
CAN bus optionUP-CAN-2 2 highspeed CAN bus interfaces included
Video input optionUP-DEWE-CAM-01 adds synchronized video picture acquisition of up to 200 fps (frames per second) up to 70 fps at 640 x 480 pixel up to 200 fps at 640 x 120 pixel
optional
Combustion Analyzer optionDEWE-CA optionalSpeed and distance sensorsDEWE-VGPS-200C with 20 Hz engine and interpolated 200 Hz output optional
Current sensorsPNA-Clamp-150-DC (DC…100 kHz) - TEDS detection 300 A DC or ACpeak
EMCESD; EMC IEC 61000-4-2; EN 55011
Power supplySurge IEC 61000-4-5 4 kVBurst IEC 61000-4-4 4 kV; L, N, PE
Voltage inputsSurge IEC 61000-4-5 4 kVBurst IEC 61000-4-4 4 kV
Current inputsSurge IEC 61000-4-5 4 kVBurst IEC 61000-4-4 4 kV
Shock and vibrationShock EN 60068-2-27Vibration EN 60068-2-6, EN 60721-3-2 class 2M2EnvironmentalOperating temperature 0 to +50 °C (0 to +45 °C with batteries)Storage temperature -20 to +70 °CHumidity 10 to 80 % non cond., 5 to 95 % rel. humidityData storageTechnology Hard diskCapacity 600 GB 1000 GBMax. gap free storing to disk Typical 80 MB/s Typical 70 MB/sTypical duration of recording (16 ch. / 10 kS/s/ch. / 16 bit) 20 days 35 daysPower supply
StandardBattery powered, 3 battery slots 2),
incl. 3 batteries for ~2 hours operation, incl. external AC power supply
510-DC-12VPower supply 9 to 18 VDC (no internal battery),
incl. external AC adaptorOptional 95 to 260 VAC 50 / 60 Hz or 110 / 220 VDC Main system 1)
Display 15” TFT (1024 x 768) Optional MOB-DISP-12Processor Intel® Core™ 2 Duo 2 GHzCurrent transducer power supply ±15 V / 9 V 8x Lemo socketsInterfaces 4x USB, 2x Ethernet, 1x RS-232DimensionsHousing Portable instrumentDimensions (W x D x H) 417 x 246 x 303 mm (16.4 x 9.6 x 11.9 in.) 439 x 308 x 181 mm (17.2 x 12.1 x 7.1 in.)Weight without batteries Typ. 14 kg (31 lb.) Typ. 8 kg (17.6 lb.)1) Please find current specifications in the latest price list 2) Weight of one battery: 660 g (1.45 lb.)
E-Mobile Instruments Nothing is required to complete these instruments.

4141
Electro-Mobility
E-M
OB
BT
RA
HR
LDA
DA
SFS
CA
PNA-CLAMP-150-DCCurrent range 300 ADC or ACpeak Power supply
OPTION for * DEWE-2600/2602: * For others:
±15 V ±10 %, external
0.5U-CLAMP-DC-POWER-4/-8CLAMP-DC-POWER-4/-8
Cont. current measurement 150 ADC or ACRMS
Overload capability 500 ADC (for 1 min)
Output sensitivity 20 mV/A (w.r.t. 0 V) Connector SUB D(TED); (SUBD modules required for TEDS support)Supply (LEMO; incl. jaws
status); Adapter SUB D-banana included
Accuracy (+ 25 °C) ±0.3 % of reading ±2 mA
Resolution ±1 mA
Frequency Range DC to 100 kHz (-1 dB) Max. conductor size 32 mm diameterJaw status 0 V (Lo) / +15 V (Hi) Relative zero correction Auto zero at switch on
PNA-CLAMP-1800-DCCurrent range 1800 ADC or ACpeak Power supply
OPTION for * DEWE-2600/2602: * For others:
±9 V ±5 %, external
0.5U-CLAMP-DC-POWER-4/-8CLAMP-DC-POWER-4/-8
Output sensitivity 1 mV/A (w.r.t. ±2.5 V)Accuracy (+ 25 °C)
DC Accuracy (0-1000A)1 ±0.8 % of reading ±0.5 A
DC Accuracy (1000-1500A)1 ±1.8 % of reading ±0.5 A ConnectorSUB D(TED); (SUBD modules required for TEDS support)
Supply (LEMO); Adapter SUB D-banana included
Overall Accuracy (0-1000A)² ±2.5 % of reading ±0.5 A
Overall Accuracy (1000-1500A)² ±3.5 % of reading
Overall Accuracy (1500-1800A)² ±5 % of reading
Resolution ±20 mA Max. conductor size 32 mm diameter
Frequency Range DC to 20 kHz (-1 dB) Relative zero correction Push button
www.dewetron.com42
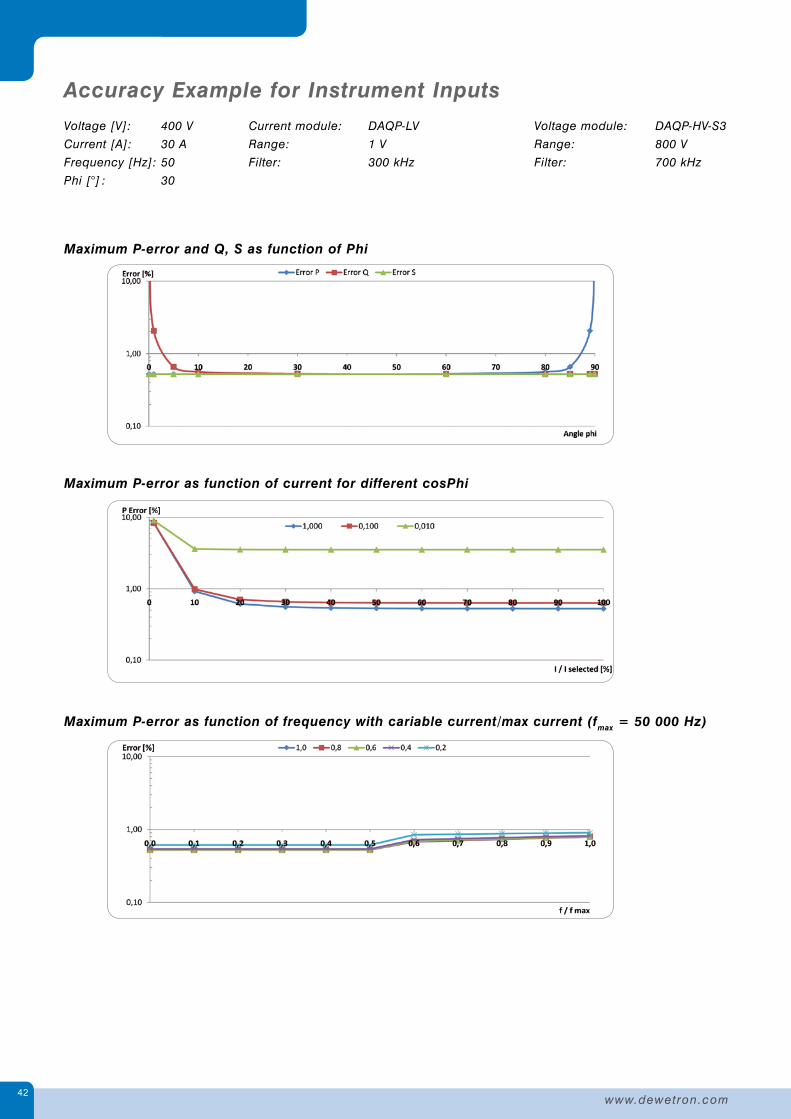
Accuracy Example for Instrument Inputs
Maximum P-error and Q, S as function of Phi
Maximum P-error as function of current for different cosPhi
Maximum P-error as function of frequency with cariable current/max current (fmax = 50 000 Hz)
Current module: DAQP-LV
Range: 1 V
Filter: 300 kHz
Voltage module: DAQP-HV-S3
Range: 800 V
Filter: 700 kHz
Voltage [V]: 400 V
Current [A]: 30 A
Frequency [Hz]: 50
Phi [°] : 30

43
Electro-Mobility
E-M
OB
BT
RA
HR
LDA
DA
SFS
CA
Hybrid Vehicles and other Alternative Drive ConceptsApplication Example for E-Mobility
Introduction Due to the worldwide energy situation alternative energy concepts for vehicles of all kinds are getting more and more important. Hybrid vehicles are already serialized and more and more electric drive concepts appear on the market. The electric motors with electronically controlled feed, that is also able to recuperate braking energy, are the future. Batteries and fuel cells are used more and more.
Task Modern drive systems work with very fast converters that have both high pulse frequencies and steep rising edges. The power measurement is thus confronted with all tasks of modern power measurement instru-ments: broadband input modules, high sampling rates, highly accurate identification of reactive and active power, determination of rotation speed and torque. Beside the measurements of motors (3~, permanently energized syn-chronization instruments), also measurements of battery circuits and intermediate circuits are of interest – and this absolutely synchro-nous (DC, single-phase).
Further interesting parameters could be tem-perature, oscillation, acoustics, sound emis-sion, torsion and rotation oscillation and analy-sis of combustion engines provided that they are used in parallel. On the one side, such sys-tems should be as portable as maximally possible for mobile applications. On the other side, it should be possible to integrate them in engine test benches. This requires adequate data interfaces.
Solution
HardwareBroadband, isolated measuring inputs, high sampling rates and robust design combined with high flexibility – this unifies DEWETRON in its instruments of DEWE-E-Mobile series; be it the 510 as engine test bench solution or integrated in the car, respectively the 2600 that is battery-powered. They all have the modular construction in common that allows an arbitrary number of current and voltage input channels. Temperature, charge or bridge amplifiers can also be used as can CAN bus adapters or counter interface for e.g. tachometers.
For highly accurate current measurements zero flux transducers are used that not only feature high dynamics (startup current ver-sus idle current with an accuracy of 0.05 %) but also high band-width. As for voltage inputs also in this case several 100 kHz are a must (-3 dB@700 kHz). Sampling rates of up to 1 MHz allow exact analysis of pulse packages of the frequency converters.

www.dewetron.com44
SoftwareThe software DEWESoft with its option POWER was especially developed for the electric power measurement. It includes the conventional and approved DEWESoft functions and moreover provides all parameters that are necessary for electric drives:
P, Q, S, PF
U, I, cos Phi
Harmonics
FFT up to 500 kHz
M, n
X/Y recorder
Sound
Vibration
Rotational and torsional vibration
Further Functions
Several Power Modules at Same TimeWith the DEWESoft power module several power systems can be measured at the same time. Motors, for example: UMotor 3~ / UDC / UBattery
Sound and Vibration Exact and high-resolution noise level measurement according to IEC 60651, 60804, 61672. With its user-friendly operator inter-face DEWESoft brings the sophisticated noise/acoustics analsyis to the user.
Rotational and Torsional VibrationsWith this module you can easily measure rotational vibrations, bearing damages, unbalances, etc. and can record - in parallel to the power data discussed so far - as well as evaluate them.
Analyses on Combustion Engines CA-OptionShould, as it is the case with classical hybrid vehicles, com-bustion engines also be in use beside electrical drive systems, then these engines can simultaneously be analyzed with the DEWESoft-CA.
CAN-BusBeside a number of sensors, also direct CAN-bus systems can be provided. CAN-bus data can here be used by the DEWESoft as all other measurement channels.

45
Electro-Mobility
E-M
OB
BT
RA
HR
LDA
DA
SFS
CA
Driveability TestsDEWESoft offers a wide range of functions for drive ability tests that can, of course, be used simultaneously. GPS systems for deceleration measurements, in parallel to the recuperation of drive systems, are only one of several possibilities provided.
VideoThe use of synchronous DEWESoft VIDEO functions allows the parallel storing of video data and measurement values and opens a wide range of application possibilities – whenever optical information is needed.
Remote ControlWith the remote control system the instruments can be configured and the data can be evaluated from afar – for example while being in your office. The transmission of data from vehicle to vehicle via WLAN is also a special feature.
Open Interface (DCOM)The programming interface DCOM offers every user the possi-bility to arrange one’s individual integration into test bench sys-tems. Several protocols already generated are available (OPC, Modbus, …) – just contact us and we are pleased to find your individual solution for your applications.
Customers Vehicle producers
R & D departments for electrical drive systems
Research centers and testing laboratories

www.dewetron.com46
Measurements on Electrical Energy Storage Systems Application Example for E-Mobility
IntroductionFor hybrid and electric cars electric energy storage is a key com-ponent in relation to costs. Owing to the trend towards electro mobility, electric storage systems are increasingly falling under the global spotlight. Manufacturers’ efforts are predominantly focused on improving range and performance as well as durability, safety and reliability.
DEWE-E-Mobile series offers a wide range of opportunities, allowing these core areas to be tested in great detail for cells, battery mod-ules, super capacitors and energy management systems – thereby forming the basis for efficient, powerful and reliable traction batter-ies in electric vehicles of the future.
TaskThe requirements of reliability and performance of the electrical system of modern cars are continuously rising. In the overall concept, storage for electrical energy plays the central role. Modern applications in motor vehicles such as stop/start, hybrid-drives, plug-in hybrid and electric vehicle result in new requirements for energy storage.
Future hybrid and electric vehicles will mainly be equipped with lithium-ion batteries. These batteries promise to have a high storage density. But in order to tap their full potential and to guarantee long-term and high-level opera-tion period, intelligent and elaborate testing is absolutely necessary. Another challenge is the integration of batteries in the drive train and the entire vehicle.
Further interesting parameters could be temperature, oscillation and acoustics or sound emission. On the one side, such systems should be as portable as maximally possible for mobile applications. On the other side, it should be possible to integrate them in engine test benches. This requires adequate data interfaces.
Measurements with high dynamic range for voltages & currents are required to fulfill the following tasks:
Cell characterization: measurement and performance profile under defined environmental conditions
Charge-discharge cycles, respectively utilization cycles
Environmental simulations: including temperature, pressure, vibration, weathering
Misuse tests: behavior of batteries under extreme electrical, mechanical and thermal loads or overload such as overloading, short-circuit, mechanical damage, overheating
Endurance tests: endurance and ageing tests during storage or cycling in increased temperatures
Solution
HardwareBroadband, isolated measuring inputs, high sampling rates and robust design combined with high flexibility – this uni-fies DEWETRON in its instruments of DEWE-E-Mobile series; be it the DEWE-510 as test bench solution or integrated in the car, respectively the DEWE-2600 that is battery-powered. They all have the modular construction in common that

47
Electro-Mobility
E-M
OB
BT
RA
HR
LDA
DA
SFS
CA
allows an arbitrary number of current and voltage input channels. Temperature, charge or bridge amplifiers can also be used as CAN-bus adapters or digital in- and outputs.
For highly accurate current measurements zero flux transducer are used that not only feature high dynamics (load current versus idle current with an accuracy of 0.05%) but also high band-width. As for voltage inputs also in this case several 100 kHz are a must (-3dB@700kHz). The battery behavior during highly dynamic loads is particularly interesting when evaluating hybrid batteries. The internal resistance of batteries significantly affects the maximum current especially at pulse-shaped loads. Sampling rates of up to 1 MHz allow exact analysis of this.
SoftwareThe option POWER for the DEWESoft makes the cal-culation of for example power flow, losses, harmonics and voltage fluctuations possible. With the help of this functionality the user can, beside the DC measure-ment on batteries, make synchronized analysis of the other drive components like converters and motors. All this together makes a total view on the system “E-drive” and its losses very simple and also has also a very high accuracy.
For each measurement the sensor settings are saved together with the other test parameters in the mea-surement data. This allows a smooth and complete processing of the measured data as well as a compa-rable and re-traceable repetition of tests.
Analyses typical for batteries such as HPPC (Hybrid Pulse Power Characterization) can be done online as well as offline.
Further Functions
Several Power Modules at the Same Time With the DEWESoft power module several power systems can be measured at the same time. For example, batteries: while more cells or reference electrodes
Sound and Vibration Vibration or impacts to the battery measured during the trip.
Exact and high-resolution noise level measurement according to IEC 60651, 60804, 61672. With its user-friendly operator interface DEWESoft brings the sophisticated noise/acoustics analysis to the user.
Temperature MeasurementBatteries have a limited temperature frame in which they work efficiently. You would like to fix some sensors such as thermal elements by yourself, or some hundred temperatures should be recorded? Our systems can record asyn-chronous input channels with different time resolutions SYNCHRONOUSLY (one clock for all channels!).
Dynamic Measurements The behavior of batteries under load cycles that are typical of driving cycles for hybrid applications are the subject of intense testing efforts. Or the evaluation of batteries with load cycles under different temperatures. In this case batteries will be tested with different driving cycles or user-specific profiles. For practical testing, it is necessary to charge the batteries not only with relatively constant cycles but with real load cycles that occur in everyday use, e.g. Starter or electric drive motors for electric and hybrid vehicles. In real tests, a variety of data drops of. The data can be displayed online and offline comfortable in DEWESoft. The minimum standard sampling rate is 2 s. DEWESoft provides a modern, event-oriented data storage for dynamic measurements that allows space-saving and easy management of data.

www.dewetron.com48
CAN-BusBeside a number of sensors, also direct CAN-bus systems can be provided. CAN-bus data can here be used by the DEWESoft as all other measurement channels. The synchronous recording of CAN-bus data from battery manage-ment systems and control units is just one of several possibilities provided.
VideoThe use of synchronous DEWESoft VIDEO functions allows the parallel storing of video data and measurement values and opens a wide range of application possibilities – whenever optical information is needed.
Having a defined load profile thermal analysis for monitoring the heating-up and temperature distribution of the bat-tery can be done with the help of synchronous infrared videos.
In misuse-tests that lead to exploding and out gassing of the battery the current and voltage curves can be recorded time-synchronously with the help of video and audio signals. Thus the moment of damage can be synchronized with the electrical parameters.
Remote Control With the remote control system the instruments can be configured and the data can be evaluated from afar – for example while being in your office.
Open Interface (DCOM)Test bench connection: For test sequences a central administration of the test results is mandatory in order to receive statistical analyses such as scattering of parameters in one test. The data basis offers the possibility to deri-vate a mathematical model from an accumulation of parameters. Batteries can furthermore be simulated mathemati-cally. Via its DCOM-interfaces DEWETRON offers the possibility to link to these test benches flexibly and individually.
The programming interface DCOM offers every user the possibility to arrange his individual integration into test bench systems. Several protocols already generated are available (OPC, Modbus, …) – just contact us and we are pleased to find your individual solution for your applications.
Customers Battery producers for electric vehicles (EV) or hybrid electric vehicles (HEV)
R & D departments for electrical energy storage systems
Research centers and testing laboratories

49
Electro-Mobility
E-M
OB
BT
RA
HR
LDA
DA
SFS
CA
Testing on Test Track, on Test Bench or in the LabApplication Example for E-Mobility
Universal and High Dynamic Systems to do more than one TaskThe shift from the conventional veicle towards the various hybrid technologies and purely electrically driven vehicles has already begun. The range of micro, mild, full and plug-in hybrids already available or poised for launch is a clear indicator that electro mobility is regarded as our biggest short-to-medium-term hope for environmentally-friendly mobility.
In recent years, DEWETRON has positioned itself as a recognised partner for E-Mobile instruments, helping both manufacturers and suppliers adapt to the electric era.
There are three major areas of testing, that are relevant to today‘s OEM manufacturers, tier 1 and 2 suppliers:
Testing complete power train and components on test benches
Testing on roller test stands
Drive tests to find out performance characteristics and reliability
TaskThe development of new vehicle concepts necessitates detailed information about the electrical, thermal and mechanical characteristics of individual components and entire drives. Thanks to sophisticated test equipment, DEWETRON is able to provide these data for all relevant components – from electrical machines and power electron-ics to electric energy storage systems and entire vehicles.
Key criteria related to E-Mobile instruments for this application:
Universal and multi-functional measurement system for each vehicle
Very small form factor and wide voltage input range
DYNAMIC inputs with high bandwidth
Synchronized measurement of all data
High accurate GPS measurement
CAN-bus interfaces for direct reading of vehicle parameters
Video interface for synchronous video recording
Easy to use software
Easy mounting, setup, alignment and calibration
Comparable and reproducible tests
Solution
HardwareDEWETRON’s E-Mobility instruments are investments in the future; they can grow with your requirements and replace several applica-tion-specific solutions on the test track, on test benches, or in the lab.
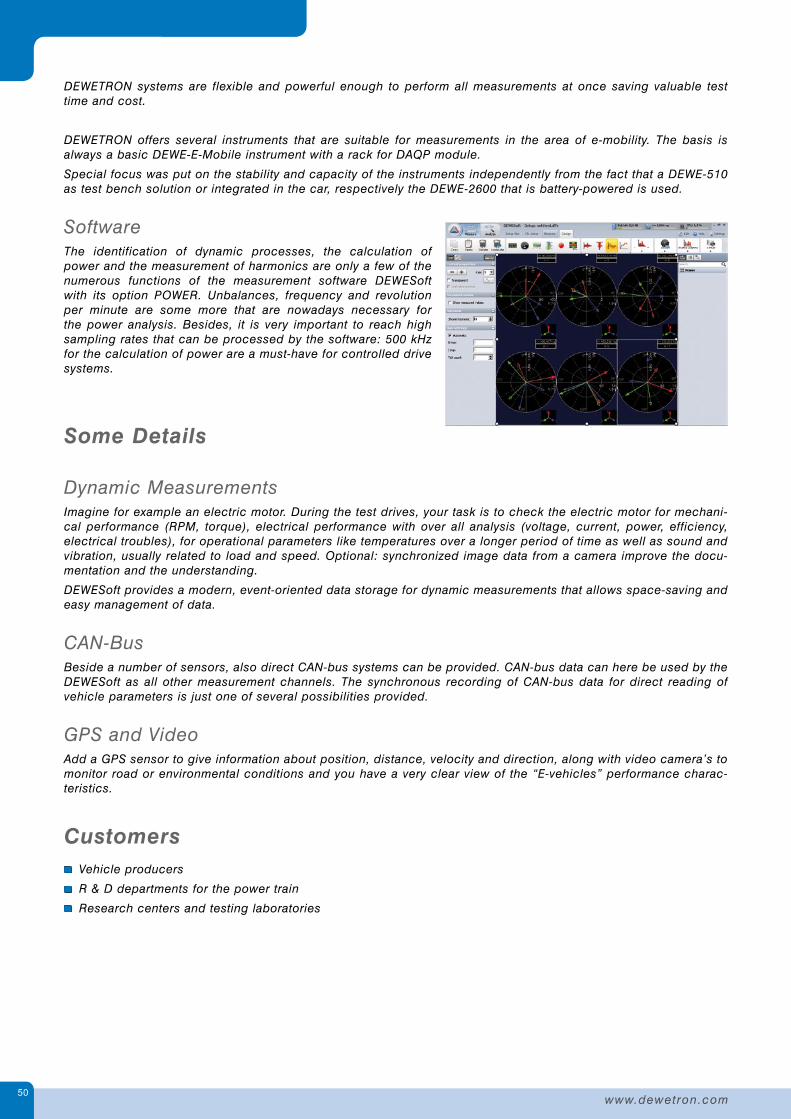
www.dewetron.com50
DEWETRON systems are flexible and powerful enough to perform all measurements at once saving valuable test time and cost.
DEWETRON offers several instruments that are suitable for measurements in the area of e-mobility. The basis is always a basic DEWE-E-Mobile instrument with a rack for DAQP module.
Special focus was put on the stability and capacity of the instruments independently from the fact that a DEWE-510 as test bench solution or integrated in the car, respectively the DEWE-2600 that is battery-powered is used.
SoftwareThe identification of dynamic processes, the calculation of power and the measurement of harmonics are only a few of the numerous functions of the measurement software DEWESoft with its option POWER. Unbalances, frequency and revolution per minute are some more that are nowadays necessary for the power analysis. Besides, it is very important to reach high sampling rates that can be processed by the software: 500 kHz for the calculation of power are a must-have for controlled drive systems.
Some Details
Dynamic Measurements Imagine for example an electric motor. During the test drives, your task is to check the electric motor for mechani-cal performance (RPM, torque), electrical performance with over all analysis (voltage, current, power, efficiency, electrical troubles), for operational parameters like temperatures over a longer period of time as well as sound and vibration, usually related to load and speed. Optional: synchronized image data from a camera improve the docu-mentation and the understanding.
DEWESoft provides a modern, event-oriented data storage for dynamic measurements that allows space-saving and easy management of data.
CAN-BusBeside a number of sensors, also direct CAN-bus systems can be provided. CAN-bus data can here be used by the DEWESoft as all other measurement channels. The synchronous recording of CAN-bus data for direct reading of vehicle parameters is just one of several possibilities provided.
GPS and VideoAdd a GPS sensor to give information about position, distance, velocity and direction, along with video camera’s to monitor road or environmental conditions and you have a very clear view of the “E-vehicles” performance charac-teristics.
Customers Vehicle producers
R & D departments for the power train
Research centers and testing laboratories

51www.dewetron.com
Torsional & Rotational Vibration
Bal
listic
Bal
anci
ngO
rder
Tra
ckin
gM
odal
Ana
lysi
sTo
r/R
ot V
ibra
tion
Torsional and Rotational VibrationRotating machines and engines are sources of rotational and torsional vibration. Rotational vibration is a result of the change in shaft speed during one revolution and torsional vibration is due to angular twist in the shaft or drive train which may cause fatigue.
So you will observe: vibration, force, strain, voltage, current, power, CAN data and rotational- and torsional vibration with only one instrument at the same time.
That’s unique!
Applications
Power train
Paper mill
Combustion engine
Belt drive
Engine test bench
Power plant testing and monitoring
Examination of rotating field
Key Features
Time domain measurement
Angle based view
Additional to all other functions (analog, CAN, GPS, video, ...)
Configurable display
Direct sensor connection
80 MHz time base
High resolution +-0,03rpm +-2mdeg@12000rpm
A u t o m o t i v eE n e r g y & P o w e r A n a l y s i sA e r o s p a c e & D e f e n s eTr a n s p o r t a t i o nG e n e r a l Te s t & M e a s u r e m e n t

www.dewetron.com52
Overview
DEWESoft
DEWE-ORION-card
DAQP ModuleIndustrial PC
PC
OPTIONTorsional- &RotationalVibration
Analoginput
Signalconditioning
Sensorsupply
Counterinput
Digitalinput
Digital output
ext.clockCrankangle encoder
int.clock
Additional SensorsStrain GaugeCurrentVoltageTemperatureElectrical PowerAcceleration
Crankangle encoder
Setup For rotational vibration measurement one rpm sensor is used to determine the rpm deviation and for torsional vibration there is one at each end of the power train. DEWETRON supports a wide range of different sensors e.g. encoder, pickup, RIE-360/720 and many other sensors. All these are connected directly to a counter input of the DEWETRON system. Each counter input provides a power supply, three differential inputs with selectable trigger level compatible with all sensor outputs.
A ready to use template makes it easy to setup the measurement within a few minutes. Digital input filters, a sensor database and a reference curve eliminates sensor errors.
Various output channels are immediately provided for further investigation:
Reference angle [deg]
RPM [rpm]
Rotational angle [deg]
Rotational velocity [deg/s]
Rotational acceleration [w/s]
Torsion angle [deg]
Torsion velocity
The picture on the right shows a typical analysis screen.
Data is shown either in
time domain or angle domain
together with all other measured channels.
By selecting the order analysis module you will get order based results.
Please ask for your costumized solution!
System Requirements
Any DEWETRON system equipped with
DEWE-ORION series AD card
4 available counter inputs
Software option DEWESoft-OPT-TORVIB

53www.dewetron.com
Modal Analysis
Bal
listic
Bal
anci
ngO
rder
Tra
ckin
gM
odal
Ana
lysi
sTo
r/R
ot V
ibra
tion
Modal Analysis
Key Features
SISO, SIMO, MIMO configurations
Spectral ODS
Geometry editor
Mode indicator function MIF
Circle fit analyze tool
Function generator up to 16 channels
FRF from stored time data
Triggered-, free-run measure mode
Roving hammer excitation support
Unv-file export for modal packages (ME-Scope, ...)
Animated FRFs
Up to 1000 channels linked over NET
Modal Analysis is needed in every modern construction. The measurement of system parameters, called modal parameters, are essential to predict the behavior of a structure.
These modal parameters are needed also for mathe-matical models. Parameters like resonant frequency(s), structural damping, and mode shapes are experimen-tally measured and calculated.
DEWETRON provides a hard and software solution which is adapted to your application. Starting up from 8 chan-nels used for maintenance, service and troubleshooting till up to 1000 channels used for complex structures.
The easy-to-use software is suitable for professional and occasional users.
A u t o m o t i v eE n e r g y & P o w e r A n a l y s i sA e r o s p a c e & D e f e n s eTr a n s p o r t a t i o nG e n e r a l Te s t & M e a s u r e m e n t
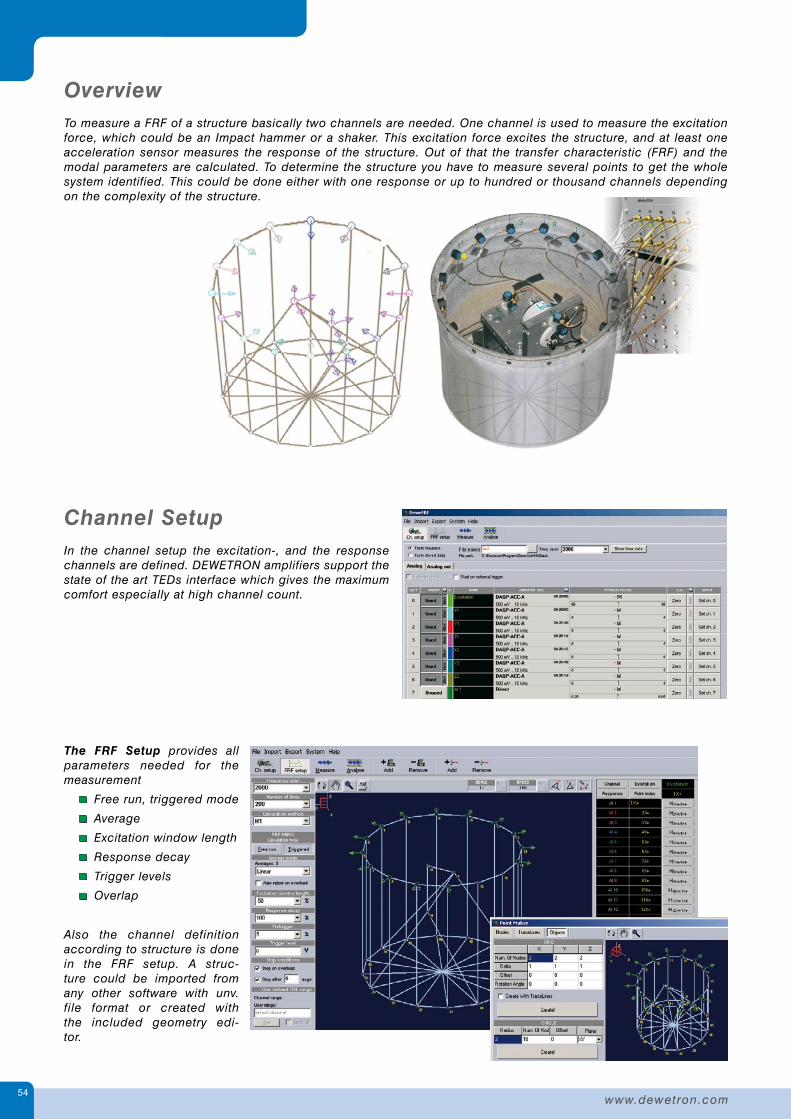
www.dewetron.com54
OverviewTo measure a FRF of a structure basically two channels are needed. One channel is used to measure the excitation force, which could be an Impact hammer or a shaker. This excitation force excites the structure, and at least one acceleration sensor measures the response of the structure. Out of that the transfer characteristic (FRF) and the modal parameters are calculated. To determine the structure you have to measure several points to get the whole system identified. This could be done either with one response or up to hundred or thousand channels depending on the complexity of the structure.
Channel SetupIn the channel setup the excitation-, and the response channels are defined. DEWETRON amplifiers support the state of the art TEDs interface which gives the maximum comfort especially at high channel count.
The FRF Setup provides all parameters needed for the measurement
Free run, triggered mode
Average
Excitation window length
Response decay
Trigger levels
Overlap
Also the channel definition according to structure is done in the FRF setup. A struc-ture could be imported from any other software with unv. file format or created with the included geometry edi-tor.

55www.dewetron.com
Modal Analysis
Bal
listic
Bal
anci
ngO
rder
Tra
ckin
gM
odal
Ana
lysi
sTo
r/R
ot V
ibra
tion
Measurement
The prepared measurement screen will give you all the control possibilities for either running or triggered FRF.
The tool bar provides all important and necessary functions which are needed during the measurement. At Single Input Single Output (SISO) measurement either the excitation or the response could be moved, because sometimes it is easier to move the excitation than the response. DEWETRON supports both types of this measurement.
Analysis In the analyze screen the FRF spectra are shown together with the geometry.
The included analyze tools like
animation of the geometry,
Circle Fit,
MIF
are provided to determine the results immediately.
In case of an error the spectrum could be re-measured immediately. This saves time and money. Display options could be set according to the needs, Phase, Coherence, Re-, Imag, are only a few possibilities which could be set.
Excitation Response
PhaseCoherenceRE-Img
TransferCurve
Channel OverloadIndicator

www.dewetron.com56
FRF ExportFor further investigation and analyses in modal packages like ME-Scope the FRF data, coherence and excitation can be exported to the UFF (Universal File Format) – or simply copied to clipboard – and used in standard applications like Microsoft Excel or Word.
Function Generator For a running FRF the structure is excited with a shaker. Here either one shaker or multiple shakers for big structures are used. The shaker(s) have to be controlled mainly in ampli-tude, phase, waveform and frequency. DEWESoft offers an integrated function generator up to 16 Channels which is fully software controlled.
Various time patterns like
Fixed Burst
Sweep Chirp
Step sweep
are configurable for any application.
Technical Data Function Generator
Up to 16 channels Smooth change for shaker control
16 bit D/A +-1 mV to +-10 V Sine, square, triangle, ramp, noise,..
Watchdog Up to 1 MHz D/A rate SNR>80 dB, THD<0,05%
Frequency resolution 1 mHz with 10 ppm Arbitrary output/file replay
Phase adjustment 0,05° Fix frequency, lin/log SWEEP, CHIRP, BURST Mode or STEP sine
Hardware Requirements
ICP®-Inputs DEWESoft Option FRF
Orion1624 Series AD card DEWESoft Option SRS
DEWETRON Option FG
Shock Response Spectrum (SRS)The shock response spectrum shows the maximum responses of a series of uniformly damped single-degree-of-freedom (SDOF) systems caused by a shock waveform applied on the structure. After setting damp-ing, resolution (12,24,48,96/octave) and primary section the spectra are calculated out of the time domain sig-nals.
The time domain signals are recorded with DEWESoft and exported to FlexPro.A pre-pared SRS-Script with user interface supports a conve-nient straight forward proce-dure for fast results.

57www.dewetron.com
Order Tracking
Bal
listic
Bal
anci
ngO
rder
Tra
ckin
gM
odal
Ana
lysi
sTo
r/R
ot V
ibra
tion
Order TrackingKey Features
Dedicated re-sampling method for sharp order separation
Measurement in time domain to keep all benefits
2D, 3D waterfall in order or frequency domain
Amplitude, phase extraction
Recalculation in post processing
Phase synchronous rpm input with 12.5 ns resolu-tion
EASY TO SETUP
Rotating machines under operational conditions require additional analysis such as order tracking. Compared to normal FFT the spectrum is based to orders instead of frequency (time). The orders describe the fundamental or a multiple of the actual rotation speed [Hz]. With this method you can separate frequency components which are related to engine speed and that are related to structure.
DEWETRON provides a powerful and very easy to use order tracking module for fast and efficient results. The data and the rpm information is recorded simultane-ously in time domain and re-sampled in the order track-ing module. Therefore we can show narrow band FFT, waterfall spectra, and still keep all other convenient functions in time domain.
A u t o m o t i v eE n e r g y & P o w e r A n a l y s i sA e r o s p a c e & D e f e n s eTr a n s p o r t a t i o nG e n e r a l Te s t & M e a s u r e m e n t
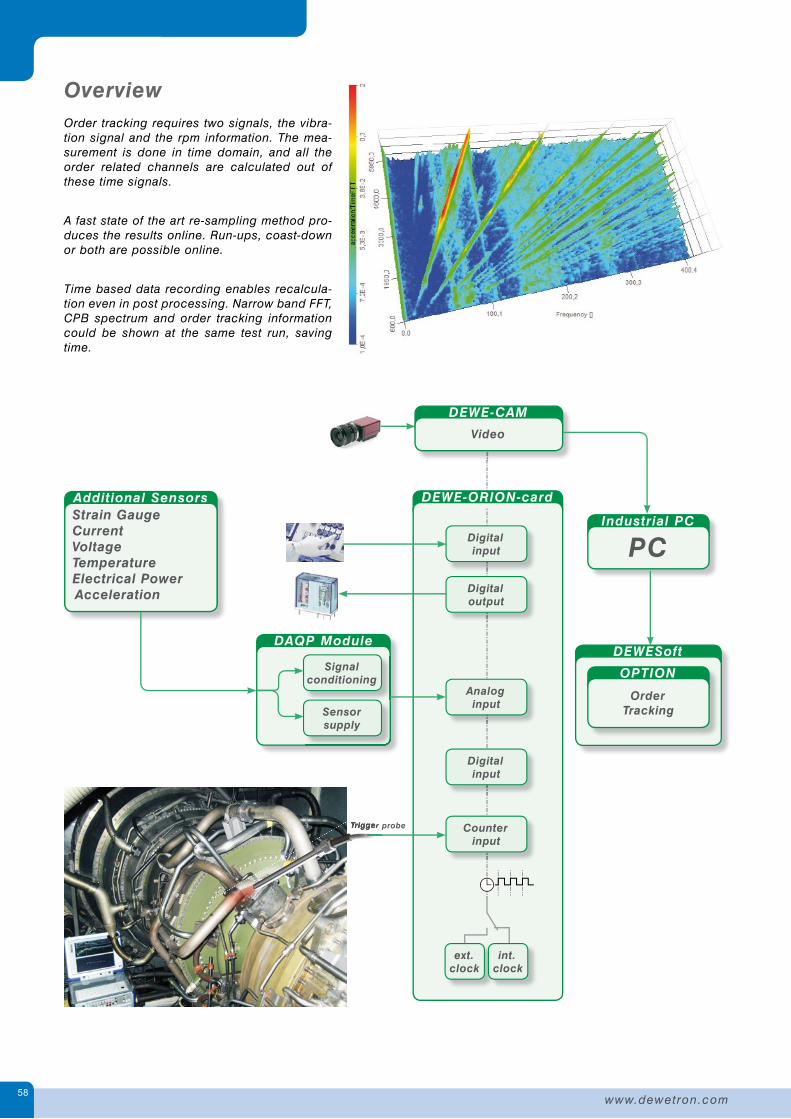
www.dewetron.com58
Overview Order tracking requires two signals, the vibra-tion signal and the rpm information. The mea-surement is done in time domain, and all the order related channels are calculated out of these time signals.
A fast state of the art re-sampling method pro-duces the results online. Run-ups, coast-down or both are possible online.
Time based data recording enables recalcula-tion even in post processing. Narrow band FFT, CPB spectrum and order tracking information could be shown at the same test run, saving time.
DEWESoft
DEWE-ORION-card
DAQP Module
Industrial PC
PC
Additional SensorsStrain GaugeCurrentVoltageTemperatureElectrical PowerAcceleration
OPTION
OrderTracking
DEWE-CAM
Video
Analoginput
Signalconditioning
Sensorsupply
Counterinput
Digitalinput
Digitalinput
Digital output
ext.clock
Trigger probe
int.clock
Trigger probe

59www.dewetron.com
Order Tracking
Bal
listic
Bal
anci
ngO
rder
Tra
ckin
gM
odal
Ana
lysi
sTo
r/R
ot V
ibra
tion
Channel Setup Simply specify the channels to analyze, define the rpm channel and set the parameters for your run. This will only take a few minutes and you are ready for the test. After configuration, you will get the calculated results which could be shown in dedicated instruments for analysis and reporting.
Immediately after configura-tion, you will get the calculated results which could be shown in dedicated instruments for analyze and report.
Amplitude
Phase
RE- Imag- Part
Order resolution up to 1/64 order
Upper- lower- rpm limits
Extract specific orders for further investigation
Analysis In the easy to use analyze screens data could be shown and analyzed in many different ways. So you could draw orders or narrow band FFT in 2D and 3D waterfall diagrams. Either displayed with time history or rpm. Specific orders or phase information could be recorded over time, rpm or any other physical value. All analysis screens could be arranged in a convenient way.
Amplitude or phase is shown over rpm, RE- IM- Part displayed in XY diagram to observe resonant frequencies.

www.dewetron.com60
Orbit view together with Order Tracking? In addition, the order tracking module is also used to show an orbit plot which is used to observe bearings or movements of rotating machines. The Order tracking module extracts specific harmonics in the orbit view and also averages them.
Please ask for your customized solution!
Orbit View Features
Free definable angle position
Averaged or free run
Harmonic extraction
Easy to use
Any DEWETRON system equipped with
DEWE-ORION series AD card
4 available counter inputs
Software option DEWESoft-OPT-OrderTracking
2 ICP® input channels
Example: Paper Mill
Sensors
Acceleration sensor(s)
Trigger probe for rpm

61www.dewetron.com
Balancing
Bal
listic
Bal
anci
ngO
rder
Tra
ckin
gM
odal
Ana
lysi
sTo
r/R
ot V
ibra
tion
Key Features
User interface which guides through all steps
Order tracking based balancing method
Single or dual plane
Multiple balancing for two directions saves time (X, Y)
2D graph for plane view
RPM channel with color indicator (rpm range)
Alarm output if velocity exceeds predefined value
Displays tacho probe time signal to set trigger
Vector polar plots of 1st order of all runs (initial, trail, ...)
Weight splitting
Acceleration, velocity, displacement in recorder
Time domain measurement
BalancingRotating machines and engines produce vibration from many sources, including torsional and rotational vibra-tion. Also unbalanced rotating parts are sources for vibration. Unbalanced masses are distributed by the rotor causing vibration. To balance a system, we have to mea-sure and correct the masses so that the rotor is returned to a balanced condition.
DEWETRON provides an easy to use and straight-forward tool for single and dual plane balancing. This add-on is included as an option in every DEWETRON instrument. One or two acceleration sensors and a tacho probe are needed.
A u t o m o t i v eE n e r g y & P o w e r A n a l y s i sA e r o s p a c e & D e f e n s eTr a n s p o r t a t i o nG e n e r a l Te s t & M e a s u r e m e n t

www.dewetron.com62
DEWESoft
DEWE-ORION-Card
DAQP Module
Industrial PC
PC
OPTION
Balancing
DEWE-CAM
Video
Analoginput
Signalconditioning
Sensorsupply
Counterinput
Digitalinput
Digital output
ext.clock
int.clock
Overview
Trigger probeAcceleration sensor
Acceleration sensor
Trigger probe

63www.dewetron.com
Balancing
Bal
listic
Bal
anci
ngO
rder
Tra
ckin
gM
odal
Ana
lysi
sTo
r/R
ot V
ibra
tion
GeneralDuring construction or assembly of a machine or even through abrasion, a rotor could become unbalanced. This condition causes vibration, noise and fatigue of the material.
DEWETRON provides an in-field-balancing method, which enables balancing of the machine. This saves time and money because balancing can be done in situ and the rotor is balanced in its operating condition, which includes the whole structure of the machine.
Balancing includes in general five steps:
1. Measuring the imbalance
2. Add a trial mass
3. Add the correction mass (balancing)
4. Measuring the balanced system
5. Repeat steps 2 to 4 if needed
Balancing is done either for one plane or two planes. One plane is used for small rotors, where two plane is used for long rotors.
For this measurement one or two acceleration sensors (1 plane 2 plane) and a tacho input are needed. The acceleration signals are recalcu-lated into velocity and used in the order track-ing module together with the rpm channel to extract the first harmonic and phase.
The prepared balancing template in DEWESoft provides step by step guide through the whole balancing procedure.

www.dewetron.com64
Multiple templates linked together!
If a triaxial sensor is used, the balancing can be done on x and y direction of the plane(s) at the same time. Depending where you get the best result (x or y direction) you choose the correction mass. This saves time and guarantees a high quality of balancing.
Please ask for your customized solution!
System Requirements
Any DEWETRON system equipped with
DEWE-ORION series AD card
4 available counter inputs
Software option DEWESoft-OPT-Balancing
2 ICP® input channels
Sensors
2 acceleration sensors
Trigger probe for rpm
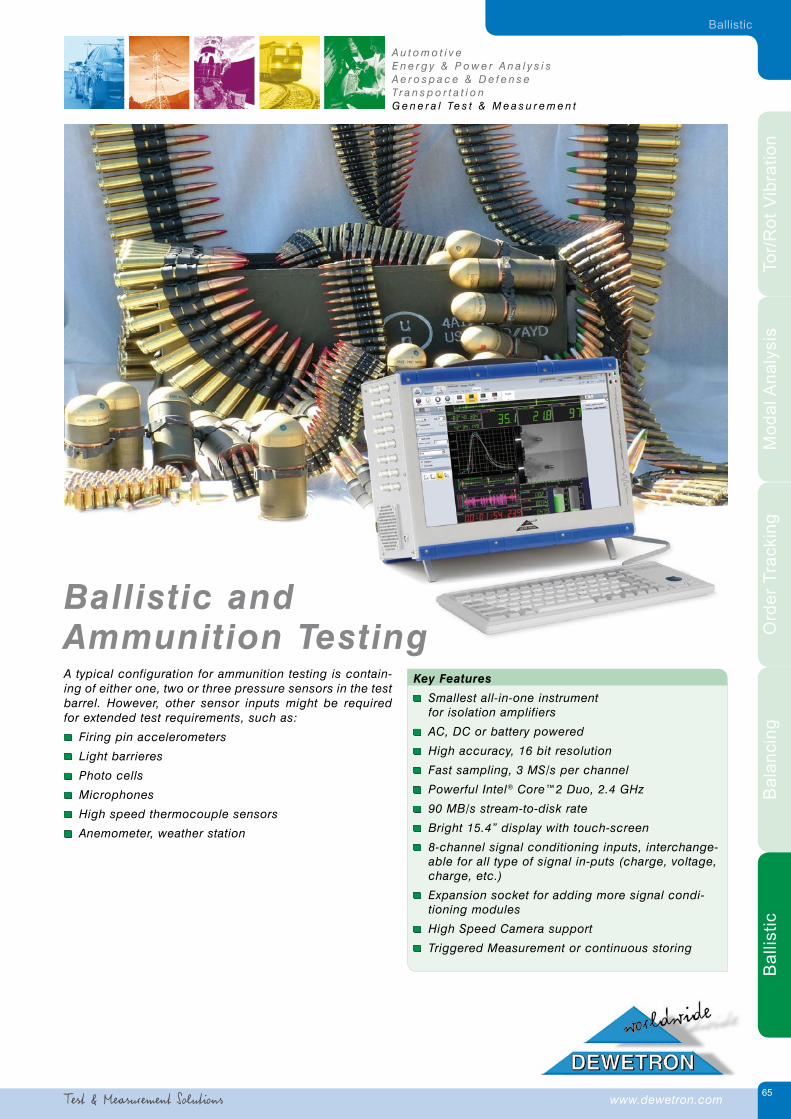
65www.dewetron.com
Ballistic
Bal
listic
Bal
anci
ngO
rder
Tra
ckin
gM
odal
Ana
lysi
sTo
r/R
ot V
ibra
tion
Key Features
Smallest all-in-one instrument for isolation amplifiers
AC, DC or battery powered
High accuracy, 16 bit resolution
Fast sampling, 3 MS/s per channel
Powerful Intel® Core™2 Duo, 2.4 GHz
90 MB/s stream-to-disk rate
Bright 15.4” display with touch-screen
8-channel signal conditioning inputs, interchange-able for all type of signal in-puts (charge, voltage, charge, etc.)
Expansion socket for adding more signal condi-tioning modules
High Speed Camera support
Triggered Measurement or continuous storing
Ballistic and Ammunition TestingA typical configuration for ammunition testing is contain-ing of either one, two or three pressure sensors in the test barrel. However, other sensor inputs might be required for extended test requirements, such as:
Firing pin accelerometers
Light barrieres
Photo cells
Microphones
High speed thermocouple sensors
Anemometer, weather station
A u t o m o t i v eE n e r g y & P o w e r A n a l y s i sA e r o s p a c e & D e f e n s eTr a n s p o r t a t i o nG e n e r a l Te s t & M e a s u r e m e n t

www.dewetron.com66
SetupFor pressure measurement in the barrel minimum one, or up to three Quartz Sensor for Ballistic pressure are used. Dewetron supports a wide range of different sensors and other signal inputs such as firing pin acceleration, target control systems (Light screens), Microphones for rate of fire measurement or high-speed cameras can be easily integrated into the system. The configuration can be adopted to the current needs and above all can be easily con-figured for other measurement in the field or in the laboratory.
Our DEWEPARTNERS are available to discuss with you your exact requirements and will support you to configure the most suitable system configuration with you.
The award winning software DEWESoft™ provides ready to use templates which makes it easy to setup the measure-ment within a few minutes.
Quartz Sensor for Ballistic Pressure MeasurementWeather station
wind speed/directionbarometric pressureambient temperature
High Speed video camera DEWE-3020 with direct sensor input
Cartridge pressure -Case mouth measurement -
Conformal pressure -Port pressure -
PS-BATBattery power supply
15.4“ touch-screen The carrying bag isincluded as standard accessory
Optional battery charger(range: 90 to 260 VAC)
Internal Solid State Disk for maximum reliability

67
CalibrationDEWETRON maintains two top-notch calibration facilities with the same equipment: one at our worldwide headquarters in Austria, and another one at DEWETRON USA in Rhode Island. Our cal lab is based on the Fluke 5500 series calibrator, and we run the METCAL calibration system, which allows us to automate nearly every process.
For customers running their own calibration lab we offer a calibration hardware kit (CAL-KIT) and METCAL
software procedures.
TrainingTraining is offered on demand or at regular intervals. We run training centers at DEWETRON Ges.m.b.H in Graz/Austria and at DEWETRON Inc. located in Rhode Island, USA. At both locations there is a nice training facility and class sizes are limited in order to preserve the quality of the presentation. Engineers and technicians from many well-known companies participated our classes.
The trainings help users to stay up to date on the latest enhancements and updates as well as become more effective utilizing their DEWETRON systems. The train-ings cover effectively using the DEWETRON hardware with DEWESoft software for a wide range of mea-surement applications. Sub-topics include instrument setup, sensor connection as well as digging into math modules, triggers, filtering, shock, vibe, pressure, dis-placement, stress, strain, video, GPS and more.
Of course onsite training is offered, too.
DEWE-ACADEMYIn the DEWE-ACADEMY single or multi-day events are offered. We teach the practical application of our measurement systems, based on the relevant theory. The seminars cover various application areas for engineers with different levels of knowledge - from “newbie” to “expert”. Practical exercises and high interac-tivity with the trainers ensure the lasting learning success and the suitability for daily use. The course language is GERMAN and courses take place in Austria or Germany. For English courses please contact us directly.
ACADEMY

Headquarters:
DEWETRON Ges.m.b.H. • Parkring 4 • 8074 Grambach • AUSTRIA (+43) 316 3070-0 • (+43) 316 3070-90 • [email protected]
DEW
ETRON Offices Worldwide
Sales offices in 25 countries • Service centers in Europe, USA, Middle East a
nd Asi
a
DE
-B0
90
30
3E
• A
ll t
rad
em
ark
s a
re a
ck
no
wle
dg
ed
to
be
th
e p
rop
ert
y o
f th
eir
ow
ne
rs.
Sp
ec
ific
ati
on
su
bje
ct
to c
ha
ng
e w
ith
ou
t n
oti
ce
. ©
DE
WE
TR
ON
Ge
s.m
.b.H
. 0
6/2
01
3
Find your local distributor onwww.dewetron.com