devmountain 2018 outcomes report · 2020-04-01 · software developer ux/ui designer analyst...
TRANSCRIPT

Devmountain2018 Outcomes Report
D E V M O U N T A I NPART OF STRAY ER UNIVERSITY
2D E V M O U N T A I NPART OF STRAY ER UNIVERSITY
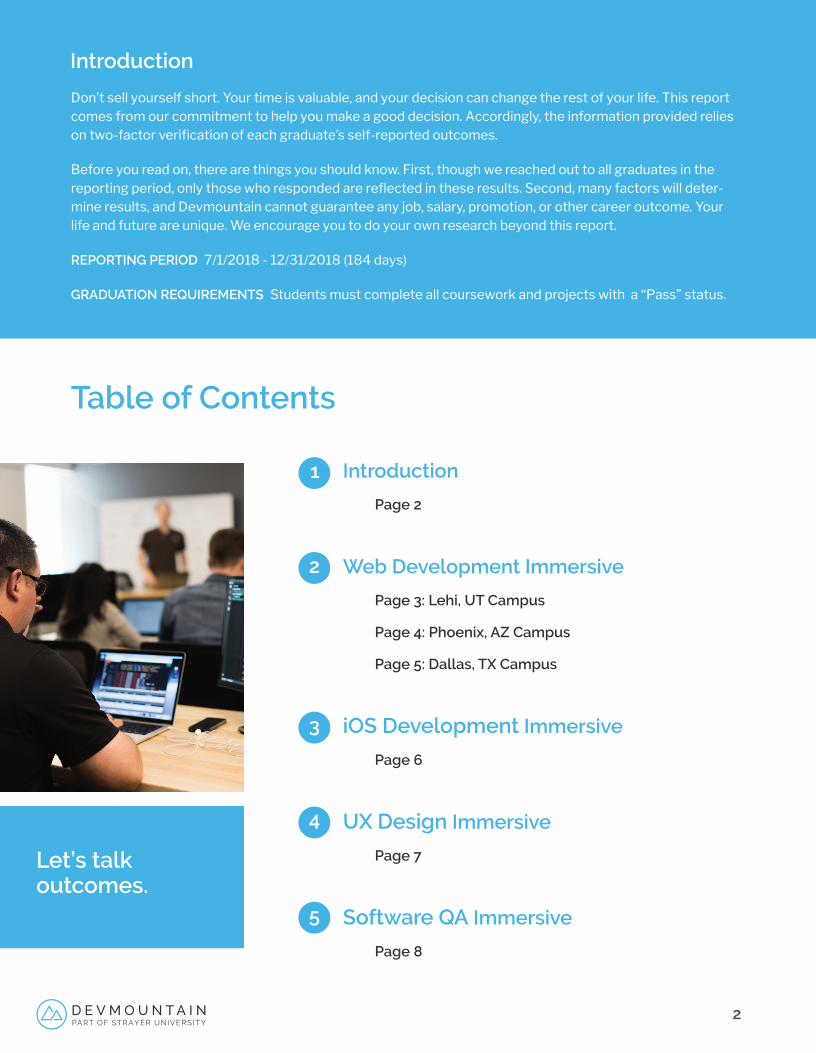
Table of Contents
Introduction
Don’t sell yourself short. Your time is valuable, and your decision can change the rest of your life. This report comes from our commitment to help you make a good decision. Accordingly, the information provided relies on two-factor verification of each graduate’s self-reported outcomes.
Before you read on, there are things you should know. First, though we reached out to all graduates in the reporting period, only those who responded are reflected in these results. Second, many factors will deter-mine results, and Devmountain cannot guarantee any job, salary, promotion, or other career outcome. Your life and future are unique. We encourage you to do your own research beyond this report.
REPORTING PERIOD 7/1/2018 - 12/31/2018 (184 days)
GRADUATION REQUIREMENTS Students must complete all coursework and projects with a “Pass” status.
Introduction
Page 2
Web Development Immersive
Page 3: Lehi, UT Campus
Page 4: Phoenix, AZ Campus
Page 5: Dallas, TX Campus
iOS Development Immersive
Page 6
UX Design Immersive
Page 7
Software QA Immersive
Page 8
1
3
2
4
5
Let’s talk outcomes.

3D E V M O U N T A I NPART OF STRAY ER UNIVERSITY
Lehi, UT Campus Outcomes
Web Development Immersive
90 days
65.0%
16.7%
18.3%
180 days
76.1%
11.4%
12.5%
180+ days
79.2%
9.9%
10.9%
Graduation Rate
Employed In-Field
90 days after graduation
Median Annual Salary
93.9%
65.0%
$52,000
93.9%
$52,000
28.5%
REPORT INFORMATION
123 Graduates Included in Report21 Non-Reporting Graduates Not Included in Report37 (30.08%) Graduate Outcomes Verified by LinkedIn
GRADUATION DATA
Graduation rate for the program
EMPLOYMENT RESULTS FOR GRADUATES
Days after graduation
Total employed in in-field positions
Total employed in other positions
Not employed
SALARY OF GRADUATES
Median annual base salary of graduates
Percentage of job obtainers who reported salaries
23.4%
20.8%
13.0%
6.5%
3.9%
2.6%
2.6%
2.6%
24.7%
MOST FREQUENT JOB TITLES FOR GRADUATES
Developer
Web Developer
Software Engineer
QA/Tester
Software Developer
UX/UI Designer
Analyst
Front-End Engineer
Other
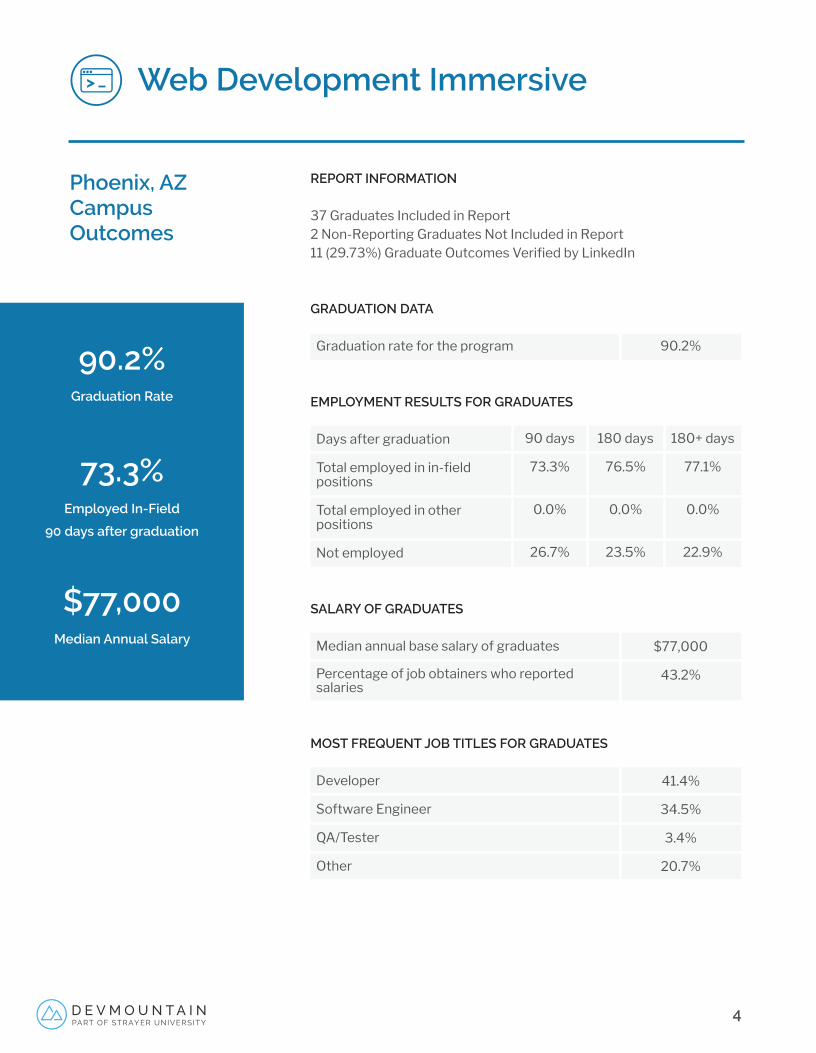
Phoenix, AZ Campus Outcomes
Web Development Immersive
90 days
73.3%
0.0%
26.7%
180 days
76.5%
0.0%
23.5%
180+ days
77.1%
0.0%
22.9%
Graduation Rate
Employed In-Field
90 days after graduation
Median Annual Salary
90.2%
73.3%
$77,000
90.2%
$77,000
43.2%
41.4%
34.5%
3.4%
20.7%
REPORT INFORMATION
37 Graduates Included in Report2 Non-Reporting Graduates Not Included in Report11 (29.73%) Graduate Outcomes Verified by LinkedIn
GRADUATION DATA
Graduation rate for the program
EMPLOYMENT RESULTS FOR GRADUATES
Days after graduation
Total employed in in-field positions
Total employed in other positions
Not employed
SALARY OF GRADUATES
Median annual base salary of graduates
Percentage of job obtainers who reported salaries
MOST FREQUENT JOB TITLES FOR GRADUATES
Developer
Software Engineer
QA/Tester
Other
4D E V M O U N T A I NPART OF STRAY ER UNIVERSITY

Dallas, TX Campus Outcomes
Web Development Immersive
90 days
72.2%
5.6%
22.2%
180 days
76.1%
6.5%
17.4%
180+ days
75.0%
8.3%
16.7%
Graduation Rate
Employed In-Field
90 days after graduation
Median Annual Salary
75.0%
72.2%
$55,000
75.0%
$55,000
38.2%
30.6%
30.6%
5.6%
5.6%
22.2%
REPORT INFORMATION
55 Graduates Included in Report6 Non-Reporting Graduates Not Included in Report14 (25.5%) Graduate Outcomes Verified by LinkedIn
GRADUATION DATA
Graduation rate for the program
EMPLOYMENT RESULTS FOR GRADUATES
Days after graduation
Total employed in in-field positions
Total employed in other positions
Not employed
SALARY OF GRADUATES
Median annual base salary of graduates
Percentage of job obtainers who reported salaries
MOST FREQUENT JOB TITLES FOR GRADUATES
Developer
Software Engineer
Software Developer
Front-End Engineer
Other
5D E V M O U N T A I NPART OF STRAY ER UNIVERSITY
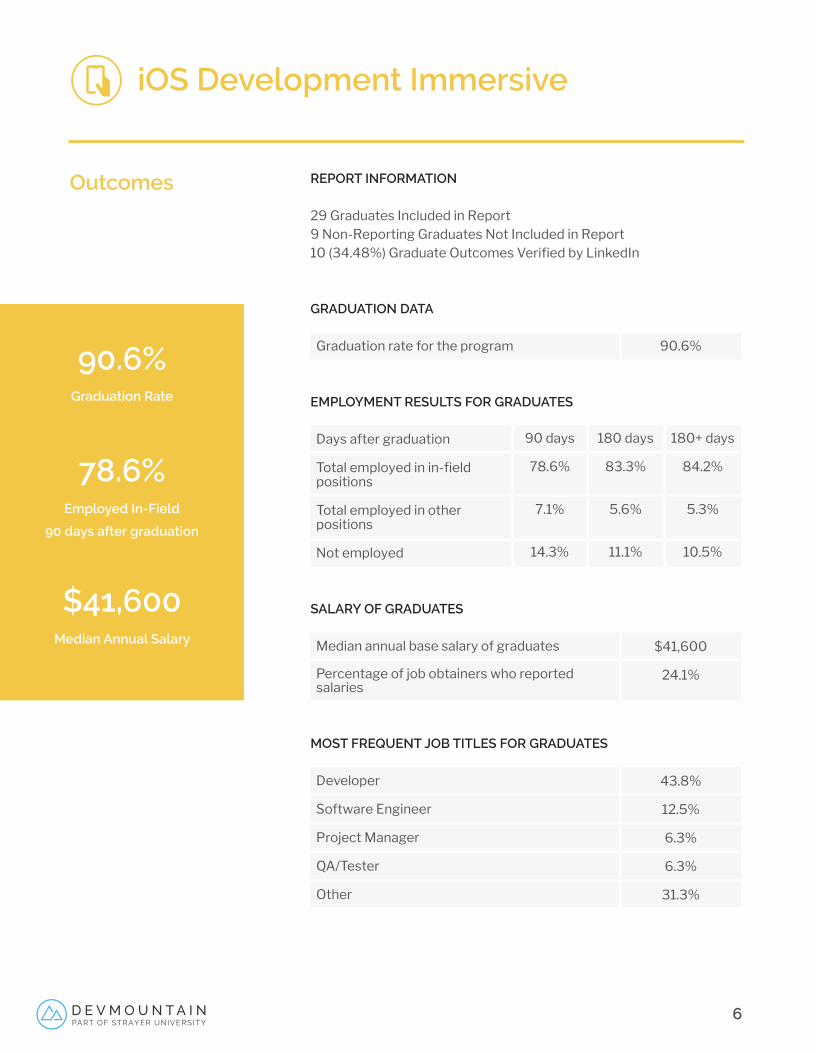
Outcomes
iOS Development Immersive
90 days
78.6%
7.1%
14.3%
180 days
83.3%
5.6%
11.1%
180+ days
84.2%
5.3%
10.5%
Graduation Rate
Employed In-Field
90 days after graduation
Median Annual Salary
90.6%
78.6%
$41,600
90.6%
$41,600
24.1%
43.8%
12.5%
6.3%
6.3%
31.3%
REPORT INFORMATION
29 Graduates Included in Report9 Non-Reporting Graduates Not Included in Report10 (34.48%) Graduate Outcomes Verified by LinkedIn
GRADUATION DATA
Graduation rate for the program
EMPLOYMENT RESULTS FOR GRADUATES
Days after graduation
Total employed in in-field positions
Total employed in other positions
Not employed
SALARY OF GRADUATES
Median annual base salary of graduates
Percentage of job obtainers who reported salaries
MOST FREQUENT JOB TITLES FOR GRADUATES
Developer
Software Engineer
Project Manager
QA/Tester
Other
6D E V M O U N T A I NPART OF STRAY ER UNIVERSITY

Graduation Rate
Employed In-Field
90 days after graduation
Median Annual Salary
96.8%
89.5%
$57,500
Outcomes
UX Design Immersive
90 days
89.5%
5.3%
5.3%
180 days
91.3%
4.3%
4.3%
180+ days
91.7%
4.2%
4.2%
REPORT INFORMATION
30 Graduates Included in Report6 Non-Reporting Graduates Not Included in Report13 (43.3%) Graduate Outcomes Verified by LinkedIn
GRADUATION DATA
Graduation rate for the program
EMPLOYMENT RESULTS FOR GRADUATES
Days after graduation
Total employed in in-field positions
Total employed in other positions
Not employed
SALARY OF GRADUATES
Median annual base salary of graduates
Percentage of job obtainers who reported salaries
MOST FREQUENT JOB TITLES FOR GRADUATES
UX/UI Designer
Developer
Project Manager
UX Researcher
Other
96.8%
$57,500
33.3%
73.9%
8.7%
4.3%
4.3%
8.7%
7D E V M O U N T A I NPART OF STRAY ER UNIVERSITY

Outcomes
Software QA Immersive
90 days
50.0%
25.0%
25.0%
180 days
73.7%
10.5%
15.8%
180+ days
70.0%
15.0%
15.0%
Graduation Rate
Employed In-Field
90 days after graduation
Median Annual Salary
96.2%
50.0%
$50,000
96.2%
$50,000
28.0%
93.3%
6.7%
REPORT INFORMATION
25 Graduates Included in Report5 Non-Reporting Graduates Not Included in Report8 (32.0%) Graduate Outcomes Verified by LinkedIn
GRADUATION DATA
Graduation rate for the program
EMPLOYMENT RESULTS FOR GRADUATES
Days after graduation
Total employed in in-field positions
Total employed in other positions
Not employed
SALARY OF GRADUATES
Median annual base salary of graduates
Percentage of job obtainers who reported salaries
MOST FREQUENT JOB TITLES FOR GRADUATES
QA/Tester
Other
8D E V M O U N T A I NPART OF STRAY ER UNIVERSITY

© S
tray
er U
nive
rsity
LLC
, 202
0
Ready for the Next Step?Apply for a Devmountain Course
D E V M O U N T A I NPART OF STRAY ER UNIVERSITY
Call: 844.433.8686Text: 385.217.2304
Apply Now
Our Admissions team is available
to answer your questions.