device and algorithm for vehicle detection and traffic
TRANSCRIPT

Electrical, Control and Communication Engineering ISSN 2255-9159 (online) ISSN 2255-9140 (print) 2021, vol. 17, no. 1, pp. 83–92 https://doi.org/10.2478/ecce-2021-0010 https://content.sciendo.com
83
©2021 Mikhail Gorobetz, Andrey Potapov, Aleksandr Korneyev, Ivars Alps. This is an open access article licensed under the Creative Commons Attribution License (http://creativecommons.org/licenses/by/4.0), in the manner agreed with Sciendo.
Device and Algorithm for Vehicle Detection and Traffic Intensity Analysis
Mikhail Gorobetz (Professor, Riga Technical University, Riga, Latvia), Andrey Potapov (Researcher, Riga Technical University, Riga, Latvia),
Aleksandr Korneyev* (Researcher, Riga Technical University, Riga, Latvia), Ivars Alps (Researcher, Riga Technical University, Riga, Latvia)
Abstract – To effectively manage the traffic flow in order to reduce traffic congestion, it is necessary to know the volumes and quantitative indicators of this flow. Various detection methods are known for detecting a vehicle in a lane, which, in turn, have their own advantages and disadvantages. To detect vehicles and analyse traffic intensity, the authors use a pulse coherent radar (PCR) sensor module. Testing of various modes of operation of the radar sensor was carried out to select the optimal mode for detecting vehicles. The paper describes a method for fixing vehicles of different sizes, filtering and separating the vehicle from the traffic flow. The developed vehicle detection device works in conjunction with signal traffic lights, through which traffic control takes place. The signal traffic lights, which have their own sensors and control units, communicate with each other via a radio channel; there is no need for cable laying. The system is designed to work on road maintenance sites. The paper describes the experimental data when testing on a separate section of the road. The experiment showed the advantage of traffic lights (cars passed the regulated traffic light faster) from the point of view of calculating the traffic flow over the normal traffic light operation. Reducing downtime in traffic jams, in turn, has a beneficial effect on the environmental situation, since at the moment internal combustion engines prevail in vehicles.
Keywords – Sensor systems and applications; Traffic control;
Vehicle detection; Vehicle safety.
I. INTRODUCTION The number of transport units in the large cities of the world
is growing every year; the control and management of traffic flow is also becoming more and more important. The significant increase in vehicles has created serious problems such as delays, traffic jams, higher fuel overconsumption, increase of CO2 emissions, car accidents, and, finally, the decreasing of quality of life in modern society. For example, according to a report by the Texas Transportation Institute, in the United States, car drivers waste more than 3 billion gallons of fuel per year, having a total nationwide price tag of $160 billion [1].
Everything shows that transportation problems will worsen in the future and many scientists all around the world keep working to improve the safety and efficiency of transportation. One of the solutions is to create transport system management * Corresponding author. E-mail: [email protected]
systems. In researching and developing such systems, scientists emphasise the importance of data on the composition of traffic flows. These data are obtained using traffic flow detectors. The operating principles and classification of transport detectors were described long time ago [2]–[5]. The principle of operation of detectors has been basically unchanged for several decades. They have a simple construction, sufficiently reliable and in some modernized way they are still used to obtain data of traffic flows. Sensors can be classified into two categories based on their location: intrusive and non-intrusive [6]. Intrusive sensors, such as pneumatic road tube, inductive loop detector, magnetic or piezoelectric sensors are installed on pavement surfaces. They have high accuracy, but also have a high installation and maintenance costs. This group of sensors is the most used in traffic control systems. Non-intrusive sensors, such as video cameras, radar sensors, infrared, ultrasonic, and acoustic array sensors are installed at different places on the roads. They are more advanced than intrusive sensors and could detect much more parameters describing the vehicle and the actual situation on the road. However, they are also expensive and may be highly affected by climate conditions such as snow, rain, and fog [7].
One of the most effective solution to control transport systems is the development of Intelligent Transport Systems (ITS). Advanced detectors and technologies, such as video detection systems (VDSs), are used. A VDS classifies vehicles by their length and reports vehicle presence, volume, lane occupancy, and speed for each class and lane. A VDS typically consists of one or more cameras, a microprocessor-based computer for digitizing and processing the imagery, and software for interpreting the images and converting them into traffic flow data [8].
Various sensors are used in the transport industry; radar sensors and radar technology have a wide variety of applications [9]. A typical example is police radar traps. However, also more complex applications such as traffic assessment and statistics for intersection management can be achieved using radar-based vehicle detection. Radar sensors also have enforcement applications to detect when drivers run

Electrical, Control and Communication Engineering
________________________________________________________________________________________2021, vol. 17, no. 1
84
red lights, perform unauthorized turning manoeuvres etc. Besides, radar sensors achieve high ranges and measure the following parameters: direction of movement, speed, distance, and angular position of objects or persons. These data provide relevant traffic information that contributes to greater safety and efficiency in road traffic.
The application of radar sensors is also studied to develop a low-cost street lighting smart system [10]. This research is devoted to intelligent lighting systems, especially street lighting systems.
Given the problem to be solved, this paper investigates the suitability of radar sensors for vehicle detection in traffic intensity analysis system. The developed system described in the paper is called the traffic flow detection and analysis system (TFDA) as a working name.
II. PROBLEM FORMULATION The goal of the research is to develop the TFDA device and
the algorithm for vehicle detection and traffic intensity analysis system using 60 GHz pulsed coherent radar (PCR) sensor module.
The main objectives of the research are: - to investigate and test different working modes of the
radar sensor and to choose the most suitable one for goal achievement;
- to develop the control algorithm for the system; - to develop the microcontroller device for traffic control
system; - to implement the algorithm and test the developed
prototype to prove its functionality for vehicle detection and traffic intensity analysis system.
III. MATHEMATICAL MODEL OF DEVICE The mathematical model is represented in an object-oriented
form as a set of classes, subclasses, its properties and methods – functions that have algorithmic structure.
The TFDA system consists of an ordered set of several TFDA devices, which is labelled as TRI:
( )1 , , .hTFDA TRI TRI= … Each TFDA system device ∀𝑇𝑇𝑇𝑇𝑇𝑇 ∈ 𝑇𝑇𝑇𝑇𝑇𝑇𝑇𝑇𝑇𝑇 has the
following subsystems: • { },SENS PS CAM= – a sensing system, where:
o PS – a traffic flow sensor; o CAM – a video camera.
• { }, COM RF USB= – a communication system, where: o RF – a radio module, i.e., the main
communication channel; o USB – connection for device configuration.
• Signal lamp control system { }, , r y gCTRL C C C= , where: o Cr – a red light control element (transistor); o Cy – a yellow light control element (transistor); o Cg – a green light control element (transistor).
• { , , , , ,COMP FI FS FRX FCC FP=, , , , } FSTAT FAVG FCHK FCTRL FTX – a calculation
and coordination system with 11 functional elements, where: o FI – an element of input and configuration
function; o FS – an element of the vehicle sensor reading
function; o FRX – an element of data reading function from a
radio communication channel; o FCC – a machine counting function element; o FP – a time pause measurement function element; o FSTAT – an element of the statistical data
collection function; o FTAVG – an element of the medium stage travel
time calculation function; o FCHK – an element of the switching safety test
function; o FMODE – an operating mode selection function
element; o FCTRL – a traffic light lamp control function
element; o FTX – an element of data transmission function
with a radio communication channel. According to the requirements specification, the TFDA
device system can operate in three operating modes. Operating modes differ not only in the operation algorithm, but also in the availability of functions that provide additional functional protection.
1. Initialization / configuration mode – MODE = 0, only the FI and FMODE functions are available for execution.
2. Emergency mode – MODE = 10, when the device works only after time, just like the existing traffic light system, only the following functions FCHK, FMODE, FCTRL and functions FRX and FTX work only with type 1 signals.
3. Full transport flow detection and analysis operating mode (TFDA mode) – MODE = 1, when transport flow analysis and control take place, all functions are available for execution.
IV. TESTING PCR SENSOR WORKING MODES The chosen PCR sensor module XM112 (Fig. 1) could be
used for accurate distance ranging, movement and material detection:
- performs high precision distance measurements with high update frequency;
- measures absolute range up to 2 m with an absolute accuracy in mm;
- measures relative accuracy in μm; - recognises movement for several objects; - supports continuous and single sweep measurement
mode. PCR sensor module could be used with manufacturers
offered breakout board XB112 un the Acconeer Python

Electrical, Control and Communication Engineering
________________________________________________________________________________________2021, vol. 17, no. 1
85
exploration package for fast sensor configuration and testing the parameters to be set.
Fig. 1. XM112 PCR sensor module.
The external microcontroller MC is connected to PCR using the UART protocol. UART settings – a default baud rate is 115 200 (with byte size 8-bit), but the maximum baud rate is 3 Mbps. The supported baud rates can be calculated as 3 000 000/N, where N is an integer. Multi byteintegers are coded in little endian format.
The main registers are: - Read request (Packet Type 0xF8, register address 1
byte); - Read response (Packet Type 0xF6, register adderss 1
byte); - Write request (Packet Type 0xF9, register address 1
byte, register value 4 byte); - Write response (Packet Type 0xF5, register address 1
byte, register value 4 byte); - Bufer read request (Packet Type 0xFA, bufer index
0xE8, bufer offset 2 bytes); - Bufer read response (Packet Type 0xF7, bufer index
0xE8). All registers have start marker 0xCD, playload lenght
2 bytes and end marker 0xCC. To work with the PCR module, the authors chose buffer streaming payload mode. The streaming mode is primarily intended for communication with the Acconeer Python exploration package.
a)
b)
Fig. 2. a) Envelope mode; b) Power Bin mode.
The result info and the streaming buffer are the outputs from the Acconeer Service APIs encoded in little endian format. The result info contains a sequent number encoded as a 32-bit integer. More data may be added in future versions of the module software. The format of the streaming buffer depends on the service (Power Bin, Envelope, IQ etc.). After the first sensor testing using the Acconeer Python exploration package, two PCR sensor module main modes are highlighted. According to the authors, they can be successfully used to measure transport flow parameters. These modes are Envelope (Fig. 2a) and Power Bin (Fig. 2b).
Both modes can use registers which are writable to set configuration. Registers which are read-only contain metadata which are updated either after creating or when data are produced. It is recommended to read the service and detector user guides for more information on configuration and metadata:
• Start range (SR) in mm of the measurement. It is selected so that the measuring range of the sensor coincides with the edge of the road (Fig. 3 dot b).
• Length of the range (RL) in mm. It is selected so that the measuring range of the sensor coincides with the summary width of the road (Fig. 3, distance between dots b and c), or the width of the road lane, in which the recording of traffic flow parameters is required.
• Repetition mode (RM) for the measurement, where RM1 – the sensor controls the update rate with high precision according to the value in the update rate register, but RM2 – the update rate is software limited according to the value in the update rate register. A value of RM = 0 means no limit of the update rate.
• The measurement update rate (MUR) in MHz (i.e., step in 1/1000 Hz).
• Receiver gain (RG), where the lowest level RGmin = 0, but the maximum level RGmax = 1000.
• Radar sensor power mode (PM): Depth, m
Am
plitu
de, c
u
Am
plitu
de, c
u
Depth, m

Electrical, Control and Communication Engineering
________________________________________________________________________________________2021, vol. 17, no. 1
86
PM1 – the sensor is turned off between sweeps, consumes least power, supports lower frequencies;
PM2 – parts of the sensor are turned off between sweeps;
PM3 – parts of the sensor are turned off between sweeps;
PM4 – the sensor is active, consumes most power, supports higher frequencies;
PM5 – the sensor is still powered but the internal oscillator is turned off and the application needs to clock the sensor by toggling a GPIO a pre-defined number of times to enter and exit this mode. Only supported for the sparse service on XM122 currently.
• Tx disable (TXD) register used to measure RX noise floor and to support TX off spectrum regulation measurements.
• Decrease Tx emission (DTX) used for spectrum regulation measurements.
• Profile selection (PS) where each profile consists of a few settings for the sensor that configures the RX and TX paths:
PS1 – profile 1 maximises on the depth resolution;
PS2 to PS4 – a sliding scale between profile 1 and 5.
PS5 – profile 5 maximises on radar loop gain with a sliding scale in between.
• Downsampling factor (DSF) to be used in the sensor. • Average sample (AS) is the number of hardware
accelerated average samples for each data point. • Noise level normalization (NLN) scales the signal
according to the sensor noise level, default enabled. • Maximise signal attenuation (MSA) to avoid
saturation in direct leakage. • Start (S) of the sweep in mm. • Length (L) of the sweep in mm. • Stitch count (SC) – sweep has the number of stitches. • Step length (SL) – distance in um between adjacent
data points. • Data saturated (DS) – indication of sensor data being
saturated; it can cause result instability. • Missed data (MS) – true if data were lost. Try lowering
the update rate or read the data more. The Envelope and Power Bin operating modes have two
different setup registers according to the nature of these modes. Envelope mode has Run Factor (RF) register; the most recent sweep is weighed against previous sweeps. RFmin is 0, and RFmax is 1000 where RFmin means that no history is weighed, i.e., filtering is effectively disabled, as well as data length (DL) register, which is length of the envelope data.
Fig. 3. Sensor installation scheme on the road section.
At the same time, Power Bin mode has register such as number of requested power bins (NRB) and bin count (BC) register.
Additional experiments show that the advantages of the Power Bin mode are associated with a simpler data processing algorithm from the sensor. This mode automatically divides the entire sensor measuring range RL into the pre-set number of cuts, accordingly, which allows further measuring only in these specific ranges and automatically determining, for example, the lane, in which the vehicle has been fixed.
The traffic light control modules form a network, which is organised through radio communication. To increase the range between the modules, a radio communication repeater can be used, which can be installed on the UAV with an energy-efficient algorithm [11]. The device is powered by a rechargeable battery. For reliable operation of the module, a battery analysis is performed [12], [13]. Since the traffic signal unit and the sensor module require different supply voltages, an inverter can be used [14], [15]. To implement the innovative TFDA system, it is worth adhering to certain rules [16].
V. EXPERIMENTAL TESTING OF SENSOR PARAMETERS The accuracy of the sensor operation is determined by the
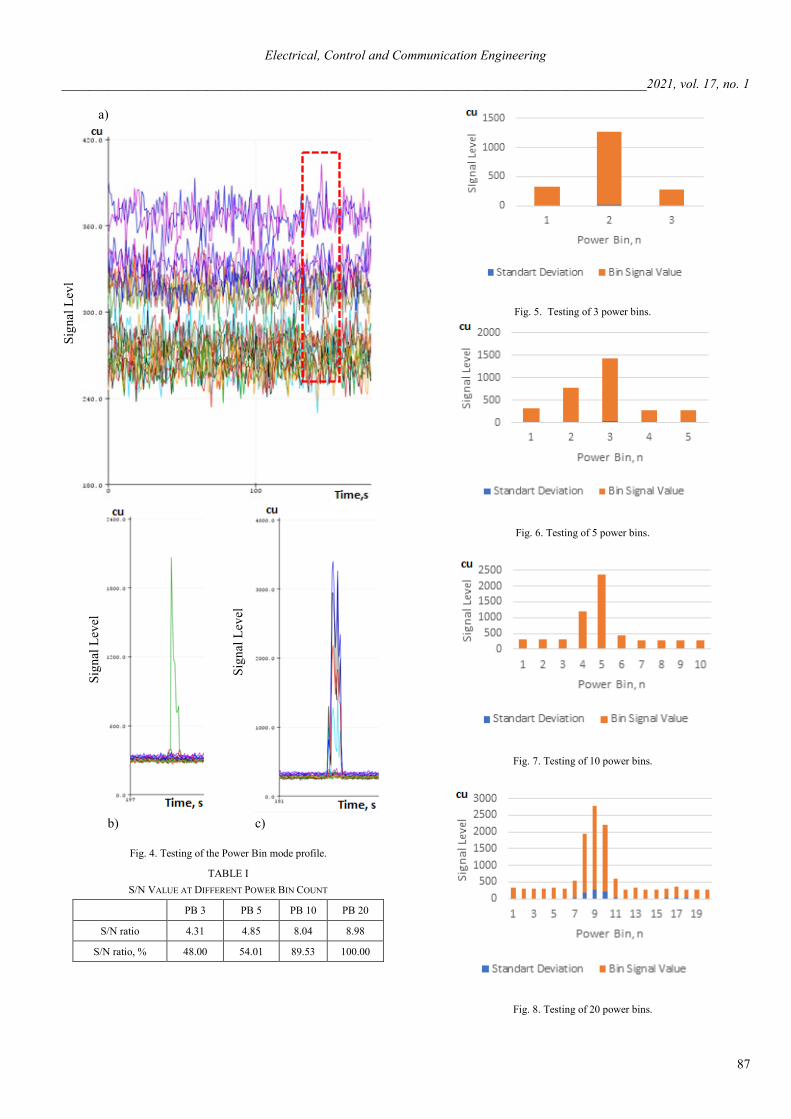
selected operation profile PS. There are three most pronounced profiles PS1 (Fig. 4a), PS3 (Fig. 4b) and PS5 (Fig. 4c). PS1 recommended for measuring strong reflectors or distance measurements in the first couple of decimetres close to sensor.
It was confirmed that profile PS5 provides a stronger signal over longer distances, but profile PS1 in the real experiment proved to be completely unusable for the purpose of the work – for the identification of vehicles.
Next, an experiment to find out the bin count (BC) parameter was performed. Several BC values were tested (BC = 3; BC = 5; BC = 10 and BC = 20). The results are summarised in Table I. The best S/N value was shown at a higher PB number.
RSM
SR RL
road
a b c
Electrical, Control and Communication Engineering
________________________________________________________________________________________2021, vol. 17, no. 1
87
a)
b) c)
Fig. 4. Testing of the Power Bin mode profile.
TABLE I S/N VALUE AT DIFFERENT POWER BIN COUNT
PB 3 PB 5 PB 10 PB 20
S/N ratio 4.31 4.85 8.04 8.98
S/N ratio, % 48.00 54.01 89.53 100.00
Fig. 5. Testing of 3 power bins.
Fig. 6. Testing of 5 power bins.
Fig. 7. Testing of 10 power bins.
Fig. 8. Testing of 20 power bins.
Sign
al L
evl
Sign
al L
evel
Sign
al L
evel

Electrical, Control and Communication Engineering
________________________________________________________________________________________2021, vol. 17, no. 1
88
Figures 5–8 show the relationship between the number of bins and the signal level.
Receiver gain (RG) test was made. Different RG values were chosen (RG = 500; RG = 700; RG = 800; RG = 900) and testing was performed. A signal was recorded in a series of experiments on one passing machine at the same distance and at different speeds. The best result was achieved when RG = 700 as shown in Table II.
TABLE II COMPARISON OF SIGNAL VALUES WITH DIFFERENT G
RG 500 RG 700 RG 800 RG 900
Average 800.84 921.66 774.74 810.84
% 86.89 100.00 84.06 87.98
These values will be used in future experiments. Relationship
between different receiver gain value and signal level is shown in Fig. 9.
Fig. 9. Receiver gain (RG) test.
VI. DEVELOPING THE CONTROL ALGORITHM FOR THE SYSTEM The basic and most important function of the system is the
correct and precise detection of vehicles. The algorithm for reading data from a radar sensor is shown in Fig. 10. This algorithm determines that after microcontroller receives the data on the serial port, it checks if the first byte of the message coincides with 0xCD (which means that data come from the sensor in the Power Bins mode).
Then sensor data in each Bin n are read, the current noise level in each Bin is fixed, and then, if the signal exceeds a certain level, the presence of a vehicle in that Bin n is fixed.
The number of fixed vehicles is increased by 1. The set timeout is waiting and the rest of the data from the serial port are deleted. The function is called in the loop repeating continuously.
Parameters of algorithm are as follows: − k1 = 1 + rate1 – a signal rise value above the noise
assumes that there is a vehicle; − k2 = 1 + rate2 – a signal fall value above the noise
assumes that there is no vehicle anymore; − delay – time in milliseconds, ensuring that a vehicle
passed and the signal fall is not caused by signal oscillations.
VII. DEVELOPING THE MICROCONTROLLER DEVICE FOR TRAFFIC CONTROL SYSTEM
The modular structure of the TFDA device is presented in Fig. 11, where:
− PS – external power supply with Uout 5 V and 1.8 V; − MC – microcontroller; − LLC – logic level converter; − ATSME70 – ARM Cortex-M7, 32-bit microprocessor; − A111 – 60 GHz pulsed coherent radar.

Electrical, Control and Communication Engineering
________________________________________________________________________________________2021, vol. 17, no. 1
89
Fig. 10. Flowchart of vehicle detection algorithm.
Fig. 11. PCR sensor module-based car counting system block diagram.
Serial data available?
While serial available, serial read
first byte? = 0xCD
Read sensor data by all bins n=[1..bins]
bin[n]< noise[n]
noise[n] = bin[n]
Fix = 1
bin[n]<noise[n]· k2 AND Fix = 1
Fix = cur_time_millis
(millis()-Fix) > delay
Fix = 0
Serial clear bin[n]> noise[n]·k1
AND Fix = 0
True
True
False
True
False
True
False
True
False
False
True
False
START sens. function
END function
UART
LLC MC
PS
UART
1.8V
5V_
NRST

Electrical, Control and Communication Engineering
________________________________________________________________________________________2021, vol. 17, no. 1
90
VIII. TESTING RESULTS
A. Traffic Flow Counting and Control Device TFDA Testing in Different Situations
Task for the test: to check the device workability in different weather conditions and hours of the day.
Extract from the test report: In the laboratory conditions, various real outside environment conditions were simulated and as a result it was established that the performance of the device did not depend on the light intensity, it worked well in intense light and in complete darkness.
It was not possible to check the performance of the equipment in winter conditions and low outside temperatures. According to the specification of the components, it is able to operate at temperatures down to −30 °C. Besides, road repairs usually do not take place in winter season. The performance of the TFDA device was tested and proven during rain, fog and under direct sunlight in summertime. The weather conditions did not affect the performance of the TFDA device. IP55 standard for dust and humidity resistance must be ensured for the used device.
B. Testing the Device in the TFDA Mode in Real Conditions Task for the test: to check the interaction of all functions of
the TFDA device and the ability to manage the flow of vehicles. Test description: The TFDA device was integrated by
replacing the existing control device in existing pair of traffic lights. With the permits of Ltd. SALDUS CEĻINIEKS a pair of traffic lights with integrated TFDA device was located on the road V1197, where road maintenance works were taking place.
Extract from the test report: On 29 September 2020, the traffic lights with integrated devices was installed on the lightly loaded gravel road V1197 Aizpute–Ilmājas. The length of the controlled section was 600 m. The road section has a hilly terrain with bends and about 200 m of forest along the road. Testing time was 6 hours.
The following parameters were set: • standby safety time 72 s (calculated for distance of
600 m and speed of 30 km/h); • max pause of the green traffic light signal between
vehicles – 15 s; • max duration of green light signal – 2 minutes; • duration of green light signal in emergency mode –
30 s.
First of all, the operation of traffic lights No. 1 and No. 2 with integrated TFDA device was tested by switching one after another. Turning on both traffic lights presented a red signal before the traffic lights were synchronized. This was necessary to prevent accidents. After synchronization the traffic light operation modes were tested several times. TFDA device showed the ability to successfully manage the flow of vehicles through the road section to be repaired (see Fig. 12 a, b, c).
a)
b)
c)
Fig. 12. Traffic light operation testing in the real environment.
C. TFDA Testing in Case of Emergency Task for the test: to check the ability of the TFDA device to
switch the traffic lights in regular operating mode in case of emergency (e.g., power failure, communication error).
Test description: The test was performed in real conditions on the road V1197 with the permission of Ltd. SALDUS CEĻINIEKS. The communication module of one device was disabled to simulate a power failure problem.
Extract from the test report: in two seconds after the communication between traffic lights was lost, both devices switched to red signal and started to operate according to pre-set time parameters. After communication was restored, the

Electrical, Control and Communication Engineering
________________________________________________________________________________________2021, vol. 17, no. 1
91
devices completed the full signal cycle according to the emergency mode and continued to work according to the TFDA mode (see Fig. 13 a, b).
a)
b)
Fig. 13. Traffic light operation testing in case of emergency.
IX. CONCLUSION The results of testing the TFDA device in the laboratory and
in real conditions proved that the system was operational and could be used to manage traffic flows during road repair stages. Thus, the goal of the study was achieved.
The system can work not only for one pair of traffic lights, but for any required number of traffic lights. This allows the system to be applied to intersections of different configurations (T-shape, X-shape, etc.).
TFDA device sensor can detect various types of vehicles – cars, trucks, buses, trolleybuses, motorcycles, scooters, etc. No faults, errors or malfunctions were detected. Currently, the vehicle fixation distance limit is 7 meters.
Regarding the sensor settings, it can be concluded that it is more useful to divide the measured distance into several intervals, because with 3–5 intervals the signal is on average 4.58 times higher than the noise level, but with 10–20 intervals it is higher on average 8.51 times. As a result, the signal is stronger, which increases the reliability of vehicle detection. In
turn, it is determined that the value of the optimal gain is 0.7. In the case of a low coefficient value of 0.5 and also at higher values of 0.8–0.9, the vehicle presence signal is on average by 86.31% greater than the signal at the coefficient of 0.7.
As a result of testing the radio modules of the equipment, the maximum distance of continuous communication is 2652 m. In the tests, due to uneven ground terrain, deterioration of radio signal communication was detected.
The performed experiment proved the reduction of waiting time at the stages of road repair.
For a section of 600 m with a speed of 30 km/h using the current system without the TFDA device, the waiting time at the traffic light is up to 208 s, while with the TFDA device:
- if there are vehicles in both directions, the waiting time is up to 162 s, 25.93 % better;
- if there are vehicles in one direction only, the waiting time is up to 108 s, 88.89 % better;
- if there are no vehicles in both directions, which is typical of lightly loaded roads, then the waiting time is only 36 s, which is 5.67 times better than in the existing road repair traffic light system.
REFERENCES [1] D. Schrank, B. Eisele, T. Lomax and J. Bak, “Urban Mobility Scorecard,”
Texas A&M Transportation Institute Technical Report, INRIX, 2015. [2] A. B. de Laski and P. S. Parsonson, Traffic Detector Handbook. Field
Manual for Inductive Loop Detectors, Magnetometers, Magnetic Detectors. US Department of transportation, Federal Highway Administration, Springfield VA, April 1985.
[3] D. Gibson, M. K. Mills and L. A. Klein, “A New Look at Sensors,” Public Roads, vol. 71, no. 3, Federal Highway Administration Research and Technology, Nov/Dec 2007.
[4] Traffic Detector Handbook, 2nd ed. Research, Development, and Technology Turner-Fairbank Highway Research Center, Virginia, USA, 1990.
[5] Traffic Detector Handbook, 3rd ed. Research, Development, and Technology Turner-Fairbank Highway Research Center, VA, USA, 2006.
[6] B. Bargagli, G. Manes, R. Facchini and A. Manes, “Acoustic sensor network for vehicle traffic monitoring,” Proceedings of the First International Conference on Advances in Vehicular Systems, Technologies and Applications, Venice, Italy, 24–29 June, 2012.
[7] J. Guerrero-Ibáñez, S. Zeadally and J. Contreras-Castillo, “Sensor Technologies for Intelligent Transportation Systems,” Sensors, vol. 18, no. 4, p. 18041212, Apr. 2018. https://doi.org/10.3390/s18041212
[8] L. A. Klein, ITS Sensors and Architectures for Traffic Management and Connected Vehicles. CRC Press, Tylor & Francis group, USA, 2018.
[9] V. Torrisi, M. Ignaccolo and G. Inturri, “Innovative Transport Systems to Promote Sustainable Mobility: Developing the Model Architecture of a Traffic Control and Supervisor System. In O. Gervasi et al. (eds) Computational Science and Its Applications – ICCSA 2018. ICCSA 2018. Lecture Notes in Computer Science, vol. 10962. Springer, Cham. 2018. https://doi.org/10.1007/978-3-319-95168-3_42
[10] O. Tetervenoks, A. Avotins, P. Apse-Apsitis, L. R. Adrian and R. Vilums, “Movement Detection Sensor Application for Traffic Direction Monitoring in Smart Street Lighting Systems,” 2018 IEEE 59th International Scientific Conference on Power and Electrical Engineering of Riga Technical University (RTUCON), Riga, Latvia, 2018. https://doi.org/10.1109/RTUCON.2018.8659850
[11] A. Korneyev, M. Gorobetz and A. Levchenkov, “Unified Energy Efficient Control Algorithm for Electric Unmanned Aerial Vehicles with Different Traction Drives and Configurations,” 2018 IEEE 59th International Scientific Conference on Power and Electrical Engineering of Riga Technical University (RTUCON), Riga, Latvia, 2018. https://doi.org/10.1109/RTUCON.2018.8659882

Electrical, Control and Communication Engineering
________________________________________________________________________________________2021, vol. 17, no. 1
92
[12] K. Vitols, E. Grinfogels and D. Nikonorovs, “Cell Capacity Dispersion Analysis Based Battery Pack Design,” 2018 IEEE 6th Workshop on Advances in Information, Electronic and Electrical Engineering (AIEEE), 2018. https://doi.org/10.1109/AIEEE.2018.8592012
[13] K. Vitols and A. Podgornov, “Impact of Battery Cell Configuration to Powered Wheelchair Drive Efficiency,” Archives of Electrical Engineering, 2020, vol. 69, no. 1, pp. 203–213. https://doi.org/10.24425/aee.2020.131768
[14] A. Bubovich and I. Galkin, “Evaluation of Optimal Switching of Modular Multilevel Inverter with Independent Voltage Sources,” 2020 IEEE 61th International Scientific Conference on Power and Electrical Engineering of Riga Technical University (RTUCON), Riga, Latvia, 2020. https://doi.org/10.1109/RTUCON51174.2020.9316581
[15] A. Bubovich, “Evaluation of control of interface converters for energy transfer between small sources, storages and low-voltage DC grid: Simulation case,” IECON 2017 - 43rd Annual Conference of the IEEE Industrial Electronics Society, 2017, pp. 8681–8684. https://doi.org/10.1109/IECON.2017.8217525
[16] N. Kunicina, A. Zabasta, A. Patlins, I. Bilic and J. Peksa, “What a prototype is: the first step for commercialization of scientific ideas,” 2020 IEEE 61th International Scientific Conference on Power and Electrical Engineering of Riga Technical University (RTUCON), Riga, Latvia, 2020. https://doi.org/10.1109/RTUCON51174.2020.9316594
Mikhail Gorobetz obtained Dr. sc. ing. degree in 2008. He is a Professor and Leading Researcher of the Institute of Industrial Electronics and Electrical Engineering, Riga Technical University, and Head of the Railway Engineering Department. Results of research activity are published in various international scientific proceedings and journals in the fields of adaptive control, neural networks, genetic algorithms, modelling and simulation of dynamic processes in transport and embedded control systems. He is a leader of various national projects and international projects. He is the author of many study books and patented inventions. Address: Riga Technical University, 12/1, Azenes Street, Riga, LV-1048, Latvia E-mail: [email protected] ORCID iD: https://orcid.org/0000-0001-6633-1919 Andrey Potapov obtained Dr. sc. ing. degree from the Institute of Industrial Electronics and Electrical Engineering of Riga Technical University in 2014. Now he is an Assistant Professor and Leading Researcher at the Institute of Industrial Electronics and Electrical Engineering of Riga Technical University. Scientific work results are published in various international scientific proceedings and journals in the fields of adaptive control, automatic control and wireless sensor systems, 3D modelling for industrial control systems. He participates in various national projects and international projects, and he is the author of many study books and patented inventions. Address: Riga Technical University, 12/1, Azenes Street, Riga, LV-1048, Latvia E-mail: [email protected] Aleksandr Korneyev is a PhD student at the Institute of Industrial Electronics and Electrical Engineering of Riga Technical University. He received the degrees of B. Sc. and M. Sc. in electrical engineering from Riga Technical University in 2016 and 2018, respectively. The main fields of scientific interests are unmanned aerial vehicle, evolutionary algorithm, energy efficiency optimization. He has several publications in proceedings of international conferences. Address: Riga Technical University, 12/1, Azenes Street, Riga, LV-1048, Latvia E-mail: [email protected] Ivars Alps obtained Dr. sc. ing. degree from the Institute of Industrial Electronics and Electrical Engineering at Riga Technical University in 2012. Now he is a Researcher at the Institute of Industrial Electronics and Electrical Engineering of Riga Technical University. The main fields of scientific interests are neural networks, artificial immune algorithm, scheduling theory, intelligent electric transport systems. He has several publications in proceedings of international conferences, and he is a co-author of several patents. Address: Riga Technical University, 12/1, Azenes Street, Riga, LV-1048, Latvia E-mail: [email protected]