development servicing plan sewerage services
TRANSCRIPT

A division of the Department of Finance & Services
Development Servicing Plan –
Sewerage Services
Bega Valley Shire Council
Adopted 12th June 2013

Document Control
Version Author Reviewer Approved for Issue
Name Date
Draftv1 Paul Kamlade John Stanmore
Draftv2 John Stanmore Roshan Iyadurai Roshan Iyadurai
28/03/2013
Draftv3 John Stanmore Roshan Iyadurai Roshan Iyadurai
9/03/2013
Final Mark Hankinson
Minor amendment to section 5.7.2 included as per council resolution
26/06/2013

Development Servicing Plan for Sewerage Services – Bega Valley Shire Council
i
Contents
Contents ............................................................................................................................................ i
Abbreviations .................................................................................................................................... iii
Executive Summary .......................................................................................................................... iv
1 Introduction ................................................................................................................................ 1
2 Demographic Information ........................................................................................................... 3
2.1 Growth Projections ............................................................................................................. 3
3 Sewerage Infrastructure ............................................................................................................. 5
3.1 Assets Relevant to this DSP ............................................................................................... 5
3.2 Estimates of Capital Costs .................................................................................................. 5
3.3 Works Program and Expenditure ........................................................................................ 5
4 Levels of Service and Design Parameters ................................................................................. 6
4.1 Levels of Service ................................................................................................................ 6
4.2 Design Parameters ............................................................................................................. 6
5 Calculated Developer Charges .................................................................................................. 7
5.1 Overview ............................................................................................................................. 7
5.2 Capital Charge .................................................................................................................... 7
5.3 Reduction Amount and Calculated Capital Charge ............................................................. 8
5.4 Summary of Proposed Developer Charges ......................................................................... 9
5.5 Reviewing / Updating of Developer Charges ..................................................................... 10
5.6 Exclusions ........................................................................................................................ 10
5.7 Payment of Developer Charges ........................................................................................ 10
5.7.1 Timing of Payments .................................................................................................................... 11
5.7.2 Method of Payment ..................................................................................................................... 11
5.8 Developments Outside Boundaries of DSP ....................................................................... 11
References ..................................................................................................................................... 12
Appendices .................................................................................................................................... A-1
Appendix A Development Servicing Plan Boundaries ............................................................... A-1
Appendix B Sewer Capital Works Program .............................................................................. B-1
Appendix C Capital Charge and Reduction Amount Calculations ............................................. C-1

Development Servicing Plan for Sewerage Services – Bega Valley Shire Council
ii
Figures
Figure 1 Impact of DC cross subsidy on Typical Residential Sewer Bill ............................................ v
Figure 2 Bega Valley Shire ............................................................................................................... 2
Figure 3 Thirty-Year Sewerage Capital Works Program .................................................................... 5
Figure 4 Impact of DC cross subsidy on Typical Residential Sewer Bill .......................................... 10
Figure 5 Bega Sewer DSP Boundary ............................................................................................. A-2
Figure 6 Bermagui Sewer DSP Boundary ...................................................................................... A-3
Figure 7 Candelo Sewer DSP Boundary ........................................................................................ A-4
Figure 8 Cobargo Sewer DSP Boundary ........................................................................................ A-5
Figure 9 Eden Sewer DSP Boundary ............................................................................................. A-6
Figure 10 Kalaru Sewer DSP Boundary ......................................................................................... A-7
Figure 11 Merimbula Sewer DSP Boundary ................................................................................... A-8
Figure 12 Pambula Beach Sewer DSP Boundary .......................................................................... A-9
Figure 13 Pambula Sewer DSP Boundary ................................................................................... A-10
Figure 14 South Pambula Sewer DSP Boundary ......................................................................... A-11
Figure 15 Tathra Sewer DSP Boundary ....................................................................................... A-12
Figure 16 Tura Beach Sewer DSP Boundary ............................................................................... A-13
Figure 17 Wallaga Lake Sewer DSP Boundary ............................................................................ A-14
Figure 18 Wolumla Lake Sewer DSP Boundary ........................................................................... A-15
Tables
Table 2-1: Projected Permanent Residential ET ............................................................................... 3
Table 2-2: Projected Permanent Non-Residential ET ........................................................................ 4
Table 2-3: Projected Total Permanent ET ......................................................................................... 4
Table 3-1: Summary of Sewerage Capital Works .............................................................................. 5
Table 4-1 Sewerage Levels of Service .............................................................................................. 6
Table 5-1 Capital Charge for each Sewerage Service Area .............................................................. 8
Table 5-2 Bega Valley Shire Council Sewer Developer Charges ...................................................... 8
Table 5-3 Bega Valley Shire Council Sewer Developer Charges ...................................................... 9
Table 5-4 Quantity of Sewer TRB Cross Subsidy due to Proposed Developer Charges.................... 9

Development Servicing Plan for Sewerage Services – Bega Valley Shire Council
iii
Abbreviations
Abbreviation Description
ABS Australian Bureau of Statistics
ADWF Average Dry Weather Flow
ARI Average Recurrence Interval
DCP Development Control Plan
DSP Development Servicing Plan
EP Equivalent Persons
ERP Estimated Resident Population – the census population of the shire corrected to account for:
people staying in other parts of Australia on census night
an estimate of people overseas on census night
people who did not return the census
an estimate of births, deaths and migration to account for change in population between census night and the 30
th of June
ET Equivalent Tenements (Equal to one occupied residential single detached dwelling)
IPART Independent Pricing and Regulatory Tribunal
L/ET/d Litres per ET per day
LOS Levels of Service
LWU Local Water Utility
NOW The New South Wales Office of Water, the Office of the NSW Department of Primary Industries responsible for the management of the State’s surface and ground water resources
NPV Net Present Value
NRMMC Natural Resource Management Ministerial Council
NSW New South Wales
OMA Operation, Maintenance and Administration Costs
POEO Act The NSW Protection of the Environment Operations Act 1997
PV Present Value
PWWF Peak Wet Weather Flow
ROI Return on Investment
STP Sewage Treatment Plant
TRB Typical Residential Bill
Development Servicing Plan for Sewerage Services – Bega Valley Shire Council
iv
Executive Summary
This Development Servicing Plan (DSP) covers sewerage developer charges for the following Bega Valley Shire Council service areas:
The Bega Sewerage Scheme;
The Bermagui-Wallaga Lake Sewerage Scheme;
The Candelo Sewerage Scheme;
The Cobargo Sewerage Scheme;
The Eden Sewerage Scheme;
The Kalaru Sewerage Scheme;
The Merimbula-Pambula Sewerage Scheme;
The Tathra Sewerage Scheme;
The Tura Beach Sewerage Scheme; and
The Wolumla Sewerage Scheme.
This DSP has been prepared in accordance with the Developer Charges Guidelines for Water Supply, Sewerage and Stormwater (2002) issued by the Minister for Land and Water Conservation, pursuant to section 306 (3) of the Water Management Act (2000). This DSP is to be registered with the NSW Office of Water (NOW).
This DSP achieves the following outcomes for Council:
1. Allows Council to require an equitable monetary contribution for the provision of sewerage infrastructure to meet the loadings generated by both residential and non-residential development.
2. Facilitate the future provision of sewerage services to the Council service area which meets the
required levels of service (Section 4) with regard to pump station, collector main, and treatment plant and treated effluent management system capacities.
3. Sets out the schedule of proposed works to meet increasing sewer loads generated by
development (Section 3).
4. Details the resultant developer charges and payment policies (Section 5).
A future sewage load estimate for the Council service areas has been undertaken. This estimate is the basis used for determining the infrastructure required to meet the need generated by future development. The sewage load estimate is outlined in the supporting document – Population and Water Cycle Projections.
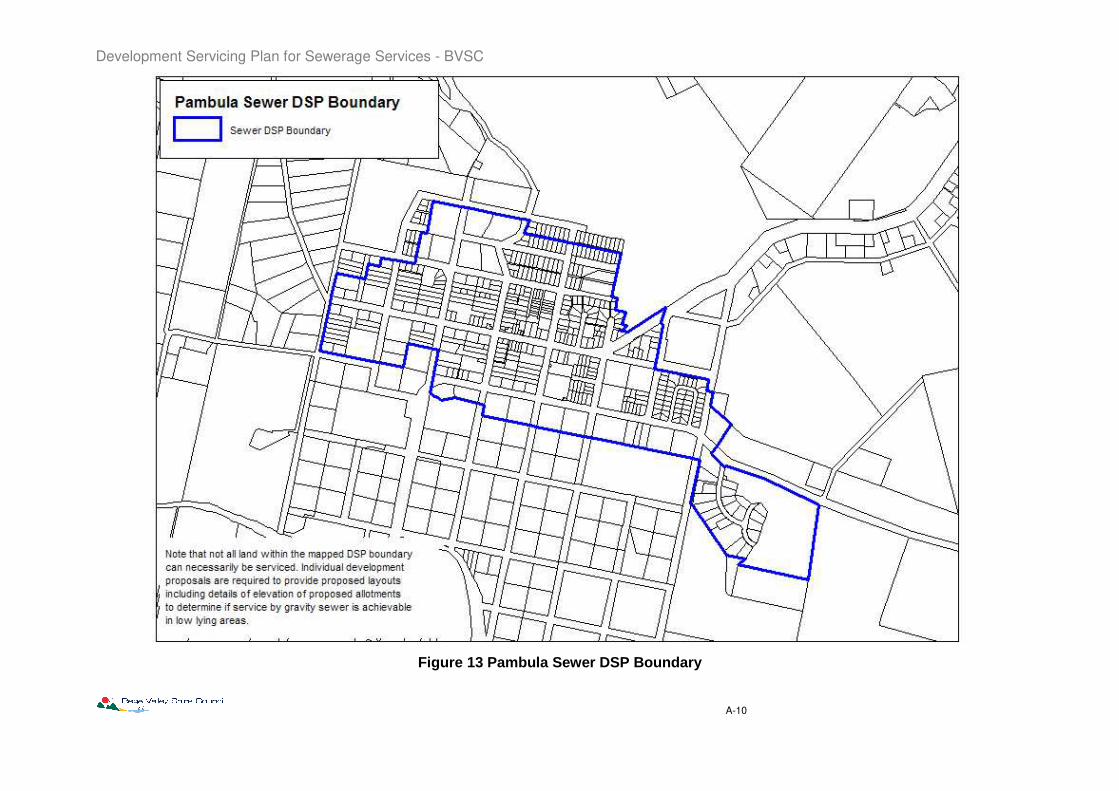
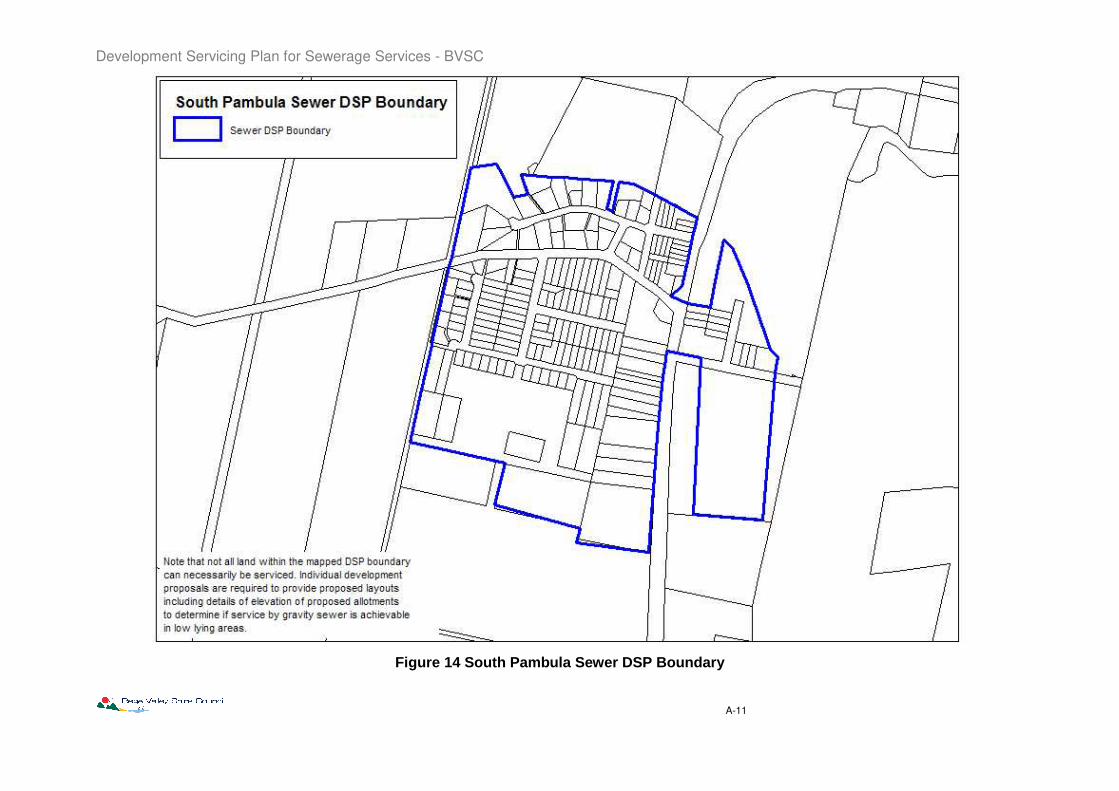
The Council development servicing areas covered by this DSP are outlined in Appendix A. Note that not all land within the mapped DSP boundaries can necessarily be serviced. Individual development proposals are required to provide proposed layouts including details of elevation of proposed allotments to determine if service by gravity sewer is achievable in low lying areas.
Developer charges are applicable for existing and proposed works which service future development. Section 3 details the existing works and proposed works schedule for sewerage infrastructure to service the expected growth.
In its meeting on 12th June 2013, Council resolved to levy developer charges for sewerage services lower than the calculated value. The calculated developer charges based on full cost recovery as well as Council’s proposed developer charges are shown in Table S1.

Development Servicing Plan for Sewerage Services – Bega Valley Shire Council
v
Table S1 Bega Valley Shire Council Sewer Developer Charges
Sewerage Service Area Calculated Developer Charge /
ET ($2012/13) Proposed Developer Charge / ET
($2012/13)
Bega $8,386 $10,500
Bermagui-Wallaga Lake $24,165 $10,500
Candelo $106,265 $10,500
Cobargo $79,583 $10,500
Kalaru $55,169 $10,500
Eden $20,470 $10,500
Merimbula-Pambula $17,800 $10,500
Tathra $22,931 $10,500
Tura Beach $14,038 $10,500
Wolumla $77,093 $10,500
Weighted Average $20,925 $10,500
Adopting the proposed developer charges and maintaining the current level of the Sewer Typical Residential Bill (TRB) of $1,045 p.a. for the next 5 years (until 2017/18) will result in $85 per year cross-subsidy by each residential customer over the model forecast period. Figure 1 graphically represents the impact of the proposed developer charges on the typical residential sewer bill.
Figure 1 Impact of DC cross subsidy on Typical Residential Sewer Bill

Development Servicing Plan for Sewerage Services – Bega Valley Shire Council
vi
Developer charges calculations relating to this DSP will be reviewed after a period of five years, or when any significant changes occur in proposed works, growth projections or standards.
In the period between any reviews, developer charges will be revised on 1 July each year on the basis of movements in the Consumer Price Index (CPI) for Sydney, in the preceding 12 months to December, excluding the impact of GST.
The developer shall be responsible for the full cost of the design and construction of sewerage reticulation works within subdivisions (including pumps stations) as well as associated sewerage infrastructure downstream of development not contained in the proposed works schedule (Section 3).

Development Servicing Plan for Sewerage Services - BVSC
1
1 Introduction
Section 64 of the Local Government Act 1993 enables a local government council to levy developer charges for water supply, sewerage and stormwater. This derives from a cross-reference in that Act to Section 306 of the Water Management Act 2000.
A Development Servicing Plan (DSP) documents developer charges (DC) payable by developers to water utilities for water supply, sewerage and stormwater. This DSP for sewerage services achieves the following outcomes for Council:
1. Allows Council to require an equitable monetary contribution for the provision of sewerage infrastructure to meet the loadings generated by both residential and non-residential development.
2. Facilitate the future provision of sewerage services to the Council service area which meets the
required levels of service (Section 4) with regard to pump station, collector main, and treatment plant and treated effluent management system capacities.
3. Sets out the schedule of proposed works to meet increasing sewer loads generated by
development (Section 3).
4. Details the resultant DC and payment policies (Section 5).
This DSP covers sewerage DC for the following Bega Valley Shire Council service areas:
The Bega Sewerage Scheme;
The Bermagui-Wallaga Lake Sewerage Scheme;
The Candelo Sewerage Scheme;
The Cobargo Sewerage Scheme;
The Eden Sewerage Scheme;
The Kalaru Sewerage Scheme;
The Merimbula-Pambula Sewerage Scheme;
The Tathra Sewerage Scheme;
The Tura Beach Sewerage Scheme; and
The Wolumla Sewerage Scheme.
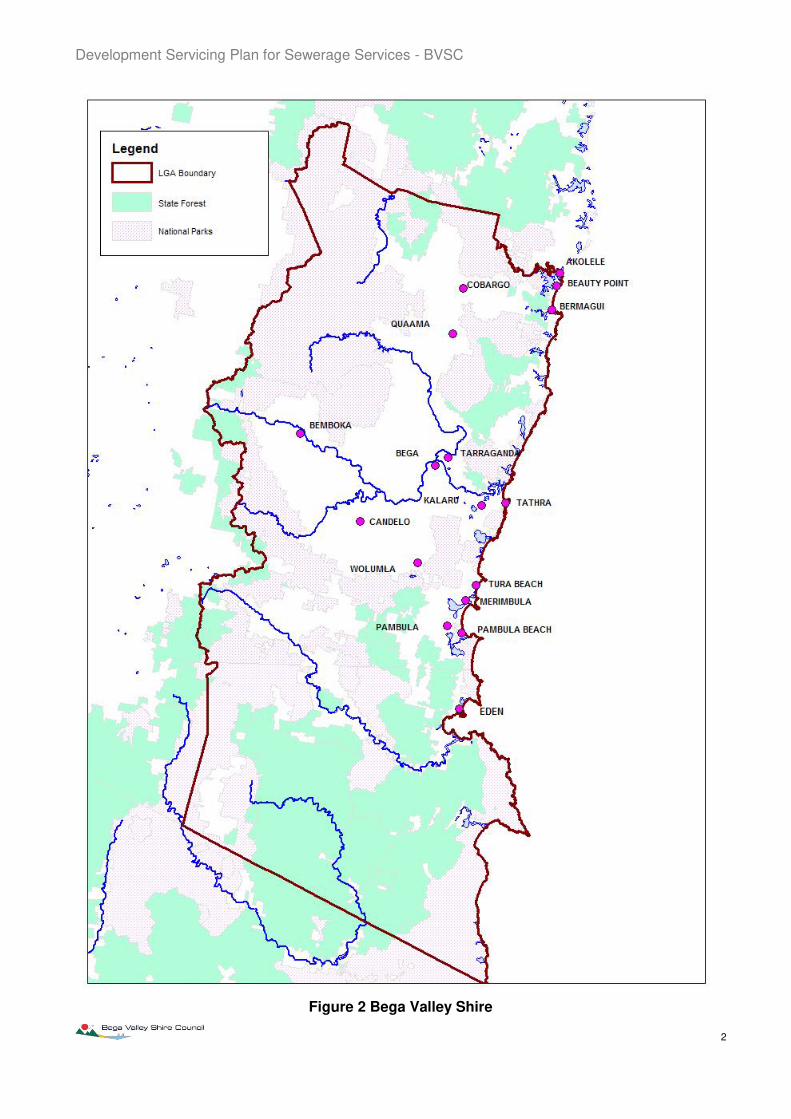
Figure 2 shows the Bega Valley Shire Council Area. The development servicing areas covered by this DSP are outlined in Appendix A. Note that not all land within the mapped DSP boundaries can necessarily be serviced. Individual development proposals are required to provide proposed layouts including details of elevation of proposed allotments to determine if service by gravity sewer is achievable in low lying areas.
This DSP has been prepared in accordance with the Developer Charges Guidelines for Water Supply, Sewerage and Stormwater (2002) issued by the Minister for Land and Water Conservation, pursuant to section 306 (3) of the Water Management Act (2000). This DSP is to be registered with the NSW Office of Water (NOW).
This DSP was adopted by Bega Valley Shire Council on 12th June 2013 and came into effect on 1st July 2013.
DC will be levied pursuant to this DSP, as a condition of development consent granted on or after the day this DSP came into effect.
This DSP supersedes any other requirements related to sewerage DC for the area covered by this DSP. This DSP takes precedence over any of Bega Valley Shire Council’s codes or policies where there are any inconsistencies relating to sewerage DC. (The term “Developer Contributions” may formerly have been used to refer to Developer Charges.)
The developer shall be responsible for the full cost of the design and construction of sewerage reticulation works within subdivisions (including pumps stations) as well as other sewerage items downstream of development not contained in the proposed works schedule (Section 3).
Development Servicing Plan for Sewerage Services - BVSC
2
Figure 2 Bega Valley Shire
Development Servicing Plan for Sewerage Services - BVSC
3
2 Demographic Information
2.1 Growth Projections A future sewage load growth estimate for the Council service areas has been undertaken. This estimate is the basis used for determining the infrastructure required to meet the need generated by future development. The sewage load growth estimate has taken the following factors into account as part of the analysis:
Historical ABS information;
Sewer flow data in conjunction with climatic trends;
Historical spatial and temporal trends in internal water usage; and
Utilisation of Council’s demographic projections (via the consultant ForecastID) for the quantum and timing of growth while consulting with Council’s Planning Department for identification growth relevant for the serviced sewerage areas.
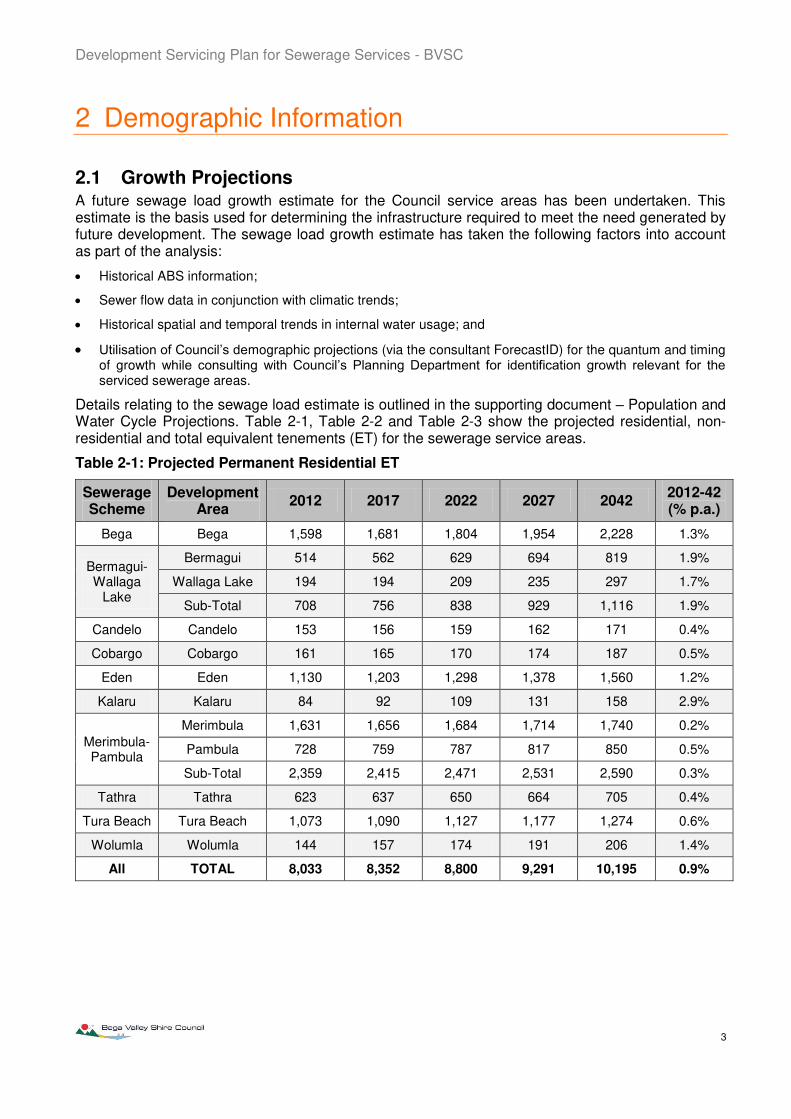
Details relating to the sewage load estimate is outlined in the supporting document – Population and Water Cycle Projections. Table 2-1, Table 2-2 and Table 2-3 show the projected residential, non-residential and total equivalent tenements (ET) for the sewerage service areas.
Table 2-1: Projected Permanent Residential ET
Sewerage Scheme
Development Area
2012 2017 2022 2027 2042 2012-42 (% p.a.)
Bega Bega 1,598 1,681 1,804 1,954 2,228 1.3%
Bermagui-Wallaga
Lake
Bermagui 514 562 629 694 819 1.9%
Wallaga Lake 194 194 209 235 297 1.7%
Sub-Total 708 756 838 929 1,116 1.9%
Candelo Candelo 153 156 159 162 171 0.4%
Cobargo Cobargo 161 165 170 174 187 0.5%
Eden Eden 1,130 1,203 1,298 1,378 1,560 1.2%
Kalaru Kalaru 84 92 109 131 158 2.9%
Merimbula-Pambula
Merimbula 1,631 1,656 1,684 1,714 1,740 0.2%
Pambula 728 759 787 817 850 0.5%
Sub-Total 2,359 2,415 2,471 2,531 2,590 0.3%
Tathra Tathra 623 637 650 664 705 0.4%
Tura Beach Tura Beach 1,073 1,090 1,127 1,177 1,274 0.6%
Wolumla Wolumla 144 157 174 191 206 1.4%
All TOTAL 8,033 8,352 8,800 9,291 10,195 0.9%

Development Servicing Plan for Sewerage Services - BVSC
4
Table 2-2: Projected Permanent Non-Residential ET
Sewerage Scheme
Development Area
2012 2017 2022 2027 2042 2012-42 (% p.a.)
Bega Bega 361 516 539 563 712 3.1%
Bermagui-Wallaga
Lake
Bermagui 118 130 142 154 176 1.6%
Wallaga Lake 23 27 30 33 38 2.0%
Sub-Total 141 157 172 187 214 1.7%
Candelo Candelo 11 11 12 13 13 0.7%
Cobargo Cobargo 62 69 75 83 88 1.4%
Eden Eden 371 388 405 422 435 0.6%
Kalaru Kalaru 10 43 69 69 69 19.5%
Merimbula-Pambula
Merimbula 251 265 276 285 292 0.5%
Pambula 153 156 159 162 165 0.3%
Sub-Total 404 421 435 447 457 0.4%
Tathra Tathra 71 74 77 81 84 0.6%
Tura Beach Tura Beach 43 46 49 52 54 0.9%
Wolumla Wolumla 4 4 5 5 5 0.7%
All TOTAL 1,478 1,729 1,838 1,922 2,131 1.4%
Table 2-3: Projected Total Permanent ET
Sewerage Scheme
Development Area
2012 2017 2022 2027 2042 2012-42 (% p.a.)
Bega Bega 1,959 2,197 2,343 2,517 2,940 1.6%
Bermagui-Wallaga
Lake
Bermagui 632 692 771 848 995 1.9%
Wallaga Lake 217 221 239 268 335 1.8%
Sub-Total 849 913 1,010 1,116 1,330 1.8%
Candelo Candelo 164 167 171 175 184 0.4%
Cobargo Cobargo 223 234 245 257 275 0.8%
Eden Eden 1,501 1,591 1,703 1,800 1,995 1.1%
Kalaru Kalaru 94 135 178 200 227 4.6%
Merimbula-Pambula
Merimbula 1,882 1,921 1,960 1,999 2,032 0.3%
Pambula 881 915 946 979 1,015 0.5%
Sub-Total 2,763 2,836 2,906 2,978 3,046 0.3%
Tathra Tathra 694 711 727 745 789 0.4%
Tura Beach Tura Beach 1,116 1,136 1,176 1,229 1,328 0.6%
Wolumla Wolumla 148 161 179 196 211 1.4%
All TOTAL 9,511 10,081 10,638 11,213 12,326 1.0%
Development Servicing Plan for Sewerage Services - BVSC
5
3 Sewerage Infrastructure
3.1 Assets Relevant to this DSP The existing and proposed sewerage assets servicing the areas covered by this DSP are listed in Appendix C.
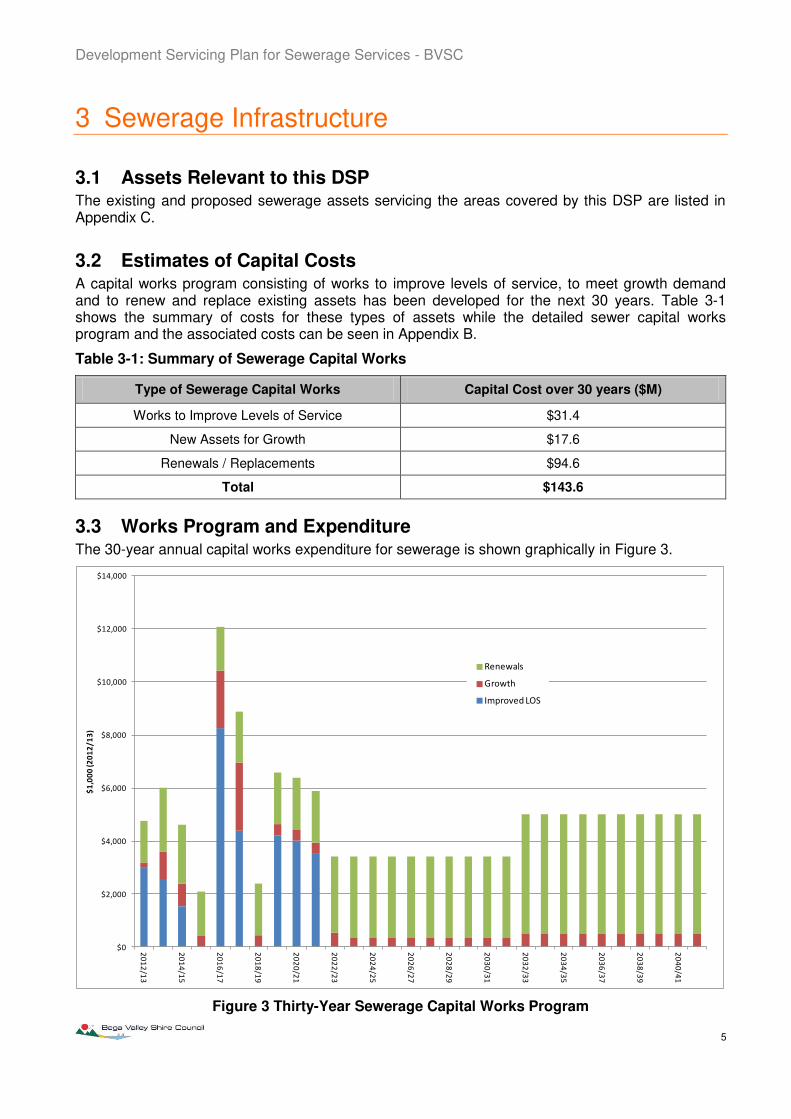
3.2 Estimates of Capital Costs A capital works program consisting of works to improve levels of service, to meet growth demand and to renew and replace existing assets has been developed for the next 30 years. Table 3-1 shows the summary of costs for these types of assets while the detailed sewer capital works program and the associated costs can be seen in Appendix B.
Table 3-1: Summary of Sewerage Capital Works
Type of Sewerage Capital Works Capital Cost over 30 years ($M)
Works to Improve Levels of Service $31.4
New Assets for Growth $17.6
Renewals / Replacements $94.6
Total $143.6
3.3 Works Program and Expenditure The 30-year annual capital works expenditure for sewerage is shown graphically in Figure 3.
$0
$2,000
$4,000
$6,000
$8,000
$10,000
$12,000
$14,000
20
12
/13
20
14
/15
20
16
/17
20
18
/19
20
20
/21
20
22
/23
20
24
/25
20
26
/27
20
28
/29
20
30
/31
20
32
/33
20
34
/35
20
36
/37
20
38
/39
20
40
/41
$1
,00
0 (
20
12
/1
3)
Renewals
Growth
Improved LOS
Figure 3 Thirty-Year Sewerage Capital Works Program

Development Servicing Plan for Sewerage Services - BVSC
6
4 Levels of Service and Design Parameters
4.1 Levels of Service The levels of service (LOS) are the standards required from the sewerage systems from the perspective of the individual customer. LOS shape the objectives and requirements for operation, maintenance and provision of the 30-year capital works plan (see Section 3). LOS are a target and are not intended as a formal customer contract.
Table 4-1 shows the sewerage LOS relevant to this DSP. For the full list of LOS relevant to sewerage refer to the Bega Valley Shire Council Strategic Business Plan for Water Supply and Sewerage Services.
Table 4-1 Sewerage Levels of Service
DESCRIPTION UNIT LEVEL OF SERVICE
Current Target Future Target
SEWER LOADS
Average dry weather
L/ET/d-
508
484
Wet weather system capacity - To contain and transfer a (24-hour) 1 in 2 year ARI wet weather event
EFFLUENT QUALITY
Effluent discharge compliance within licence limits
% compliance to POEO Act 98 100
Recycle/ reuse of wastewater % compliance to Australian Guidelines for Water Recycling (2006)
100 100
SERVICE AVAILABILITY Refer to Council’s Strategic Business Plan for Water Supply and Sewerage Service
4.2 Design Parameters The following documents have been relied upon for the design of sewerage components relevant for this DSP:
Investigation and design of sewerage system components is based on the Manual of Practice: Sewer Design (1984) and the Manual of Practice: Sewerage Pumping Station Design (1986). These manuals were prepared by NSW Public Works and are administered by NOW;
Sewer Code of Australia WSA 02-2002;
Bega Valley Shire Council Development Design Specification D12 Sewerage System; and
Bega Valley Shire Council Development Construction Specification C402 Sewerage System.
Technical reports relating to the system components in the DSP are included in the References Section.

Development Servicing Plan for Sewerage Services - BVSC
7
5 Calculated Developer Charges
5.1 Overview DC are up-front charges levied to recover the infrastructure costs incurred in servicing new developments or additions/changes to existing developments.
The DC calculation is based on the net present value (NPV) approach adopted by the Independent Pricing and Regulatory Tribunal (IPART) for the metropolitan water utilities. The fundamental principle of the NPV approach is that the investment in assets for serving a development is fully recovered through up-front charges (i.e. DC) and the present value (PV) of that part of annual bills received from the development in excess of operation, maintenance and administration (OMA) costs.
Developer Charge = Capital Charge – Reduction Amount
The DC process is described fully in the Developer Charges Guidelines for Water Supply, Sewerage and Stormwater (2002).
NSW Local Water Utilities (LWU) which propose to levy DC for sewerage need to prepare a DSP. The DSP details the calculation of the DC and is required to be fair and transparent.
The method of calculations of charges for developments other than a standard ET is based on values published in Council's Annual Fees and Charges, derived from industry standard publications and, where appropriate, the actual measured load of similar specific types of development in the shire or other local government utilities of a similar nature. Note that 1 ET is equal to one occupied residential single detached dwelling currently discharging 508 L/ET/d to the sewerage system during dry weather. Refer to Table 4-1 for sewerage system targets.
5.2 Capital Charge In accordance with the Guidelines the capital charge is calculated using the following formula:
Capital Charge = Capital Cost x Return on Investment (ROI) Factor
The capital cost includes the cost of providing, extending or augmenting assets required, or likely to be required, to provide services to a development. The capital cost per ET is the value of the relevant assets divided by the capacity of these assets (in ET).
Typically, the capacity of an asset would not be fully utilised until some time after construction of the asset. The ROI, also known as a holding charge, is based on the cost of early investment, and recovery of the cost over time. The ROI factor is dependent on the period for take-up of the asset capacity, and the rate of return for the asset.
The calculated capital charges for the area serviced by this DSP are shown in Table 5-1. Detailed information relating to the capital charge can be found in Appendix C.
Development Servicing Plan for Sewerage Services - BVSC
8
Table 5-1 Capital Charge for each Sewerage Service Area
Sewerage Service Area Calculated Capital Charge / ET ($2012/13)
Bega $11,595
Bermagui-Wallaga Lake $27,374
Candelo $109,474
Cobargo $82,792
Kalaru $58,378
Eden $23,679
Merimbula-Pambula $21,009
Tathra $26,140
Tura Beach $17,247
Wolumla $80,302
Weighted Average $24,134
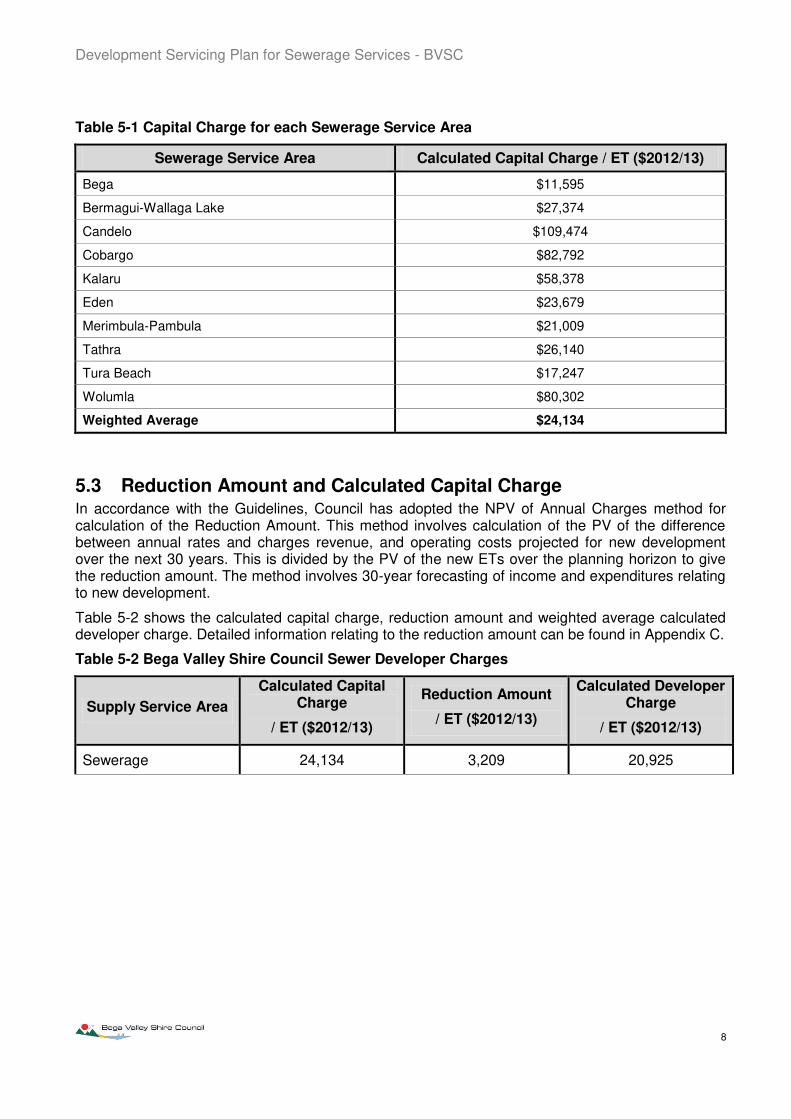
5.3 Reduction Amount and Calculated Capital Charge In accordance with the Guidelines, Council has adopted the NPV of Annual Charges method for calculation of the Reduction Amount. This method involves calculation of the PV of the difference between annual rates and charges revenue, and operating costs projected for new development over the next 30 years. This is divided by the PV of the new ETs over the planning horizon to give the reduction amount. The method involves 30-year forecasting of income and expenditures relating to new development.
Table 5-2 shows the calculated capital charge, reduction amount and weighted average calculated developer charge. Detailed information relating to the reduction amount can be found in Appendix C.
Table 5-2 Bega Valley Shire Council Sewer Developer Charges
Supply Service Area
Calculated Capital Charge
/ ET ($2012/13)
Reduction Amount
/ ET ($2012/13)
Calculated Developer Charge
/ ET ($2012/13)
Sewerage 24,134 3,209 20,925

Development Servicing Plan for Sewerage Services - BVSC
9
5.4 Summary of Proposed Developer Charges In its meeting on 12th June 2013, Council resolved to levy developer charges for sewerage services lower than the calculated value. The calculated developer charges based on full cost recovery as well as Council’s proposed developer charges are shown in Table 5-3.
Table 5-3 Bega Valley Shire Council Sewer Developer Charges
Sewerage Service Area Calculated Developer Charge
/ ET ($2012/13) Proposed Developer Charge /
ET ($2012/13)
Bega $8,386 $10,500
Bermagui-Wallaga Lake $24,165 $10,500
Candelo $106,265 $10,500
Cobargo $79,583 $10,500
Kalaru $55,169 $10,500
Eden $20,470 $10,500
Merimbula-Pambula $17,800 $10,500
Tathra $22,931 $10,500
Tura Beach $14,038 $10,500
Wolumla $77,093 $10,500
Weighted Average $20,925 $10,500
Adopting the proposed developer charges and maintaining the current level of Sewer Typical Residential Bill (TRB) of $1,045 p.a. for the next 5 years (until 2017/18) will result in $85 per year cross-subsidy by each residential customer over the model forecast period. Table 5-4 summarises the impact on the TRB of adopting the proposed developer charges.
Table 5-4 Quantity of Sewer TRB Cross Subsidy due to Proposed Developer Charges
Supply Service Area
Current Typical Residential Bill ($/assessment)
($2012/13)
TRB ($2012/13) from 2018/19 with: Level of cross subsidy
($/assessment)
($2012/13) No cross-subsidy
With cross-subsidy
Sewerage 1,045 825 910 85
Figure 4 graphically represents the impact of the proposed developer charges on the typical residential sewer bill.

Development Servicing Plan for Sewerage Services - BVSC
10
Figure 4 Impact of DC cross subsidy on Typical Residential Sewer Bill
5.5 Reviewing / Updating of Developer Charges DC calculations relating to this DSP will be reviewed after a period of five years, or when any significant changes occur in proposed works, growth projections or standards.
In the period between any reviews, developer charges will be revised on 1 July each year on the basis of movements in the Consumer Price Index (CPI) for Sydney, in the preceding 12 months to December, excluding the impact of GST.
5.6 Exclusions The DC do not cover the costs of reticulation works and assets commissioned pre-1970. The developer shall be responsible for the full cost of the design and construction of sewerage reticulation works within subdivisions (including pumps stations) as well as other sewerage infrastructure downstream of development not contained in the proposed works schedule (Section 3).
5.7 Payment of Developer Charges Section 64 of the Local Government Act 1993 enables a local government council to levy developer charges for water supply, sewerage and stormwater. This derives from a cross-reference in that Act to Section 306 of the Water Management Act 2000.
Development Servicing Plan for Sewerage Services - BVSC
11
5.7.1 Timing of Payments
Subject to clause 5.7.2 the timing for payments of developer charges is as follows:
For complying development Prior to the issuing of a complying development certificate (whether or not the certificate is issued by Council or an accredited certifier).
For other development Prior to the release of the Construction Certificate.
For subdivision Prior to the release of the Linen Plan.
5.7.2 Method of Payment
DC must be made in the form of monetary payments to Bega Valley Shire Council. Development Consents requiring the payment of a DC will contain a condition specifying that a Certificate of Compliance under Division 5 of Part 2 of Chapter 6 of the Water Management Act 2000 must be obtained prior to the issue of a Subdivision / Construction / Occupation Certificate.
A note will be attached to the consent condition indicating the granting of a Certificate of Compliance is dependent on the payment of DC. The note will indicate the calculated additional load the development will impose on the sewerage system expressed in ETs. The DC per ET will be specified for the financial year in which the consent is issued.
The note will advise that the payment of DC will be at the rate which applies at the time of payment, as published in Council’s annually revised Fees and Charges schedule. That is the rate may increase, through indexation or replacement of this DSP with a new one, from the time the condition appears on the notice of development consent until the time the DC is actually paid to Council.
5.8 Developments Outside Boundaries of DSP After the adoption of the DSP, new development may be proposed outside the boundary of the DSP (see Appendix A). Provided that there are no planning or other constraints to the development, Council may approve construction of essential assets to service such a development. These assets will be sized to suit all potential development in the proposed development area with the full capital cost being met by the developer, in addition to the DC levied on the development.

Development Servicing Plan for Sewerage Services - BVSC
12
References
Background information and calculations relating to this DSP are contained in the following documents:
Bega Valley Shire Council Development Design Specification D12 Sewerage System; and
Bega Valley Shire Council Development Construction Specification C402 Sewerage System.
Developer Charges for Water Supply, Sewerage and Stormwater Guidelines, December 2002
Investigation and design of sewerage system components is based on the Manual of Practice: Sewer Design (1984) and the Manual of Practice: Sewerage Pumping Station Design (1986). These manuals were prepared by NSW Public Works and are administered by NOW;
NSW Public Works 2013. Population and Water Cycle Projections – Development Servicing Strategy for Bega Valley Shire Council
NRMMC 2006. Australian Guidelines for Water Recycling: Managing Health and Environmental Risks (Phase 1). Natural Resource Management Ministerial Council, Environment Protection and Heritage council, Australian Health Minister Conference.
Sewer Code of Australia WSA 02-2002;

Development Servicing Plan for Sewerage Services - BVSC
A-1
Appendices
Appendix A Development Servicing Plan Boundaries

Development Servicing Plan for Sewerage Services - BVSC
A-2
Figure 5 Bega Sewer DSP Boundary

Development Servicing Plan for Sewerage Services - BVSC
A-3
Figure 6 Bermagui Sewer DSP Boundary

Development Servicing Plan for Sewerage Services - BVSC
A-4
Figure 7 Candelo Sewer DSP Boundary

Development Servicing Plan for Sewerage Services - BVSC
A-5
Figure 8 Cobargo Sewer DSP Boundary

Development Servicing Plan for Sewerage Services - BVSC
A-6
Figure 9 Eden Sewer DSP Boundary

Development Servicing Plan for Sewerage Services - BVSC
A-7
Figure 10 Kalaru Sewer DSP Boundary

Development Servicing Plan for Sewerage Services - BVSC
A-8
Figure 11 Merimbula Sewer DSP Boundary

Development Servicing Plan for Sewerage Services - BVSC
A-9
Figure 12 Pambula Beach Sewer DSP Boundary
Development Servicing Plan for Sewerage Services - BVSC
A-10
Figure 13 Pambula Sewer DSP Boundary
Development Servicing Plan for Sewerage Services - BVSC
A-11
Figure 14 South Pambula Sewer DSP Boundary

Development Servicing Plan for Sewerage Services - BVSC
A-12
Figure 15 Tathra Sewer DSP Boundary

Development Servicing Plan for Sewerage Services - BVSC
A-13
Figure 16 Tura Beach Sewer DSP Boundary

Development Servicing Plan for Sewerage Services - BVSC
A-14
Figure 17 Wallaga Lake Sewer DSP Boundary

Development Servicing Plan for Sewerage Services - BVSC
A-15
Figure 18 Wolumla Lake Sewer DSP Boundary
Development Servicing Plan for Sewerage Services - BVSC
B-1
Appendix B Sewer Capital Works Program

Bega Valley Shire CouncilSEWER - 30-Year Capital Works Program Current Year 2012 /13CAPITAL WORKS IN 2012$('000) 0 1 2 3 4 5 6 7 8 9 10 11 12 13 14 15 16 17 18 19 20 21 22 23 24 25 26 27 28 29 30
SUBSIDY ILOS GROWTH RENEW Total 2012/13 2013/14 2014/15 2015/16 2016/17 2017/18 2018 /19 2019/20 2020/21 2021/22 2022/23 2023/24 2024/25 2025/26 2026/27 2027/28 2028/29 2029/30 2030/31 2031/32 2032/33 2033/34 2034/35 2035/36 2036/37 2037/38 2038/39 2039/40 2040/41 2041/42
BERMAGUIBermagui STP upgrade - Balance Tank 100% 500 500
Bermagui STP - Effluent Reuse 50% 50% 2000 2000
Effluent Disposal - Ocean outfall 100% 4000 4000
TURATura - Effluent Disinfection 100% 2000 1500 500
EDENEden - Effluent disinfection 100% 2000 1500 500
Retic Mains Rehabilitation (MWH Report) 25% 75% 6150 615 615 615 615 615 615 615 615 615 615
2.1ML Storage at SPS 2 and related works 80% 20% 1795
BEGABega STP - Balance Tank 100% 1000 1000
Retic Mains Rehabilitation (MWH Report - Item 2) 25% 75% 7500 750 750 750 750 750 750 750 750 750 750
MH4 - SPS 4 - Sewer Main Upsize(Item 6) 25% 75% 238 238MH4 - SPS 4 - Sewer Main Upsize(Item 6) 25% 75% 238 238
0.4ML Storage at MH255 (Item 8) 80% 20% 1280 1280
North Bega Sewerage (treated at Bega STP) 0North Bega Sewerage - Pre-construction 80% 20% 0North Bega Sewerage (treated at Bega STP) 80% 20% 0Tarraganda Sewerage - Pre-construction activities 80% 20% 0Tarraganda Sewerage 80% 20% 0
MERIMBULA/PAMBULASTP Upgrade and Effluent disposal - Dunal Exfiltration 75% 25% 11500 7000 4500
Effluent reuse - Golf course and Millingandi 100% 7700 4200 3500
West Pambula SPS 25% 75% 1500 1000 500
OTHER WORKSSludge Management - All Schemes 100% 2000 2000
Telemetry upgrade - All schemes 0Developemt Servicing Strategy, DSP & SBP 100% 125 125
30-YEAR RENEWALS PROGRAM 10% 90% 92292 1750 713 713 713 713 1011 1011 1011 1011 1011 2035 3400 3400 3400 3400 3400 3400 3400 3400 3400 5000 5000 5000 5000 5000 5000 5000 5000 5000 5000
0
GRAND TOTAL 143580 4750 5998 4596 2078 12078 8876 2376 6576 6376 5876 3400 3400 3400 3400 3400 3400 3400 3400 3400 3400 5000 5000 5000 5000 5000 5000 5000 5000 5000 5000
Strategic Water Management Unit
NSW Department of Commerce BVSC_Capital Works_11-12-March Ver FINAL.xls 9/04/2013
Development Servicing Plan for Sewerage Services - BVSC
C-1
Appendix C Capital Charge and Reduction Amount Cal culations

Development Servicing Plan for Sewerage Services - BVSC
C-2
Overview
In accordance with the Guidelines, Council has adopted the NPV of Annual Charges method for calculation of the Reduction Amount. This method involves calculation of the PV of the difference between annual rates and charges revenue, and operating costs projected for new development over the next 30 years. This is divided by the PV of the new ETs over the planning horizon to give the reduction amount. The method involves 30-year forecasting of income and expenditures relating to new development.
List of Items in Appendix C
Table C1 Capital Charge Calculation – Bega Sewerage Scheme
Table C2 Capital Charge Calculation – Bermagui-Wallaga Lake Sewerage Scheme
Table C3 Capital Charge Calculation – Candelo Sewerage Scheme
Table C4 Capital Charge Calculation – Cobargo Sewerage Scheme
Table C5 Capital Charge Calculation – Eden Sewerage Scheme
Table C6 Capital Charge Calculation – Kalaru Sewerage Scheme
Table C7 Capital Charge Calculation – Merimbula-Pambula Sewerage Scheme
Table C8 Capital Charge Calculation – Tathra Sewerage Scheme
Table C9 Capital Charge Calculation – Tura Beach Sewerage Scheme
Table C10 Capital Charge Calculation – Wolumla Sewerage Scheme
Table C11 Calculation of DC using the NPV Annual Charges Method – 3rd Iteration
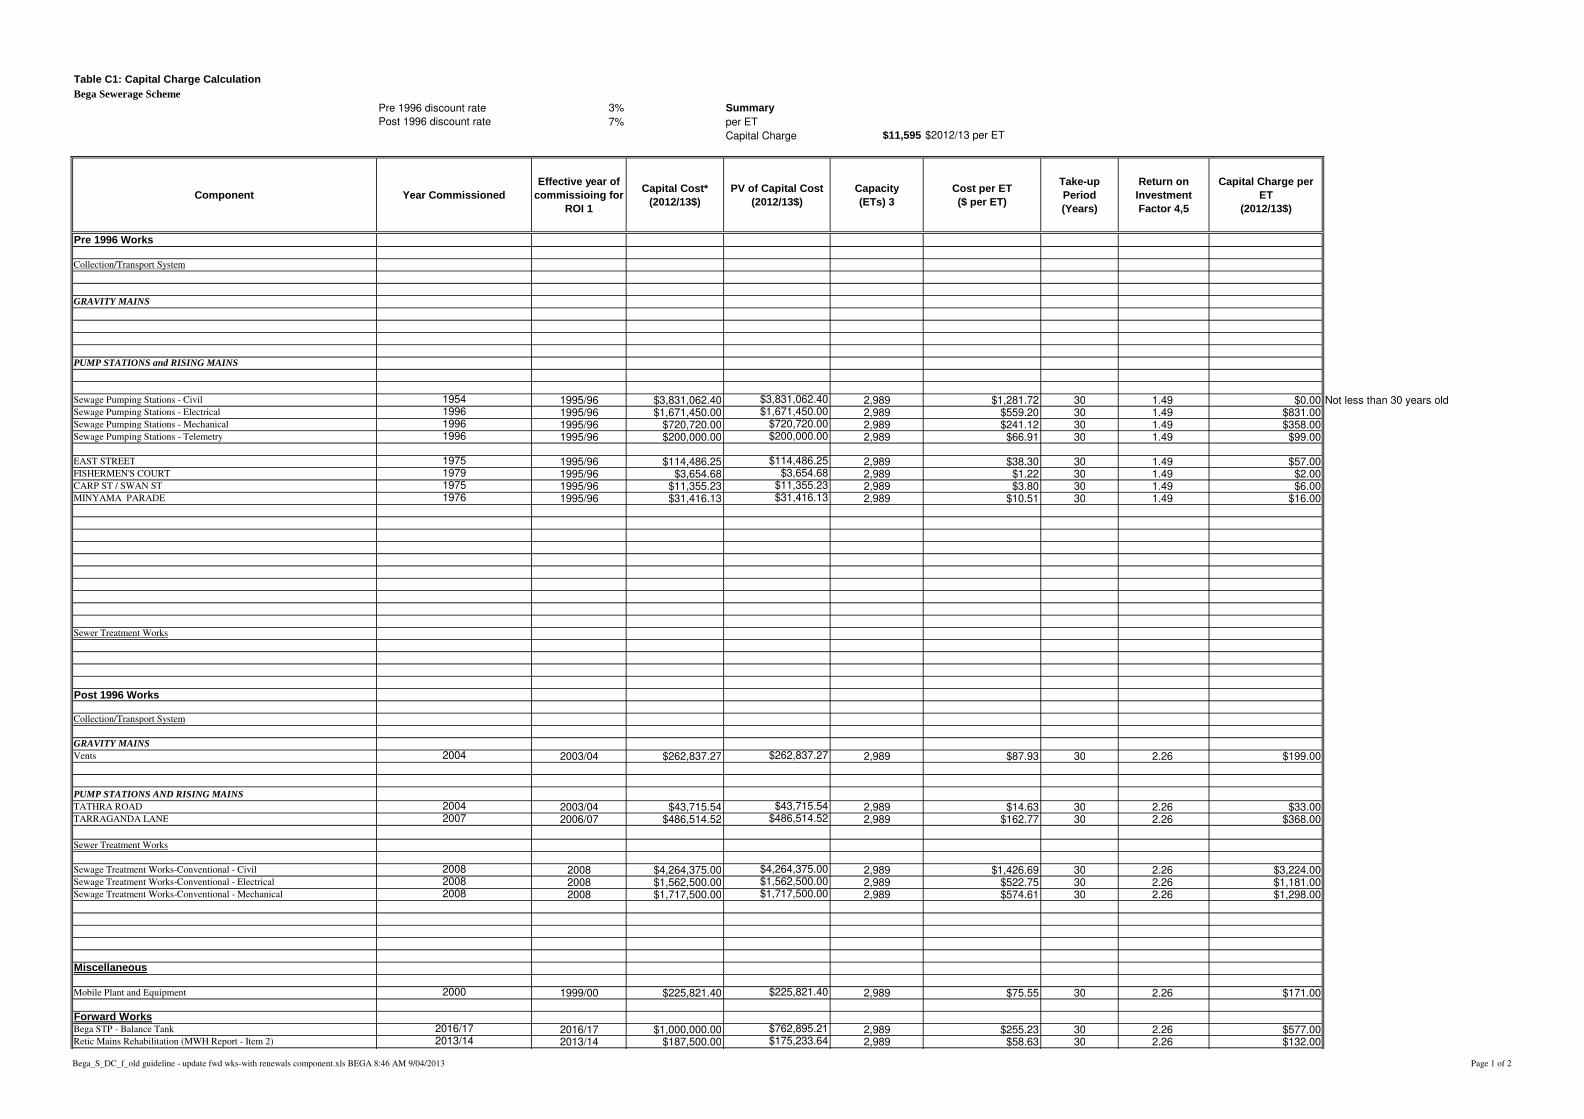
Table C1: Capital Charge CalculationBega Sewerage Scheme
Pre 1996 discount rate 3% SummaryPost 1996 discount rate 7% per ET
Capital Charge $11,595 $2012/13 per ET
Component Year CommissionedEffective year of
commissioing for ROI 1
Capital Cost*(2012/13$)
PV of Capital Cost (2012/13$)
Capacity(ETs) 3
Cost per ET($ per ET)
Take-up Period(Years)
Return on Investment Factor 4,5
Capital Charge per ET
(2012/13$)
Pre 1996 Works
Collection/Transport System
GRAVITY MAINS
PUMP STATIONS and RISING MAINS
Sewage Pumping Stations - Civil 1954 1995/96 $3,831,062.40 $3,831,062.40 2,989 $1,281.72 30 1.49 $0.00 Not less than 30 years oldSewage Pumping Stations - Electrical 1996 1995/96 $1,671,450.00 $1,671,450.00 2,989 $559.20 30 1.49 $831.00Sewage Pumping Stations - Mechanical 1996 1995/96 $720,720.00 $720,720.00 2,989 $241.12 30 1.49 $358.00Sewage Pumping Stations - Telemetry 1996 1995/96 $200,000.00 $200,000.00 2,989 $66.91 30 1.49 $99.00
EAST STREET 1975 1995/96 $114,486.25 $114,486.25 2,989 $38.30 30 1.49 $57.00FISHERMEN'S COURT 1979 1995/96 $3,654.68 $3,654.68 2,989 $1.22 30 1.49 $2.00CARP ST / SWAN ST 1975 1995/96 $11,355.23 $11,355.23 2,989 $3.80 30 1.49 $6.00MINYAMA PARADE 1976 1995/96 $31,416.13 $31,416.13 2,989 $10.51 30 1.49 $16.00
Sewer Treatment Works
Post 1996 Works
Collection/Transport System
GRAVITY MAINSVents 2004 2003/04 $262,837.27 $262,837.27 2,989 $87.93 30 2.26 $199.00
PUMP STATIONS AND RISING MAINSTATHRA ROAD 2004 2003/04 $43,715.54 $43,715.54 2,989 $14.63 30 2.26 $33.00TARRAGANDA LANE 2007 2006/07 $486,514.52 $486,514.52 2,989 $162.77 30 2.26 $368.00
Sewer Treatment Works
Sewage Treatment Works-Conventional - Civil 2008 2008 $4,264,375.00 $4,264,375.00 2,989 $1,426.69 30 2.26 $3,224.00Sewage Treatment Works-Conventional - Electrical 2008 2008 $1,562,500.00 $1,562,500.00 2,989 $522.75 30 2.26 $1,181.00Sewage Treatment Works-Conventional - Mechanical 2008 2008 $1,717,500.00 $1,717,500.00 2,989 $574.61 30 2.26 $1,298.00
Miscellaneous
Mobile Plant and Equipment 2000 1999/00 $225,821.40 $225,821.40 2,989 $75.55 30 2.26 $171.00
Forward WorksBega STP - Balance Tank 2016/17 2016/17 $1,000,000.00 $762,895.21 2,989 $255.23 30 2.26 $577.00Retic Mains Rehabilitation (MWH Report - Item 2) 2013/14 2013/14 $187,500.00 $175,233.64 2,989 $58.63 30 2.26 $132.00
Bega_S_DC_f_old guideline - update fwd wks-with renewals component.xls BEGA 8:46 AM 9/04/2013 Page 1 of 2

Table C1: Capital Charge CalculationBega Sewerage Scheme
Pre 1996 discount rate 3% SummaryPost 1996 discount rate 7% per ET
Capital Charge $11,595 $2012/13 per ET
Component Year CommissionedEffective year of
commissioing for ROI 1
Capital Cost*(2012/13$)
PV of Capital Cost (2012/13$)
Capacity(ETs) 3
Cost per ET($ per ET)
Take-up Period(Years)
Return on Investment Factor 4,5
Capital Charge per ET
(2012/13$)
Retic Mains Rehabilitation (MWH Report - Item 2) 2014/15 2014/15 $187,500.00 $163,769.76 2,989 $54.79 30 2.26 $124.00Retic Mains Rehabilitation (MWH Report - Item 2) 2015/16 2015/16 $187,500.00 $153,055.85 2,989 $51.21 30 2.26 $116.00Retic Mains Rehabilitation (MWH Report - Item 2) 2016/17 2016/17 $187,500.00 $143,042.85 2,989 $47.86 30 2.26 $108.00Retic Mains Rehabilitation (MWH Report - Item 2) 2017/18 2017/18 $187,500.00 $133,684.91 2,989 $44.73 30 2.26 $101.00Retic Mains Rehabilitation (MWH Report - Item 2) 2018/19 2018/19 $187,500.00 $124,939.17 2,989 $41.80 30 2.26 $94.00Retic Mains Rehabilitation (MWH Report - Item 2) 2019/20 2019/20 $187,500.00 $116,765.58 2,989 $39.07 30 2.26 $88.00Retic Mains Rehabilitation (MWH Report - Item 2) 2020/21 2020/21 $187,500.00 $109,126.71 2,989 $36.51 30 2.26 $82.00Retic Mains Rehabilitation (MWH Report - Item 2) 2021/22 2021/22 $187,500.00 $101,987.58 2,989 $34.12 30 2.26 $77.00Retic Mains Rehabilitation (MWH Report - Item 2) 2022/23 2022/23 $187,500.00 $95,315.49 2,989 $31.89 30 2.26 $72.00MH4 - SPS 4 - Sewer Main Upsize(Item 6) 2014/15 2014/15 $59,500.00 $51,969.60 2,989 $17.39 30 2.26 $39.000.4ML Storage at MH255 (Item 8) 2014/15 2014/15 $1,280,000.00 $1,118,001.57 2,989 $374.04 30 2.26 $845.00North Bega Sewerage - Pre-construction 2021/22 2021/22 $0.00 $0.00 2,989 $0.00 30 2.26 $0.00North Bega Sewerage - Pre-construction 2022/23 2022/23 $0.00 $0.00 2,989 $0.00 30 2.26 $0.00North Bega Sewerage (treated at Bega STP) 2022/23 2022/23 $0.00 $0.00 2,989 $0.00 30 2.26 $0.00North Bega Sewerage (treated at Bega STP) 2023/24 2023/24 $0.00 $0.00 2,989 $0.00 30 2.26 $0.00Tarraganda Sewerage - Pre-construction activities 2019/20 2019/20 $0.00 $0.00 2,989 $0.00 30 2.26 $0.00Tarraganda Sewerage - Pre-construction activities 2020/21 2020/21 $0.00 $0.00 2,989 $0.00 30 2.26 $0.00Tarraganda Sewerage 2021/22 2021/22 $0.00 $0.00 2,989 $0.00 30 2.26 $0.00Tarraganda Sewerage 2022/23 2022/23 $0.00 $0.00 2,989 $0.00 30 2.26 $0.00 $0.00Renewal component 2013/14 $604,000.00 2,989 $202.07 30 2.26 $457.00
Bega - Sewer Mains 2024/25 2024/25 $2,000,000.00 $888,023.92 2,989 $297.10 30 2.26 $671.00
Sludge Management - All Schemes 2016/17 2016/17 $2,000,000.00 $1,525,790.42 22,000 $69.35 30 2.26 $157.00Developemt Servicing Strategy, DSP & SBP 2013/14 2013/14 $125,000.00 $116,822.43 22,000 $5.31 30 2.26 $12.00
Total $23,486,908.44 $21,531,833.14 $5,323 $11,595.00
Rate of return (pre 1996)Rate of return (post 1996)Discount RateYear Now
1. For pre-1996 assets, the effective year of commissioning for calculating Return on Investment (ROI) factors is January 1996, ie: 1995/96.
4. The ROI factor for pre-1996 works is based on a rate of return (discount rate) of 3% pa real. The ROI factor assumes a uniform annual take-up of lots over the take-up period, commencing in the effective year of commissioning of the asset.
5. The ROI factor for post-1996 assets is based on a rate of return (discount rate) of 7% pa real, together with a uniform annual take-up of lots over the take-up period, commencing in the year of commissioning of the asset.
* Current Replacement Costs are based on "NSW Reference Rates for Valuation of Water Supply, Sewerage and Stormwater Assets", Ministry of Energy and Utilities, June 2003", adjusted to Year Now dollars
Bega_S_DC_f_old guideline - update fwd wks-with renewals component.xls BEGA 8:46 AM 9/04/2013 Page 2 of 2

Table C2: Capital Charge CalculationBermagui-Wallaga Lake Sewerage Scheme
Pre 1996 discount rate 3% SummaryPost 1996 discount rate 7% per ET
Capital Charge $27,374 $2012/13 per ET
Component Year CommissionedEffective year of
commissioing for ROI 1
Capital Cost*(2012/13$)
PV of Capital Cost (2012/13$)
Capacity(ETs) 3
Cost per ET($ per ET)
Take-up Period(Years)
Return on Investment Factor 4,5
Capital Charge per ET
(2012/13$)
Pre 1996 Works
Collection/Transport System
GRAVITY MAINS
PUMP STATIONS and RISING MAINS
BUNGA STREET - Civil 1975 $180,487.00 $180,487.00 1,930 $93.52 30 1.49 $0.00TUROSS STREET - Civil 1975 $65,688.00 $65,688.00 1,930 $34.04 30 1.49 $0.00WEST STREET - Civil 1975 $61,005.00 $61,005.00 1,930 $31.61 30 1.49 $0.00OPP 58 WALLAGA LAKE Rd - Civil 1975 $42,210.00 $42,210.00 1,930 $21.87 30 1.49 $0.00STP Outfall - Civil 1975 $87,570.00 $87,570.00 1,930 $45.37 30 1.49 $0.00WALLAGA LAKE RD / GINN ST - Civil 1981 $51,601.20 $51,601.20 1,930 $26.74 30 1.49 $0.00HAY STREET - Civil 1989 $61,005.00 $61,005.00 1,930 $31.61 30 1.49 $47.00TILLABUDGERY COURT - Civil 1991 $51,601.20 $51,601.20 1,930 $26.74 30 1.49 $40.00OCEAN VIEW DRIVE - Civil 1992 $56,515.60 $56,515.60 1,930 $29.28 30 1.49 $44.00
MILL STREET 1975 1995/96 $346,189.16 $346,189.16 1,930 $179.37 30 1.49 $267.00STP OUTFALL 1974 1995/96 $184,115.63 $184,115.63 1,930 $95.40 30 1.49 $142.00WALLAGA LAKE ROAD 1981 1995/96 $99,364.21 $99,364.21 1,930 $51.48 30 1.49 $77.00TUROSS / MURRAH STREETS 1975 1995/96 $149,741.48 $149,741.48 1,930 $77.59 30 1.49 $115.00LAMONT STREET 1975 1995/96 $122,690.48 $122,690.48 1,930 $63.57 30 1.49 $94.00VALLEY ST - KIRKLAND AVE 1975 1995/96 $49,016.73 $49,016.73 1,930 $25.40 30 1.49 $38.00WALLAGA LAKE ROAD 1975 1995/96 $47,313.45 $47,313.45 1,930 $24.51 30 1.49 $36.00TUROSS STREET 1975 1995/96 $12,308.95 $12,308.95 1,930 $6.38 30 1.49 $9.00HAY STREET 1989 1995/96 $205,958.80 $205,958.80 1,930 $106.71 30 1.49 $159.00TILLABUDGERY COURT 1991 1995/96 $1,417.54 $1,417.54 1,930 $0.73 30 1.49 $1.00TILLABUDGERY COURT 1991 1995/96 $361,189.39 $361,189.39 1,930 $187.14 30 1.49 $278.00GOLF COURSE 1993 1995/96 $142,659.51 $142,659.51 1,930 $73.92 30 1.49 $110.00
Sewer Treatment Works
Post 1996 Works
Collection/Transport System
GRAVITY MAINSVents 2003 2002/03 $73,273.65 $73,273.65 1,930 $37.97 30 2.26 $86.00
PUMP STATIONS AND RISING MAINSPressure Sewer - Property Components 2008 2007/08 $3,918,840.00 $3,918,840.00 1,930 $2,030.49 30 2.26 $0.00Pressure Sewer - Discharge Lines 2008 2007/08 $1,302,709.46 $1,302,709.46 1,930 $674.98 30 2.26 $1,525.00
Bega_S_DC_f_old guideline - update fwd wks-with renewals component.xls BERMAGUI 8:50 AM 9/04/2013 Page 1 of 2

Table C2: Capital Charge CalculationBermagui-Wallaga Lake Sewerage Scheme
Pre 1996 discount rate 3% SummaryPost 1996 discount rate 7% per ET
Capital Charge $27,374 $2012/13 per ET
Component Year CommissionedEffective year of
commissioing for ROI 1
Capital Cost*(2012/13$)
PV of Capital Cost (2012/13$)
Capacity(ETs) 3
Cost per ET($ per ET)
Take-up Period(Years)
Return on Investment Factor 4,5
Capital Charge per ET
(2012/13$)
Pressure Sewer - Main Components 2008 2007/08 $72,000.00 $72,000.00 1,930 $37.31 30 2.26 $84.00Pressure Sewer - Main Pipes 2008 2007/08 $1,452,498.89 $1,452,498.89 1,930 $752.59 30 2.26 $1,700.00WALLAGA LAKE RD FAIRHAVEN - civil 2009 2008/09 $84,442.50 $84,442.50 1,930 $43.75 30 2.26 $99.00Sewage Pumping Stations - Electrical 2005 2004/05 $2,013,000.00 $2,013,000.00 1,930 $1,043.01 30 2.26 $2,357.00Sewage Pumping Stations - Mechanical 2006 2005/06 $943,800.00 $943,800.00 1,930 $489.02 30 2.26 $1,105.00Sewage Pumping Stations - Telemetry 2003 2002/03 $250,000.00 $250,000.00 1,930 $129.53 30 2.26 $293.00LAMONT ST 2003 2002/03 $126,817.56 $126,817.56 1,930 $65.71 30 2.26 $148.00MILL STREET 2007 2006/07 $107,517.02 $107,517.02 1,930 $55.71 30 2.26 $126.00BERMAGUI 2008 2007/08 $1,801,785.96 $1,801,785.96 1,930 $933.57 30 2.26 $2,109.00
Sewer Treatment Works
Sewage Treatment Works-Conventional - Civil 1999 1998/99 $5,847,500.00 $5,847,500.00 1,930 $3,029.79 30 2.26 $6,846.00Sewage Treatment Works-Conventional - Electrical 2008 2007/08 $1,250,000.00 $1,250,000.00 1,930 $647.67 30 2.26 $1,463.00Sewage Treatment Works-Conventional - Mechancial 2007 2006/07 $1,175,000.00 $1,175,000.00 1,930 $608.81 30 2.26 $1,376.00
Miscellaneous
Mobile Plant and Equipment 2003 2002/03 $183,244.92 $183,244.92 1,930 $94.95 30 2.26 $215.00
Forward WorksBermagui STP upgrade - Balance Tank 2014/15 2014/15 $500,000.00 $436,719.36 1,930 $226.28 30 2.26 $511.00Bermagui STP - Effluent Reuse 2017/18 2017/18 $2,000,000.00 $1,425,972.36 1,930 $738.85 30 2.26 $1,669.00Effluent Disposal - Ocean outfall 2015/16 2015/16 $4,000,000.00 $3,265,191.51 1,930 $1,691.81 30 2.26 $3,823.00Renewals Component $263,000.00 1,930 $136.27 30 2.26 $308.00
Sludge Management - All Schemes 2016/17 2016/17 $2,000,000.00 $1,525,790.42 22,000 $69.35 30 1.00 $69.00Developemt Servicing Strategy, DSP & SBP 2013/14 2013/14 $125,000.00 $116,822.43 22,000 $5.31 30 1.00 $5.00
Total $31,607,078.29 $30,015,574.37 $14,565 $27,374.00
Rate of return (pre 1996)Rate of return (post 1996)Discount RateYear Now
1. For pre-1996 assets, the effective year of commissioning for calculating Return on Investment (ROI) factors is January 1996, ie: 1995/96.4. The ROI factor for pre-1996 works is based on a rate of return (discount rate) of 3% pa real. The ROI factor assumes a uniform annual take-up of lots over the take-up period, commencing in the effective year of commissioning of the asset.5. The ROI factor for post-1996 assets is based on a rate of return (discount rate) of 7% pa real, together with a uniform annual take-up of lots over the take-up period, commencing in the year of commissioning of the asset.
* Current Replacement Costs are based on "NSW Reference Rates for Valuation of Water Supply, Sewerage and Stormwater Assets", Ministry of Energy and Utilities, June 2003", adjusted to Year Now dollars
Bega_S_DC_f_old guideline - update fwd wks-with renewals component.xls BERMAGUI 8:50 AM 9/04/2013 Page 2 of 2

Table C3: Capital Charge CalculationCandelo Sewerage Scheme
Pre 1996 discount rate 3% SummaryPost 1996 discount rate 7% per ET
Capital Charge $109,474 $2012/13 per ET
Component Year CommissionedEffective year of
commissioing for ROI 1
Capital Cost*(2012/13$)
PV of Capital Cost (2012/13$)
Capacity(ETs) 3
Cost per ET($ per ET)
Take-up Period(Years)
Return on Investment Factor 4,5
Capital Charge per ET
(2012/13$)
Pre 1996 Works
Collection/Transport System
GRAVITY MAINS
PUMP STATIONS and RISING MAINS
Sewer Treatment Works
Post 1996 Works
Collection/Transport System
GRAVITY MAINS
PUMP STATIONS AND RISING MAINSPressure Sewer - Property Components 2007 2006/07 $2,095,960.00 $2,095,960.00 191 $10,973.61 30 2.26 $0.00Pressure Sewer - Discharge Lines 2007 2006/07 $431,079.53 $431,079.53 191 $2,256.96 30 2.26 $5,099.00Pressure Sewer - Main Components 2007 2006/07 $114,000.00 $114,000.00 191 $596.86 30 2.26 $1,349.00Pressure Sewer - Main Pipes 2007 2006/07 $1,146,818.23 $1,146,818.23 191 $6,004.28 30 2.26 $13,566.00
Sewer Treatment Works
Sewage Treatment Works-MBR - Civil 2006 2005/06 $3,238,848.41 $3,238,848.41 191 $16,957.32 30 2.26 $38,314.00Sewage Treatment Works-MBR - Electrical 2006 2005/06 $2,294,184.29 $2,294,184.29 191 $12,011.44 30 2.26 $27,139.00Sewage Treatment Works-MBR - Mechancial 2006 2005/06 $1,012,140.13 $1,012,140.13 191 $5,299.16 30 2.26 $11,973.00Sewage Treatment Works-MBR - Telemetry 2006 2005/06 $202,428.03 $202,428.03 191 $1,059.83 30 2.26 $2,395.00Reuse - Civil 2006 2005/06 $388,061.12 $388,061.12 191 $2,031.73 30 2.26 $4,591.00Reuse - Electrical 2006 2005/06 $274,876.63 $274,876.63 191 $1,439.14 30 2.26 $3,252.00Reuse - Mechancial 2006 2005/06 $121,269.10 $121,269.10 191 $634.92 30 2.26 $1,435.00Reuse - Telemetry 2006 2005/06 $24,253.82 $24,253.82 191 $126.98 30 2.26 $287.00
Miscellaneous
Forward WorksSludge Management - All Schemes 2016/17 2016/17 $2,000,000.00 $1,525,790.42 22,000 $69.35 30 1.00 $69.00Developemt Servicing Strategy, DSP & SBP 2013/14 2013/14 $125,000.00 $116,822.43 22,000 $5.31 30 1.00 $5.00
Total $13,468,919.29 $12,986,532.14 $59,467 $109,474.00
1. For pre-1996 assets, the effective year of commissioning for calculating Return on Investment (ROI) factors is January 1996, ie: 1995/96.
4. The ROI factor for pre-1996 works is based on a rate of return (discount rate) of 3% pa real. The ROI factor assumes a uniform annual take-up of lots over the take-up period, commencing in the effective year of commissioning of the a
5. The ROI factor for post-1996 assets is based on a rate of return (discount rate) of 7% pa real, together with a uniform annual take-up of lots over the take-up period, commencing in the year of commissioning of the asset.
* Current Replacement Costs are based on "NSW Reference Rates for Valuation of Water Supply, Sewerage and Stormwater Assets", Ministry of Energy and Utilities, June 2003", adjusted to Year Now dollars
Bega_S_DC_f_old guideline - update fwd wks-with renewals component.xls CANDELO 8:57 AM 9/04/2013 Page 1 of 1

Table C4.: Capital Charge CalculationCobargo Sewerage Scheme
Pre 1996 discount rate 3% SummaryPost 1996 discount rate 7% per ET
Capital Charge $82,792 $2012/13 per ET
Component Year CommissionedEffective year of
commissioing for ROI 1
Capital Cost*(2012/13$)
PV of Capital Cost (2012/13$)
Capacity(ETs) 3
Cost per ET($ per ET)
Take-up Period(Years)
Return on Investment Factor 4,5
Capital Charge per ET
(2012/13$)
Pre 1996 Works
Collection/Transport System
GRAVITY MAINS
PUMP STATIONS and RISING MAINS
Sewer Treatment Works
Post 1996 Works
Collection/Transport System
GRAVITY MAINS
PUMP STATIONS AND RISING MAINSPressure Sewer - Property Components 2006 2005/06 $3,028,720.00 $3,028,720.00 278 $10,894.68 30 2.26 $0.00Pressure Sewer - Discharge Lines 2006 2005/06 $649,276.89 $649,276.89 278 $2,335.53 30 2.26 $5,277.00Pressure Sewer - Main Components 2006 2005/06 $71,000.00 $71,000.00 278 $255.40 30 2.26 $577.00Pressure Sewer - Main Pipes 2006 2005/06 $997,410.00 $997,410.00 278 $3,587.81 30 2.26 $8,106.00
Sewer Treatment Works
Sewage Treatment Works-MBR - Civil 2005 2004/05 $3,654,206.51 $3,654,206.51 278 $13,144.63 30 2.26 $29,699.00Sewage Treatment Works-MBR - Electrical 2005 2004/05 $2,588,396.28 $2,588,396.28 278 $9,310.78 30 2.26 $21,037.00Sewage Treatment Works-MBR - Mechancial 2005 2004/05 $1,141,939.53 $1,141,939.53 278 $4,107.70 30 2.26 $9,281.00Sewage Treatment Works-MBR - Telemetry 2005 2004/05 $228,387.91 $228,387.91 278 $821.54 30 2.26 $1,856.00Reuse - Civil 2005 2004/05 $406,579.41 $406,579.41 278 $1,462.52 30 2.26 $3,304.00Reuse - Electrical 2005 2004/05 $287,993.75 $287,993.75 278 $1,035.95 30 2.26 $2,341.00Reuse - Mechancial 2005 2004/05 $127,056.07 $127,056.07 278 $457.04 30 2.26 $1,033.00Reuse - Telemetry 2005 2004/05 $25,411.21 $25,411.21 278 $91.41 30 2.26 $207.00
Miscellaneous
Forward WorksSludge Management - All Schemes 2016/17 2016/17 $2,000,000.00 $1,525,790.42 22,000 $69.35 30 1.00 $69.00Developemt Servicing Strategy, DSP & SBP 2013/14 2013/14 $125,000.00 $116,822.43 22,000 $5.31 30 1.00 $5.00
Total $15,331,377.55 $14,848,990.41 $47,580 $82,792.00
1. For pre-1996 assets, the effective year of commissioning for calculating Return on Investment (ROI) factors is January 1996, ie: 1995/96.
4. The ROI factor for pre-1996 works is based on a rate of return (discount rate) of 3% pa real. The ROI factor assumes a uniform annual take-up of lots over the take-up period, commencing in the effective year of commissioning of the a
5. The ROI factor for post-1996 assets is based on a rate of return (discount rate) of 7% pa real, together with a uniform annual take-up of lots over the take-up period, commencing in the year of commissioning of the asset.
* Current Replacement Costs are based on "NSW Reference Rates for Valuation of Water Supply, Sewerage and Stormwater Assets", Ministry of Energy and Utilities, June 2003", adjusted to Year Now dollars
Bega_S_DC_f_old guideline - update fwd wks-with renewals component.xls COBARGO 8:56 AM 9/04/2013 Page 1 of 1

Table C5: Capital Charge CalculationEden Sewerage Scheme
Pre 1996 discount rate 3% SummaryPost 1996 discount rate 7% per ET
Capital Charge $23,679 $2012/13 per ET
Component Year CommissionedEffective year of
commissioing for ROI 1
Capital Cost*(2012/13$)
PV of Capital Cost (2012/13$)
Capacity(ETs) 3
Cost per ET($ per ET)
Take-up Period(Years)
Return on Investment Factor 4,5
Capital Charge per ET
(2012/13$)
Pre 1996 Works
Collection/Transport System
GRAVITY MAINS
PUMP STATIONS and RISING MAINSSewer Mains - Rising 1988 1995/96 $5,320,349.12 $5,320,349.12 2,470 $2,153.99 30 1.49 $3,201.00Sewage Pumping Stations - Civil 1986 1995/96 $4,815,122.53 $4,815,122.53 2,470 $1,949.44 30 1.49 $2,897.00Sewage Pumping Stations - Telemetry 1995 1995/96 $280,000.00 $280,000.00 2,470 $113.36 30 1.49 $168.00
LAKESIDE DRIVE 1971 1995/96 $404,925.64 $404,925.64 2,470 $163.94 30 1.49 $244.00CATTLE BAY ROAD 1971 1995/96 $142,271.17 $142,271.17 2,470 $57.60 30 1.49 $86.00FISHERMEN'S COURT 1979 1995/96 $3,654.68 $3,654.68 2,470 $1.48 30 1.49 $0.00 Not less than 30 years oldMUSEUM/CALLE CALLE ST 1986 1995/96 $183,614.93 $183,614.93 2,470 $74.34 30 1.49 $110.00NICHOLSON/WEST 1986 1995/96 $1,017,946.04 $1,017,946.04 2,470 $412.12 30 1.49 $612.00RESERVOIR STREET 1986 1995/96 $910,691.52 $910,691.52 2,470 $368.70 30 1.49 $548.00IDA RODD DR/PHILLIPPS ST 1987 1995/96 $11,756.83 $11,756.83 2,470 $4.76 30 1.49 $7.00IDA RODD DR/PHILLIPPS ST 1987 1995/96 $79,529.29 $79,529.29 2,470 $32.20 30 1.49 $48.00
Sewer Treatment Works
Sewage Treatment Works-Conventional - Civil 1989 1995/96 $4,668,500.00 $4,668,500.00 2,470 $1,890.08 30 1.49 $2,809.00Sewage Treatment Works-Conventional - Electrical 1992 1995/96 $1,600,000.00 $1,600,000.00 2,470 $647.77 30 1.49 $963.00
Post 1996 Works
Collection/Transport System
GRAVITY MAINSVents 2003 2002/03 $81,474.34 $81,474.34 2,470 $32.99 30 2.26 $75.00
PUMP STATIONS AND RISING MAINSSewage Pumping Stations - Electrical 1998 1997/98 $2,286,900.00 $2,286,900.00 2,470 $925.87 30 2.26 $2,092.00Sewage Pumping Stations - Mechanical 2000 1999/00 $1,289,310.00 $1,289,310.00 2,470 $521.99 30 2.26 $1,179.00
KB TIMMS DR 2002 2001/02 $95,628.05 $95,628.05 2,470 $38.72 30 2.26 $87.00GOVERNMENT RD 2002 2001/02 $276,623.08 $276,623.08 2,470 $111.99 30 2.26 $253.00GOVERNMENT RD 2005 2004/05 $152,654.80 $152,654.80 2,470 $61.80 30 2.26 $140.00GOVERNMENT RD 2005 2004/05 $233,089.15 $233,089.15 2,470 $94.37 30 2.26 $213.00ALBERT TERR/MUSEUM ST 2006 2005/06 $7,768.10 $7,768.10 2,470 $3.14 30 2.26 $7.00IMLAY ST/ALBERT TERR 2006 2005/06 $171,075.79 $171,075.79 2,470 $69.26 30 2.26 $156.00IMLAY ST/ALBERT TERRACE 2006 2005/06 $140,523.18 $140,523.18 2,470 $56.89 30 2.26 $129.00MUSEUM ST 2008 2007/08 $548.20 $548.20 2,470 $0.22 30 2.26 $1.00BARCLAY STREET 2008 2007/08 $5,114.32 $5,114.32 2,470 $2.07 30 2.26 $5.00MUSEUM ST/CALLE CALLE ST 2008 2007/08 $274,310.90 $274,310.90 2,470 $111.06 30 2.26 $251.00IDA RODD DR/ANDREA ST 2010 2009/10 $117,315.38 $117,315.38 2,470 $47.50 30 2.26 $107.00
Sewer Treatment Works
Sewage Treatment Works-Conventional - Mechanical 2005 2004/05 $2,634,375.00 $2,634,375.00 2,470 $1,066.55 30 2.26 $2,410.00
Miscellaneous
Mobile Plant and Equipment 2003 2002/03 $185,768.28 $185,768.28 2,470 $75.21 30 2.26 $170.00
Forward WorksEden - Effluent disinfection 2012/13 2012/13 $1,500,000.00 $1,500,000.00 2,470 $607.29 30 2.26 $1,372.00Eden - Effluent disinfection 2013/14 2013/14 $500,000.00 $467,289.72 2,470 $189.19 30 2.26 $427.00Retic Mains Rehabilitation (MWH Report) 2014/15 2014/15 $153,750.00 $134,291.20 2,470 $54.37 30 2.26 $123.00Retic Mains Rehabilitation (MWH Report) 2014/15 2014/15 $153,750.00 $134,291.20 2,470 $54.37 30 2.26 $123.00Retic Mains Rehabilitation (MWH Report) 2015/16 2015/16 $153,750.00 $125,505.80 2,470 $50.81 30 2.26 $115.00
Bega_S_DC_f_old guideline - update fwd wks-with renewals component.xls EDEN 9:04 AM 9/04/2013 Page 1 of 2

Table C5: Capital Charge CalculationEden Sewerage Scheme
Pre 1996 discount rate 3% SummaryPost 1996 discount rate 7% per ET
Capital Charge $23,679 $2012/13 per ET
Component Year CommissionedEffective year of
commissioing for ROI 1
Capital Cost*(2012/13$)
PV of Capital Cost (2012/13$)
Capacity(ETs) 3
Cost per ET($ per ET)
Take-up Period(Years)
Return on Investment Factor 4,5
Capital Charge per ET
(2012/13$)
Retic Mains Rehabilitation (MWH Report) 2016/17 2016/17 $153,750.00 $117,295.14 2,470 $47.49 30 2.26 $107.00Retic Mains Rehabilitation (MWH Report) 2017/18 2017/18 $153,750.00 $109,621.63 2,470 $44.38 30 2.26 $100.00Retic Mains Rehabilitation (MWH Report) 2018/19 2018/19 $153,750.00 $102,450.12 2,470 $41.48 30 2.26 $94.00Retic Mains Rehabilitation (MWH Report) 2019/20 2019/20 $153,750.00 $95,747.77 2,470 $38.76 30 2.26 $88.00Retic Mains Rehabilitation (MWH Report) 2020/21 2020/21 $153,750.00 $89,483.90 2,470 $36.23 30 2.26 $82.00Retic Mains Rehabilitation (MWH Report) 2021/22 2021/22 $153,750.00 $83,629.81 2,470 $33.86 30 2.26 $77.00Retic Mains Rehabilitation (MWH Report) 2022/23 2022/23 $153,750.00 $78,158.70 2,470 $31.64 30 2.26 $71.002.1ML Storage at SPS 2 and related works 2014/15 2014/15 $1,795,000.00 $1,567,822.52 2,470 $634.75 30 2.26 $1,434.00Renewals component $463,000.00 2,470 $187.45 30 2.26 $424.00
Sludge Management - All Schemes 2016/17 2016/17 $2,000,000.00 $1,525,790.42 22,000 $69.35 30 1.00 $69.00Developemt Servicing Strategy, DSP & SBP 2013/14 2013/14 $125,000.00 $116,822.43 22,000 $5.31 30 1.00 $5.00
Total $34,848,340.34 $34,102,040.71 $11,886 $23,679.00
1. For pre-1996 assets, the effective year of commissioning for calculating Return on Investment (ROI) factors is January 1996, ie: 1995/96.
4. The ROI factor for pre-1996 works is based on a rate of return (discount rate) of 3% pa real. The ROI factor assumes a uniform annual take-up of lots over the take-up period, commencing in the effective year of commissioning of the asset.
5. The ROI factor for post-1996 assets is based on a rate of return (discount rate) of 7% pa real, together with a uniform annual take-up of lots over the take-up period, commencing in the year of commissioning of the asset.
* Current Replacement Costs are based on "NSW Reference Rates for Valuation of Water Supply, Sewerage and Stormwater Assets", Ministry of Energy and Utilities, June 2003", adjusted to Year Now dollars
Bega_S_DC_f_old guideline - update fwd wks-with renewals component.xls EDEN 9:04 AM 9/04/2013 Page 2 of 2
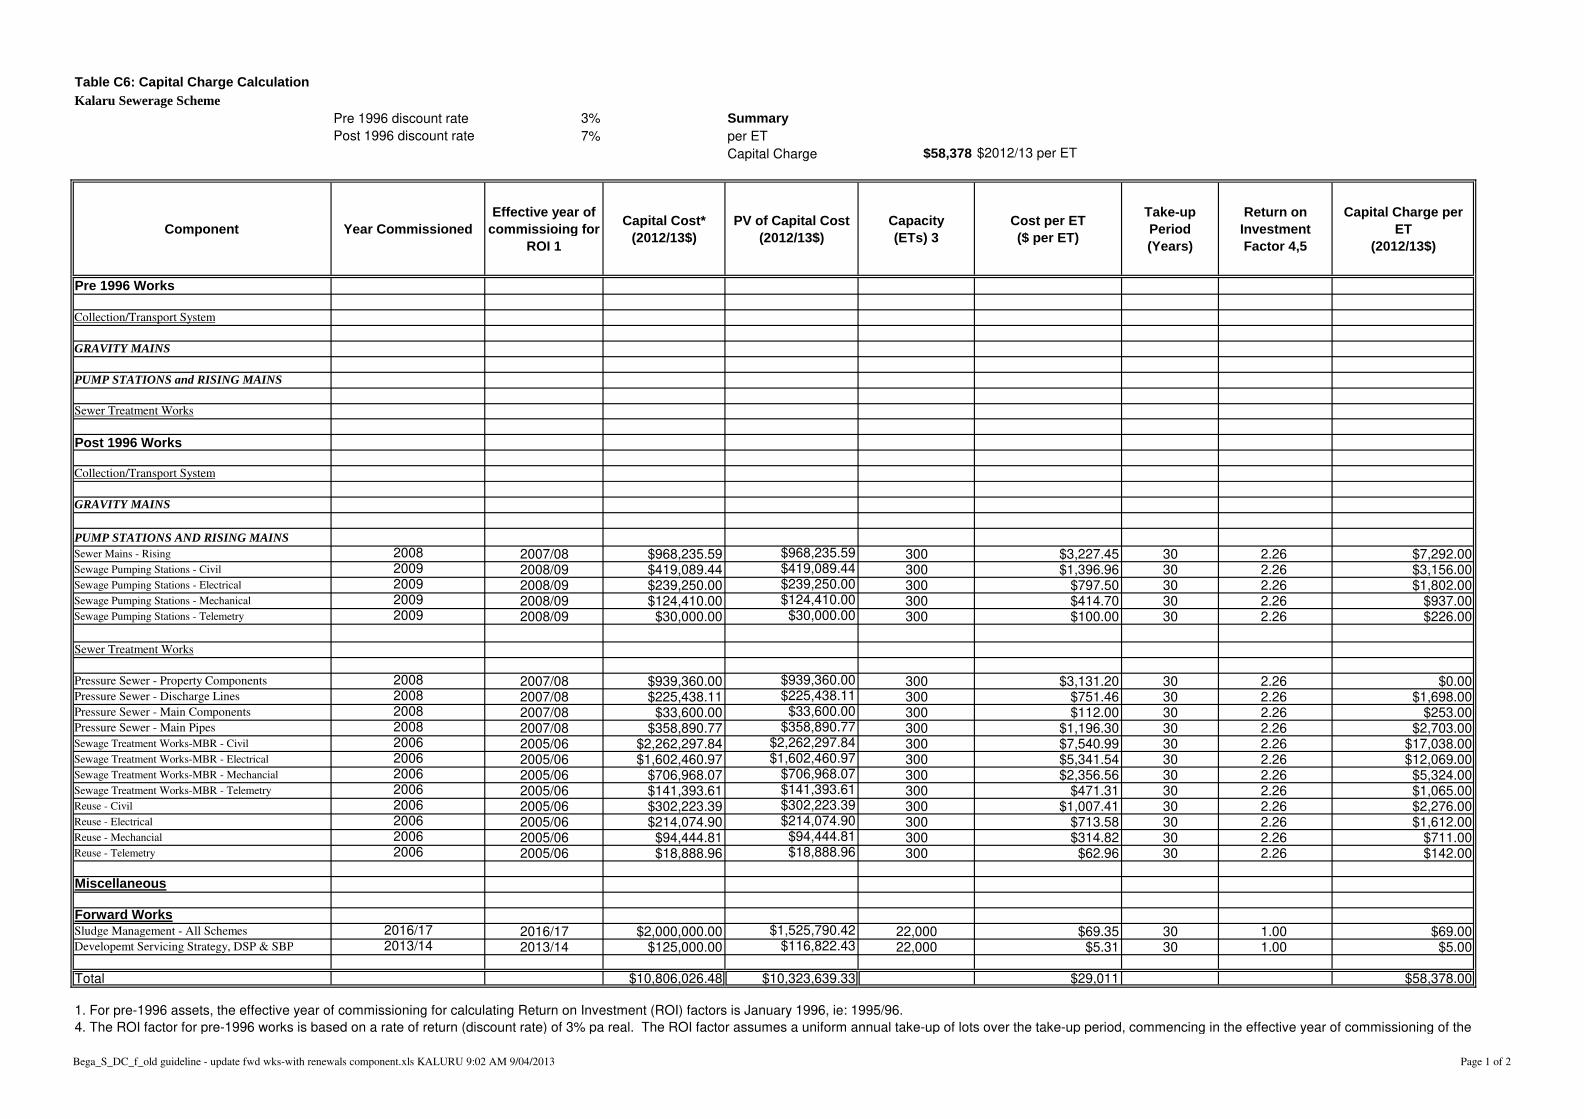
Table C6: Capital Charge CalculationKalaru Sewerage Scheme
Pre 1996 discount rate 3% SummaryPost 1996 discount rate 7% per ET
Capital Charge $58,378 $2012/13 per ET
Component Year CommissionedEffective year of
commissioing for ROI 1
Capital Cost*(2012/13$)
PV of Capital Cost (2012/13$)
Capacity(ETs) 3
Cost per ET($ per ET)
Take-up Period(Years)
Return on Investment Factor 4,5
Capital Charge per ET
(2012/13$)
Pre 1996 Works
Collection/Transport System
GRAVITY MAINS
PUMP STATIONS and RISING MAINS
Sewer Treatment Works
Post 1996 Works
Collection/Transport System
GRAVITY MAINS
PUMP STATIONS AND RISING MAINSSewer Mains - Rising 2008 2007/08 $968,235.59 $968,235.59 300 $3,227.45 30 2.26 $7,292.00Sewage Pumping Stations - Civil 2009 2008/09 $419,089.44 $419,089.44 300 $1,396.96 30 2.26 $3,156.00Sewage Pumping Stations - Electrical 2009 2008/09 $239,250.00 $239,250.00 300 $797.50 30 2.26 $1,802.00Sewage Pumping Stations - Mechanical 2009 2008/09 $124,410.00 $124,410.00 300 $414.70 30 2.26 $937.00Sewage Pumping Stations - Telemetry 2009 2008/09 $30,000.00 $30,000.00 300 $100.00 30 2.26 $226.00
Sewer Treatment Works
Pressure Sewer - Property Components 2008 2007/08 $939,360.00 $939,360.00 300 $3,131.20 30 2.26 $0.00Pressure Sewer - Discharge Lines 2008 2007/08 $225,438.11 $225,438.11 300 $751.46 30 2.26 $1,698.00Pressure Sewer - Main Components 2008 2007/08 $33,600.00 $33,600.00 300 $112.00 30 2.26 $253.00Pressure Sewer - Main Pipes 2008 2007/08 $358,890.77 $358,890.77 300 $1,196.30 30 2.26 $2,703.00Sewage Treatment Works-MBR - Civil 2006 2005/06 $2,262,297.84 $2,262,297.84 300 $7,540.99 30 2.26 $17,038.00Sewage Treatment Works-MBR - Electrical 2006 2005/06 $1,602,460.97 $1,602,460.97 300 $5,341.54 30 2.26 $12,069.00Sewage Treatment Works-MBR - Mechancial 2006 2005/06 $706,968.07 $706,968.07 300 $2,356.56 30 2.26 $5,324.00Sewage Treatment Works-MBR - Telemetry 2006 2005/06 $141,393.61 $141,393.61 300 $471.31 30 2.26 $1,065.00Reuse - Civil 2006 2005/06 $302,223.39 $302,223.39 300 $1,007.41 30 2.26 $2,276.00Reuse - Electrical 2006 2005/06 $214,074.90 $214,074.90 300 $713.58 30 2.26 $1,612.00Reuse - Mechancial 2006 2005/06 $94,444.81 $94,444.81 300 $314.82 30 2.26 $711.00Reuse - Telemetry 2006 2005/06 $18,888.96 $18,888.96 300 $62.96 30 2.26 $142.00
Miscellaneous
Forward WorksSludge Management - All Schemes 2016/17 2016/17 $2,000,000.00 $1,525,790.42 22,000 $69.35 30 1.00 $69.00Developemt Servicing Strategy, DSP & SBP 2013/14 2013/14 $125,000.00 $116,822.43 22,000 $5.31 30 1.00 $5.00
Total $10,806,026.48 $10,323,639.33 $29,011 $58,378.00
1. For pre-1996 assets, the effective year of commissioning for calculating Return on Investment (ROI) factors is January 1996, ie: 1995/96.
4. The ROI factor for pre-1996 works is based on a rate of return (discount rate) of 3% pa real. The ROI factor assumes a uniform annual take-up of lots over the take-up period, commencing in the effective year of commissioning of the a
Bega_S_DC_f_old guideline - update fwd wks-with renewals component.xls KALURU 9:02 AM 9/04/2013 Page 1 of 2

Table C6: Capital Charge CalculationKalaru Sewerage Scheme
Pre 1996 discount rate 3% SummaryPost 1996 discount rate 7% per ET
Capital Charge $58,378 $2012/13 per ET
Component Year CommissionedEffective year of
commissioing for ROI 1
Capital Cost*(2012/13$)
PV of Capital Cost (2012/13$)
Capacity(ETs) 3
Cost per ET($ per ET)
Take-up Period(Years)
Return on Investment Factor 4,5
Capital Charge per ET
(2012/13$)
5. The ROI factor for post-1996 assets is based on a rate of return (discount rate) of 7% pa real, together with a uniform annual take-up of lots over the take-up period, commencing in the year of commissioning of the asset.
* Current Replacement Costs are based on "NSW Reference Rates for Valuation of Water Supply, Sewerage and Stormwater Assets", Ministry of Energy and Utilities, June 2003", adjusted to Year Now dollars
Bega_S_DC_f_old guideline - update fwd wks-with renewals component.xls KALURU 9:02 AM 9/04/2013 Page 2 of 2
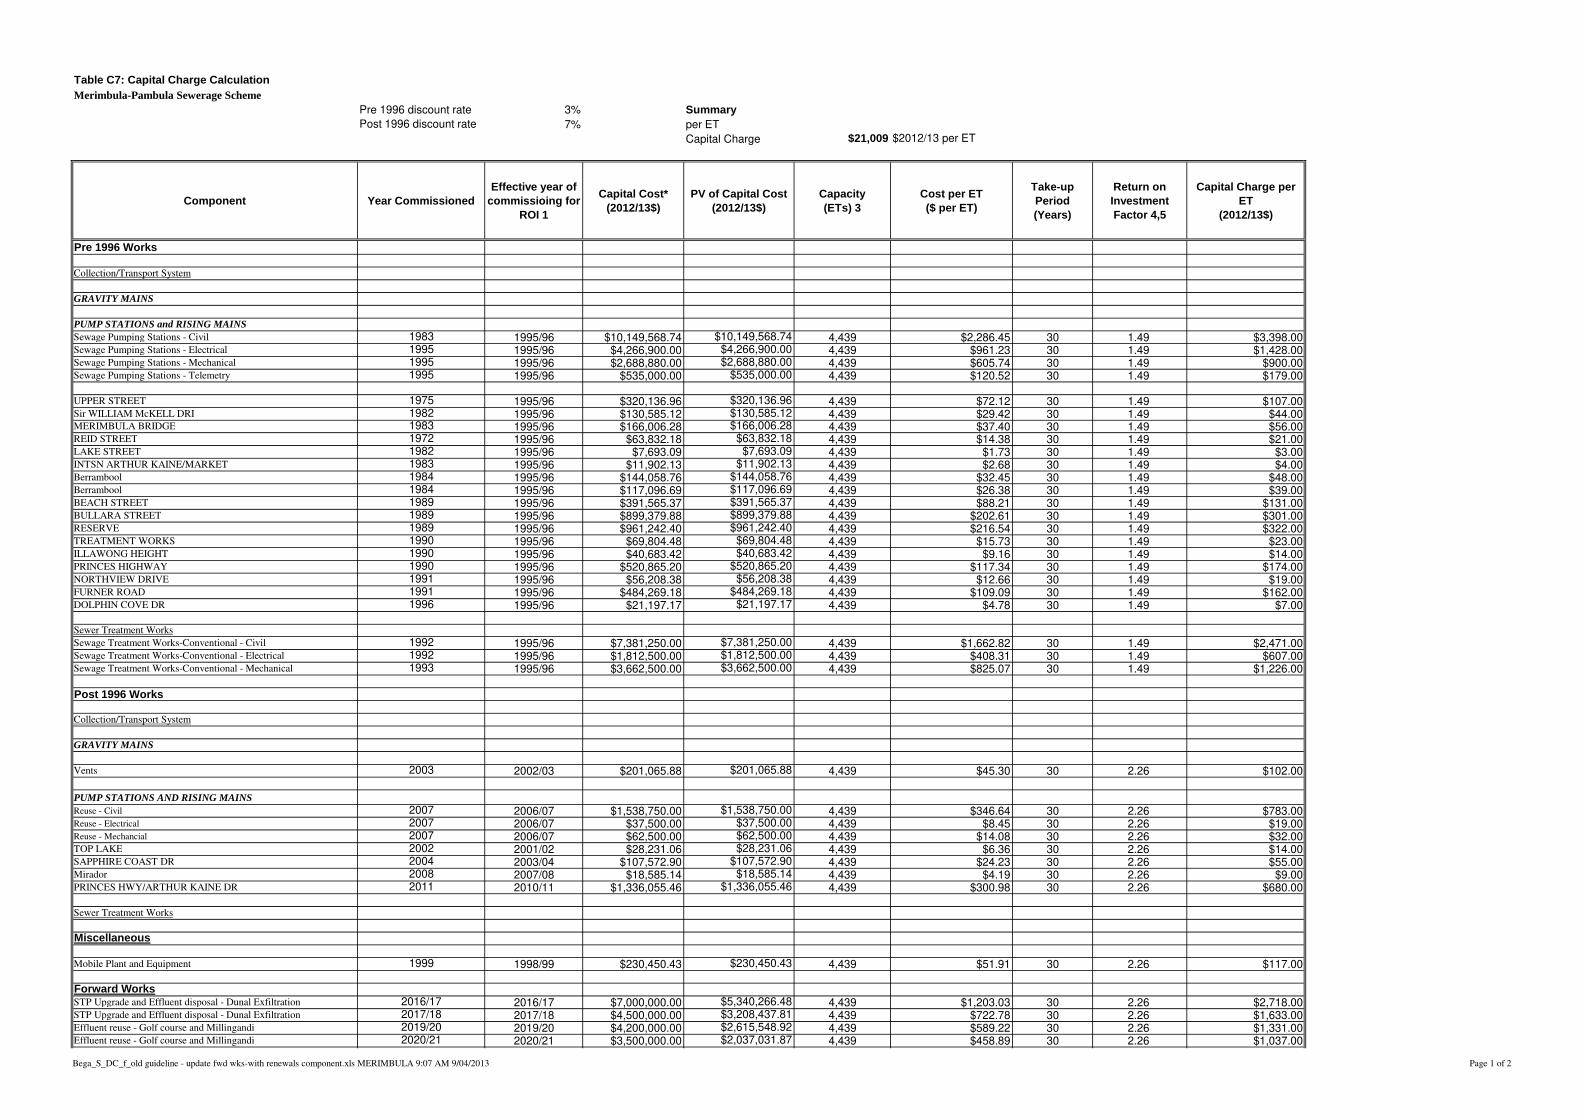
Table C7: Capital Charge CalculationMerimbula-Pambula Sewerage Scheme
Pre 1996 discount rate 3% SummaryPost 1996 discount rate 7% per ET
Capital Charge $21,009 $2012/13 per ET
Component Year CommissionedEffective year of
commissioing for ROI 1
Capital Cost*(2012/13$)
PV of Capital Cost (2012/13$)
Capacity(ETs) 3
Cost per ET($ per ET)
Take-up Period(Years)
Return on Investment Factor 4,5
Capital Charge per ET
(2012/13$)
Pre 1996 Works
Collection/Transport System
GRAVITY MAINS
PUMP STATIONS and RISING MAINSSewage Pumping Stations - Civil 1983 1995/96 $10,149,568.74 $10,149,568.74 4,439 $2,286.45 30 1.49 $3,398.00Sewage Pumping Stations - Electrical 1995 1995/96 $4,266,900.00 $4,266,900.00 4,439 $961.23 30 1.49 $1,428.00Sewage Pumping Stations - Mechanical 1995 1995/96 $2,688,880.00 $2,688,880.00 4,439 $605.74 30 1.49 $900.00Sewage Pumping Stations - Telemetry 1995 1995/96 $535,000.00 $535,000.00 4,439 $120.52 30 1.49 $179.00
UPPER STREET 1975 1995/96 $320,136.96 $320,136.96 4,439 $72.12 30 1.49 $107.00Sir WILLIAM McKELL DRI 1982 1995/96 $130,585.12 $130,585.12 4,439 $29.42 30 1.49 $44.00MERIMBULA BRIDGE 1983 1995/96 $166,006.28 $166,006.28 4,439 $37.40 30 1.49 $56.00REID STREET 1972 1995/96 $63,832.18 $63,832.18 4,439 $14.38 30 1.49 $21.00LAKE STREET 1982 1995/96 $7,693.09 $7,693.09 4,439 $1.73 30 1.49 $3.00INTSN ARTHUR KAINE/MARKET 1983 1995/96 $11,902.13 $11,902.13 4,439 $2.68 30 1.49 $4.00Berrambool 1984 1995/96 $144,058.76 $144,058.76 4,439 $32.45 30 1.49 $48.00Berrambool 1984 1995/96 $117,096.69 $117,096.69 4,439 $26.38 30 1.49 $39.00BEACH STREET 1989 1995/96 $391,565.37 $391,565.37 4,439 $88.21 30 1.49 $131.00BULLARA STREET 1989 1995/96 $899,379.88 $899,379.88 4,439 $202.61 30 1.49 $301.00RESERVE 1989 1995/96 $961,242.40 $961,242.40 4,439 $216.54 30 1.49 $322.00TREATMENT WORKS 1990 1995/96 $69,804.48 $69,804.48 4,439 $15.73 30 1.49 $23.00ILLAWONG HEIGHT 1990 1995/96 $40,683.42 $40,683.42 4,439 $9.16 30 1.49 $14.00PRINCES HIGHWAY 1990 1995/96 $520,865.20 $520,865.20 4,439 $117.34 30 1.49 $174.00NORTHVIEW DRIVE 1991 1995/96 $56,208.38 $56,208.38 4,439 $12.66 30 1.49 $19.00FURNER ROAD 1991 1995/96 $484,269.18 $484,269.18 4,439 $109.09 30 1.49 $162.00DOLPHIN COVE DR 1996 1995/96 $21,197.17 $21,197.17 4,439 $4.78 30 1.49 $7.00
Sewer Treatment Works
Sewage Treatment Works-Conventional - Civil 1992 1995/96 $7,381,250.00 $7,381,250.00 4,439 $1,662.82 30 1.49 $2,471.00Sewage Treatment Works-Conventional - Electrical 1992 1995/96 $1,812,500.00 $1,812,500.00 4,439 $408.31 30 1.49 $607.00Sewage Treatment Works-Conventional - Mechanical 1993 1995/96 $3,662,500.00 $3,662,500.00 4,439 $825.07 30 1.49 $1,226.00
Post 1996 Works
Collection/Transport System
GRAVITY MAINS
Vents 2003 2002/03 $201,065.88 $201,065.88 4,439 $45.30 30 2.26 $102.00
PUMP STATIONS AND RISING MAINSReuse - Civil 2007 2006/07 $1,538,750.00 $1,538,750.00 4,439 $346.64 30 2.26 $783.00Reuse - Electrical 2007 2006/07 $37,500.00 $37,500.00 4,439 $8.45 30 2.26 $19.00Reuse - Mechancial 2007 2006/07 $62,500.00 $62,500.00 4,439 $14.08 30 2.26 $32.00TOP LAKE 2002 2001/02 $28,231.06 $28,231.06 4,439 $6.36 30 2.26 $14.00SAPPHIRE COAST DR 2004 2003/04 $107,572.90 $107,572.90 4,439 $24.23 30 2.26 $55.00Mirador 2008 2007/08 $18,585.14 $18,585.14 4,439 $4.19 30 2.26 $9.00PRINCES HWY/ARTHUR KAINE DR 2011 2010/11 $1,336,055.46 $1,336,055.46 4,439 $300.98 30 2.26 $680.00
Sewer Treatment Works
Miscellaneous
Mobile Plant and Equipment 1999 1998/99 $230,450.43 $230,450.43 4,439 $51.91 30 2.26 $117.00
Forward WorksSTP Upgrade and Effluent disposal - Dunal Exfiltration 2016/17 2016/17 $7,000,000.00 $5,340,266.48 4,439 $1,203.03 30 2.26 $2,718.00STP Upgrade and Effluent disposal - Dunal Exfiltration 2017/18 2017/18 $4,500,000.00 $3,208,437.81 4,439 $722.78 30 2.26 $1,633.00Effluent reuse - Golf course and Millingandi 2019/20 2019/20 $4,200,000.00 $2,615,548.92 4,439 $589.22 30 2.26 $1,331.00Effluent reuse - Golf course and Millingandi 2020/21 2020/21 $3,500,000.00 $2,037,031.87 4,439 $458.89 30 2.26 $1,037.00
Bega_S_DC_f_old guideline - update fwd wks-with renewals component.xls MERIMBULA 9:07 AM 9/04/2013 Page 1 of 2
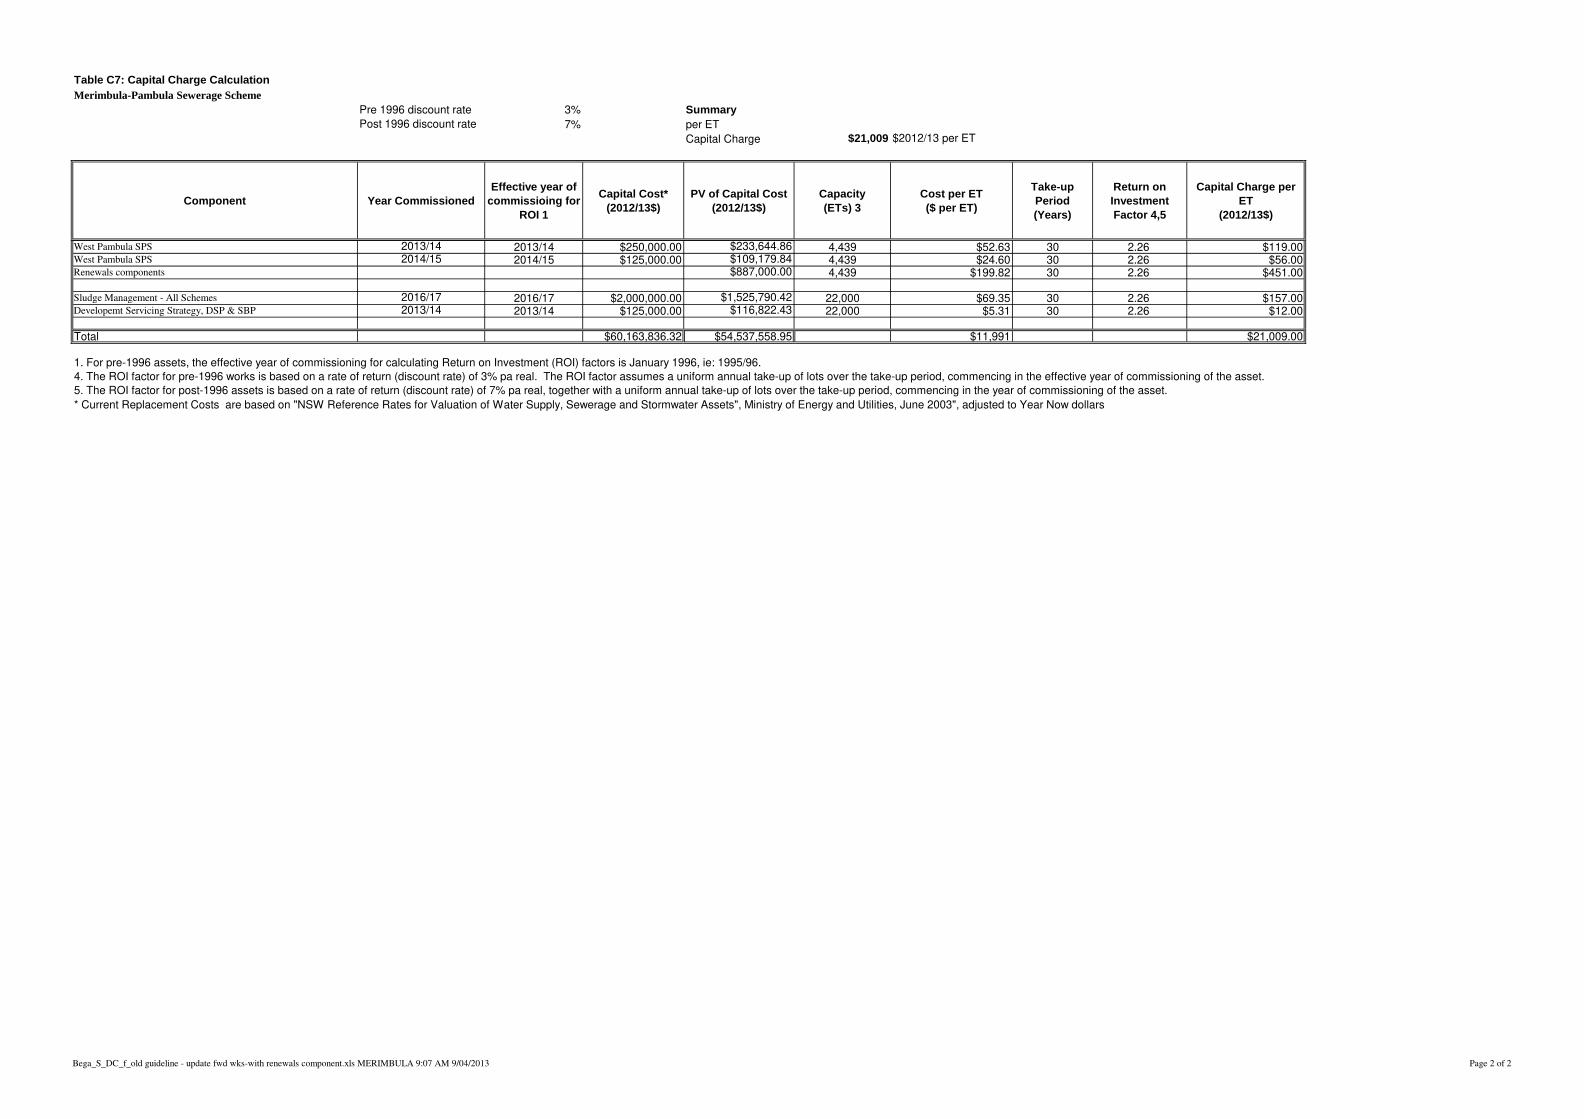
Table C7: Capital Charge CalculationMerimbula-Pambula Sewerage Scheme
Pre 1996 discount rate 3% SummaryPost 1996 discount rate 7% per ET
Capital Charge $21,009 $2012/13 per ET
Component Year CommissionedEffective year of
commissioing for ROI 1
Capital Cost*(2012/13$)
PV of Capital Cost (2012/13$)
Capacity(ETs) 3
Cost per ET($ per ET)
Take-up Period(Years)
Return on Investment Factor 4,5
Capital Charge per ET
(2012/13$)
West Pambula SPS 2013/14 2013/14 $250,000.00 $233,644.86 4,439 $52.63 30 2.26 $119.00West Pambula SPS 2014/15 2014/15 $125,000.00 $109,179.84 4,439 $24.60 30 2.26 $56.00Renewals components $887,000.00 4,439 $199.82 30 2.26 $451.00
Sludge Management - All Schemes 2016/17 2016/17 $2,000,000.00 $1,525,790.42 22,000 $69.35 30 2.26 $157.00Developemt Servicing Strategy, DSP & SBP 2013/14 2013/14 $125,000.00 $116,822.43 22,000 $5.31 30 2.26 $12.00
Total $60,163,836.32 $54,537,558.95 $11,991 $21,009.00
1. For pre-1996 assets, the effective year of commissioning for calculating Return on Investment (ROI) factors is January 1996, ie: 1995/96.
4. The ROI factor for pre-1996 works is based on a rate of return (discount rate) of 3% pa real. The ROI factor assumes a uniform annual take-up of lots over the take-up period, commencing in the effective year of commissioning of the asset.
5. The ROI factor for post-1996 assets is based on a rate of return (discount rate) of 7% pa real, together with a uniform annual take-up of lots over the take-up period, commencing in the year of commissioning of the asset.
* Current Replacement Costs are based on "NSW Reference Rates for Valuation of Water Supply, Sewerage and Stormwater Assets", Ministry of Energy and Utilities, June 2003", adjusted to Year Now dollars
Bega_S_DC_f_old guideline - update fwd wks-with renewals component.xls MERIMBULA 9:07 AM 9/04/2013 Page 2 of 2

Table C8: Capital Charge CalculationTathra Sewerage Scheme
Pre 1996 discount rate 3% SummaryPost 1996 discount rate 7% per ET
Capital Charge $26,140 $2012/13 per ET
Component Year CommissionedEffective year of
commissioing for ROI 1
Capital Cost*(2012/13$)
PV of Capital Cost (2012/13$)
Capacity(ETs) 3
Cost per ET($ per ET)
Take-up Period(Years)
Return on Investment Factor 4,5
Capital Charge per ET
(2012/13$)
Pre 1996 Works
Collection/Transport System
GRAVITY MAINS
PUMP STATIONS and RISING MAINS
Sewage Pumping Stations - Civil 1984 1995/96 $1,845,690.62 $1,845,690.62 1,157 $1,595.24 30 1.49 $2,371.00
TATHRA BERMAGUI RD 1976 1995/96 $605,329.40 $605,329.40 1,157 $523.19 30 1.49 $777.00CLIFF PLACE 1976 1995/96 $51,199.11 $51,199.11 1,157 $44.25 30 1.49 $66.00ILLOURA STREET 1976 1995/96 $208,682.49 $208,682.49 1,157 $180.37 30 1.49 $268.00HAVEN PLACE 1985 1995/96 $22,039.87 $22,039.87 1,157 $19.05 30 1.49 $28.00GOLF COURSE 1987 1995/96 $253,202.58 $253,202.58 1,157 $218.84 30 1.49 $325.00PACIFIC WAY 1987 1995/96 $234,508.93 $234,508.93 1,157 $202.69 30 1.49 $301.00BOURNDA CIRCUIT 1995 1995/96 $208,682.49 $208,682.49 1,157 $180.37 30 1.49 $268.00
Sewer Treatment Works
Post 1996 Works
Collection/Transport System
GRAVITY MAINSVents 2003 2002/03 $27,690.62 $27,690.62 1,157 $23.93 30 2.26 $54.00
PUMP STATIONS AND RISING MAINS
Sewage Pumping Stations - Electrical 2004 2003/04 $866,250.00 $866,250.00 1,157 $748.70 30 2.26 $1,692.00Sewage Pumping Stations - Mechanical 2004 2003/04 $373,560.00 $373,560.00 1,157 $322.87 30 2.26 $730.00Sewage Pumping Stations - Telemetry 2001 2000/01 $120,000.00 $120,000.00 1,157 $103.72 30 2.26 $234.00RESERVOIR STREET 2006 2005/06 $49,283.48 $49,283.48 1,157 $42.60 30 2.26 $96.00IMLAY STREET 2006 2005/06 $63,445.32 $63,445.32 1,157 $54.84 30 2.26 $124.00OLD WALLAGOOT RD 2008 2007/08 $968,235.59 $968,235.59 1,157 $836.85 30 2.26 $1,891.00
Sewer Treatment Works
Sewage Treatment Works-Conventional - Civil 1998 1997/98 $4,789,950.00 $4,789,950.00 1,157 $4,139.97 30 2.26 $9,354.00Sewage Treatment Works-Conventional - Electrical 2004 2003/04 $1,300,000.00 $1,300,000.00 1,157 $1,123.60 30 2.26 $2,539.00Sewage Treatment Works-Conventional - Mechanical 2004 2003/04 $1,432,500.00 $1,432,500.00 1,157 $1,238.12 30 2.26 $2,797.00Reuse - Civil 2008 2007/08 $593,750.00 $593,750.00 1,157 $513.18 30 2.26 $1,159.00Reuse - Electrical 2008 2007/08 $156,250.00 $156,250.00 1,157 $135.05 30 2.26 $305.00Reuse - Mechancial 2008 2007/08 $137,500.00 $137,500.00 1,157 $118.84 30 2.26 $269.00
Miscellaneous
Forward WorksSludge Management - All Schemes 2016/17 2016/17 $2,000,000.00 $1,525,790.42 22,000 $69.35 30 1.00 $69.00Developemt Servicing Strategy, DSP & SBP 2013/14 2013/14 $125,000.00 $116,822.43 22,000 $5.31 30 1.00 $5.00Renewals component $214,000.00 1,157 $184.96 30 2.26 $418.00
Total $16,432,750.51 $16,164,363.36 $12,626 $26,140.00
1. For pre-1996 assets, the effective year of commissioning for calculating Return on Investment (ROI) factors is January 1996, ie: 1995/96.
4. The ROI factor for pre-1996 works is based on a rate of return (discount rate) of 3% pa real. The ROI factor assumes a uniform annual take-up of lots over the take-up period, commencing in the effective year of commissioning of the asset.
5. The ROI factor for post-1996 assets is based on a rate of return (discount rate) of 7% pa real, together with a uniform annual take-up of lots over the take-up period, commencing in the year of commissioning of the asset.
* Current Replacement Costs are based on "NSW Reference Rates for Valuation of Water Supply, Sewerage and Stormwater Assets", Ministry of Energy and Utilities, June 2003", adjusted to Year Now dollars
Bega_S_DC_f_old guideline - update fwd wks-with renewals component.xls TATHRA 9:12 AM 9/04/2013 Page 1 of 1

Table C9: Capital Charge CalculationTura Beach Sewerage Scheme
Pre 1996 discount rate 3% SummaryPost 1996 discount rate 7% per ET
Capital Charge $17,247 $2012/13 per ET
Component Year CommissionedEffective year of
commissioing for ROI 1
Capital Cost*(2012/13$)
PV of Capital Cost (2012/13$)
Capacity(ETs) 3
Cost per ET($ per ET)
Take-up Period(Years)
Return on Investment Factor 4,5
Capital Charge per ET
(2012/13$)
Pre 1996 Works
Collection/Transport System
GRAVITY MAINS
PUMP STATIONS and RISING MAINS
Sewage Pumping Stations - Civil 1989 1995/96 $2,637,936.43 $2,637,936.43 1,468 $1,796.96 30 1.49 $2,670.00Sewage Pumping Stations - Electrical 1989 1995/96 $1,221,000.00 $1,221,000.00 1,468 $831.74 30 1.49 $1,236.00
PACIFIC WAY 1985 1995/96 $36,575.16 $36,575.16 1,468 $24.91 30 1.49 $37.00OUTFALL 1987 1995/96 $25,916.46 $25,916.46 1,468 $17.65 30 1.49 $26.00GOLF COURSE 1987 1995/96 $58,650.42 $58,650.42 1,468 $39.95 30 1.49 $59.00
Sewer Treatment Works
Sewage Treatment Works-Conventional - Civil 1994 1995/96 $4,267,500.00 $4,267,500.00 1,468 $2,907.02 30 1.49 $4,320.00
Post 1996 Works
Collection/Transport System
GRAVITY MAINSSewer Mains - Trunk 2012 2011/12 $99,161.54 $99,161.54 1,468 $67.55 30 2.26 $153.00Vents 2003 2002/03 $41,866.09 $41,866.09 1,468 $28.52 30 2.26 $64.00
PUMP STATIONS AND RISING MAINSSewage Pumping Stations - Mechanical 2003 2002/03 $490,380.00 $490,380.00 1,468 $334.05 30 2.26 $755.00Sewage Pumping Stations - Telemetry 2005 2004/05 $160,000.00 $160,000.00 1,468 $108.99 30 2.26 $246.00
GOLF COURSE 2003 2002/03 $131,170.77 $131,170.77 1,468 $89.35 30 2.26 $202.00PACIFIC WAY 2011 2010/11 $2,150.34 $2,150.34 1,468 $1.46 30 2.26 $3.00PACIFIC WAY 2011 2010/11 $2,150.34 $2,150.34 1,468 $1.46 30 2.26 $3.00
Sewer Treatment Works
Sewage Treatment Works-Conventional - Electrical 2005 2004/05 $1,125,000.00 $1,125,000.00 1,468 $766.35 30 2.26 $1,732.00Sewage Treatment Works-Conventional - Mechanical 2005 2004/05 $1,362,500.00 $1,362,500.00 1,468 $928.13 30 2.26 $2,097.00
Miscellaneous
Forward WorksTura - Effluent Disinfection 2012/13 2012/13 $1,500,000.00 $1,500,000.00 1,468 $1,021.80 30 2.26 $2,309.00Tura - Effluent Disinfection 2013/14 2013/14 $500,000.00 $467,289.72 1,468 $318.32 30 2.26 $719.00Renewals component $344,000.00 1,468 $234.33 31 2.31 $542.00
Sludge Management - All Schemes 2016/17 2016/17 $2,000,000.00 $1,525,790.42 22,000 $69.35 30 1.00 $69.00Developemt Servicing Strategy, DSP & SBP 2013/14 2013/14 $125,000.00 $116,822.43 22,000 $5.31 30 1.00 $5.00
Total $15,786,957.56 $15,615,860.13 $9,588 $17,247.00
1. For pre-1996 assets, the effective year of commissioning for calculating Return on Investment (ROI) factors is January 1996, ie: 1995/96.
4. The ROI factor for pre-1996 works is based on a rate of return (discount rate) of 3% pa real. The ROI factor assumes a uniform annual take-up of lots over the take-up period, commencing in the effective year of commissioning of the asset.
5. The ROI factor for post-1996 assets is based on a rate of return (discount rate) of 7% pa real, together with a uniform annual take-up of lots over the take-up period, commencing in the year of commissioning of the asset.
* Current Replacement Costs are based on "NSW Reference Rates for Valuation of Water Supply, Sewerage and Stormwater Assets", Ministry of Energy and Utilities, June 2003", adjusted to Year Now dollars
Bega_S_DC_f_old guideline - update fwd wks-with renewals component.xls TURA 9:14 AM 9/04/2013 Page 1 of 1

Table C10: Capital Charge CalculationWolumla Sewerage Scheme
Pre 1996 discount rate 3% SummaryPost 1996 discount rate 7% per ET
Capital Charge $80,302 $2012/13 per ET
Component Year CommissionedEffective year of
commissioing for ROI 1
Capital Cost*(2012/13$)
PV of Capital Cost (2012/13$)
Capacity(ETs) 3
Cost per ET($ per ET)
Take-up Period(Years)
Return on Investment Factor 4,5
Capital Charge per ET
(2012/13$)
Pre 1996 Works
Collection/Transport System
GRAVITY MAINS
PUMP STATIONS and RISING MAINS
Sewer Treatment Works
Post 1996 Works
Collection/Transport System
GRAVITY MAINS
PUMP STATIONS AND RISING MAINSPressure Sewer - Property Components 2007 2006/07 $2,288,880.00 $2,288,880.00 217 $10,547.83 30 2.26 $0.00 Assume excludePressure Sewer - Discharge Lines 2007 2006/07 $453,803.30 $453,803.30 217 $2,091.26 30 2.26 $4,725.00Pressure Sewer - Main Components 2008 2007/08 $58,000.00 $58,000.00 217 $267.28 30 2.26 $604.00Pressure Sewer - Main Pipes 2007 2006/07 $778,040.81 $778,040.81 217 $3,585.44 30 2.26 $8,101.00
Sewer Treatment Works
Sewage Treatment Works-MBR - Civil 2005 2004/05 $2,845,684.03 $2,845,684.03 217 $13,113.75 30 2.26 $29,630.00Sewage Treatment Works-MBR - Civil 2005 2004/05 $2,845,684.03 $2,845,684.03 217 $13,113.75 30 2.26 $29,630.00Sewage Treatment Works-MBR - Electrical 2005 2004/05 $2,015,692.85 $2,015,692.85 217 $9,288.91 30 2.26 $20,988.00Sewage Treatment Works-MBR - Mechancial 2005 2004/05 $889,276.26 $889,276.26 217 $4,098.05 30 2.26 $9,259.00Sewage Treatment Works-MBR - Telemetry 2005 2004/05 $177,855.25 $177,855.25 217 $819.61 30 2.26 $1,852.00Reuse - Civil 2005 2004/05 $204,341.11 $204,341.11 217 $941.66 30 2.26 $2,128.00Reuse - Electrical 2005 2004/05 $144,741.62 $144,741.62 217 $667.01 30 2.26 $1,507.00Reuse - Mechancial 2005 2004/05 $63,856.60 $63,856.60 217 $294.27 30 2.26 $665.00Reuse - Telemetry 2005 2004/05 $12,771.32 $12,771.32 217 $58.85 30 2.26 $133.00
Miscellaneous
Mobile Plant and Equipment 2005 2004/05 $61,116.34 $61,116.34 217 $281.64 30 2.26 $636.00
Forward WorksSludge Management - All Schemes 2016/17 2016/17 $2,000,000.00 $1,525,790.42 22,000 $69.35 30 1.00 $69.00Developemt Servicing Strategy, DSP & SBP 2013/14 2013/14 $125,000.00 $116,822.43 22,000 $5.31 30 1.00 $5.00
Total $12,119,059.49 $11,636,672.34 $46,130 $80,302.00
1. For pre-1996 assets, the effective year of commissioning for calculating Return on Investment (ROI) factors is January 1996, ie: 1995/96.1. For pre-1996 assets, the effective year of commissioning for calculating Return on Investment (ROI) factors is January 1996, ie: 1995/96.
4. The ROI factor for pre-1996 works is based on a rate of return (discount rate) of 3% pa real. The ROI factor assumes a uniform annual take-up of lots over the take-up period, commencing in the effective year of commissioning of the asset.
5. The ROI factor for post-1996 assets is based on a rate of return (discount rate) of 7% pa real, together with a uniform annual take-up of lots over the take-up period, commencing in the year of commissioning of the asset.
* Current Replacement Costs are based on "NSW Reference Rates for Valuation of Water Supply, Sewerage and Stormwater Assets", Ministry of Energy and Utilities, June 2003", adjusted to Year Now dollars
Bega_S_DC_f_old guideline - update fwd wks-with renewals component.xls WOLUMLA 9:17 AM 9/04/2013 Page 1 of 1
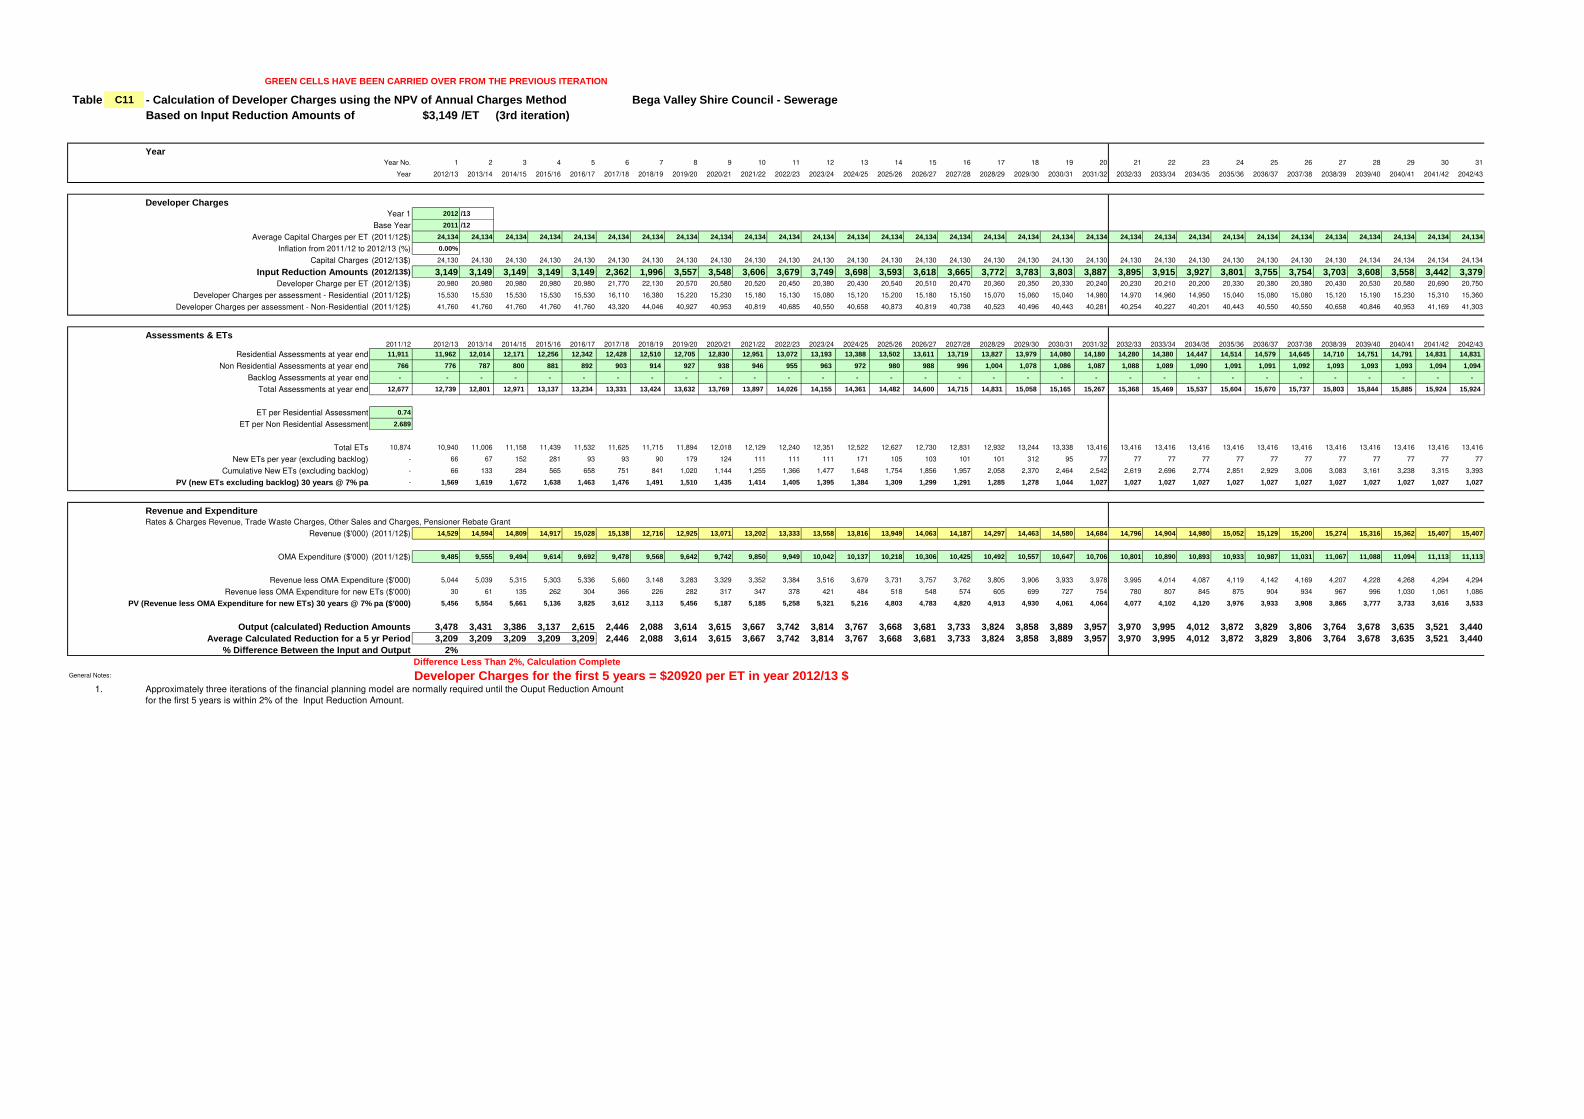
GREEN CELLS HAVE BEEN CARRIED OVER FROM THE PREVIOU S ITERATION
Table C11 - Calculation of Developer Charges using the NPV of Annual Charges Me thod Bega Valley Shire Council - SewerageBased on Input Reduction Amounts of $3,149 /ET (3rd iteration)
YearYear No. 1 2 3 4 5 6 7 8 9 10 11 12 13 14 15 16 17 18 19 20 21 22 23 24 25 26 27 28 29 30 31
Year 2012/13 2013/14 2014/15 2015/16 2016/17 2017/18 2018/19 2019/20 2020/21 2021/22 2022/23 2023/24 2024/25 2025/26 2026/27 2027/28 2028/29 2029/30 2030/31 2031/32 2032/33 2033/34 2034/35 2035/36 2036/37 2037/38 2038/39 2039/40 2040/41 2041/42 2042/43
Developer ChargesYear 1 2012 /13
Base Year 2011 /12
Average Capital Charges per ET (2011/12$) 24,134 24,134 24,134 24,134 24,134 24,134 24,134 24,134 24,134 24,134 24,134 24,134 24,134 24,134 24,134 24,134 24,134 24,134 24,134 24,134 24,134 24,134 24,134 24,134 24,134 24,134 24,134 24,134 24,134 24,134 24,134
Inflation from 2011/12 to 2012/13 (%) 0.00%
Capital Charges (2012/13$) 24,130 24,130 24,130 24,130 24,130 24,130 24,130 24,130 24,130 24,130 24,130 24,130 24,130 24,130 24,130 24,130 24,130 24,130 24,130 24,130 24,130 24,130 24,130 24,130 24,130 24,130 24,130 24,134 24,134 24,134 24,134
Input Reduction Amounts (2012/13$) 3,149 3,149 3,149 3,149 3,149 2,362 1,996 3,557 3,548 3,606 3,679 3,749 3,698 3,593 3,618 3,665 3,772 3,783 3,803 3,887 3,895 3,915 3,927 3,801 3,755 3,754 3,703 3,608 3,558 3,442 3,379Developer Charge per ET (2012/13$) 20,980 20,980 20,980 20,980 20,980 21,770 22,130 20,570 20,580 20,520 20,450 20,380 20,430 20,540 20,510 20,470 20,360 20,350 20,330 20,240 20,230 20,210 20,200 20,330 20,380 20,380 20,430 20,530 20,580 20,690 20,750
Developer Charges per assessment - Residential (2011/12$) 15,530 15,530 15,530 15,530 15,530 16,110 16,380 15,220 15,230 15,180 15,130 15,080 15,120 15,200 15,180 15,150 15,070 15,060 15,040 14,980 14,970 14,960 14,950 15,040 15,080 15,080 15,120 15,190 15,230 15,310 15,360
Developer Charges per assessment - Non-Residential (2011/12$) 41,760 41,760 41,760 41,760 41,760 43,320 44,046 40,927 40,953 40,819 40,685 40,550 40,658 40,873 40,819 40,738 40,523 40,496 40,443 40,281 40,254 40,227 40,201 40,443 40,550 40,550 40,658 40,846 40,953 41,169 41,303
Assessments & ETs2011/12 2012/13 2013/14 2014/15 2015/16 2016/17 2017/18 2018/19 2019/20 2020/21 2021/22 2022/23 2023/24 2024/25 2025/26 2026/27 2027/28 2028/29 2029/30 2030/31 2031/32 2032/33 2033/34 2034/35 2035/36 2036/37 2037/38 2038/39 2039/40 2040/41 2041/42 2042/43
Residential Assessments at year end 11,911 11,962 12,014 12,171 12,256 12,342 12,428 12,510 12,705 12,830 12,951 13,072 13,193 13,388 13,502 13,611 13,719 13,827 13,979 14,080 14,180 14,280 14,380 14,447 14,514 14,579 14,645 14,710 14,751 14,791 14,831 14,831
Non Residential Assessments at year end 766 776 787 800 881 892 903 914 927 938 946 955 963 972 980 988 996 1,004 1,078 1,086 1,087 1,088 1,089 1,090 1,091 1,091 1,092 1,093 1,093 1,093 1,094 1,094
Backlog Assessments at year end - - - - - - - - - - - - - - - - - - - - - - - - - - - - - - - -
Total Assessments at year end 12,677 12,739 12,801 12,971 13,137 13,234 13,331 13,424 13,632 13,769 13,897 14,026 14,155 14,361 14,482 14,600 14,715 14,831 15,058 15,165 15,267 15,368 15,469 15,537 15,604 15,670 15,737 15,803 15,844 15,885 15,924 15,924
ET per Residential Assessment 0.74
ET per Non Residential Assessment 2.689
Total ETs 10,874 10,940 11,006 11,158 11,439 11,532 11,625 11,715 11,894 12,018 12,129 12,240 12,351 12,522 12,627 12,730 12,831 12,932 13,244 13,338 13,416 13,416 13,416 13,416 13,416 13,416 13,416 13,416 13,416 13,416 13,416 13,416
New ETs per year (excluding backlog) - 66 67 152 281 93 93 90 179 124 111 111 111 171 105 103 101 101 312 95 77 77 77 77 77 77 77 77 77 77 77 77
Cumulative New ETs (excluding backlog) - 66 133 284 565 658 751 841 1,020 1,144 1,255 1,366 1,477 1,648 1,754 1,856 1,957 2,058 2,370 2,464 2,542 2,619 2,696 2,774 2,851 2,929 3,006 3,083 3,161 3,238 3,315 3,393
PV (new ETs excluding backlog) 30 years @ 7% pa - 1,569 1,619 1,672 1,638 1,463 1,476 1,491 1,510 1,435 1,414 1,405 1,395 1,384 1,309 1,299 1,291 1,285 1,278 1,044 1,027 1,027 1,027 1,027 1,027 1,027 1,027 1,027 1,027 1,027 1,027 1,027
Revenue and ExpenditureRates & Charges Revenue, Trade Waste Charges, Other Sales and Charges, Pensioner Rebate Grant
Revenue ($'000) (2011/12$) 14,529 14,594 14,809 14,917 15,028 15,138 12,716 12,925 13,071 13,202 13,333 13,558 13,816 13,949 14,063 14,187 14,297 14,463 14,580 14,684 14,796 14,904 14,980 15,052 15,129 15,200 15,274 15,316 15,362 15,407 15,407
OMA Expenditure ($'000) (2011/12$) 9,485 9,555 9,494 9,614 9,692 9,478 9,568 9,642 9,742 9,850 9,949 10,042 10,137 10,218 10,306 10,425 10,492 10,557 10,647 10,706 10,801 10,890 10,893 10,933 10,987 11,031 11,067 11,088 11,094 11,113 11,113
Revenue less OMA Expenditure ($'000) 5,044 5,039 5,315 5,303 5,336 5,660 3,148 3,283 3,329 3,352 3,384 3,516 3,679 3,731 3,757 3,762 3,805 3,906 3,933 3,978 3,995 4,014 4,087 4,119 4,142 4,169 4,207 4,228 4,268 4,294 4,294
Revenue less OMA Expenditure for new ETs ($'000) 30 61 135 262 304 366 226 282 317 347 378 421 484 518 548 574 605 699 727 754 780 807 845 875 904 934 967 996 1,030 1,061 1,086
PV (Revenue less OMA Expenditure for new ETs) 30 ye ars @ 7% pa ($'000) 5,456 5,554 5,661 5,136 3,825 3,612 3,113 5,456 5,187 5,185 5,258 5,321 5,216 4,803 4,783 4,820 4,913 4,930 4,061 4,064 4,077 4,102 4,120 3,976 3,933 3,908 3,865 3,777 3,733 3,616 3,533
Output (calculated) Reduction Amounts 3,478 3,431 3,38 6 3,137 2,615 2,446 2,088 3,614 3,615 3,667 3,742 3,814 3,767 3,668 3,681 3,733 3,824 3,858 3,889 3,957 3,970 3,995 4,012 3,872 3,829 3,806 3,764 3,678 3,635 3,521 3,440Average Calculated Reduction for a 5 yr Period 3,209 3,209 3,209 3,209 3,209 2,446 2,088 3,614 3,615 3,667 3,742 3,814 3,767 3,668 3,681 3,733 3,824 3,858 3,889 3,957 3,970 3,995 4,012 3,872 3,829 3,806 3,764 3,678 3,635 3,521 3,440
% Difference Between the Input and Output 2%Difference Less Than 2%, Calculation Complete
General Notes: Developer Charges for the first 5 years = $20920 pe r ET in year 2012/13 $1. Approximately three iterations of the financial planning model are normally required until the Ouput Reduction Amount
for the first 5 years is within 2% of the Input Reduction Amount.

Level 16 McKell Building
2-24 Rawson Place
Sydney NSW 2000
www.publicworks.nsw.gov.au