development program - nasa · pdf filestirling engine development program quarterly technical...
TRANSCRIPT
CONS/4396-3 NASA CR-159436
(NASA-CR-159436) AUTOMOTIVE STIRLING ENGINE N79-11406 DEVELOPMENT PROGRAM Quarterly Technical Progress Report, Apr. 1978 - Jun 1978 (Ford Motor Co.) 96 p HC A05/MF A01 ceCL 13F Unclas
AUTOMOTIVE STIRLING ENGINE DEVELOPMENT PROGRAM
Quarterly Technical Progress Report Apri I 1978 - June 1978
Ford Motor Company Dearborn, Michigan 48121
Prepared for the
G3/37 37162
NATIONAL AERONAUTICS AND SPACE ADMINISTRATION Lewis Research Center Cleveland, Ohio 44135
Contract EC-77-C-02-4396
As a pt'lrt of the
DEPARTMENT OF ENERGY Division of Transportation Energy Conservation
DEC197S
REC:EIVED IASA Sjj fJClLIn
Heat Engine Highway Vehicle Systems Program
..
https://ntrs.nasa.gov/search.jsp?R=19790003235 2018-05-19T06:34:06+00:00Z
NOTICE
This report was prepared to document work sponsored by
the United States Government. Neither the United State&
nor its agent, the United States Energy Research and
Development Administration (now Department of Energy) ,
nor any Federal employees, nor any of their contractors,
subcontractors or their employees, makes any warranty,
express or implied, or assumes any legal liability or
responsibility for the accuracy, completeness, or use
fulness of any information, apparatus, product or process
disclosed, or represents that its use would not infringe
privately owned rights.
D: . . .,
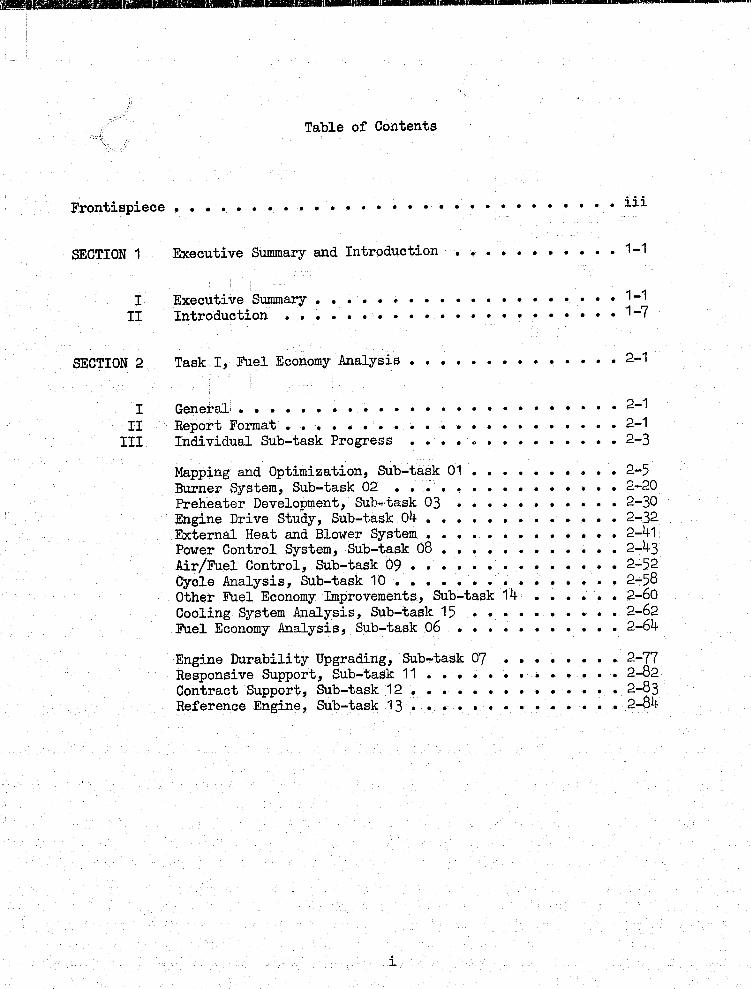
Table of contents
Frontispiece • • • • • • • • • • • • • • • • • • • • • • • • • • • • • iii
SECTION 1
I II
SECTION 2
I II
III
Executive Summary and Introduction ••••••••••• 1-1
Executive Summary • Introduction • • •
• • -e • · . . . · . . . . . . . . . . • • • • 1-1 · . . . . . . . . . . • ••• 1-7
Task I, Fuel Economy Analysis • • • • • • • • • • • • • • 2-1
General .•••••• Report Format • • • Individual Sub-task
• • • •
· . • • Progress
· · • · • · · · • •
· · • •
· • · • · • · • • · 2-1
• • · · · · • . · · 2-1
· · • • · · • · 2-3
Mapping and Optimization, Sub-task 01 • • • • • • • • 2-5 Burner System, Sub-task 02 • • • • • • • • • • • • • 2-20 Preheater Development, Sub .. ·task 03 ••••••••••• 2-30 Engine Drive Study, Sub-task 04 ••••••••••••• 2-32 External Heat and Blower System ••••••••••••• 2-41 Power Control System, Sub-task 08 • • • • • • • • • • 2-43 Air/Fuel Control, Sub-task 09 • • • • • • • • • • • • • • 2-52 Cycle Analysis, Sub-task 10 • • • • • • • • • • • 2-58 Other Fuel Economy Improvements, Sub-task 14 • • •• 2-60 Cooling System Analysis, Sub-task 15 •• • •••• 2-62 Fuel Economy Analysis, Sub-task 06 •• • • • • • • • • • 2-64
Engine Durability Upgrading, Sub-task 07 •••••••• 2-77 Responsive Support, Sub-task 11 ••••••••••••• 2-82 Contract Support, Sub-task 12 •••••••••••••• 2-83 Reference Engine, Sub-task 13 • • • • • • • ••••• 2-84
i
Figure
Frontispiece
II-1 II-2
, II-3 II-4 II-5 II-6 II-7
Attachment Number
1 2 3 4 5 6 7 8 9
10 11
List of Illustrations
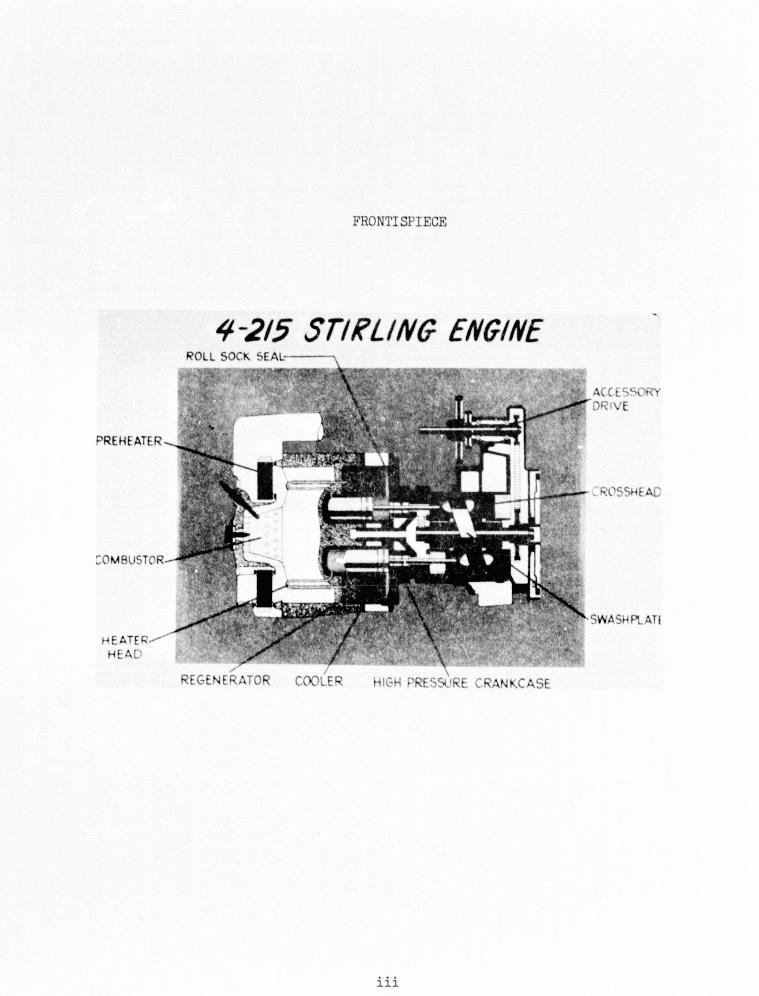
4-215 Stirling Engine . . . . . . . . . • • •
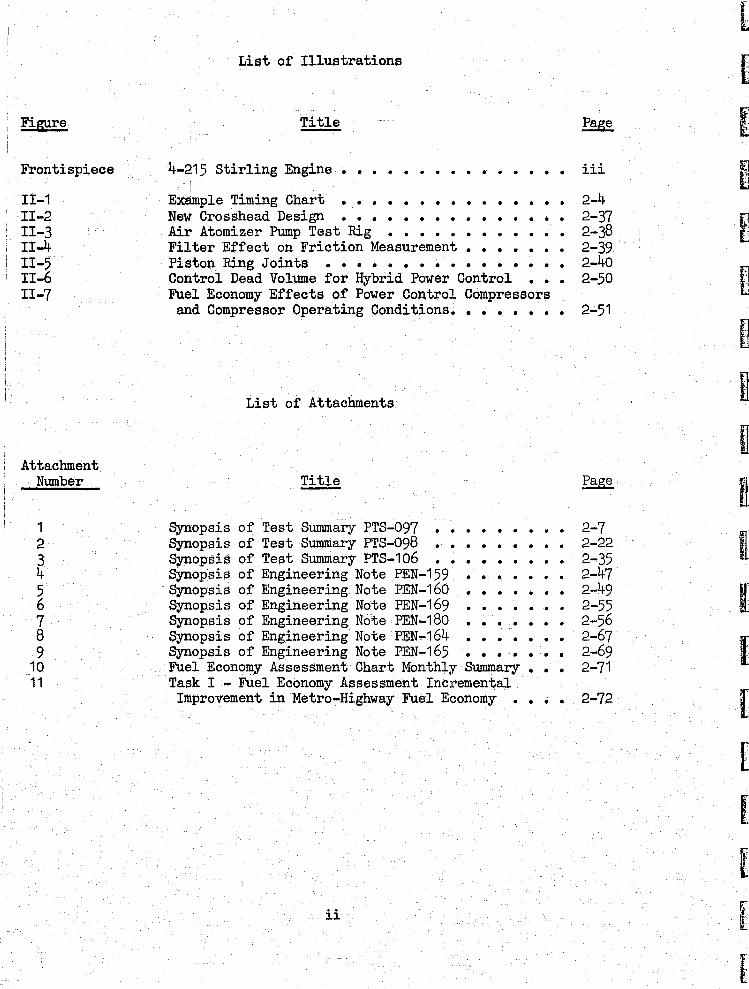
Example Timing Chart • • • • • • • • • • • • • New Crosshead Design ••• • • • • • • Air Atomizer Pump Test Rig • • • • • • • • • • • • Filter Effect on Friction Measurement • • • • • • • Piston Ring Joints •••••• • • • • • • • • • • Control Dead Volume for Hybrid Power Control ••• Fuel Economy Effects of Power Control Compressors
and Compressor Operating Conditions ••••••••
List of Attachments
Synopsis of Test Summary PTS-097 •• Synopsis of Test Summary PTS-098 •• • • • • • Synopsis of Test Summary PTS-106 •••• • • • Synopsis of Engineering Note PEN-159 ••••••• Synopsis of Engineering Note PEN-160 ••••••• Synopsis of Engineering Note PEN-169 • • • Synopsis of Engineering Note PEN-180 • • • Synopsis of Engineering Note PEN-164 • • • • • • • Synopsis of Engineering Note PEN-165 ••• • • • • Fuel Economy Assessment Chart Monthly Summary • • • Task I - Fuel Economy Assessment Incremental Improvement in Metro-Highway Fuel Economy • • • •
ii
iii
2-4 2-37 2-38 2-39 2-40 2-50
2-51
2-7 2-22 2-35 2-47 2-49 2-55 2-56 2-67 2-69 2-71
2-72
(
[
FRONTIS lEGE
4-215 STIRLING ENGINE
iii
SECTION 1
EXECUTIVE SUMMARY AND INTRODUCTION
l. EXECUTIVE SUMMARY
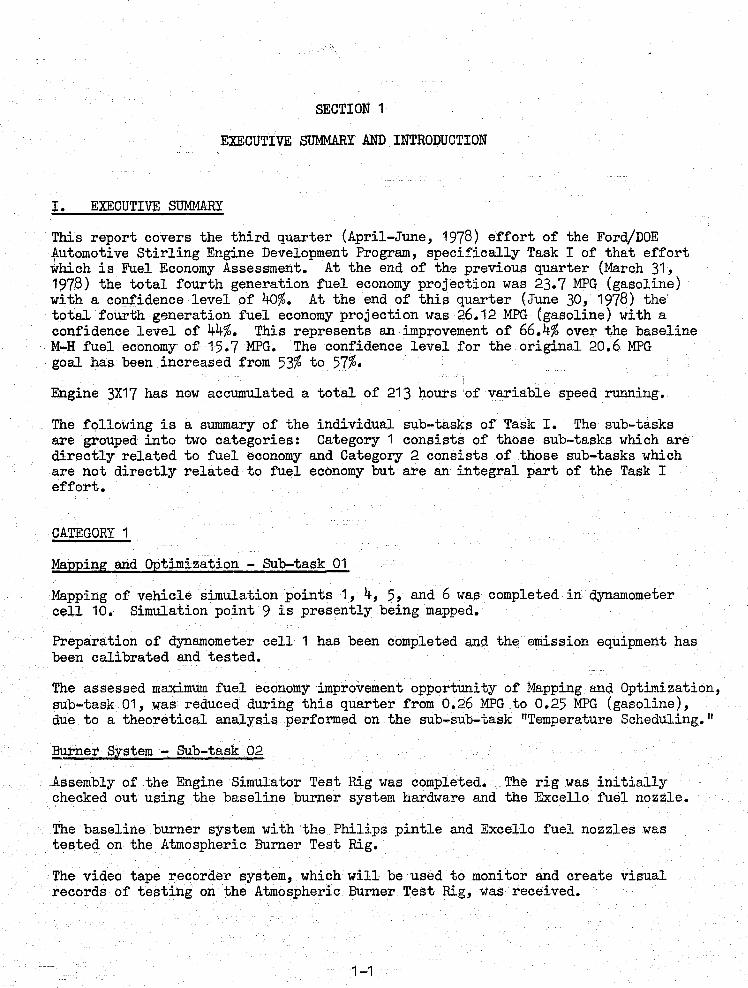
This report covers the third quarter (April-June, 1978) effort of the Ford/DOE ~utomotive Stirling Engine Development Program, specifically Task I of that effort which is Fuel Economy Assessment. At the end of the previous quarter (March 31, 1978) the total fourth generation fuel economy projection was 23.7 MPG (gasoline) with a confidence level of 40%. At the end of this quarter (June 30, 1978) the total fourth gl3neration fuel economy projection was 26.12 MPG (gasoline) with a confidence level of 44%. This represents an improvement of 66.4% over the baseline M-H fuel economy of 15.7 MFG. The confidence level for the original 20.6 MPG goal has been increased from 53% to 57%.
Engine 3X17 has now accumulated a total of 213 hours of variable speed running.'
The following is a summary of the individual sub-tasks of Task I. The sub-tasks are grouped into two categories: Category 1 consists of those sub-tasks which are directly related to fuel economy and Category 2 consists of those sub-tasks which are not directly related to fuel economy but are an integral part of the Task I effort.
CATEGORY 1
Mapping and Optimization - Sub-task 01
Mapping of vehicle simulation points 1, 4, 5, and 6 was completed in dynamometer cell 10. Simulation point 9 is presently being mapped.
Preparation of dynamometer cell 1 has been completed and the emission equipment has been calibrated and tested.
The assessed maximum fuel economy improvement opportunity of Mapping and Optimization, sub-task 01, was reduced during this quarter from 0.26 MFG to 0.25 MPG (gasoline), due to a theoretical analysis performed on the sub-sub-task "Temperature Scheduling."
Burner System - Sub-task 02
Assembly of the Engine Simulator Test Rig was completed. The rig was initially checked out using the baseline burner system hardware and the Excello fuel nozzle.
The baseline burner system with the Philips pintle and Excello fuel nozzles was tested on the Atmospheric Burner Test Rig.
The video tape recorder system, which will be used to monitor and create visual records of testing on the Atmospheric Burner Test Rig, was received.
1-1
Burner System - Sub-task 02 (Continued)
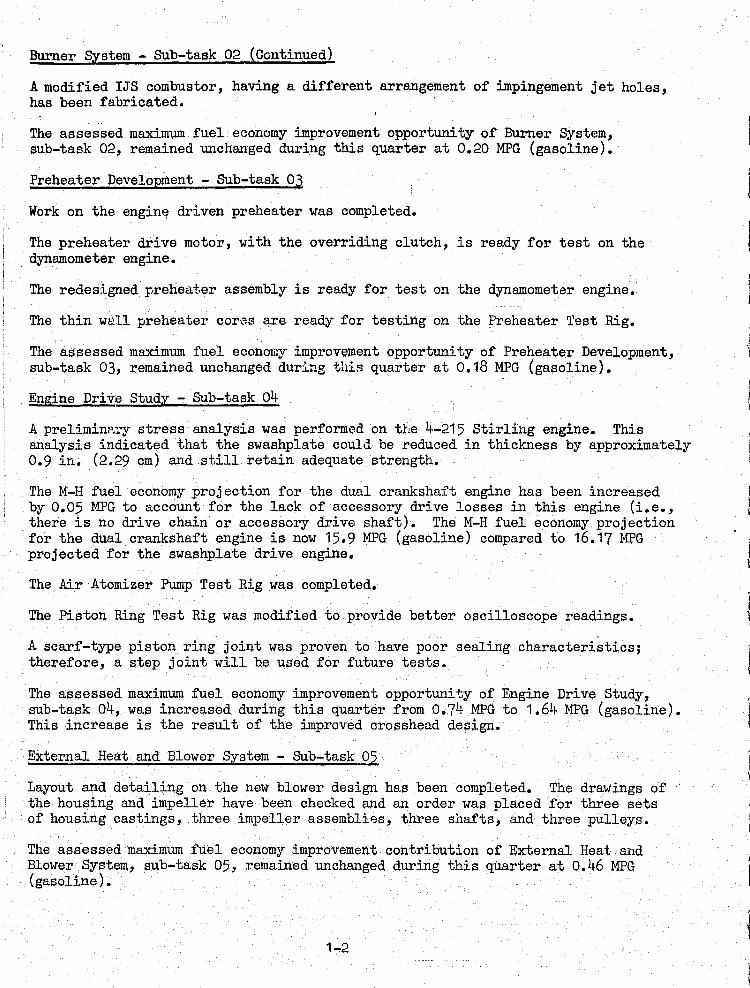
A modified IJS combustor, having a different arrangement of impingement jet holes, has been fabricated.
The assessed maximum fuel economy improvement opportunity of Burner System, sub-task 02, remained unchanged during this quarter at 0.20 MPG (gasoline).
Preheater Development - Sub-task 03
Work on the engin~ driven preheater was completed.
The preheater drive motor, with the overriding clutch, is ready for test on the dynamometer engine.
The redesigned preheater assembly is ready for test on the dynamometer engine.
The thin w~U preheater cor0S are ready for testing on the Preheater 'l'est Rig.
The assessed maximum fuel econol~y improvement opportunity of Preheater Development, sub-task 03, remained unchanged during tliifl quarter at 0.18 MPG (gasoline).
Engine Dri vie Study - Sub-task 04
A preliminl".l"Y stress analysis was perforIDEld on tbe 4-215 Stirling engine. This analysis indicated that the swashplate could be reduced in thickness by approximately 0.9 in. (2.29 cm) and still retain adequate strength.
The M-H fuel economy projection for the dual crankshaft engine has been increased by 0.05 MPG to account for the lack of accessory drive losses in this engine (i.e., there is no drive chain or accessory drive shaft). The M-H fuel economy projection for the dual crankshaft engine is now 15.9 MPG (gasoline) compared to 16.17 MPG projected for the swashplate drive engine.
The Air Atomizer Pump Test Rig was completed.
The Piston Ring Test Rig was modified to provide better oscilloscope readings.
A scarf-type piston ring joint was proven to have poor sealing characteristics; therefore, a step joint will be used for future tests.
The assessed maximum fuel economy improvement opportunity of Engine Drive Study, sub-task 04, was increased during this quarter from 0.74 MPG to 1.64 MPG (gasoline). This increase is the result of the improved crosshead design.
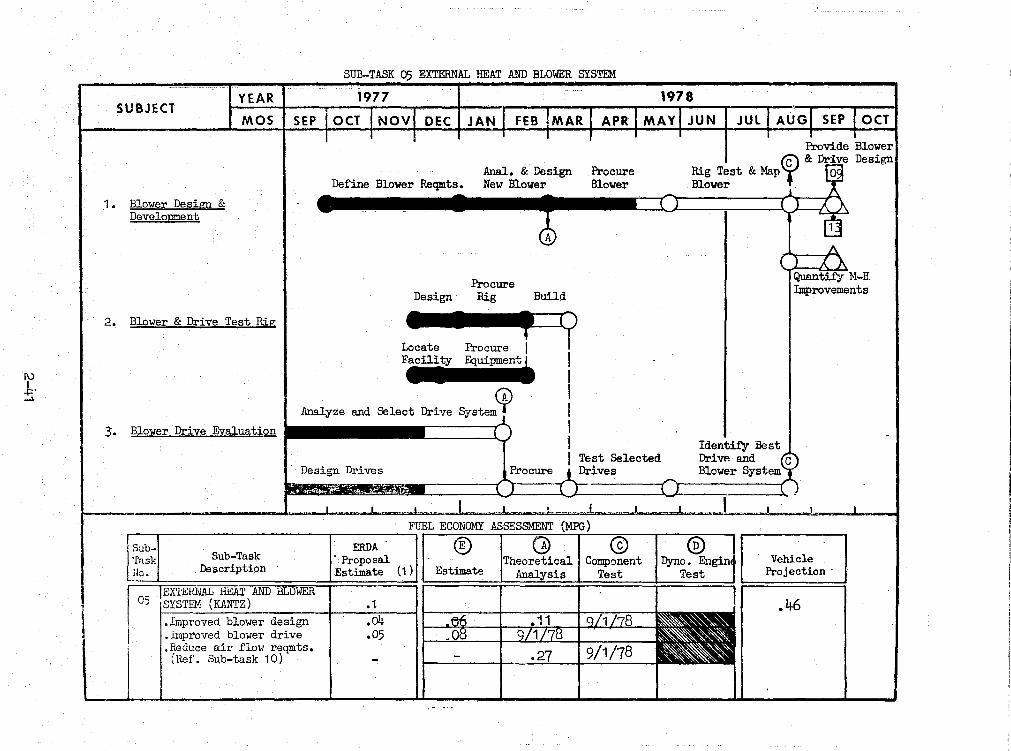
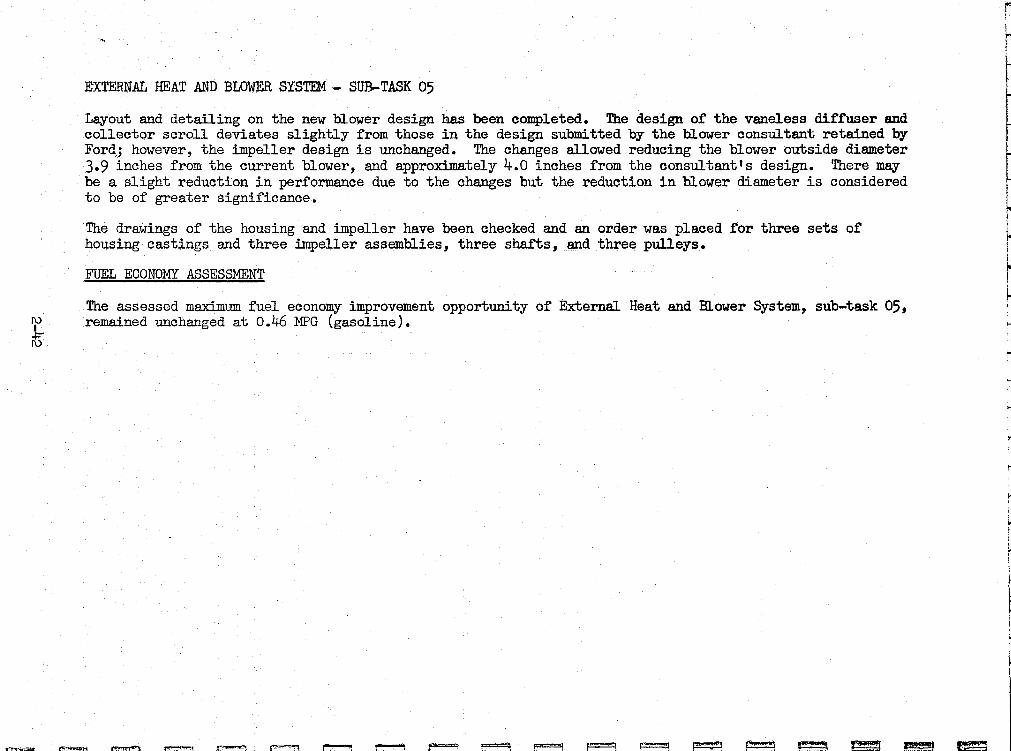
External Heat and Blower System - Sub-task 05
Layout and detailing on the new blower design has been completed. The drawings of the housing and impeller have been checked and an order was placed for three sets of housing castings, three impeller assemblies, three shafts, and three pulleys.
The assessed maximum fuel economy improvement contribution of External Heat and Blower System, sub-task 05, remained unchanged during this quarter at 0.46 MPG (gasoline).
1-2
I I
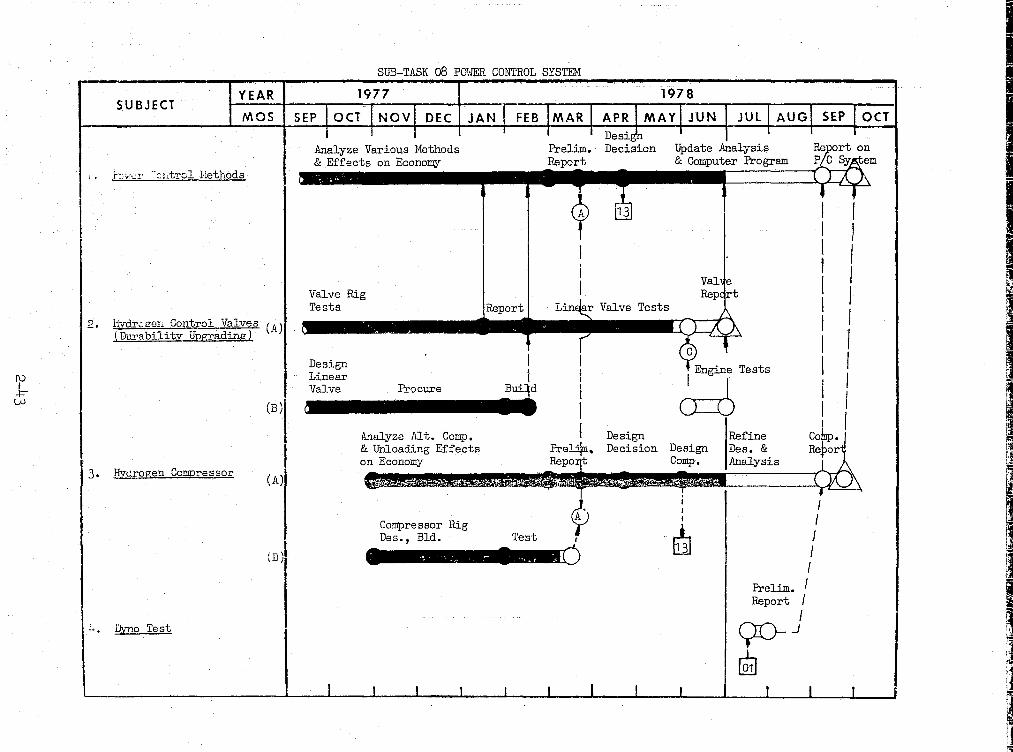
Power Control - Sub-task 08
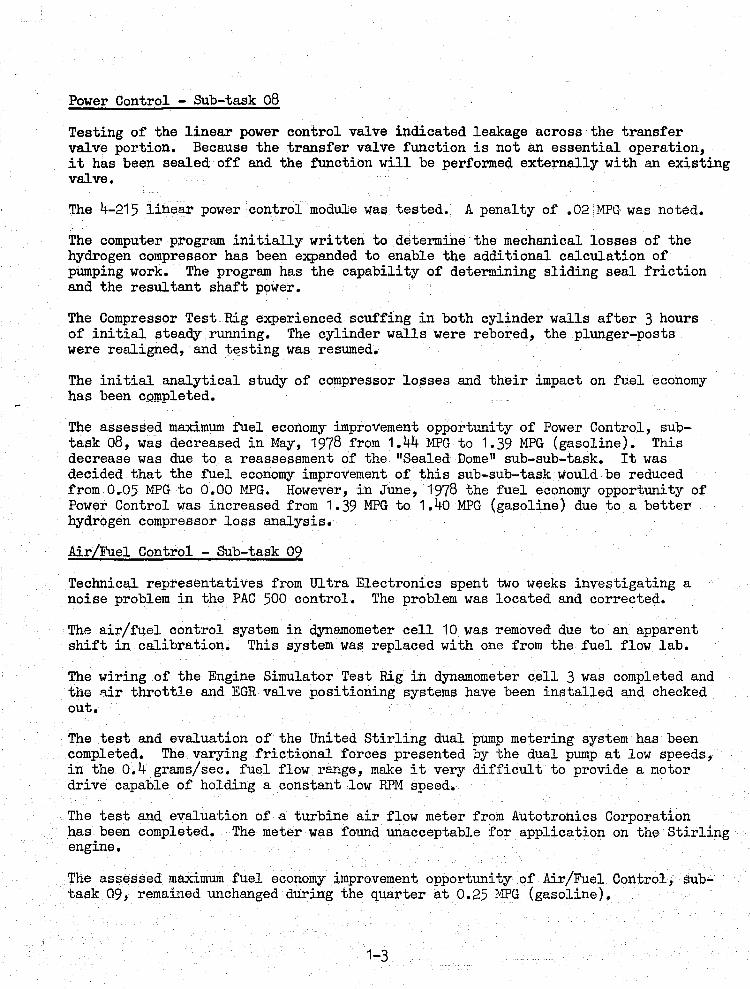
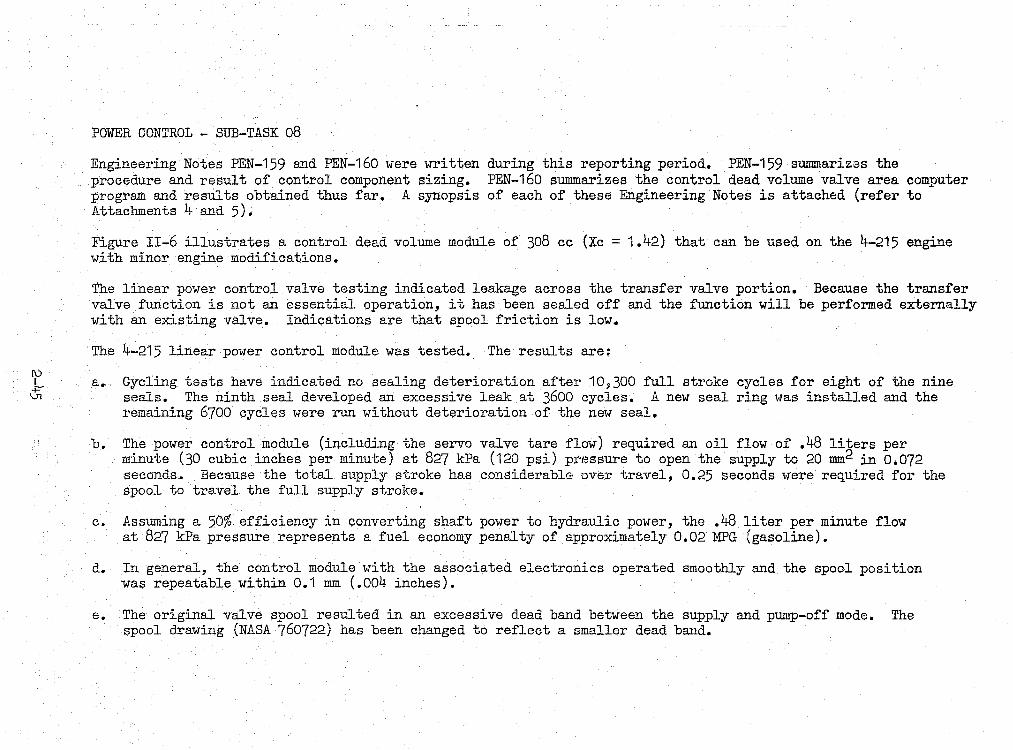
Testing of the linear power control valve indicated leakage across the transfer valve portion. Because the transfer valve function is not an essential operation, it has been sealed off and the function will be performed externally with an existing valve.
The 4-215 l~near power control module was tested. A penalty of .02MPG was noted.
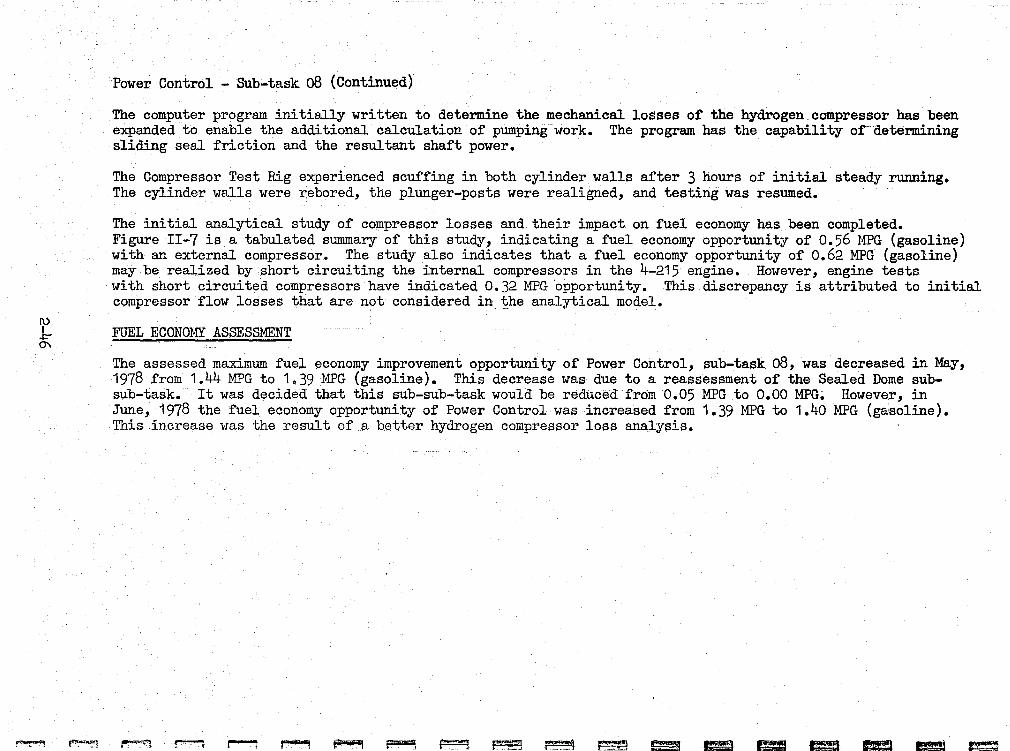
The computer program initially written to determine the mechanical losses of the hydrogen compressor has been expanded to enable the additional calculation of pumping work. The program has the capability of determining sliding seal friction and the resultant shaft power.
The Compressor Test Rig experienced scuffing in both cylinder walls after 3 hours of initial steady running. The cylinder walls were rebored, the plunger-posts were realigned, and t.esting was resumed.
The initial analytical study of compressor losses and their impact on fuel economy has been completed.
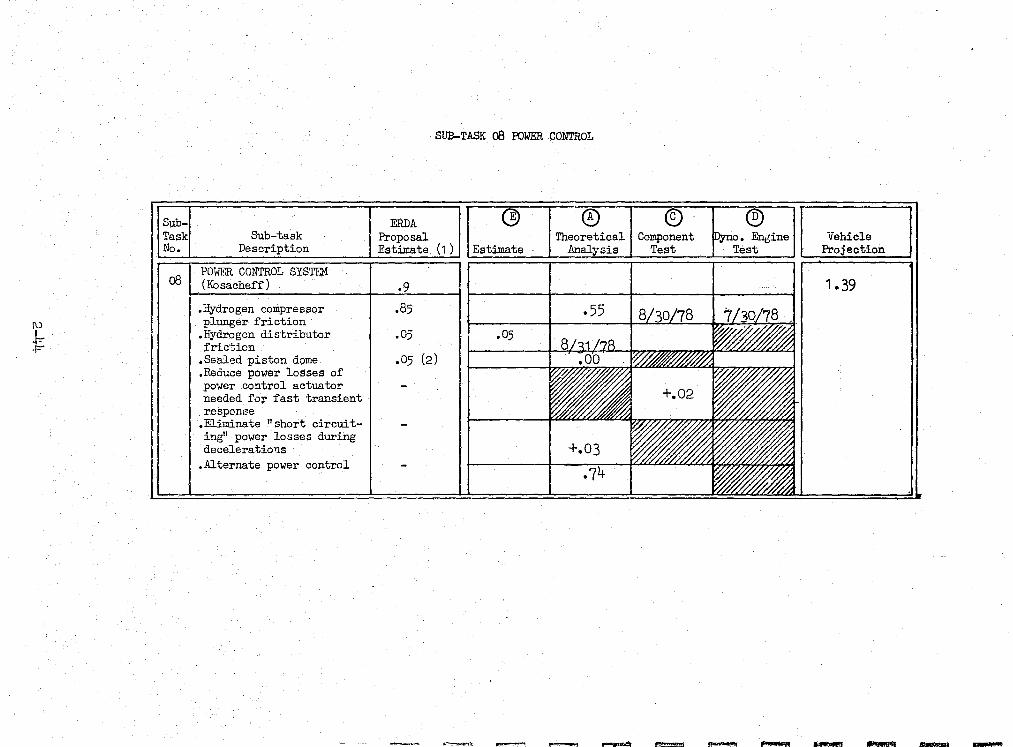
The assessed maximum fuel economy improvement opportunity of Power Control, subtask 08, was decreased in May, 1978 from 1.44 MPG to 1.39 MPG (gasoline). This decrease was due to a reassessment of the "Sealed Dome" sub-sub-task. It was decided that the fuel economy improvement of this sub-sub-task would be reduced from 0.05 MPG to 0.00 MPG. However, in June, 1978 the fuel economy opportunity of Power Control was increased from 1.39 MPG to 1.40 MPG (gasoline) due to a better hydrogen compressor loss analysis.
Air/~~el Control - Sub-task 09
Technical representatives from Ultra Electronics spent two weeks investigating a noise problem in the PAC 500 control. The problem was located and corrected.
The air/fuel control system in dynamometer cell 10 was removed due to an apparent shift in calibration. This system was replaced with one from the fuel flow lab.
The wiring of the Engine Simulator Test Rig in dynamometer cell 3 was completed and ths.~ir throttle and EGR valve positioning systems have been installed and checked out.
The test and evaluation of the United Stirling dual p~~p metering system has been completed. The varying frictional forces presented by the dual pump at low speeds, in the 0.4 grams/sec. fuel flow range, make it very difficult to provide a motor drive capable of holding a constant low RPM speed.
The test and evaluation of a turbine air flow meter from Autotronics Corporation has been completed. The meter was found unacceptable for application on the Stirling engine.
The assessed maximum fuel economy improvement opportunity of Air/Fuel Control, subtask 09, remained unchanged during the quarter at 0.25 ~WG (gasoline).
1-3
Cycle Analysis - Sub-task 10
The projected fuel economy improvement opportunity for sub~sub-task "Heater Tube Heat Flux" has been reduced from 0.16 MPG to 0.00 MPG. This reduction is due to the fact that heater tube heat flux is primarily dependent on full-load power, engine length, and engine diameter.
An optimization was completed with the cold-start fuel penalty incorporated into the optimized function. Analysis revealed that, using the same constraints and requirements of the fourth generation fuel economy engine on the It-215 Stirling engine, there is no fuel economy improvement available.
Due to some problems in the optimization procedure (not the algorithm that calculates the Stirling cycle), previous optimizations were not searching properly for the maximum fuel economy. With these problems corrected, the results from the optimized engine indicate an increase. in the incremental fuel economy improvement of 1.40 MPG (gasoline).
The assessed maximum fuel economy improvement opportunity of Cycle Analysis, subtask 10, was increas:ed during this quarter from 2.38 MPG to 3.60 MPG (gasoline).
other Fuel Economy Improvements - Sub-task 14
Sub-sub-task "Methods to Reduce Conduction Losses (Insulation)" has been add~d to this sub-task and the associated estimate for improvement in fuel economy of the fourth generation engine is 0.5 MPG (gasoline).
The assessed maximum fuel economy improvement contribution of Other Fuel Economy Improvements, sub-task 14, was increased during this quarter from 2.02 MPG to 2.52 MPG (gasoline).
Cooling System - Sub-task 15
The transparent plastic model which simulates the Stirling engine water jacket in the vicinity of the piston rod seals was fabricated, inspected, checked for leakage, and delivered.
The assessed maximum fuel economy improvement opportunity of Cooling System Analysis, sub-task 15, remained unchanged during this quarter at 0.06 MPG (gasoline).
Fuel Economy Analysis - Sub-task 06
The TOFEP computer program was modified to provide better part-throttle engine conditions via different shift points. The input data for this program was also modified to provide corresponding absolute fuel economy projections for the baseline vehicle.
i The PB1111 computer program was used to determine what changes were required to the torque levels of the TDEM247C engine map to achieve a 0-60 MPH acceleration time equal to that of the 351M IC engine-powered baseline vehicle (13.3 sec).
1-4
I
I I I
--------<--__ ~ ________ • ___________ .__..._.:tiJ_~_~~ ___ .. T' __ U_IIIII ___ I~
Fuei Economy Analysis - Sub-task 06 (Continued)
The Master Fuel Economy Assessment Chart was updated'to include "Confidence Weighted Opportunities," and also list maximum and minimum fuel economy opportunities. Also, two baseline fuel economy projection numbers now appear in the "Vehicle Projection" column.
CATEGORY 2
Engine Durability Upgrading - Sub-task 07
Pressure drops were recorded on ten regenerators which were received from N. V. Philips. The data from the testing of these regenerators was transmitted to N. V. Philips for a theoretical analysis.
The Ro~lsock Seal Test Rig set-up was completed and testing was initiated on seal assemblies which were modified to inclllde a check valve seal between the pumping ring and the rollsock.
Two sets of F-1 seals were run on the Compressor Drive Test Rig. Each set allowed large amounts of oil into the gas space in a relatively short time.
Testing of a set of F-~· seal cartridges began on the Compressor Drive Test Rig. The first set of cartridges completed approximately 65 hours of testing at 1000 RPM and 800 psi mean pressure with no indication of oil in the gas space.
The Swashplate Drive Test Rig modifications were completed and the reworked parts were received. Assembly of the rig is now complete.
A second set of F-4 seals completed 100 hours of testing on the Compressor Drive Test Rig at 1000 RPM and 800 psi mean pressure. One seal assembly allowed no oil past the scraper either into the test cylinder or the seal cartridge. The other seal hud a light film of oil inside the seal cartridge and possibly the test cylinder.
A third pair of F-4 seals also completed 100 hours of testing on the Compressor Drive Test Rig at 1000 RPM and 1000 psi mean pressure. Both seal assemblies were equipped with a Parker SCL seal. One of the SOL seals failed after 50 hours of testing and was replaced with a solid ring made of Rulon LD. When the test was completed, the cylinder with the solid ring had no oil in either the cartridge or the cylinder; however, the Rulon ring was badly worn and had extruded into the clearance gap.
Testing of the fourth set of F-4 seals has been initiated on the Compressor Drive Test Rig.
An analysis was performed to determine the order of magnitude of the temperatllre gradient which exists along the piston rod, since a large gradient could possibly result in less effective sealing. Approximate modeling of the spatial heat generation, conduction, and rejection indicates that the expected temperature gradient is not acceptable.
1-5
~erence Engine - Sub-task 13
!
A more detailed version of a double crank engine is presently being laid out. Engine auxiliary mountings will be investigated in an effort to have more realistic engine installat,ion studies.
Prepared by:
:~I/.~~ -E. W. Ki tzner, Manager Alternate Engines Research Dept. Ford Motor Company
: Technical Manager, Stirling ! Engine Program
Approved by:
1-6
I.
I.
I [
~l.i " .;
II. INTRODUCTION
This report is the third in a series of quarterly reports designed to detail the progress of the Ford/DOE Automotive Stirling Engine Development Program. This report contain$ no information pertaining to background or present contract. If that information is required, refer to the first Quarterly Technical Progress Report (cONs/4396-1-NASA CR-135331). This program is jointly funded by Ford Motor Company and the United States Department of Energy (DOE) under contract number EC-77-C-02-4396 which was effective September 19, 1977. The Department of Energy has delegated project management responsibility for this contract to the NASA-Lewis Research Center in Cleveland, Ohio.
The Automotive Stirling Engine Development Program is directed toward establishing the technological and developmental base that would enable a decision on whether an engineering program should be directed at Stirling engine production. Such engines are believed to provide an attractive alternative for meeting national needs related to fuel consumption and environmental protection. For example, the fuel economy of a Stirling powered automobile is estimated to be nominally 30% greater than that of a 1977 spark ignition engine powered automobile of equivalent size, weight, and performance. It is estimated that the Stirling engine powered automobile will also meet the 1976 standards set forth in the Clean Air Amendments of 1970.
The program is divided into twelve overlapping Tasks. Four of these Tasks are directed toward the iterative development of the Stirling Engine System via a series of engine "generations."
Task I covers the first year's effort of the program. The objective of this Task is to perform certain analyses and component development work for the purpose of determining whether the fuel economy objective established for the fourth generation Stirling engine (30% improvement) can be achieved. To accomplish this objective, durability upgrading of the current Stirling engine is required.
Specifically, Task I is directed toward achieving, with a high degree of confidence, the May 12, 1977 ERDA proposal estimate of 20.6 MFG (gasoline) for a 4500 lb. IWC Stirling engine powered passenger car. At this time, the confidence level for this projection, using fourth generation technology, is 26.1 MFG with a confidence level of 44%.
1-7
SECTION 2
TASK I, FUEL ECONOMY ANALYSIS
I. GENERAL
Task I of the Automotive Stirling Engine Development Program has been divided into two categories. Category 1 consists of those sub-tasks that are directly related to fuel economy. Category 2 consists of sub-task 7, Engine Durability Upgrading; sub-task 11, Responsive Support; sub-task 12, Contract Support; and sub-task 13, Reference Engine. These sub-tasks are not directly related to fuel economy evaluation but are an integral part of the Task I effort. Each of the fifteen sub-tasks will be reported on individually.
II. REPORT FORMAT
Each sub-task consists of several separate but related operations which are listed as sub-sub-tasks. The report for each sub-task is as follows:
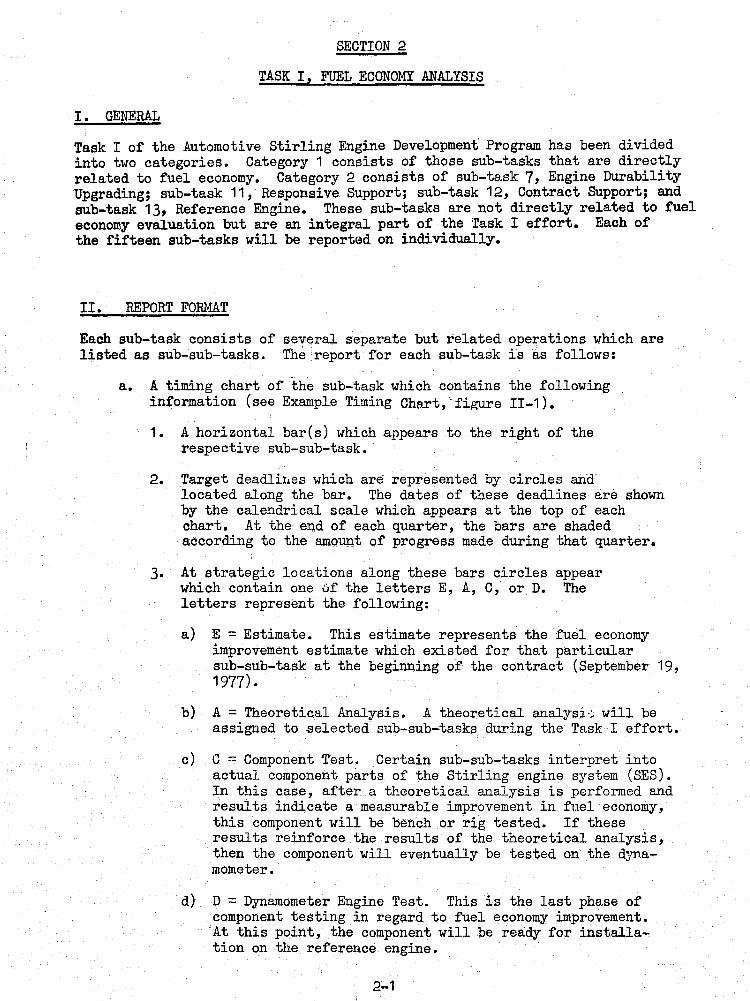
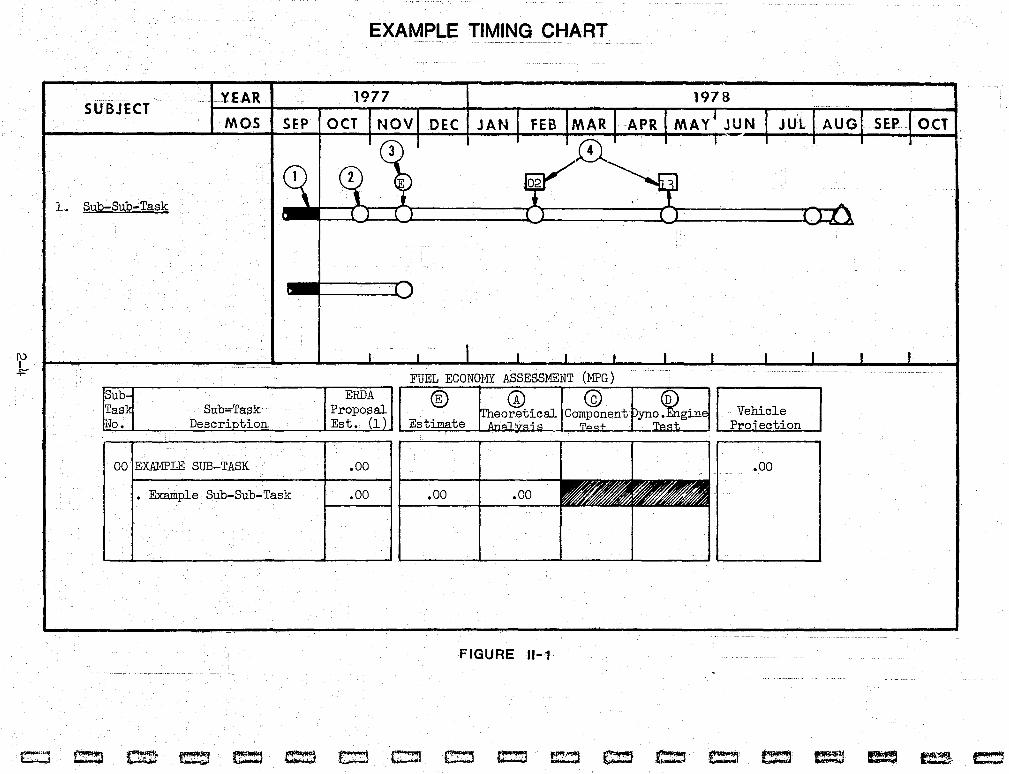
a. A timing chart of the sub-task which contains the following information (see Example Timing Chart,'figure II-1).
1. A horizontal bares) which appears to the right of the respective sub-sub-task.
2. Target deadliri8s which are represented by circles and located along the bar. The dates of these deadlines are shown by the calendrical scale which appears at the top of each chart. At the end of each quarter, the bars are shaded according to the amount of progress made during that quarter.
3. At strategic locations along these bars circles appear which contain one of the letters E, A, C, or D. The letters represent the following:
a) E = Estimate. This estimate represents the fuel economy improvement estimate which existed for that particular sub-sub-task at the beginning of the contract (September 19, 1977) •
b) A = Theoretical Analysis. A theoretical analysi-: will be assigned to selected sub-sub-tasks during the Task I effort.
c) C = Component Test. Certain sUb-sub-tasks interpret into actual component parts of the Stirling engine system (SES). In this case, after a theoretical analySis is performed and results indicate a measurable improvement in fuel economy, this component will be bench or rig tested. If these results reinforce the results of the theoretical analysis, then the component will eventually be tested on' the dynamometer.
d) D = Dynamometer Engine Test. This is the last phase of component testing in regard to fuel economy improvement. At this point, the component will be ready for installation on the reference engine.
2-1
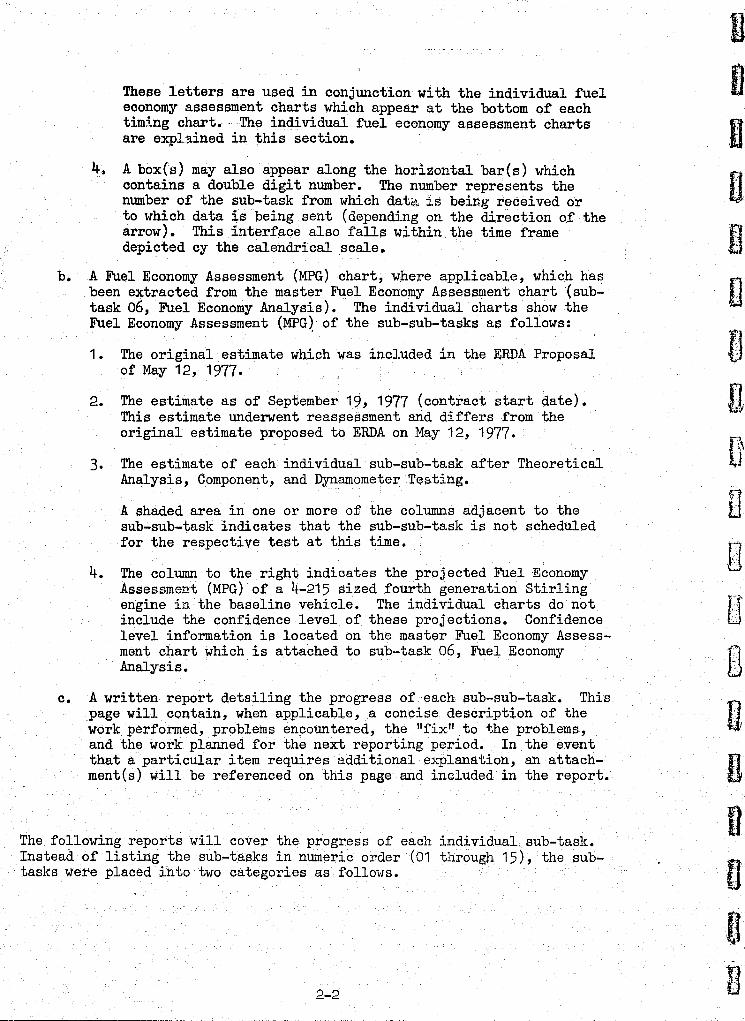
These letters are used in conjunction with the individual fuel economy assessment charts which appear at the bottom of each timing chart. The individual fuel economy assessment charts are expl"'iined in this section.
4, A box(s) may also appear along the horizontal bar(s) which contains a double digit number. The number represents the number of the sub-task from which date1 is being received or to which data is being sent (depending on the direction of the arrow) • This interface also falls wi thin the time frame depicted cy the calendrical scale. .
b. A Fuel Economy Assessment (MPG) chart, where applicable, which has been extracted from the master Fuel Economy Assessment chart '(subtask 06, Fuel Economy Analysis).' The individual charts show the Fuel Economy Assessment (MPG) of the sub-sub-tasks as follows:
1. The original estimate which was included in the ERDA Proposal of May 12, 1977.
2. The estimate as of September 19, 1977 (contract start date). This estimate underwent reassessment and differs from the original estimate proposed to ERDA on May 12, 1977.
3. The estimate of each individual sub-sub-task after Theoretical Analysis, Component, and Dynamometer Testing.
A shaded area in one or more of the columns adjacent to the sub-sub-task indicates that the sub-sub-task is not scheduled for the respective test at this time.
4. The column to the right indicates the projected Fuel Economy Assessment (MPG) of a 4-215 sized fourth generation Stirling engine in. the baseline vehicle. The individual charts do not include the confidence level of these projections. Confidence level information is located on the master Fuel Economy Assessment chart which is attached to sub-task 06, Fuel Economy Analysis.
c. A written report detailing the progress of each sub-sub-task. This page will contain, when applicable, a concise description of the work performed, problems encountered, the "fix" to the problems, and the work planned for the next reporting period. In the event that a particular item requires additional e~~lanation, an attachment(s) will be referenced on this page and included in the report.
The following reports will cover the progress of each individual,sub-task. Instead of listing the sub-tasks in numeric order (01 through 15), the ,sub-tasks were placed into two categories as follows. .
2-2
D n
Category 1
~ Mapping and Optimization - sub-task 01 Burner System - sub-task 02 .:
•
•
Preheater Development - sub-task 03 Engine Drive Study - sub-task 04 External Heat and Blower System - sub-task 05 Power Cont.rol - sub-task 08 Air/Fuel Control - sub-task 09 Cycle Analysis - sub-task 10 Other Fuel Economy Improvements - sub-task 14 Cooling System Analysis - sub-task 15 Fuel Economy Analysis - sub-task 06
Category 1 consists of those sub-tasks which are directly related to fuel eoonomy. Fuel Economy Analysis - sub-task 06, is placed at the end of this oategory because a portion of this sub-task is dedicated to coordinating all the fuel economy improvement contributions from the other sub-tasks in Category 1 and listing them o~ the master Fuel Economy Assessment ohart located in sub-task 06. Concurrent with coordinating the fuel eoonomy improvement contributions, a confidence level for these fuel economy improvement numbers is also assigned.
Category 2
Engine Durability Upgrading - sub-task rJ7 Responsive Support - sub-task 11 Contract Support - sub-task 12 Reference Engine - sub-task 13
Category 2 consists of those sub-tasks not direotly related to fuel eoonomy but are nevertheless an integral part of the Task I effort.
III. Individual Sub-task Progress
The following reports detail the progress of each individual sub-task.
2-3
~ +
c::;:l.
SUBJECT .YEAR
MOS
1. Sub-Sub-Task
~ ~
~ub-Task Sub--Task Ho. Descr:i.ption
00 EXAMPLE SUB-TASK
• Example Sub-Sub-Task
~~ e= ~
EXAMPLE TIMING CHART
1977 1978
DEC I JAN OCT
FUEL ECONOHY ASSESSMENT (}1PG ) ERDA
Proposal Est. (11
® h ~ I @ . eoretical Component EstlInate n~", '?"~" '"
.00 .00
.00 .00 .00 L_~ __
FIGURE 11-1
c;::! CJ e:::J r:::::l r.'!':'J c::J e t.:=l ~. == e:= tl!.~ ~
~ V1
SUB-TASK 01 MAPPING & OPTIMIZATION
1977 YEAR SUBJECT
MOS I SEP DEC I JAN
~ Est. Baseline Datal & Repeatabilit,y I
1 • MapDing (Dyno #1 0 )
2. Components Evaluation (Dyne #1)
Sub-'Task Sub-Task No. Description . ."
ERDA . ··Proposal:--
Estilnate (1 )
01 MAPPING & OPrlMIZATIOU (ER~IN) > ( .. :~! ..... ~04 .Reduced EGR requirements
.Reduced exhaust back-pressure .03
._,e air flow reqmteo
j .04
• Temperat~e_sCheduling_ . .27
--_._--
Prepare Dyno Cell
Estimate
1978
JUl
Mapping A/F Ratio, EGR, and,.lleater Head Temp.
Engine Installation and Shakedown
Evaluate Components From Sub-tasks:
~ I Ef ~~~
Theoretical Analysis
Component IDyno. Engine Test Test
OCT
Report
Vehicle Projection
.. 25
I
MAPPING AND OPTIMIZATION - SUB-TASK·Ol
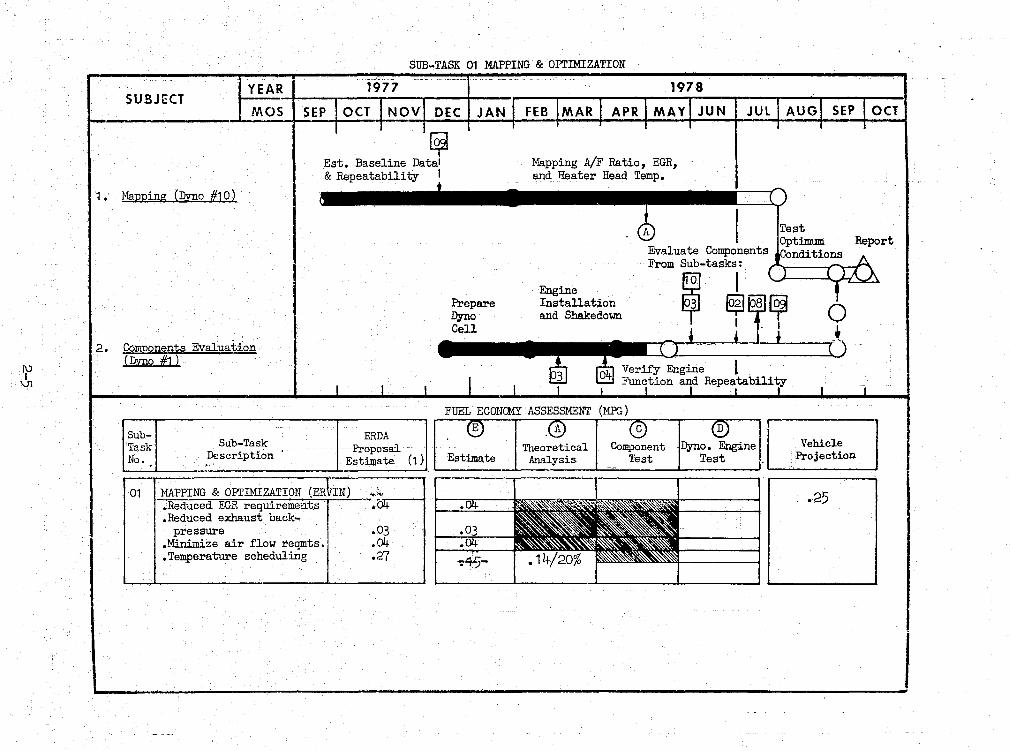
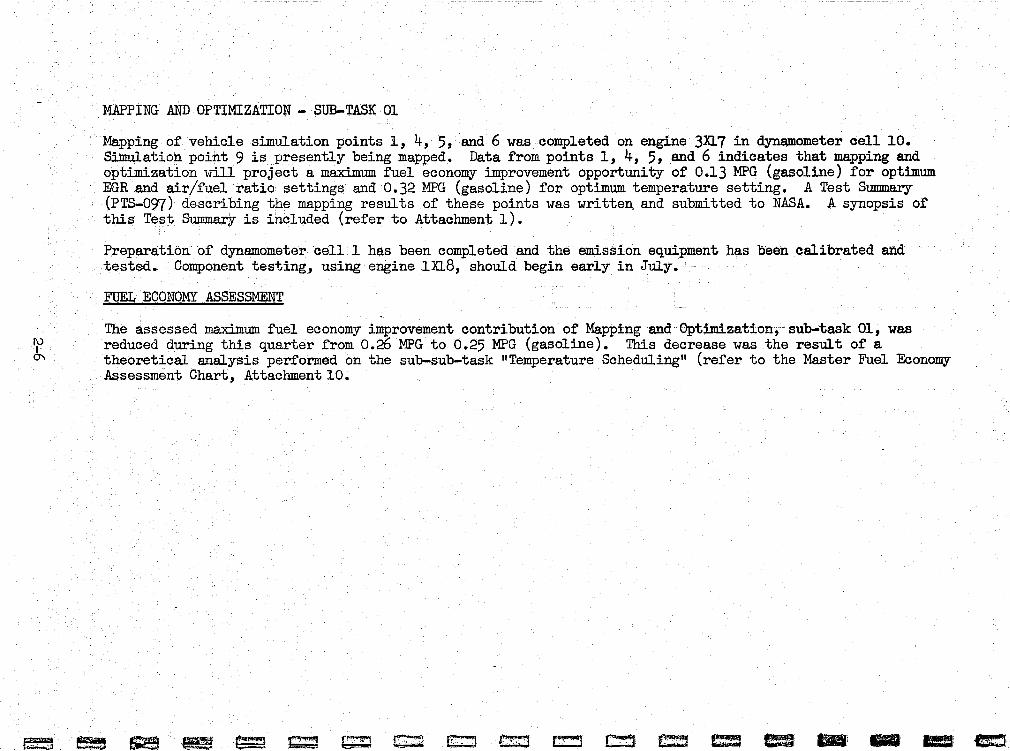
Mapping of vehicle simulation points 1, 4, 5, and 6 was completed on engine 3n7 in dynamometer cell 10. Simulation point 9 is presently being mapped. Data from points 1, 4, 5, and 6 indicates that mapping and optimization will project a maximum fuel economy improvement opportunity of 0.13 MPG (gasoline) for optimum EGR and ai~/fuel ratio settings and 0.32 MPG (gasoline) for optimum temperature setting. A Test Summary (PTS-097) describing the mapping results of these points was writte~ and submitted to NASA. A synopsis of this Test Summary is included (refer to Attachment 1).
Preparation of dynamometer cell 1 has been completed and the emission equipment has been calibrated and tested. Component testing, using engine lX18, should begin early in July.
FUEL ECONOMY ASSESSMENT
The assessed maximum fuel economy improvement contribution of Mapping and Optimization, sub-task 01, was ~ reduced during this quarter from 0.26 MPG to 0.25 MPG (gasoline). This decrease was the result of a 0'\ theoretical analysis performed on the sub-sub-task "Temperature Scheduling" (refer to the Master Fuel Economy
Assessment Chart, Attachment 10.
~~~~~~~~~~~~~=----~
Attachment 1
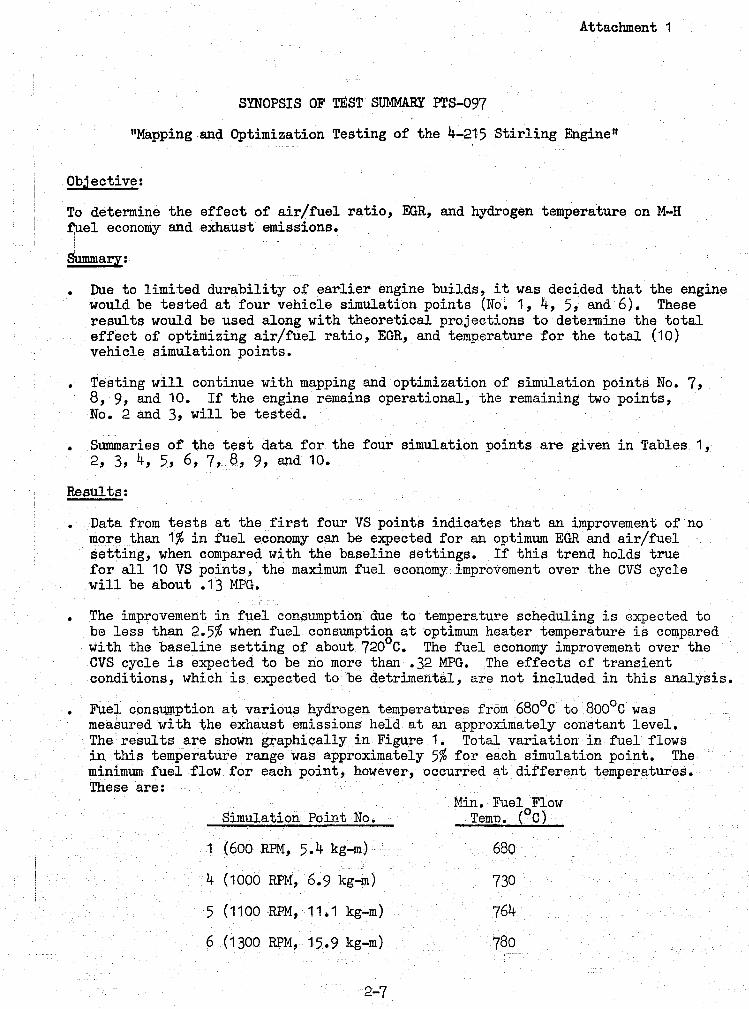
SYNOPSIS OF TEST SUMMARY PTS-097
"Mapping and Optimization Testing of the 4-215 Stirling Engine"
Objective:
To determine the effect of air/fuel ratio, EGR, and hydrogen temperature on M-H ~el economy and exhaust emissions.
Summary:
•
•
Due to limited durability of earlier engine builds, it was decided that the engine would be tested at four vehicle simulation points (No.1, 4, 5, and 6). These results would be used along with theoretical projections to determine the total effect of optimizing air/fuel ratio, EGR, and temperature for the total (10) vehicle simulation points.
Testing will continue with mapping and optimization of simulation points No.7, 8, 9, and 10. If the engine remains operational, the remaining two points, No. 2 and 3, will be tested.
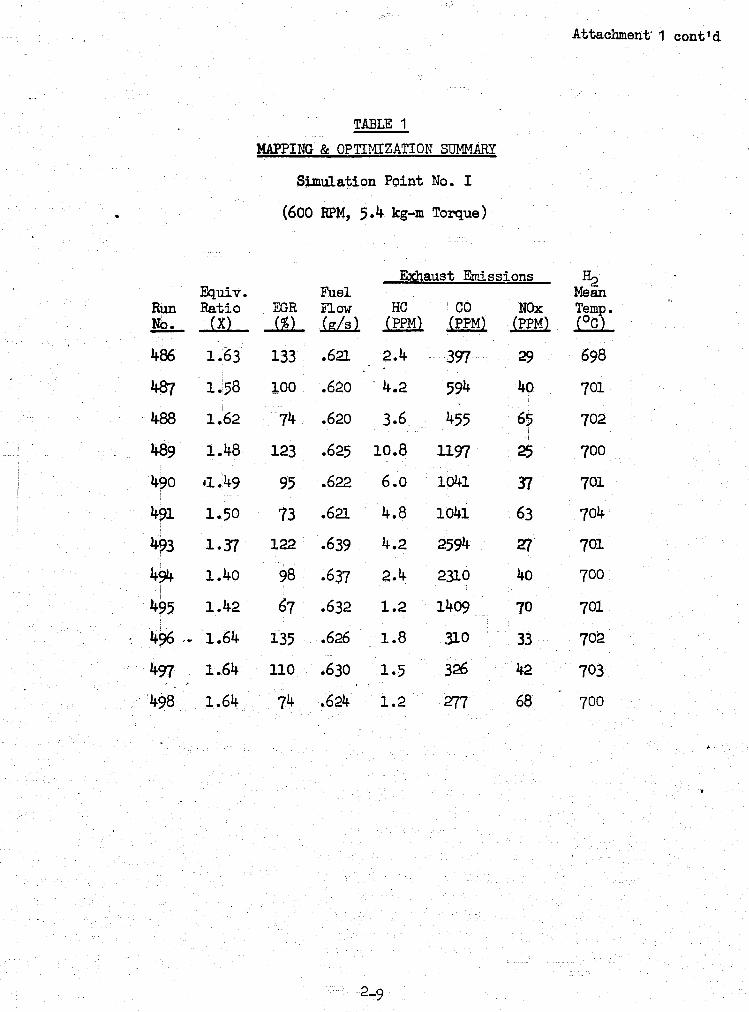
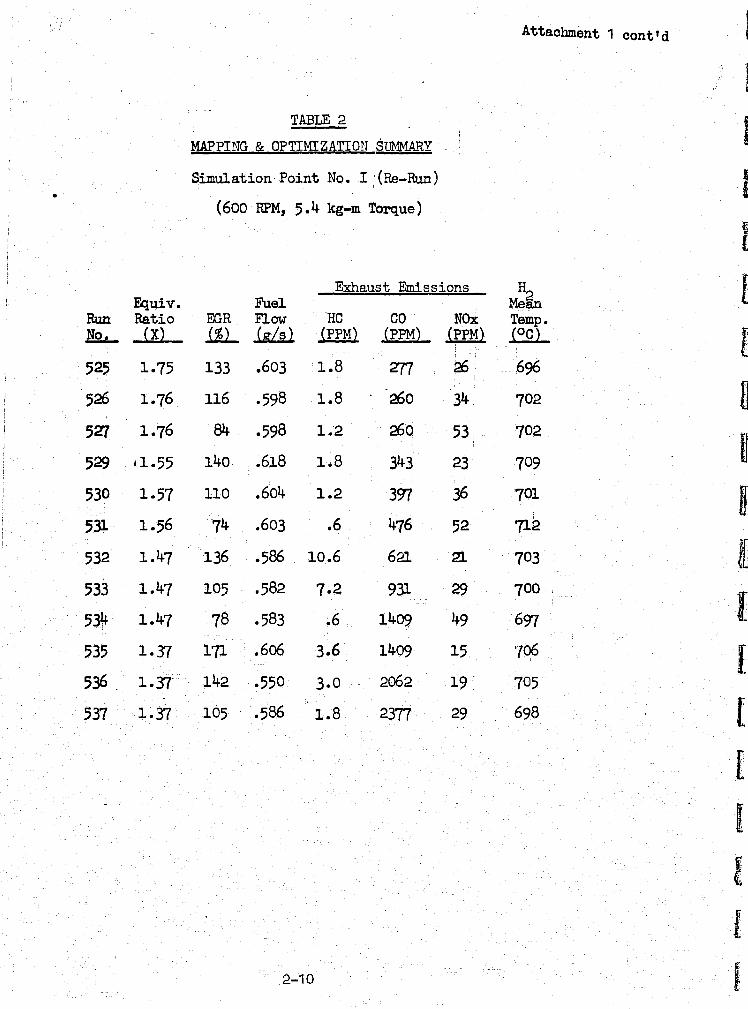
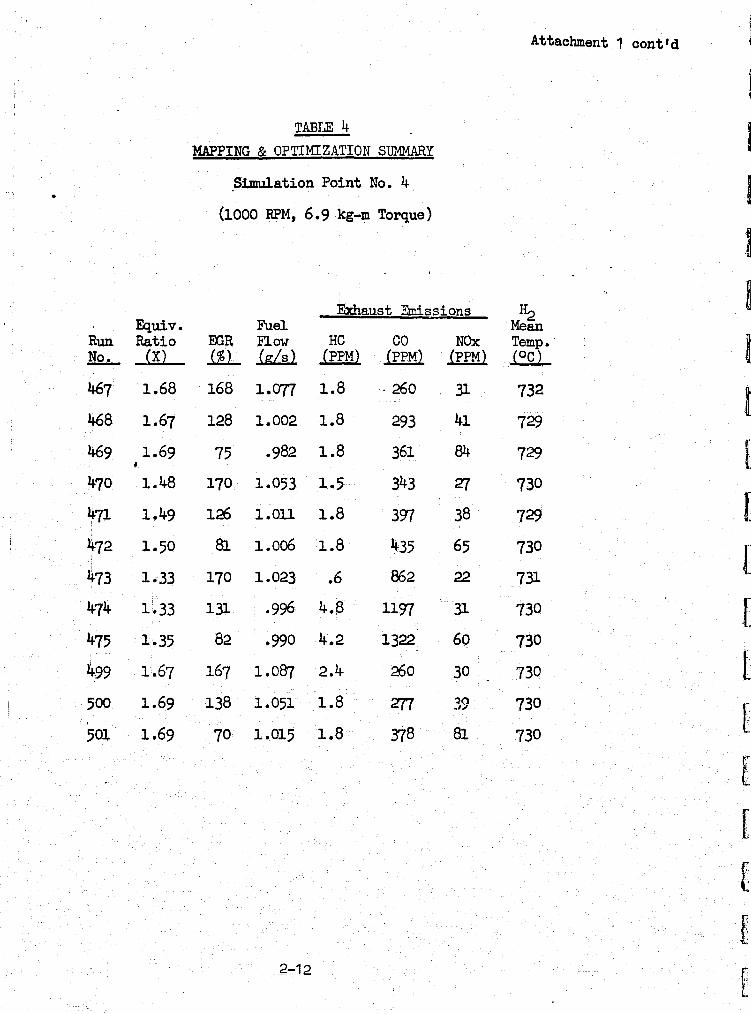
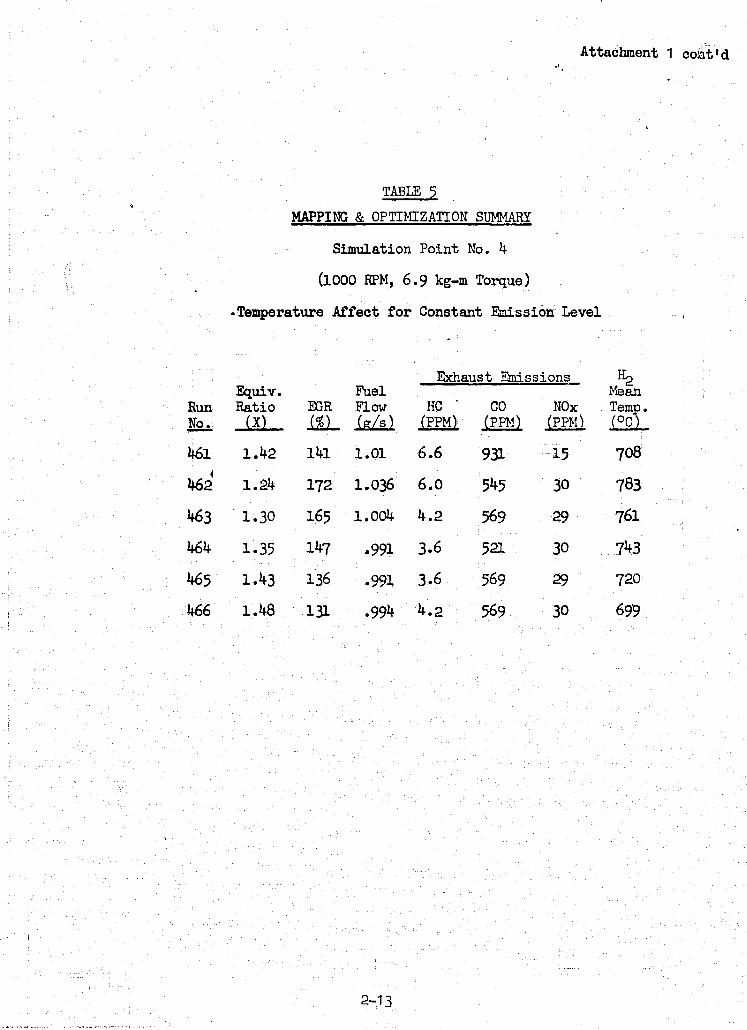
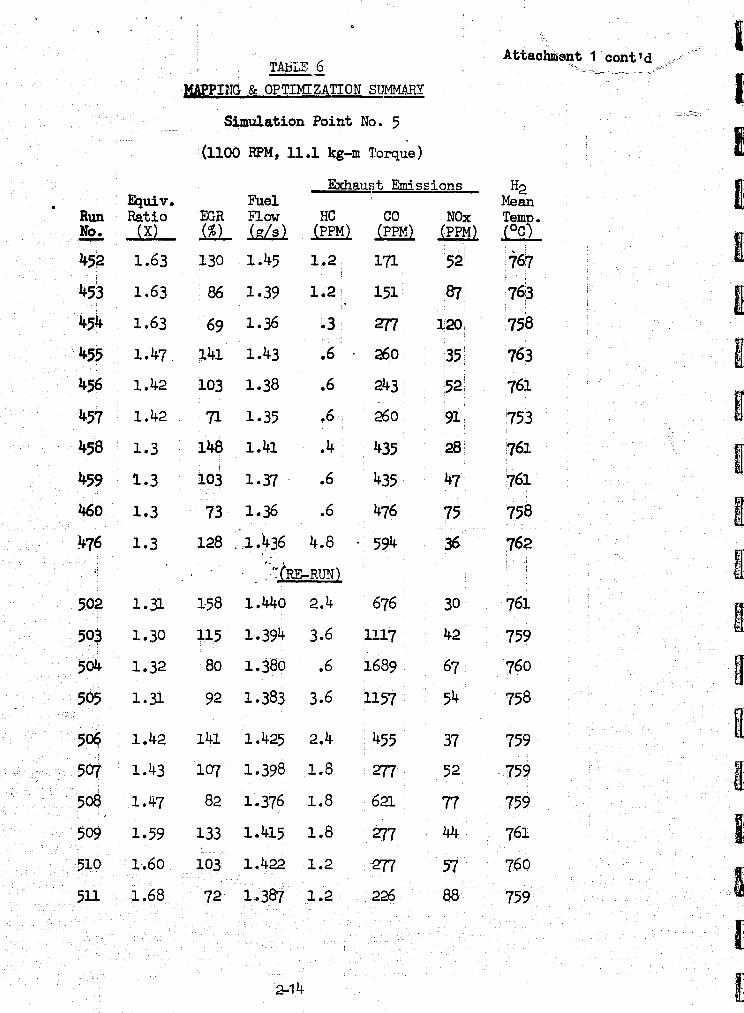
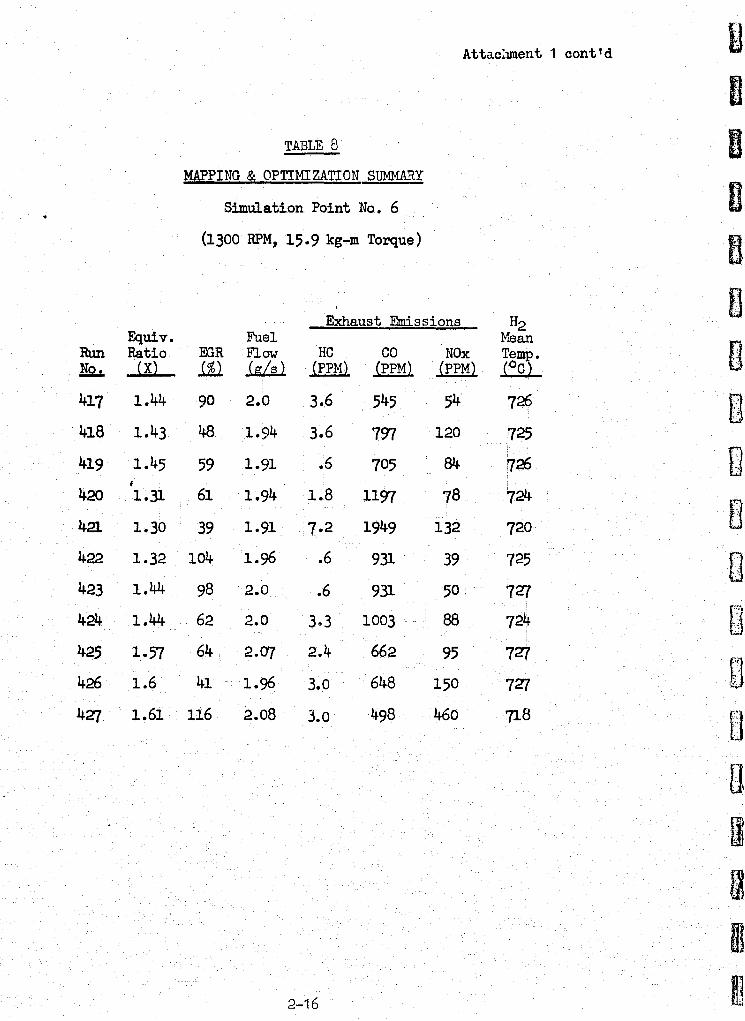
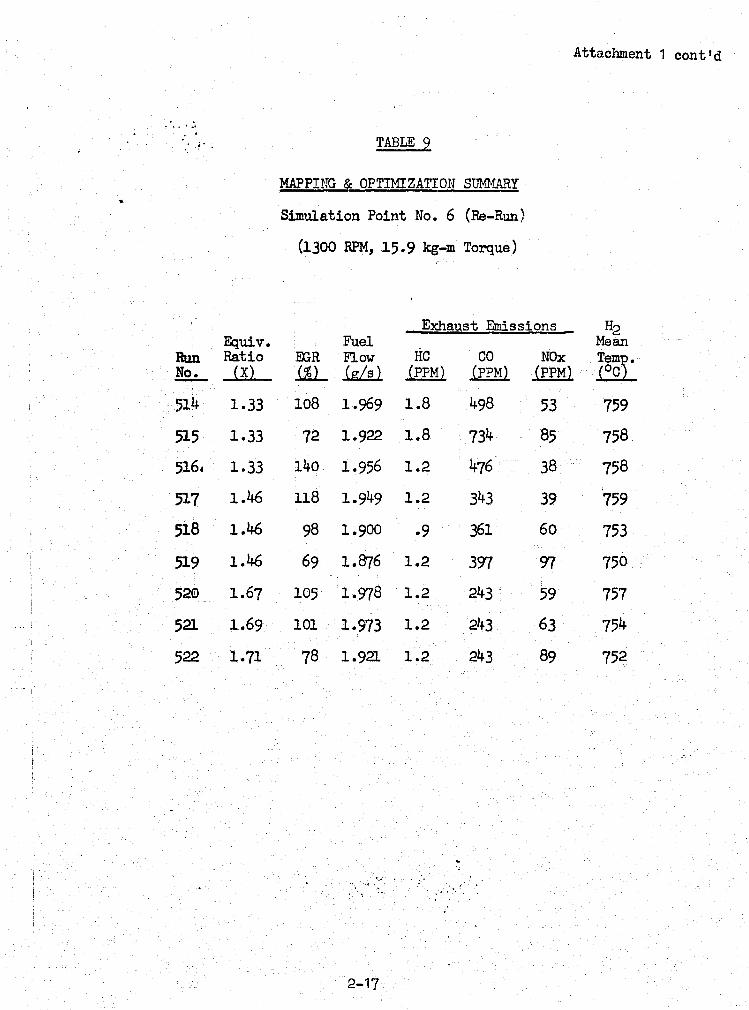
Summaries of the test data for the four simulation points are given in Tables 1, 2, 3, 4, 5, 6, 7, 8, 9, and 10.
Results:
Data from tests at the first four VS points indicates that an improvement of no more than 1% in fuel economy can be expected for an optimum EGR and air/fuel setting, when compared with the baseline settings. If this trend holds true for all 10 VS points, the maximum fuel economy improvement over the OVS cycle will be about .13 MPG.
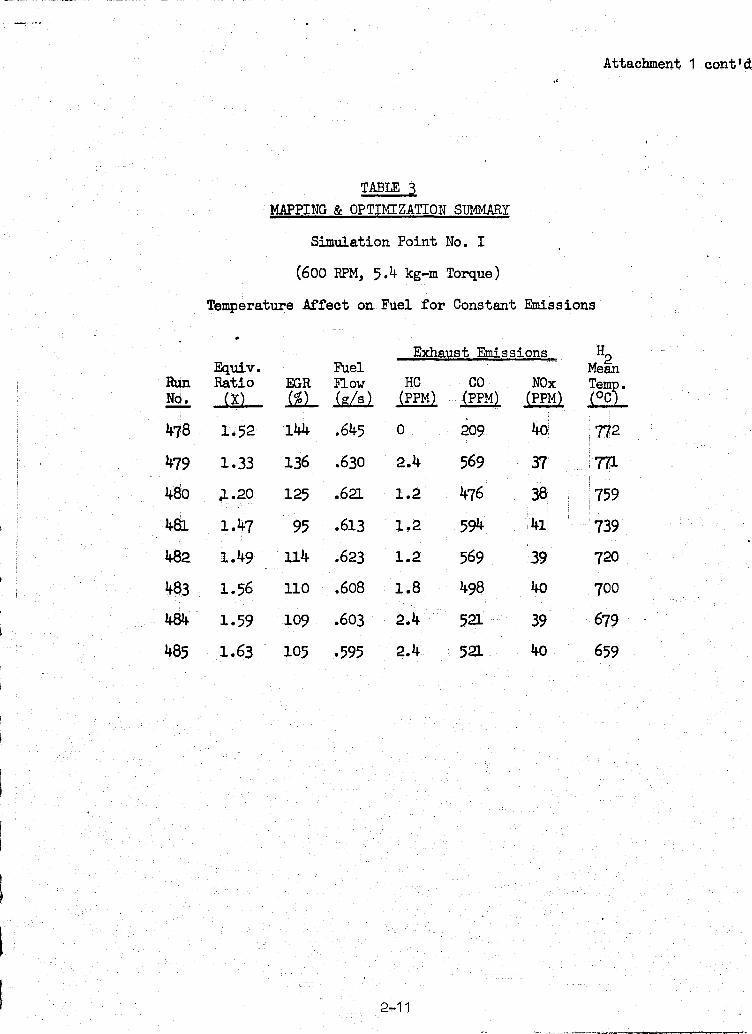
The improvement in fuel consumption due to temperature scheduling is expected to be less than 2.5% when fuel consumption at optimum heater temperature is compared with the baseline setting of about 7200 0. The fuel economy improvement over the CVS cycle is expected to be no more than .32 MPG. The effects of transient conditions, which is expected to be detrimental, are not included in this analysis.
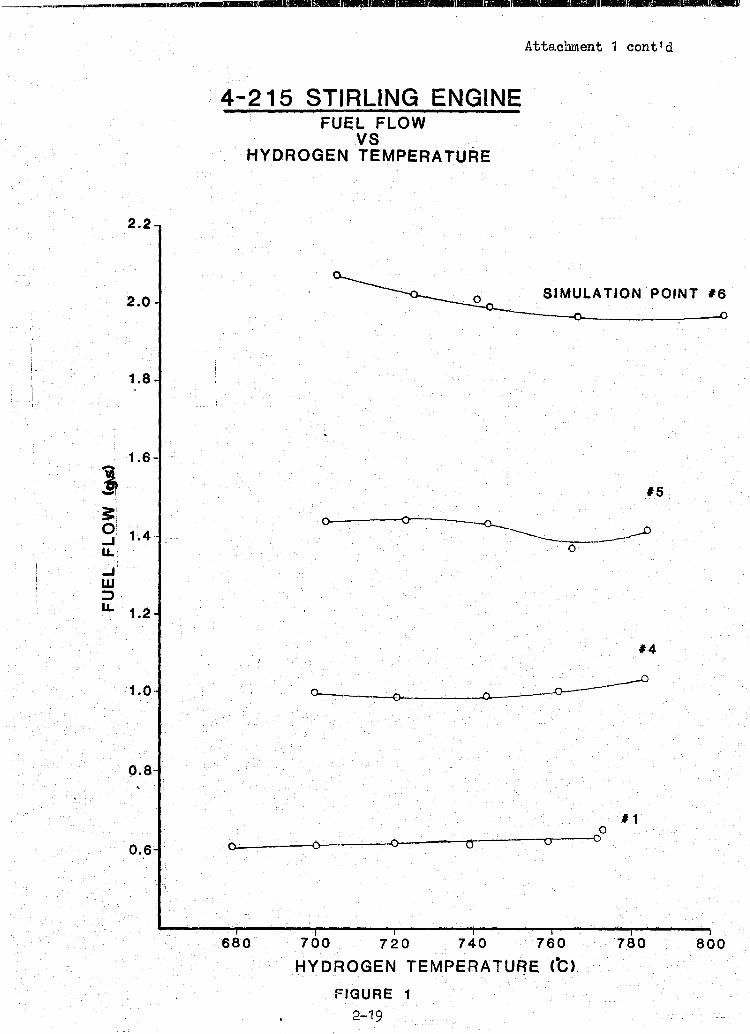
Fue+ cons~ption at various hydrogen temperatures from 6800 0 to 8000 0 was measured with the exhaust emissions held at an approximately constant level. The results are shown graphically in Figure 1. Total variation in fuel flows in this temperature range was approximately 5% for each simulation point. The minimum fuel flow for each point, however, occurred at different temperatures. These are:
Simulation Point No.
1 (600 RPM, 5.4 kg-m)
4 (1000 RPM, 6.9 kg-m)
5 (1100 RPM, 11.1 kg-m)
6 (1300 RPM, 15.9 kg-m)
2-7
Min. Fuel Flow Temp. (00 )
680
730
764
780
-2- Attachment 1 cont'd
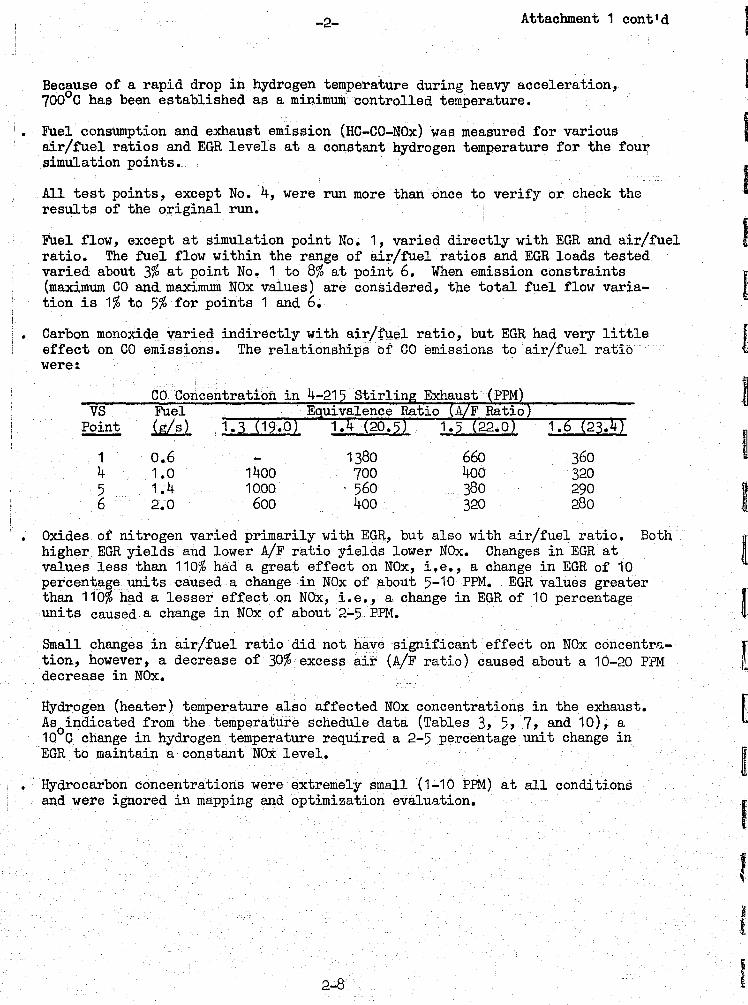
Because of a rapid drop in hydrogen temperature during heavy acceleration, 7000 C has been established as a minimum controlled temperature. .
Fuel consumption and exhaust emission (HC-CO-NOx) was measured for various air/fuel ratios and EGR levels at a constant hydrogen temperature for the fou~ simulation points.
All test points, except No.4, were run more than once to verify or check the results of the original run.
Fuel flow, except at simulation point No.1, varied directly with EGR and air/fuel ratio. The fuel flow within the range of air/fuel ratios and EGR loads tested varied about 3% at point No. 1 to 8% at point 6. When emission constraints (maximum CO and maximum NOx values) are considered, the total fuel flow variation is 1% to 5% for points 1 and 6.
Carbon monoxide varied indirectly with air/fg~l ratio, but EGR had very little effect on CO emissions. The relationships of CO emissions t? air/fuel ratio were:
VS Point 1.
1 0.6 1380 660 360 4 1.0 1400 700 400 320 5 1.4 1000 560 380 290 6 2.0 600 400 320 280
Oxides of nitrogen varied primarily with EGR, but also with air/fuel ratio. Both higher EGR yields and lower A/F ratio yields lower NOx. Changes in EGR at values less than 110% had a great effect on NOx, i.e., a change in EGR of 10 percentage units caused a change in. NOx of about 5-10 PPM. EGR values greater than 110% had a lesser effect on NOx, i.e., a change in EGR of 10 percentage units caused a change in NOx of about 2-5 PPM.
Small changes in air/fuel ratio did not have significant effect on NOx concentration, however, a decrease of 30% excess air (A/F ratio) caused about a 10-20 PPM decrease in NOx.
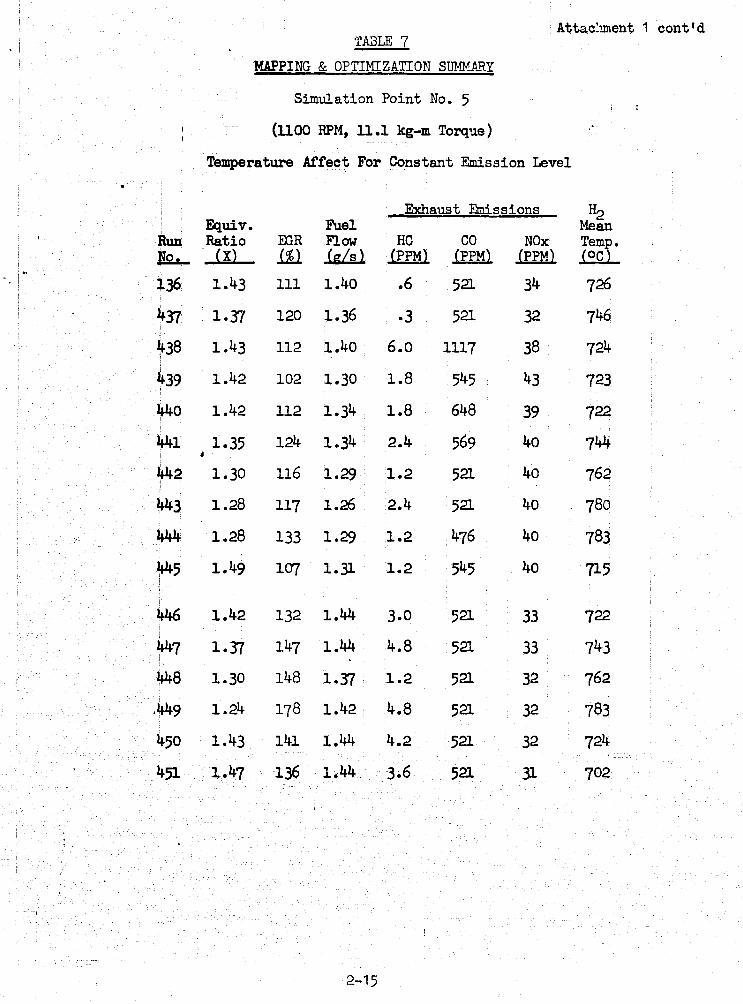
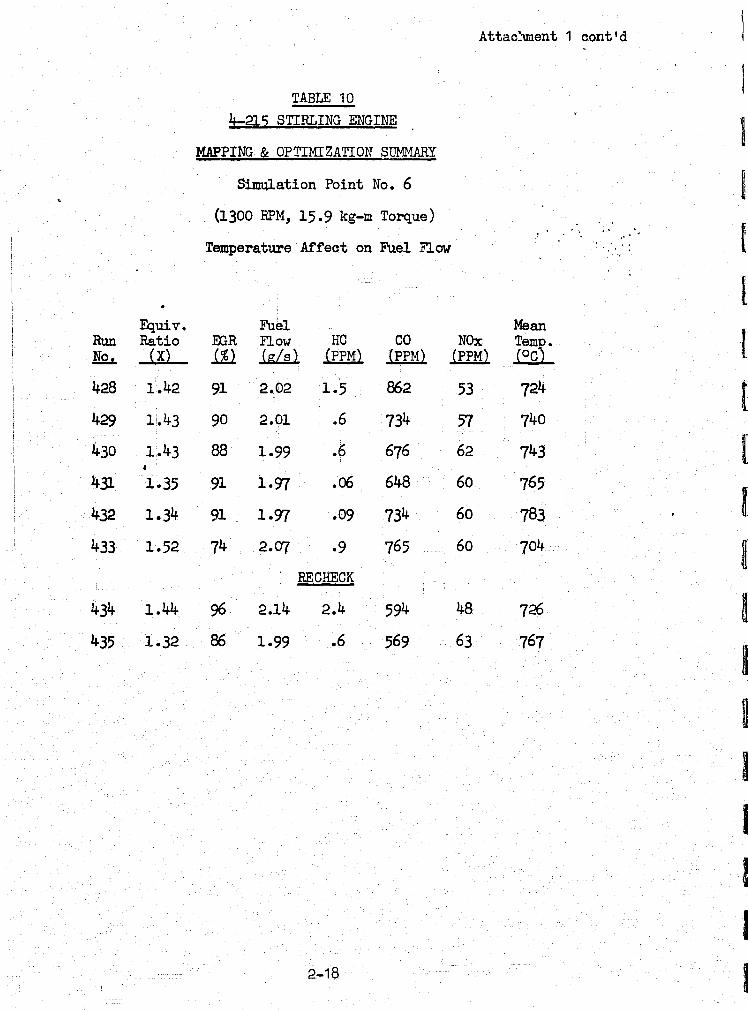
HYdrogen (heater) temperature also affected NOx concentrations in the exhaust. As indicated from the temperature schedule data (Tables 3, 5, 7, and 10), a 100 C change in hydrogen temperature required a 2-5 percentage unit change in EGR to maintain a constant NOx level •
• . Hydrocarbon concentrations were extremely small (1-10 PPM) at all conditions and were ignored in mapping and optimization evaluation.
2-8
I I
Attachmen~ 1 cont'd
TABLE 1
MAPPING & OPTIMIZATION SUMMARy
Simulation Point No. I
(600 RPM, 5.4 kg-m Torque)
Exhaust Emissions Me1n Fquiv. Fuel
RUn Ratio IDR F10w HO ' 00 NOx Temp. l!2.:..- (X) (%) .{gill (PPM) (PPM) (PPM) (°0)
486 1.63 133 .621 2.4 397 29 698
487 1.58 :1.00 .620 ' 4.2 594 40 701
488 1.62 74 .620 3.6 455 65 702
489 1.48 123 .625 10.8 1197 25 700
490 41.49 95 .622 6.0 1041 J7 701
491 1.50 73 .621 4.8 1041 63 704
493 1.37 122 .639 4.2 2594 Zl 701
494 1.40 98 .637 2.4 2310 40 700 , ,
495 1.42 67 .632 1.2 1409 10 701 ,
496 .• 1.64 .626 1.8 ,
33 102 135 310
4cn 1.64 110 .630 1.5 326 42 703
'498 1.64 74 .624 1.2 277 68 700
" I Attachment 1 cont'd 1]
I TABLE 2 0 MAPPING & OPTIMIZATION SUMMARV
Simulation Point No. I: (Re-Run) n • (600 RPM, 5.4 kg-m Torque)
~ Exhaust Emissions H2 U Equiv. Fuel Mean
Run Ratio EGR Flow He eo NOx Temp. l!2.:.... (xl l!L (gL'sl (PPM) (PPM} (PPM} (Oe)
n: :
525 1.75 133 .603 1.8 2T7 26 696 i
H 526 1.76 116 .598 1.8 260 34 702
5Z7 1.76 84 .598 1.2 260 53, 702
~ 529 41.55 140 .618 1.8 343 23 709
530 1·57 110 .604 1.2 3~ 36 701 E I
531 1.56 74 .603 .6 476 52 712
532 1.47 136 .586 10.6 621 2l. 703 tr I
533 1.47 105 .582 7.2 931 29 700
f 5~ 1.47 78 .583 .6 1409 49 6~ I
535 1.37 171 .606 3.6 1409 15 706 [ 536 . 1.37 142 .550 3.0 2062 19 705
537 1.37 105 .586 1.8 2377 29 698 [
[
(
i I
2-10 i
__ 'T .... _0 _____ ·"""-___ . ___ ,_ .. __ . ________ ~_~ ____ ~_. --.-~
Attachment 1 cont'd .'
TABLE 3 MAPPING & OPTIMIZATION SUMMARY
Simulation Point No. I
(600 RPM, 5.4 kg-m Torque)
Temperature Affect on Fuel for Constant Emissions
Exhaust Emissions H2 Equiv. Fuel Mean
RUn Ratio EGR FloW' HC CO NOx Tem!). No. (X) la ~ (PPM) (PPM) (PPM) f:£L -478 1.52 144 .645 0 209 40'
I : iT72
479 1.33 136 .630 2.4 569 '57' :7{l , ,
4~0 ,1..20 125 .621 1.2 476 38! I i 759
44. I
,
1.47 95 .613 1.2 594 ,41< 739 I
482 1.49 114 .623 1.2 569 39 720
4a3 1.56 110 .608 1.8 498 40 700
484 1.59 109 .603 2.4 521 39 679
485 1.63 105 .595 2.4 521 40 659
2-11
E4uiv. Run Ratio !!9..:.. (X)
467 1.68
468 1.67
469 1.69
470 1.48
471 1.49
472 1·50
~73 1.33 I
474 1.33
475 1.35
499 1.67
500 1.69
501 1.69
TABLE 4 MAPPING & OPTIMIZATION SUMMARY
Simulation Point No. 4
(1000 RPM, 6.9 kg-m Torque)
Exhaust Emissions Fuel
EGR Flow HO 00 NOx ill- (g/s) (PPM} (PPM) (PPM)
168 1.r:m 1.8 ·260 31-
128 1.002 1.8 293 41
75 .982 1.8 361 84
170 1.053 1.5 343 27
126 1.0ll 1.8 3m 38
81 1.006 1.8 435 65
170 1.023 .6 862 22
131- .996 4.8 11m 31-
82 .990 4.2 1322 60
167 1.087 2.4 260 30
138 1.051 1.8 277 39
70 1.015 1.8 :rr8 81
2-12
Attachment 1 cont'd
Me1n Temp. (00)
732
729
729
730
729
730
731-
730
730
730
730
730
t (
I~ [
I [
!. t [
[
[
[
t [
t [
t £
(
>~-'-
Attachment 1 cobt'd .'
TABLE 5
MAPPING & OPTIMIZATION SUMMARY
Simulation Point No. 4
(1000 RPM, 6.9 kg-m Torque)
.Temperature Affect for Constant Emission Level
Exhaust Emissions Me1n Equiv. Fuel Run Ratio :fiR nOW' HC CO NOx (em). Y£..:. (xl i&. ..(g&l (pPMl (PPH~ (PPH) °c
1t61 1.42 141 1.01 6.6 931 15 708 • 462 1.24 172 1.036 6.0 545 30 783
1t63 1.30 165 1.004 4.2 569 29 761
1t64 1.35 147 .991 3.6 521 30 743
1t65 1.43 136 .991 3.6 569 29 720
466 1.48 131 .994 4.2 569 30 699
2-13
Attachment 1 I
TABLE .£ cont'd :'';::---:.--._-",-- ~~::: .. -:;:--"-":: -~~
I MAfpnTG & OPTIMIZATION SUMMARY
Simulation Point No. 5 -~,
I (1100 RPM, 11.1 kg-m 'I'orque)
Exhamlt Emissions H2 I , Fquiv. Fuel Mean Run Ratio EGR Flow HC CO NOx Te~. Ho. (X) l!L (g/s) (PPM) (PPM) (PPM) (OC
I '~
452 1.63 1.45 i
:767 130 1.2 171 52'
453 1.63 86 1.39 1.2 151 En 763 I 454 1.63 69 1.36 .3 277 120. 758 , ,
455 1.47, 141 1.43 .6 260 35. 763 I 456 1.42 103 1.38 .6 243 :52 761
i' 457 .6 91; i
1.42 71 1.35 260 '753 I
458 1.3 148 1.41 .4 435 '28i '761 I ; I
459 ~1..3 103 1·37 .6 435 47 '761
460 1.3 73 1.36 .6 476 75 758 ~ '476 1.3 128 . ,1"436 4.8 594 36, .762
~ >-:(RE-RUN} ~ I
.; ~ I
50? 1.31 158 1.440 2.4 676 30 761 ~
50~ 1.30 115 1.394 3.6 1117 42 759
504 1.32 80 1.380 .6 1689 67 760 ~ 505 1.31 92 1.383 3.6 1157 54 758
- .
~ i 506 1.42 141 1.425 2.4 455 37 759
507 1.43 107 1.398 1.8 277 52 759 m 508 1.47 82 1.376 1.8 62l 77 759
509 1.59 133 1.415 1.8 Z77 44 761 I 510 1.60 103 1.422 1.2 zn 57 760
~ 511 1.68 72 1.3En 1.2 226 88 759
E ~14 I]
Attac:1lllent 1 cont'd 'rABLE 7
MAPPING & OPTIMIZATION SlJMt$..ARY
Simulation Point No. 5
(liOO RPl.f, li.1 kg-m Torque)
Temperature Affect For Constant Emission Level
Exhaust Emissions ~ Equiv. Fuel Mean
Run Ratio IDR FlOW' He CO NOx Temp. ¥s?a.- (X) ill (g/s) (PPM] (PPM) (PPM) (o(,tl..
I
" I" 136 1.43 III 1.40 .6 521 34 726
4J7 1.37 120 1.36 I
·3 521 32 746
438 1.43 112 1.40 6.0 1117 38 724
~39 1.42 102 1.30 1.8 545 43 723
~O 1.42 112 1.34 1.8 648 39 722
441 1.35 124 1.34 2.4 569 40 744
442 1.30 116 1.29 1.2 521 40 762 ,
~3 1.28 117 1.26 2.4 521 40 780 I 444 1.28 133 1.29 1.2 476 40 783
lj.45 1.49 1CJ7 1.31 1.2 545 40 715 I , i
446 1.42 132 1.44 3.0 521 33 722
~7 1·37 147 1.44 4.8 521 33 743
448 1.30 148 1.37 1.2 521 32 762
,449 1.24 178 1.42 4.8 521 32 783
450 1.43 141 1.44 4.2 521 32 724
451 1.47 136 1.44 3.6 521 31 702
. I
2-15
Attac~unent 1 cont'd 9 D
TABLE 8 D MAPPING & OPTIMI ZATION SUMMARY
Simulation Point No. 6 0 (1300 RPM, 15.9 kg-m Torque) B
Exhaust Emissions H2 D
Equiv. Fuel Hean
B Run Ratio EGR Flow HO 00 NOx Temp. !&:. (X) ill lWl (PPM) (PPM) (PPM) (°0)
417 1.44 90 2.0 3.6 545 54 7~ g u, "
418 1.43 48 1.94 3.6 7g] 120 r,25
419 1.45 59 1.91 .6 705 84 ~26 g • ~24 420 1.31 61 1.94 1.8 11g] 78
B ,:.".
421 1.30 39 1.91 7.2 1949 132 720
422 1.32 104 1.96 .6 931 39 725 g 423 1.44 98 2.0 .6 931 50 . 7'Zf
424 1.44 62 2.0 3.3 1003 . 88 72~ B :,"r
425 1.57 64 2.CJ7 2.4 662 95 7'Zf
9 426 1.6 41 1.96 3.0 648 150 7'Zf .'
4'Zf 1.61 116 2.08 3.0 498 460 718 t]
H ~
~ ,
m
2-16 lj
.: . ~. .
Equiv. Run Ratio !!2.:.... (X}
514 1.33
515 1.33
516. 1.33
517 1.46
518 1.46
519 1.46
520 1.67
521 1.69
522 1.71
TABLE 9
MAPPING & OPTIMIZATION SUMMARY
Simulation Point No.6 (Re-Run)
(1300 RPM, 15.9 kg-m Torque)
- ----------~-.------
Attachment 1 cont'd
Exhaust Emissions H2 Fuel Mean
IDR Flow HC CO NOx (em). l1L ~ (PPMl (PPM) (pPMl °c
108 1.969 1.8 498 53 759
72 1.922 1.8 734 85 758
140 1.956 1.2 476 38 758
li8 1.949 1.2 343 39 759
98 1.900 .9 361 60 753
69 1.ff76 1.2 397 97 750
105 1.978 1.2 243 59 757
101 1.973 1.2 21f.3 63 754
78 1.921 1.2 243 89 752
·f :.~ ,', Yo
., .. : .
2-17
Attac:1ment 1 cont'd
TABLE 10 4-215 STIRLING ENGINE
~ MAPPING & OPTIMIZATION 9~Y
Simulation Point No. 6 ~ (1300 RPM, 15.9 kg-m Torque) ..
f .' .. ' .'
Temperature Af'fect on Fuel now '. , .. . ' ..
[ Fquiv. Fuel Mean
r Run Ratio IDR Flow HC CO NOx (em)" !!Q.s. (X} ill .iWl (PPM) (PPM} (PPM) °c
428 1.42 91 2.02 1.5 862 53 124 r 429 1'.43 90 2.01 .6 134 51 140
1,JO 1.43 88 1.99 .6 676 62 743 [ f
431 1.35 91 1.97 .06 648 60 165
!. 432 1.34 91 1.97 .09 734 60 783
433 1.52 74 2.CJ7 .9 765 60 704 ~ RECHECK
434 1.44 96 2.14 2.4 594 48 726 ~~ 435 1.32 86 1.99 .6 569 63 767
[
[
[
I
'J U
2-18 IJ
2.2
2.0
1.8
1.6-
1, -I , , ~-: O'!
1.4-_J: LL,
...J W :::> LL 1.2
1.0
0.8
0.6
, 4-215 STIRLING ENGINE FUEL FLOW
VS HYDROGEN TEMPERATURE
Attachment 1 cont'd
SIMULATION POINT 16
15
0
14
0- 0 l) ~
11 o
o~ ____ ~o~----_o-~----~o,-----~or---O
680 700 720 740 760 780 800
HYDROGEN TEMPERATU~E Cb)
FIGURE 1
2-19
~ ~
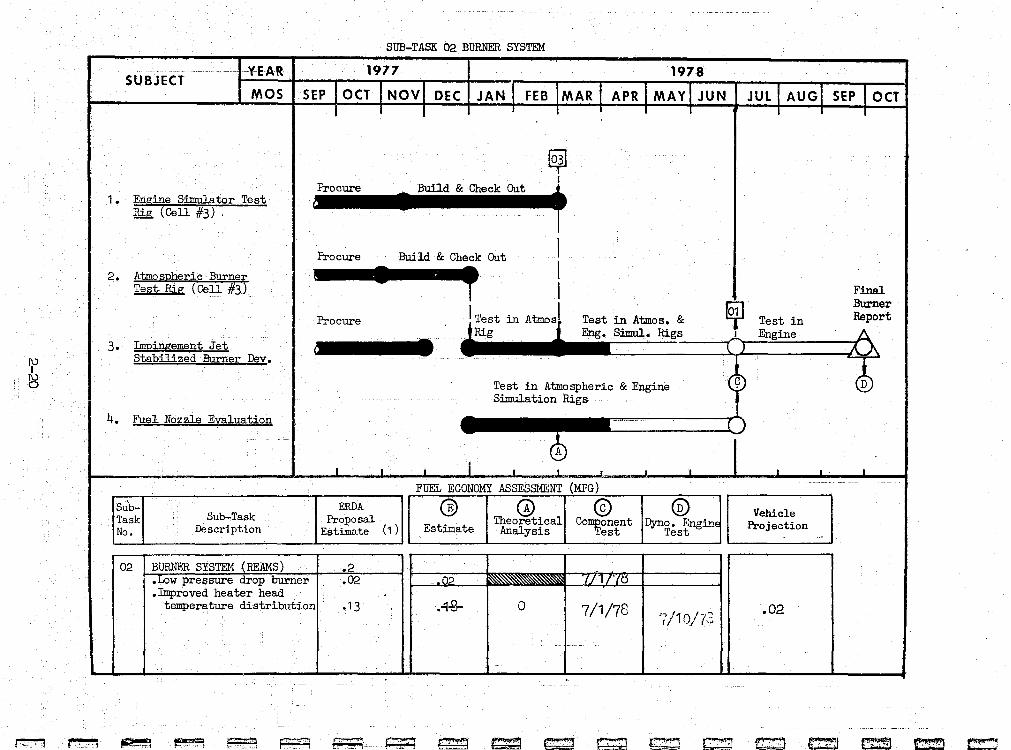
SUB-TASK 02 BURNER SYSTEM
---- - -- ····-Y'EAR- 1977 1978 -SUBJECT
MOS SEP 10CT I Novl DEC JAN I FEB IMAR I APR MAY I JUN JUl I AUGI SEP 10cT I I I J I I J I J J I
ijI I
Procure Build & Check Out ~ 1. Engine Simulator Test i •
!J,ig, (Cell #3) °
Procure Build & Check Out I 2. AtmoSPh.eriC Bur.. ner • • • u ,
Test Rig (Cell #3).. I I = Procure . 1'Test in Atmol' Test in Atmos. & fQjJ Test in RePo;~
__ . Rig Eng. Simul. Rigs I Engine A 3. Impingement .ret !II...... l ) AA
Stabilized Burner Dev. ~
Test in Atmospheric & Engine Q@ Simulation Rigs
4. Fuel Nozzle Evaluation ( )
-- 0 I I I I A I
FUEL ECONOMY ASSESS11B:NT (MPG )-
Sub- ERDA CE) (1) @ ® Vehicle Task Sub~Ta~k Proposal = t- Theoret~cal Component Dyno. EnginE Projection No. Descnphon Estilnate (1) .i!;S llnate AnalYS1S Test Test .0_
02 BURNER SYSTEM (REAMS) .2 .Low pressure drop burner .02 .02 JLJJorO .Improved heater head "
temperature distribution .13 • .:j.g.. a 7/1/78 / _ . ..:. .02 7 10/r..:;;
.
L-~--~~ __________________ ~ ________ -L~ ______ ~ ________ -L ________ ~ ________ -U~ __________ ~ _____ ___
j",:, 1 1.·'-1 ~ ':it <?', F:=tl r:~ ["::":'. P':'¥1. ~ ~ ~ ~ t::::1 C:r."~l c:l CZl ~ ~ c:::::
I\) I I\) ~
BURNER SYSTEM - SUB-TASK 02
Assembly of the Engine Simulator Test Rig was completed. The rig was initially checked out using the baseline burner system hardware and the Excello fuel nozzle. A problem was experienced with the cooling air valve response when the rig was operated in the manual blower throttle control mode. This problem is being investigated. Desyite this problem, some testing was perf'ormed. The rig was successf'ul at f'uel flows of' approximately 3.25 gis, the maximum flow enc01111tered during simulation point testing of' the CVS driving cycle. .
The baseline burner system with the Philips pintle and Excello f'uel nozzles was tested on the Atmospheric Burner Test Rig. A Test Summary (PTS-098) describing the results of' this testing was written and submitted to NASA. A synopsis of' this Test Summary is included (ref'er to Attachment 2) •.
The video-tape recorder system which will be used to monitor and create visual records of testing on the Atmospheric Burner Test Rig was received.
Additional testing of' the impingement jet stabilized (IJS) combustor with both Philips and Excello fuel nozzles was carried out. Both hardware combinations exhibit asymmetric name patterns and, at times, unstable operation.
A modified IJS combustor, having a dif'f'erent arrangement of impingement jet holes, has been f'abricated. This combustor was.f'abricated due to initial results from the Atmospheric Rig tests. These results indicated that the combustor, .as originally designed, gives inadequate primary zone swirl and does not provide f'or the intended interior recirculation pattern.
Testing of' the Philips and Excello f'uel nozzles in the Atmospheric and Burner Rigs is continuing.
FUEL ECONOMY ASSESSMENT
The assessed maximum f'uel economy improvement opportunity of' Burner System, sub-:task 02, remained unchanged at 0.20 MPG (gasoline).
Attachment 2
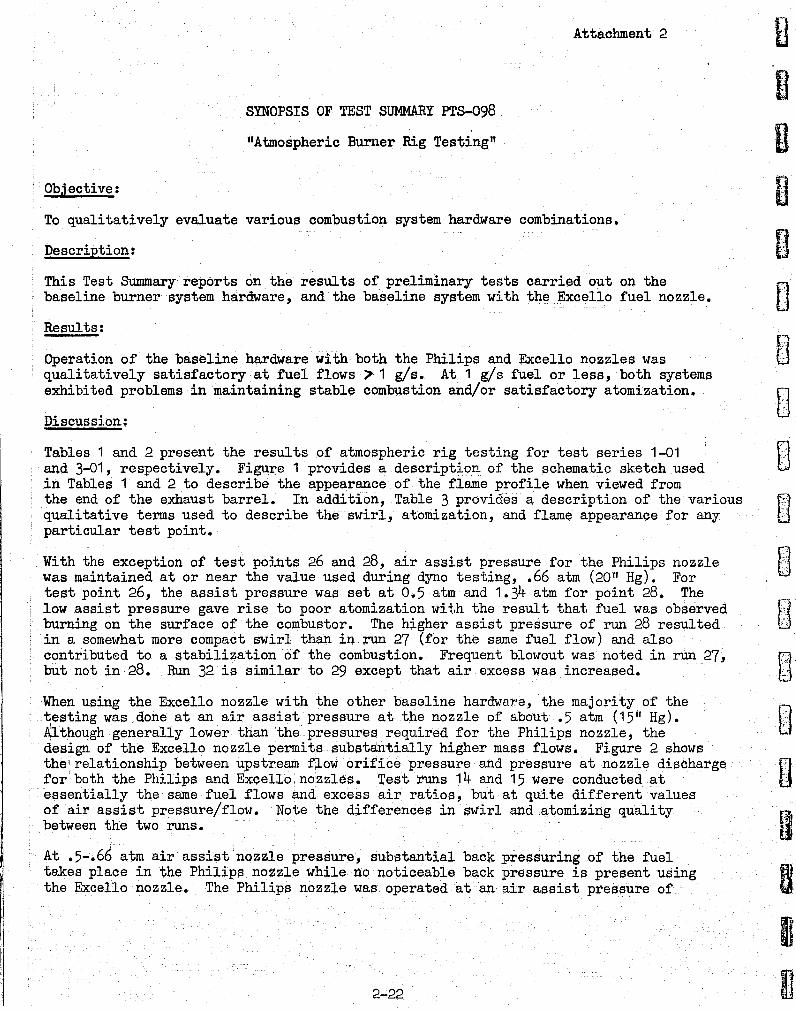
SYNOPSIS OF TEST SUMMARY PTS-098
"Atmospheric Burner Rig Testing"
Objective:
To qualitatively evaluate various combustion system hardware combinations.
Description:
This Test Summary reports on the results of preliminary tests carried out on the baseline burner system hardware, and the baseline system with th13 Excello fuel nozzle.
Results:
Operation of the baseline hardware with both the Philips and Excello nozzles was qualitatively satisfactory at fuel flows ~ 1 gls. At 1 g/s fuel or less, both systems exhibited problems in maintaining stable combustion and/or satisfactory atomization.
Discussion:
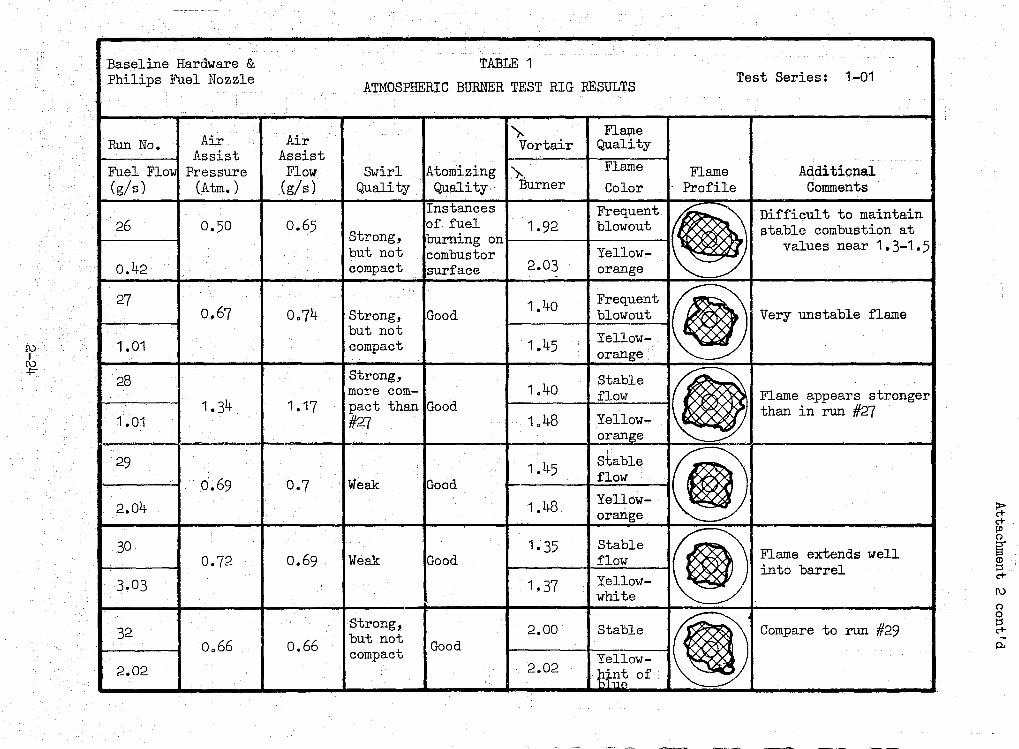
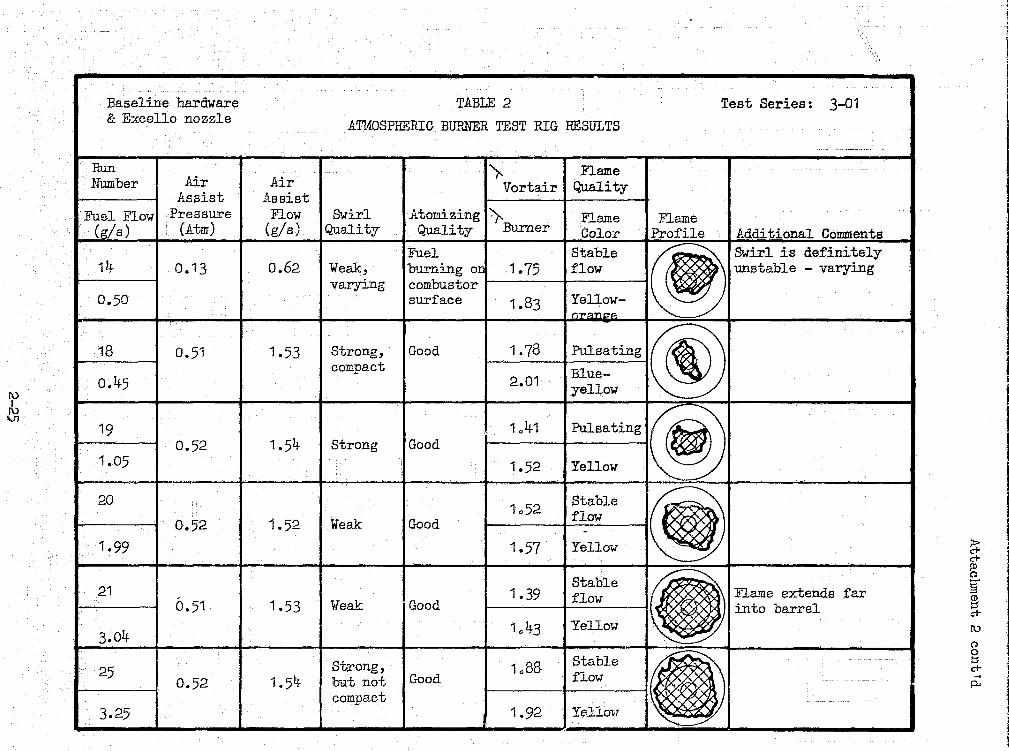
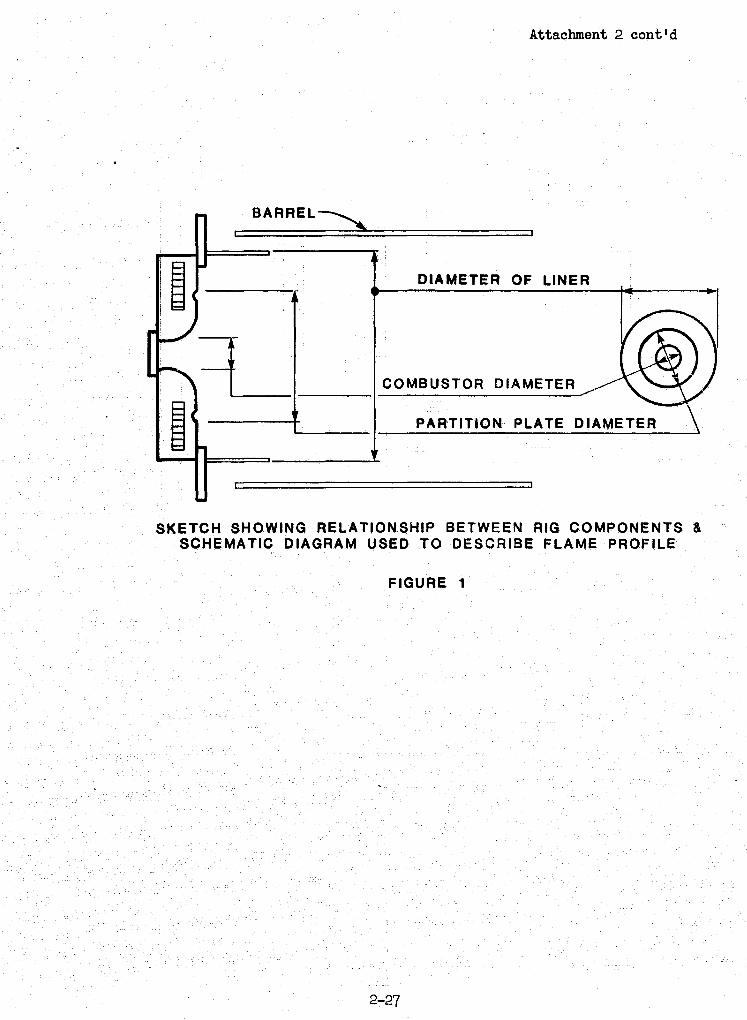
Tables 1 and 2 present the results of atmospheric rig testing for test series 1-01 and 3-01, respectively. Figure 1 provides a description of the schematic sketch used in Tables 1 and 2 to describe the appearance of the flame profile when viewed from the end of the exhaust barrel. In addition, Table 3 provides a description of the various qualitative terms used to describe the swirl, atomization, and flame appearance for any particular test point.
With the exception of test points 26 and 28, air assist pressure for the Philips nozzle was maintained at or near the value used during dyno testing, .66 atm (20 11 Hg). For test point 26, the assist pressure was set at 0.5 atm and 1.34 atm for point 28. The low assist pressure gave rise to poor atomization wit,h the result that fuel was observed burning on the surface of the combustor. The higher assist pressure of run 28 resulted in a somewhat more compact swirl than in run 27 (for the same fuel floW) and also contributed to a stabilization of the combustion. Frequent blowout was noted in run 27, but not in 28. Run 32 is similar to 29 except that air excess was increased.
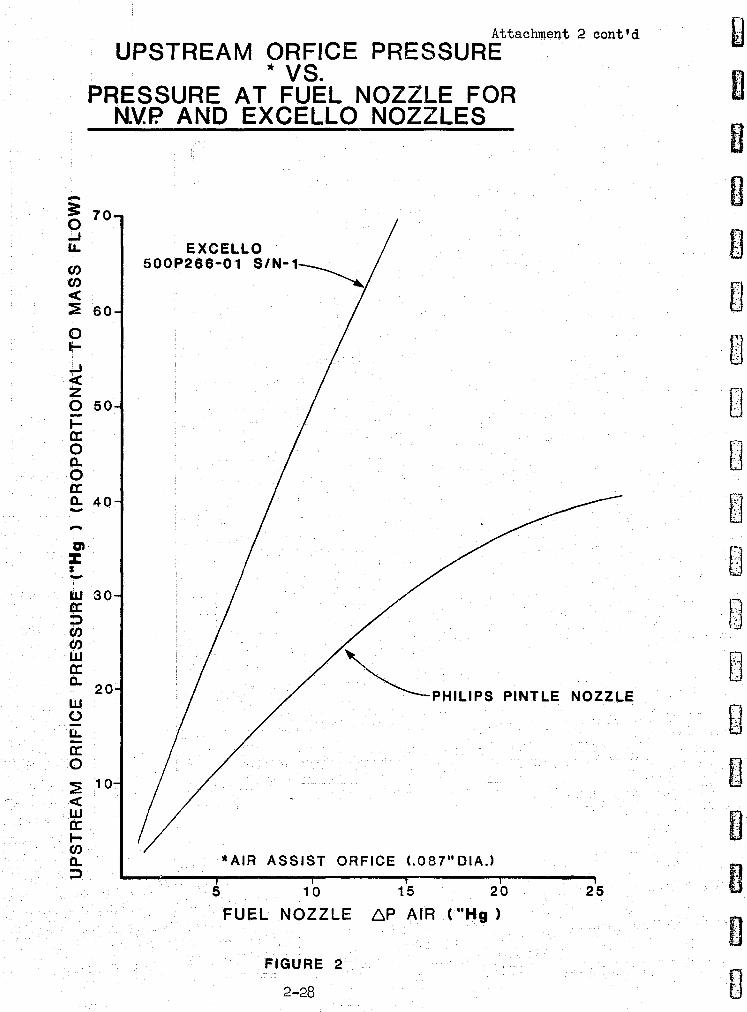
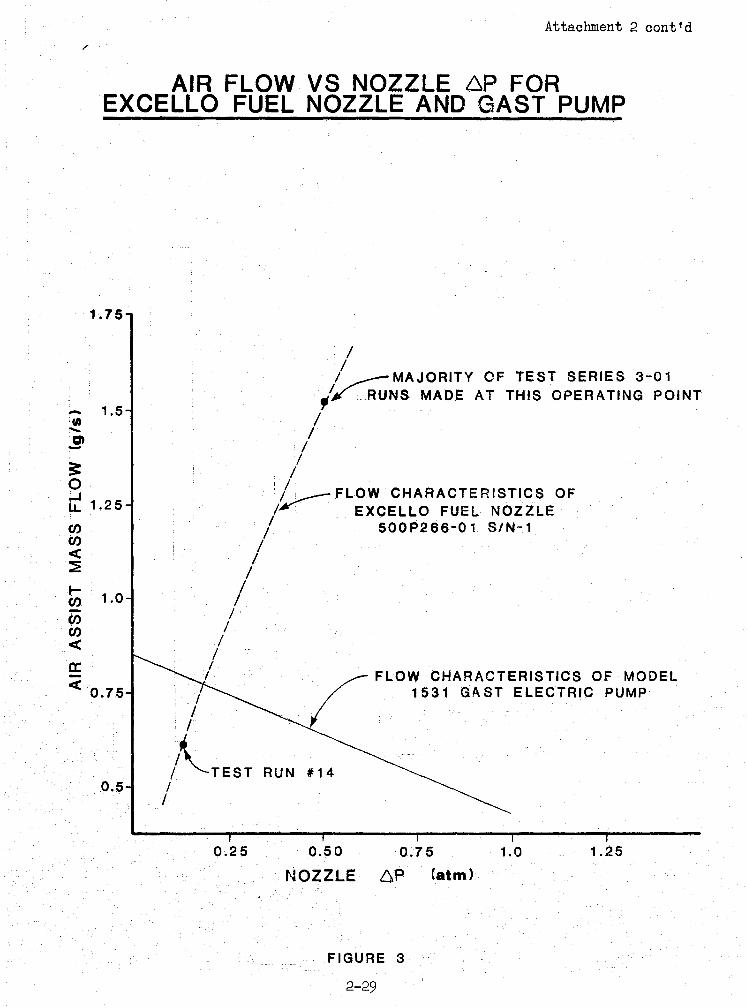
When using the Excello nozzle with the other baseline hardwar.e, the majority of the testing was done at an air assist pressure at the nozzle of about .5 atm (15" Hg). Although generally lower than the pressures required for the Philips nozzle, the design of the Excello nozzle permits substantially higher mass flows. Figure 2 shows theirelationship between upstream flow orifice pressure and pressure at nozzle discharge for. both the Philips and Excello nozzles. Test runs 14 and 15 were conducted at essentially the same fuel flows and excess air ratios, but at quite different values of air assist pressure/flow. Note the differences in swirl and atomizing quality between the two runs.
At .5-.66 atm air assist nozzle pressure, substantial back pressuring of the fuel takes place in the Philips nozzle while no noticeable back pressure is present using the Excello nozzle. The Philips nozzle was operated at an air assist pressure of
2-22
U1 . I
.' I
D
ill o 8
n u
~
I I
- -~--~-~--.----------
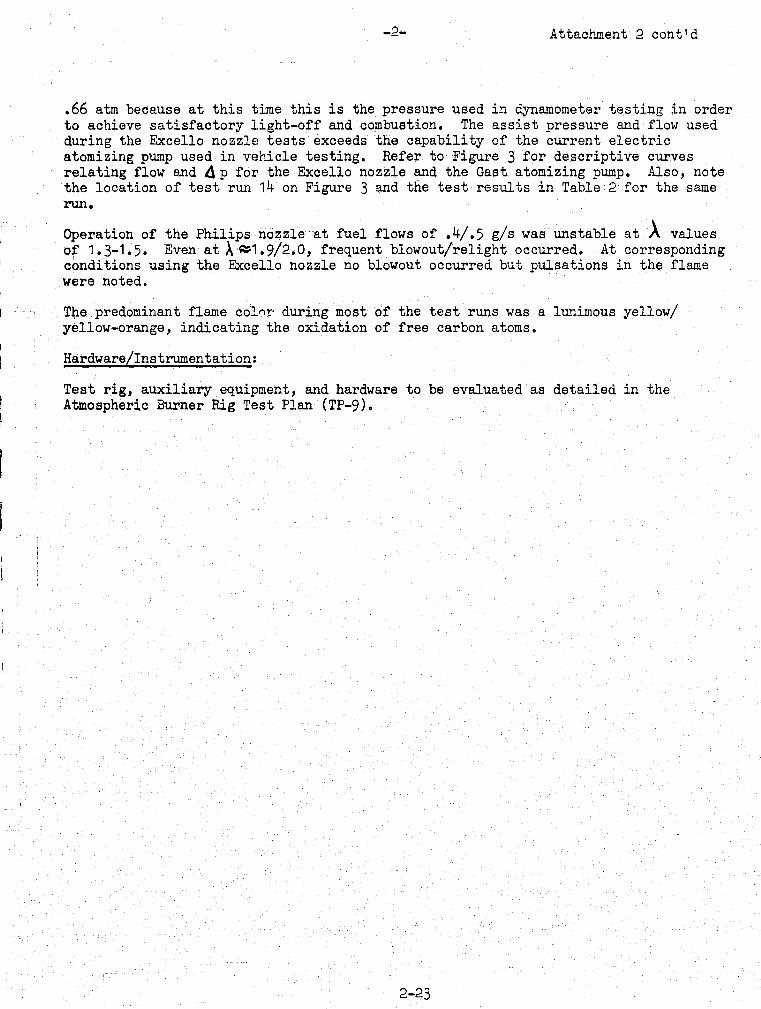
-2- Attachment 2 cont'd
.66 atm because at this time this is the pressure used in dynamometer testing in order to achieve satisfactory light-off and combustion. The assist pressure and flow used during the Excello nozzle tests exceeds the capability of the current electric atomizing pump used in vehicle testing. Refer to Figure 3 for descriptive curves relating flow and d p for the Excello nozzle and the Gast atomizing pump. Also, note the location of test run 14 on Figure 3 and the test results in Table 2 for the same run.
Operation of the Philips nozzle at fuel flows of .4/.5 g/s was unstable at A values of 1.3-1.5. Even at A~1.9/2.0, frequent blowout/relight occurred. At corresponding conditions using the Excello nozzle no blowout occurred but pulsations in the flame were noted.
The predominant flame coIn!' during most of the test runs was a lunimous yellow/ y~llow-orange, indicating the oxidation of free carbon atoms.
H~rdware/Instrumentation:
Test rig, auxiliary equipment, and hardware to be evaluated as detailed in the Atmospheric Burner Rig Test Plan (TP-9).
2-23
(\) I
~
-
Baseline Hardware & Philips Fuel Nozzle
Run No. Air Assist
Fuel Flow Pressure (g/s) (Atm. )
26 0.50
0.42
27 0.67
1.01
28
1.34 1.01
29 0.69
2.04
30 0.72
3.03
32 0066
2.02 -~ ----
""
Air Assist Flow
(g/s)
0.65
0074
1.17
0.7
0.69
0.66
'-
TABLE 1 ATMOSPHERIC BURNER TEST RIG RESULTS
'>- Flame Vortair Quality
Swirl Atomizing ),. Flame Quality Quality Burner Color
Instances Frequent of fuel 1.92 blowout
Strong, burning on but not combustor Yellow-compact surface 2.03 orange -
1.40 Frequent Strong, Good blowout but not Yellow-compact 1.45 orange Strong, Stable more com- 1.40 flo'1 pact than Good #27 1048 Yellow-
orange
1.45 Stable
Weak Good flow
1.48 Yellow-orange
1·35 Stable Weak Good flow
1.37 Yellow-white
Strong, 2.00 Stable but not Good compact Yellow-2.02 ~iii~ of
Test Series: 1-01
Flame Additional - Profile Comments
/- "- Difficult to maintain
I~ stable combustion at values near 1.3-1.5
~I Very unstable flame
~ Flame appears stronger than in run #27
@ @ Flame extends well
into barrel
~ Compare to run #29
~ c+~ (')
[ CD ;:l c+-(\)
(')
o ;:l c+-
~
Baseline hardware & E7~ello nozzle
Run Humber Air Air
Assist .Assist Fuel Flow Pressure Flow
(g/s) (Atm) (g/s)
14 0.13 0.62
0.50
18 0.51 1.53
0.45 ro rG Vl
19 0.52 1.54
1.05
20
0.52 1.52 1.99
21 0.51 1.53
3.04
25 0.52 1.54
3.25
TABLE 2 ATHOSPHERIC.BURNER TEST RIG RESULTS
'l- Flame Vortair Quality
&.Tirl Atomizing ). Flame Quality Quality Burner Color
Fuel Stable Weak, burning or 1.75 f'low vary-i...ng combustor
surf'ace 1.83 Yellow-. ..or.a.Il..Ila
Strong, Good 1.78 Pulsating compact Blue-2.01 yellow
1,.41 Pulsating Strong Good
1.52 Yellow
1,,52 Stable flow Weak Good -
1.57 Yello-w
Stable
Veak Good 1.39 f'low
1.43 Yellow
Stable Sv,!'ong, 1,,88 f'10w bu:t not Good compact
1.92 Yellm·r
\'-
Test Series: 3-01
._---_. __ ._-
Flame Prof'ile P.ddi tional Comments
~ Swirl is definitely unstable - varying
@ I@ ~ •
Flame extends far into barrel
• - -
._-_. _. .. _--
;x:-cr cr ill Q --S Cll ~ et-
C\)
Q 0 ~ cr -p.
I
I I .
I
ii
j
I
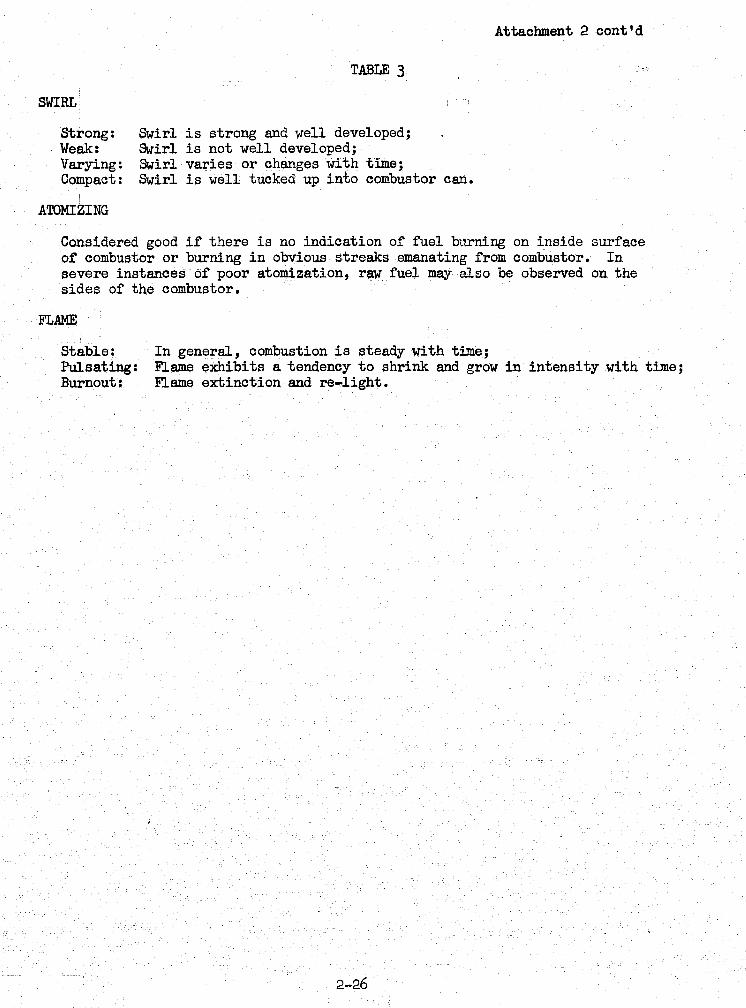
SWIRL
Strong: Weak: Varying: Compact:
ATOMIZING
TABLE 3
Swirl is strong and well developed; Swirl is not well developed; Swirl varies or changes with time; Swirl is well tucked up into combustor can.
Attachment 2 cont'd
Considered good if there is no indication of fuel burning on inside surface of combustor or burning in obvious streaks emanating from combustor. In severe instances of poor atomization, raw fuel may also be observed on the sides of the combustor.
FLAME
Stabl.e: Pulsating: Burnout:
In general, combustion is steady with time; F.lame exhibits a tendency to shrink and grow in intensity with time; F.lame extinction and re-light.
2-26
Attachment 2 cont'd
BARREL~
DIAMETER OF LINER
t COMBUSTOR DIAMETER ~--_/ PARTITION PLATE DIAMETER
SKETCH SHOWING RELATIONSHIP BETWEEN RIG COMPONENTS & SCHEMATIC DIAGRAM USED TO DESCRIBE FLAME PROFILE
FIGURE 1
2-27
-3: 0 ..... tL
(f) Cf) < ~
0 Ii-..J < Z 0 f-a: 0 0-0 a: 0-..... '!'"
at X : -! UJ cr: ::J en Cf) w a: 0-
W 0 LL
a: <D
~ « W a: f-en 0-::J
Attachment 2 cont'd UPSTREAM ORFICE PRESSURE
* VS. PRESSURE AT FUEL NOZZLE FOR
N.V.I? AND EXCELLO NOZZLES
70
60
50
40
30
20
10
~PHILIPS PINTLE NOZZLE
It AIR ASSIST ORFICE (,087" DIA')
5 10 15 20
FUEL NOZZLE 6P AIR ("Hg)
FIGURE 2
2-28
25
Attachment 2 cont'd
AIR FLOW VS NOZZLE 6P FOR EXCELLO FUEL NOZZLE AND GAST PUMP
1.75
- 1.5 CII "-.0» -3: o ;...J LL 1.25
en en <C ::?!
--en 1.0 en en <C
a: <C 0.75
0.5
/ /
. /
/ /
/
/ /
/ ,..--MAJORITY OF TEST SERIES 3-01 ;~ . RUNS MADE AT THIS OPERATING POINT
/ /
'VFLOW CHARACTERISTICS OF / EXCELLO FUEL NOZZLE
/ 500P266-01 S/N-1 /
/ /
/ /
/ /
/ I
I / FLOW CHARACTERISTICS OF MODEL I 1531 GAST ELECTRIC PUMP
~ /"-TEST RUN #14
/ /
0.25 0.50 0.75
NOZZLE 6P (atm)
FIGURE 3
2-29
1.0 1.25
I\) I
LU o
~ ~~
SUB-l'F .. SK 03 PREHEATER
SUBJECT 1978 YEAR
JUl OCl Nias I SEP DEC I JAN
Procure
1. Engine Driven Preheater t------® I Final
I rn...... Pr h11 ffI Preheate Ies" ~ e- ~ ~ R t
Procure Build ... , h~ter Rig • Dyno Engine Test ~por • 0 on . . . Present COre Thin Wall Core ~
I I I I I
2. Redesigned Preheater
Build and I ~ ~ ~ Check~ut • '-9'
13
• Preheater RiO' (Cell #3)
4. Thin ~lall Haterial Preheater Core
3ub-Task lb.
03
I
EE5! &:8
Sub-Task .. Description· ..
PREHEP..'l'ER (REAHS; .Engine driven preheater .Thin wall material pre
heater core .Seal friction reduction .Reduced preheater leak
age
~ ~ ---.-r--;
-
~Test in Preheater • • @---...... \.....)
FUEL ECONClrr ASSESSHENT (l1PG)
ERDA ~.® @ Yno·~ginel Vehicle Proposal T11eOl'etical Component Projection E"'sEima:te (,) Estimate F~ysis' Test Test
.3
.1
.14 .44
.~ot j
.02 , , I
L_
c:.::;] ~ ~ ~ ~ :~
~-." I···'Q ~ ~ . \ ~ f!!!!!!!l!!l ~ ~
IP <.J.J .......
- -= ~ ~ e;;:. iaJij ~ P.-'! t::::j t:::l ~ C:;::J Q!a Gi'll1a - ·1-
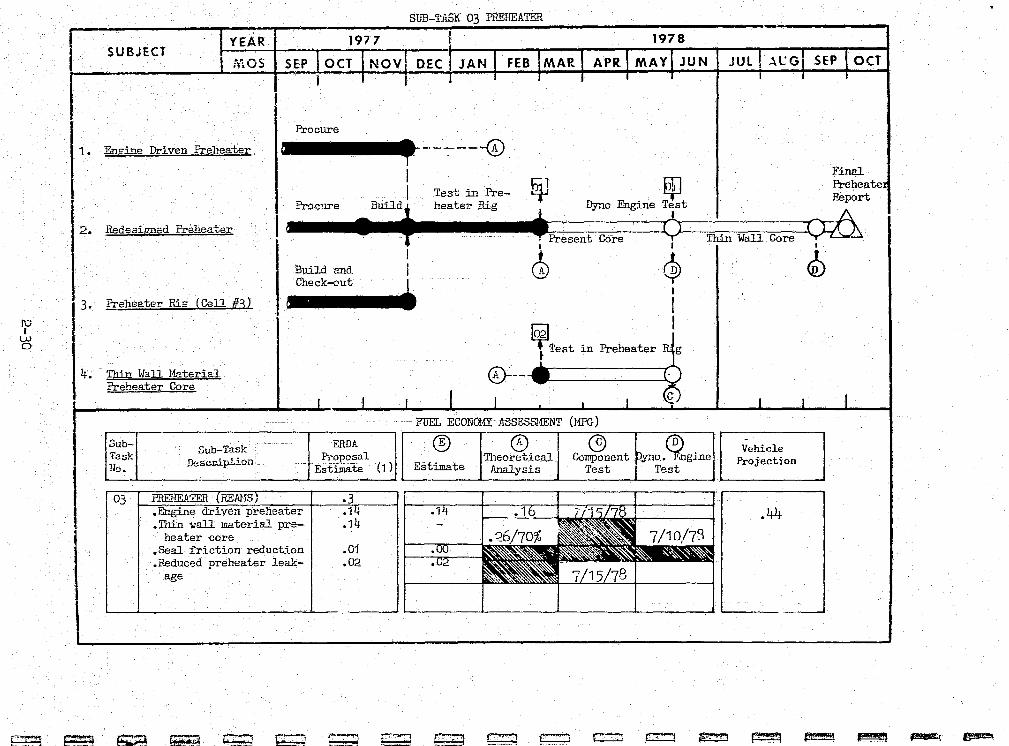
PR'EHEATER DEVELOP11ENT - SUB-TASK 03
Work on the engine driven preheater was completed.
The preheater drive motor, with the overriding clutch, is ready for test on the dynamometer engine.
Tne redesignedpreheater assembly is ready for test on the dynamometer engine.
~ thin wall preheater cores are ready for testing on the Preheater Test Rig.
FD"EL ECONOHY ASSESSHEJ:TT
ilie t:I.Bsessed :max:imum fuel economy improvement opportunity of Preheater Development, sub-task 03, reJr!8..Uled unchaLged at .0.18 . HPG (gasoline).
I 1
I
I\) I
(..&.1 (\)
YEAR SUBJECT MOS I SEP
1. Crankshaft vs. Swashplate Drive System
2. Reduction of Losses in Accessory Drive System
SUB-TASK 04 ENGINE DRIVE STUDY
1977
DEC I JAN
Review Existing Stirling Engine Drives
Analysis of New Drive Concepts
1978 (T
3. Engine Drive for Fuel and Atom. Air Pump
Final Re~:;rt
4. Piston Ring Friction
Sub-Task Sub-Task No. Description
04
Procure Piston Ring Test Rig
Build
ERDA Proposal Estimate(1)
• Crankshaft vs ~w~~u.t'~~ U~ I Accessory.drive .05
• Engine drive for fuel and atom. air pump
• Piston ring friction
.- ~~ ~ ~. ~ ~,
Test & Develop Rings Engine Test
Report to
FUEL ECONCMY ASSESSMENT (Mffi)
E (9 0) Theoretical Co~onent Dyno. "E'I1fine ~hicle Estimate AnaLysis est Tes' 'Projection
• r---'
II AD T~. ~!..l ('\-1'"7Q ~I 1.69
7/1/78 I 8/1/78
~ F=l ~ ~ ~ ~ ~ ,.,,~
~
~ ~ ~
I\) I
<.AI <.AI
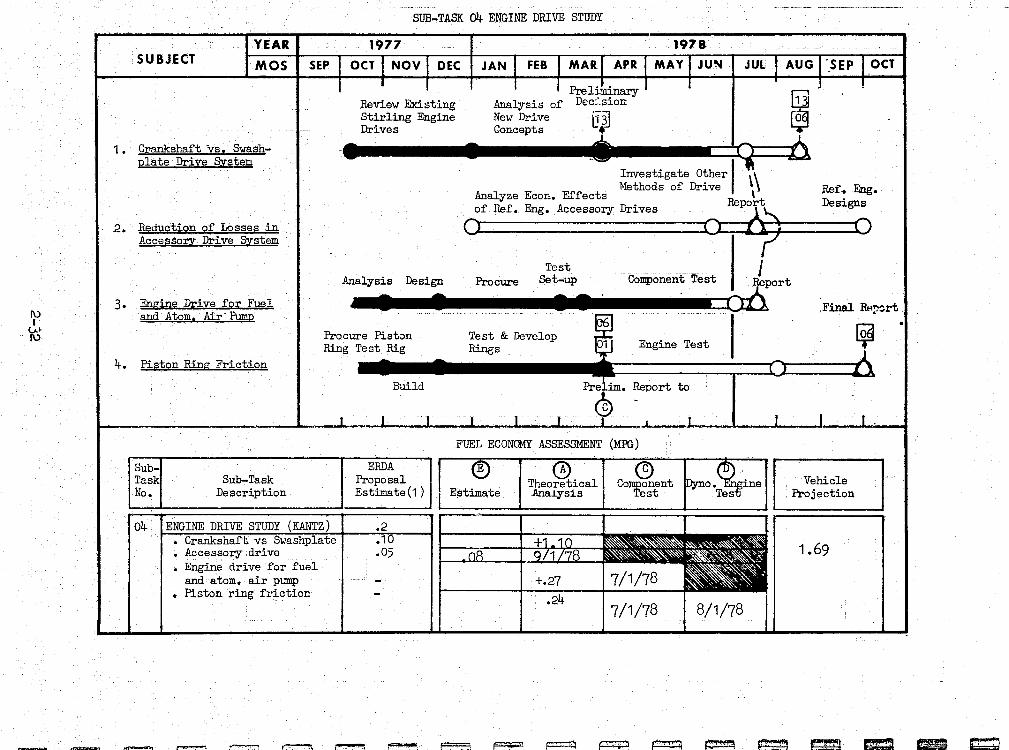
ENGINE DRIVE STUDY - SUB-TASK 04
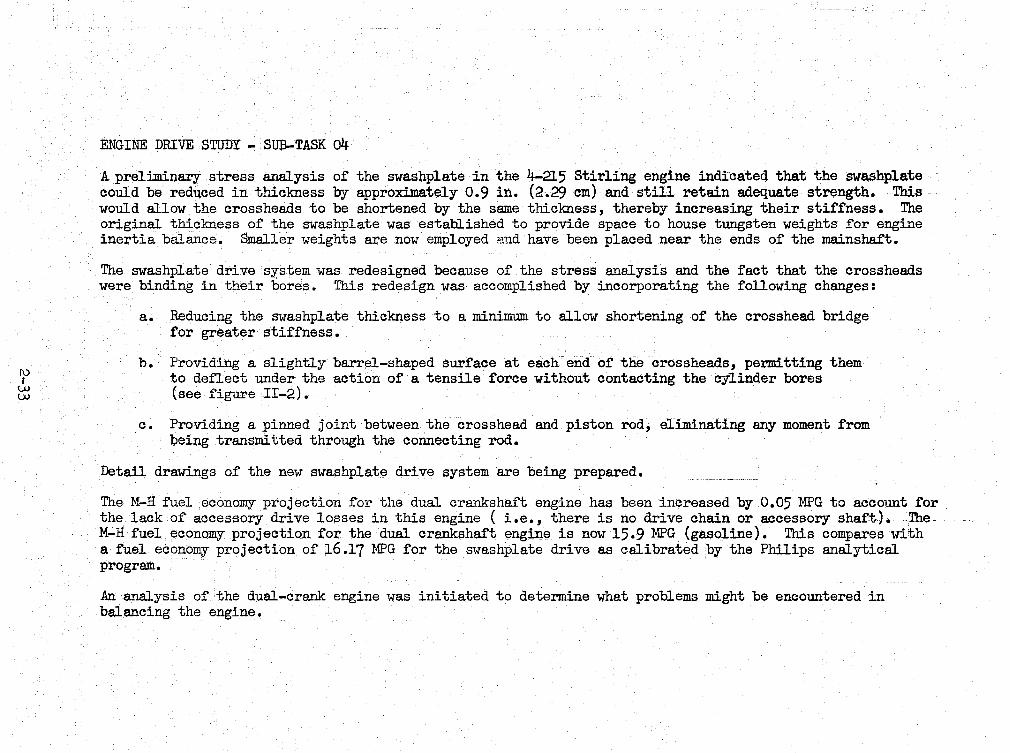
A preliminary stress analysis of the swashp1ate in the 4-215 Stirling engine indicated that the swashp1ate could be reduced in thickness by approximately 0.9 in. (2.29 cm) and still retain adequate strength. This would allow the crossheads to be shortened by the same thickness, thereby increasing their stiffness. The original thickness of the swashplate was established to provide space to house tungsten weights for engine inertia balance. Smaller weights are now employed fnld have been placed near the ends of the mainshaft.
The swashp1ate drive system was redesigned because of the stress analysis and the fact that the crossheads were binding in their bores. This redesign was accomplished by incorporating the following changes:
a. Reducing the swashplate thickness to a minimum. to allow shortening of the crosshead bridge for greater stiffness.
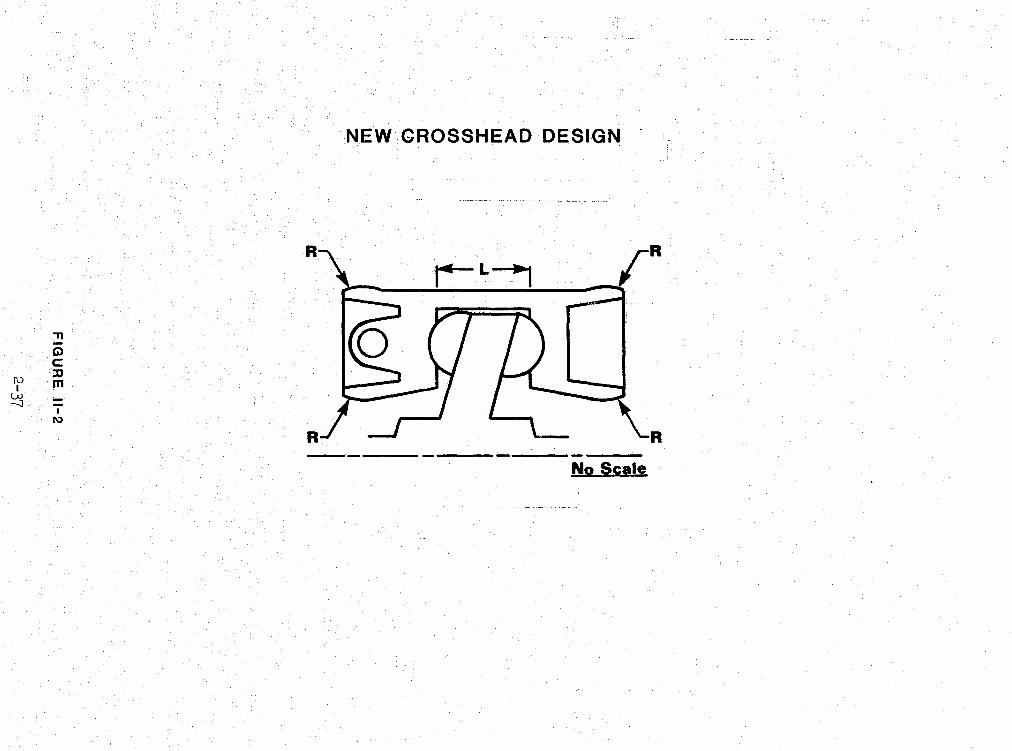
b. Providing a slightly barrel-shaped surface at each-end of tne crossheads, permitting them to deflect under the action of a tensile force without contacting the cylinder bores (see figure 11-2).
c. Providing a pinned joint between the crosshead and piston rod, eliminating any moment from being transmitted through the connecting rod.
Detail drawings of the new swashp1ate drive system are being prepared.
The M-H fuel economy projection for the dual crroL~shaft engine has been. increased by 0.05 MPG to account for the lack of accessory drive losses in this engine ( i.e., there is no drive chain or accessory shaft).'l'heM-H' fuel economy proj ectio_n for the dual crankshaft engine is now 15.9 MPG (gasoline). This compares with a fuel. economy projection of 16.17 I~G for the swashplate drive as calibrated by the Philips analytical program •
.An analysis of the dual-crank engine was initiated to determine what problems might be encountered in balancing the engine.
I\) I
W .j::"
~,: ~ e!9
Engine Drive Study- Sub-task 04 (Continued)
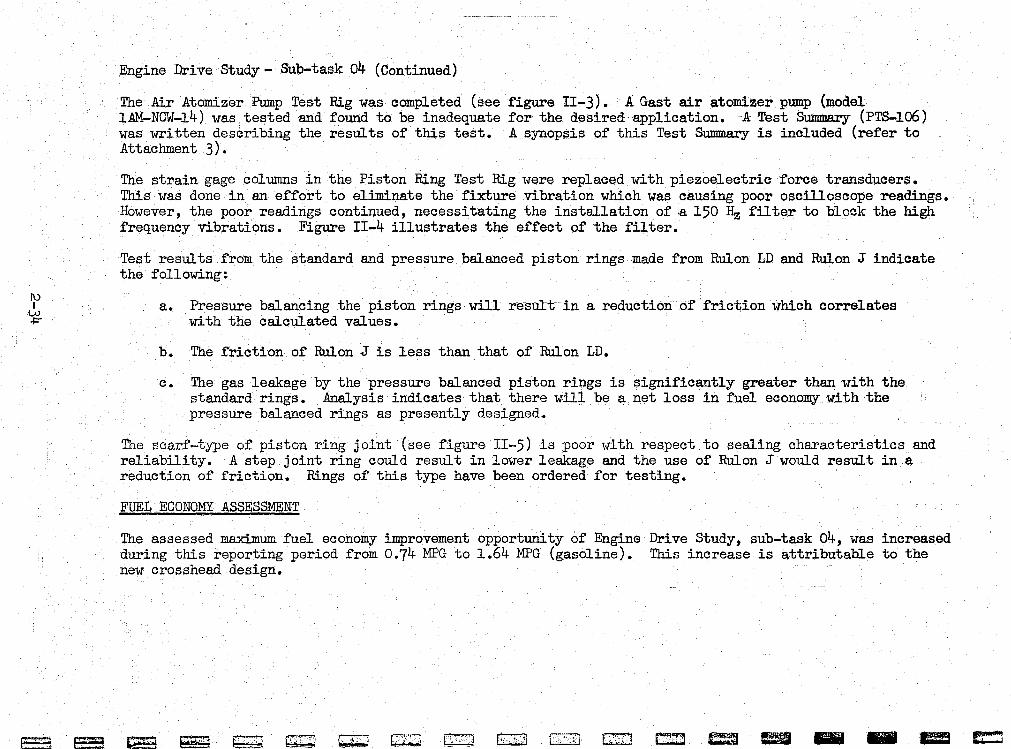
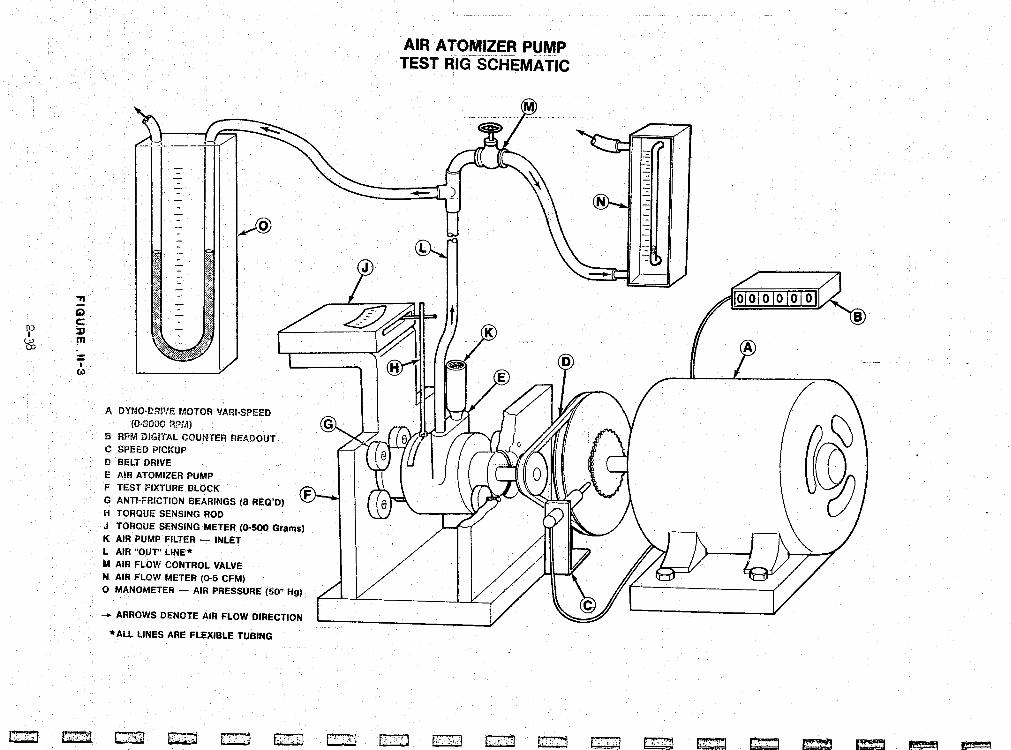
The Air Atomizer Pump Test Rig was completed (see figure II-3). A Gast air atomizer pump (model 1,AM-NCW-14) was tested and found to be inadequate for the desired application. A Test Summary (PTS-106) was written describing the results of this test. A synopsis of this Test Su.mma.ry is included (refer to Attachment 3).
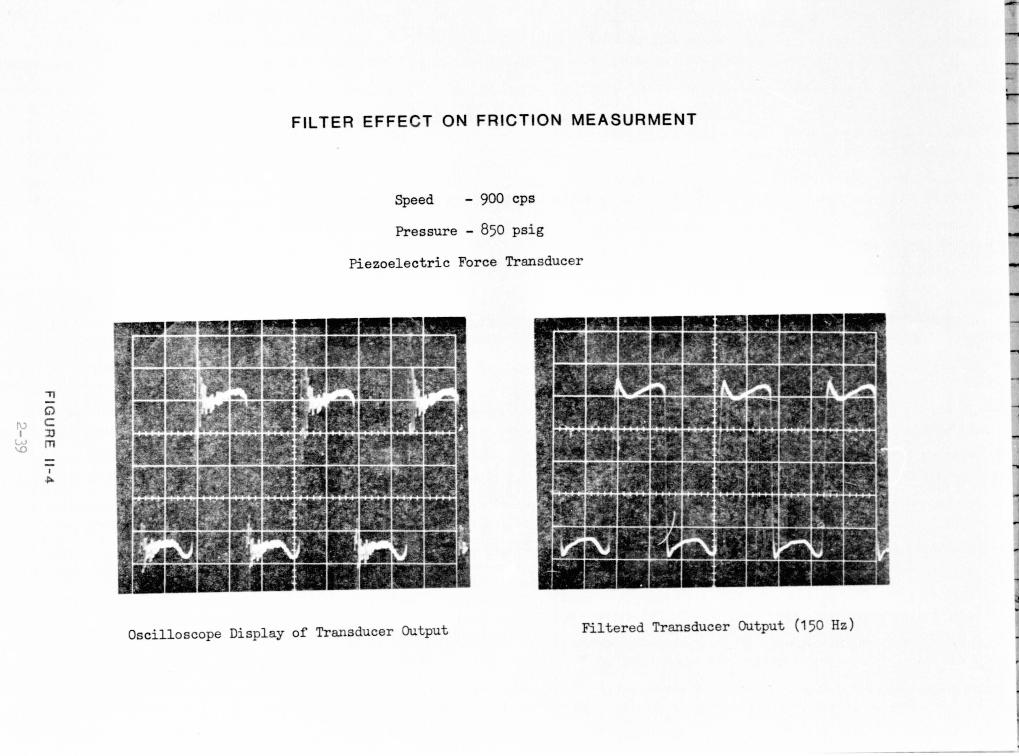
The strain gage columns in the Piston Ring Test Rig were replaced with piezoelectric force transducers. This was done in an effort to eliminate the fixture vibration which was causing poor oscilloscope readings. However, the poor readings continued, necessitating the installation of ,a 150 Hz filter to block the high frequency vibrations. Figure 11-4 illustrates the effect of the filter.
Test results from the standard and pressure balanced piston rings made from Rulon LD and Rulon J indicate the following:
a. Pressure balancing the piston rings will result in a reduction of friction which correlates with the calculated values •
b. The friction of Rulon J is less than that of Rulon LD.
c. The gas leakage by the pressure balanced piston rings is significantly greater than with the standard rings. Analysis indicates that there will be a net loss in fuel economy with the pressure balanced rings as presently designed.
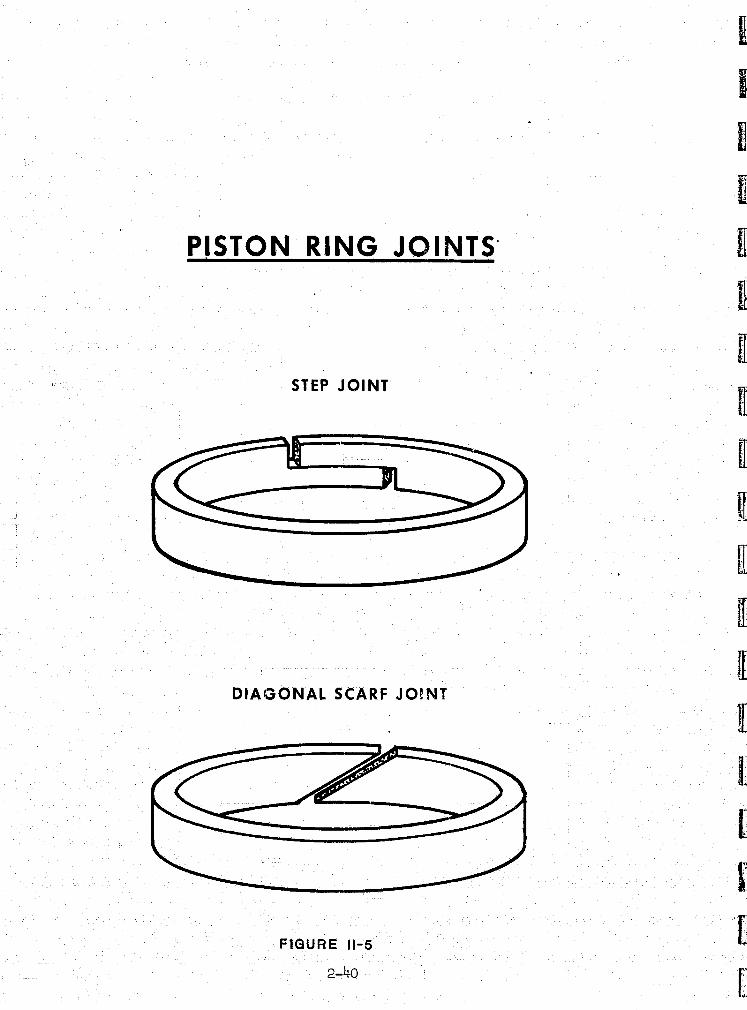
The scarf-type of piston ring joint (see figure 11-5) is poor with respect to sealing characteristics and reliability. A step joint ring could result in lower leakage and the use of Rulon J would result ina reduction of friction. Rings of this type have been ordered for testing.
FUEL ECONOMY ASSESSMENT
The assessed maximum fuel economy improvement opportunity of Engine Drive Study, sub-task 04, was increased during this reporting period from 0.74 MPG to 1.64 MPG (gasoline). This increase is attributable to the new crosshead design.
raE ~ t e,j be.;! '6] Lj·l C-;J !-,:'''_l ~,""'" -{"-"':,'\ ~ ',--, ~ ~ c::2:3 ~ IS .. .. -= r:=:l
Attachment 3
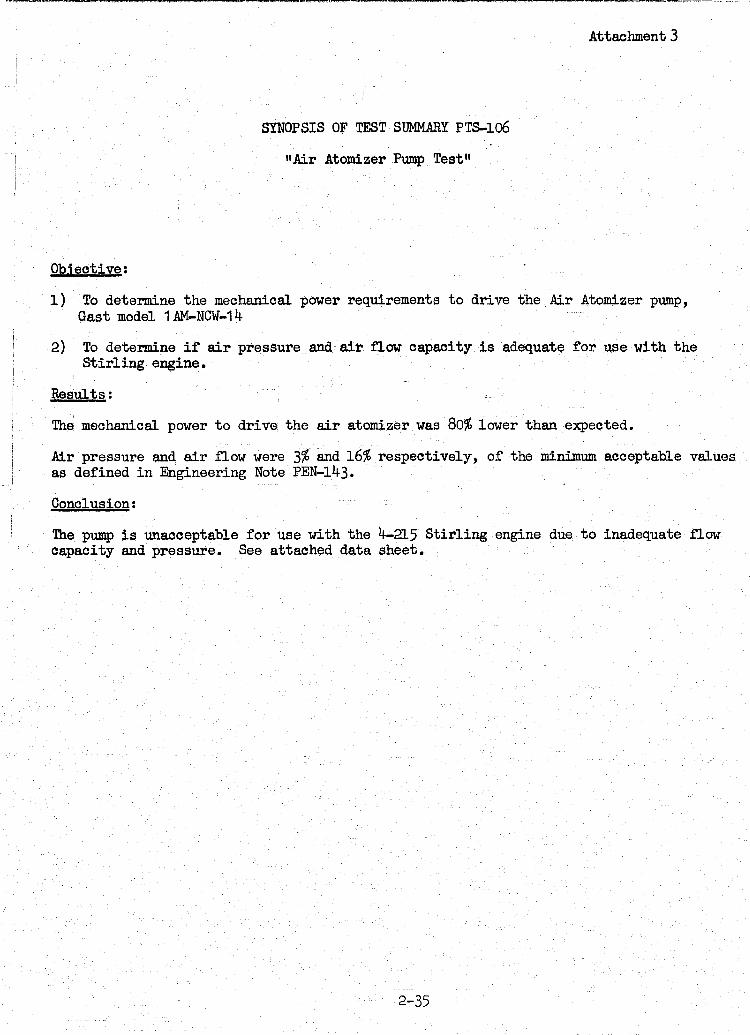
SYNOPSIS OF TEST SUMMARY PTS-l06
"Air Atomizer Pump Test"
Objective:
1) To determine the mechanical power requirements to drive the Air Atomizer pump, Gast model 1AM-NCW-14
2) To determine if air pressure and air now capacity is adequate for use with the Stirling engine.
Results:
The mechanical power to drive the air atomizer was 80% lower than expected.
Air pressure and air now were 3% and 16% respectively, of the minimum acceptable values as defined in Engineering Note PEN-143.
Conclusion:
The pump is unacceptable for use with the 4-215 Stirling engine due to inadequate now capacity and pressure. See attached data sheet.
2-35
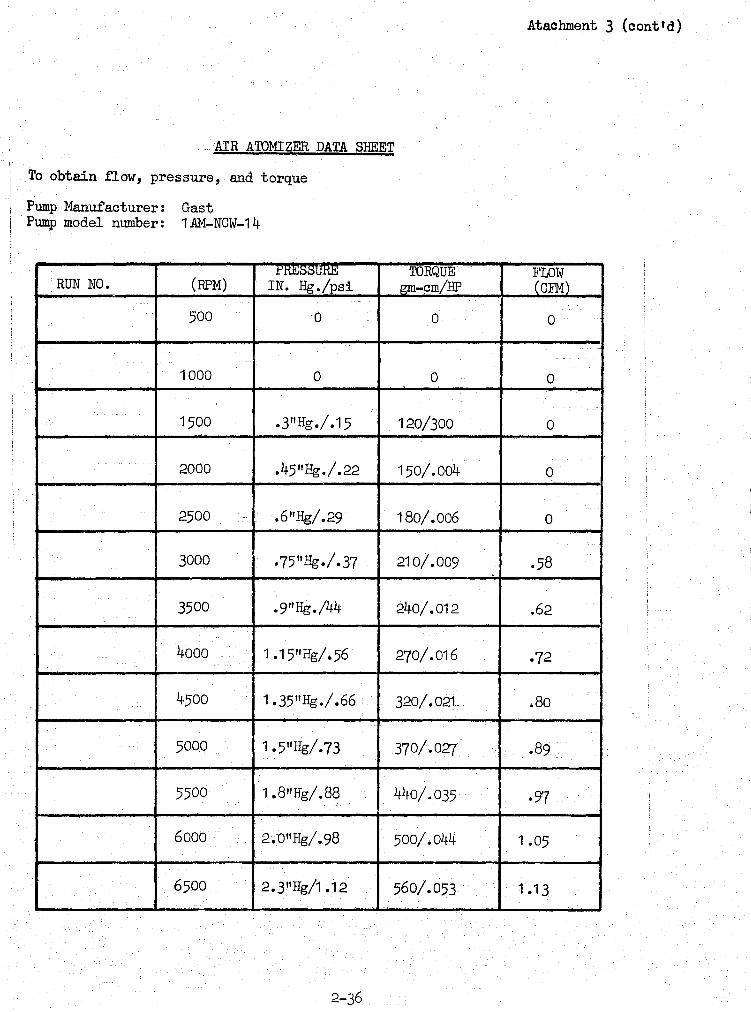
AIR ATOMIZER DATA SHEET
To obtain flow, pressure, and torque
Pump Manufacturer: Gast Pump model number: 1 AM-NOW-14
!'.tiJ!.i"SUHE TORQUE RUN NO. (RPM) IN. Hg./psi gm-cm/HP
500 0 0
1000 0 0
1500 .3"Hg./.15 120/300
2000 .45"Hg./.22 150/.004
2500 .6"Hg/.29 180/ .006
3000 .75"Hg./.37 210/.009
3500 .9"Hg./44 240/.012
4000 1 .15"Hg/ .56 270/.016
4500 1.35"Hg./.66 320/.021
5000 1.5"Hg/.73 370/.027
5500 1 .8"Hg/.88 440/.035
6000 2.0"Hg/.98 500/.044
6500 2.3"Hg/1.12 560/.053
2-36
Atacbment 3 (cont'd)
FLOW (OFM)
0
0
0
0
0
.58
.62
·72
.80
.89
·97
1 .05
1 .13
I t
l [
[
[
[
[
IE: I! z C
)
en w
0 0
r <C w
J:
... en
l en 0 a: (;)
~
w
z
FIG
UR
E . .11-2
2-37
'P '-&
c::::a
"11
Ci) c: :p m
I Co)
C'i"'''
I,.@
I
A DYNO-DR1VE rAOTOR VARI-SPEED (O-SOOO RPM)
B RPM DIGITAL COUlHER READOUT C SPEED PICKUP D BELT DRIVE E AIR ATOMIZER PUMP F TEST FIXTURE BLOCK
G ANTI-FRICTION BEARINGS (8 REO'D) H TORQUE SENSING ROO J TORQUE SENSING METER (0-500 Grams) K AIR PUMP FILTER - INLET L AIR "our' LINE * M AIR FLOW CONTROL VALVE N AIR FLOW METER (0-5 CFM) o MANOMETER - AIR PRESSURE (50" Hg)
... ARROWS DENOTE AIR FLOW DIRECTION
* ALL LINES ARE FLEXIBLE TUBING
C3] ~ c:::1 '. ·'i,.,,~ . L • • ,.-. f··~'·1
AIR ATOMIZER PUMP -- . ~- ,- --- - ----
TEST RIG SCHEMATIC
c:::::!S LL:J I;,>,) 1:.,,;;''1 c::::l ~ ~ ~ ~ ~ ~ ~ ~.
"'T1
(j)
f\) C I JJ ~ m
I
~
FILTER EFFECT ON FRICTION MEASURMENT
Speed - 900 cps
Pressure - 850 psi g
Piezoel ectric Force Transducer
Osci lloscope Display of Transducer Output Filter ed Tr ansducer Output (150 Hz)
~
~ .
"
PISTON RING JOINTS'
STEP JOINT
DIAGONAL SCARF JOINT
F1GURE 11-5
2-40
n
I II Ili llJ
[\) I -/=' -"
SUB-TASK EXTERNAL HEAT AND BLOWER SYSTEM
SUBJECT YEA
DEC I JAN
Anal. & Design Procure Define Blower Reqmts. New Blower Blower
1. Blower Design & Development
2. Blower & Drive Test Rig
Procure Design Rig Build
lo~'~ I Pro=e' 9 Fillty Equipment. I (!) I
Analyze and Select Drive System T I 3. Blower Drive Evaluation I 0 I
I I
Sub'Yask 110.
05
Design Drives
Sub-Task Description
.Improved blower design
.Improved blower drive
.Reduce air flow reqmts. (Ref. Sub-task 10)
ERDA . Proposal Estimate
Test Selected
9/1/78
1978
JUN I JUl OCT
Provide Blower
Rig Test & Ma (c) & DdYe Design Blower P T
Tmprovements
Vehicle Projection'
.46
I}' iG
EXTERNAL HEAT AND BLOWER SYSTEM - SUB-TASK 05
Layout and detailing on the new blower design has been completed. The design of the vaneless diffuser and collector scroll deviates slightly from those in the design submitted by the blower consultant retained Qy For~; however, the impeller design is unchanged. The changes allowed reducing the blower outside diameter 3.9 inches from the current blower, and approximately 4.0 inches from the consultant's design. There may be a slight reduction in performance due to the changes but the reduction in blower diameter is considered to be of greater significance.
The drawings of the housing and impeller have been checked and an order was placed for three sets of housing castings a~d three impeller assemblies, three shafts, and three pulleys.
FUEL ECONOMY ASSESSMENT
The assessed maximum fuel economy improvement opportunity of External Heat and Blower System, sub-task 05, remained unchanged at 0.46 MPG (gasoline).
"'- ~. ...--.-, r~ ~ ~ r---"'\ ~ ~ t==1 F==l ~ ~ ~ ~ f?"'8'~ J!II!!!!!!!ll ~
r h
f ~ ,
..
r
h
rp +" w
SU BJECT YEAR
MOS
j-'c:V··:cr ~:::Ltr:;;l l-lethods
2. Hydrcgen Control Valves (A) (Durability Upgrading)
(B)
3. Hy~rogen Comoressor (A)
(B)
'+. Dyno Test
SUB-TASK 08 PQ1..JER CONTROL SYSTEM
1977
SEP DEC I JAN
Analyze Various Hethods & Effects on Economy
Valve Rig Tests
Design Linear Valve Procure
Analyze Alt. Compo & Unloading Effects on Economy
Compressor Rig Des., BId.
Report
I I
,!uild
Test
Prelim. Report
Prel:ifn.. Repo
¢ I
.~ ''< - r •• " e I. Design Decision
1978
Update Analysis & Computer Program
~T,.t'
Refine Design IDeS. & Compo Analysis
I , I I I
~
I I I I I I 1 I I I I I I I I I I I I I I I
cob. Repor
I I J I I
Prelim. I Report I
I YO--1 ~
OCT
I I I I I I I I ~
1_, }
I I
I Flf'
Ilf, :'!
a I, ~ II
~ I ~ l~
~
~:--I
1. r;;:
I\) I +' +
SubTask No.
08
Sub-task Description
POWER CONTROL SYSTEM (Ko sacheff )
.HYdrogen compressor plunger friction
.Hydrogen distributor friction
.Sealed piston dome
.Reduce power losses of power control actuator needed for fast transient responr-;e
.Eliminate IIshort circuitingll power losses during deceleratioTls
.Alternate power control
SUB-TASK 08 POWER CONTROL
ElIDA @ ® Proposal Theoretical Estimate (1) Estimate - Analysis
II .9
.85 .55
.05 .05
.05 (2)
... ~'!t ~< .-- ~
® -1 ® Component
Test
~ ~ r' .... !1
Vehicle Projection
1.39
~ ~ ~ ~
POWER CONTROL - SUB-TASK 08
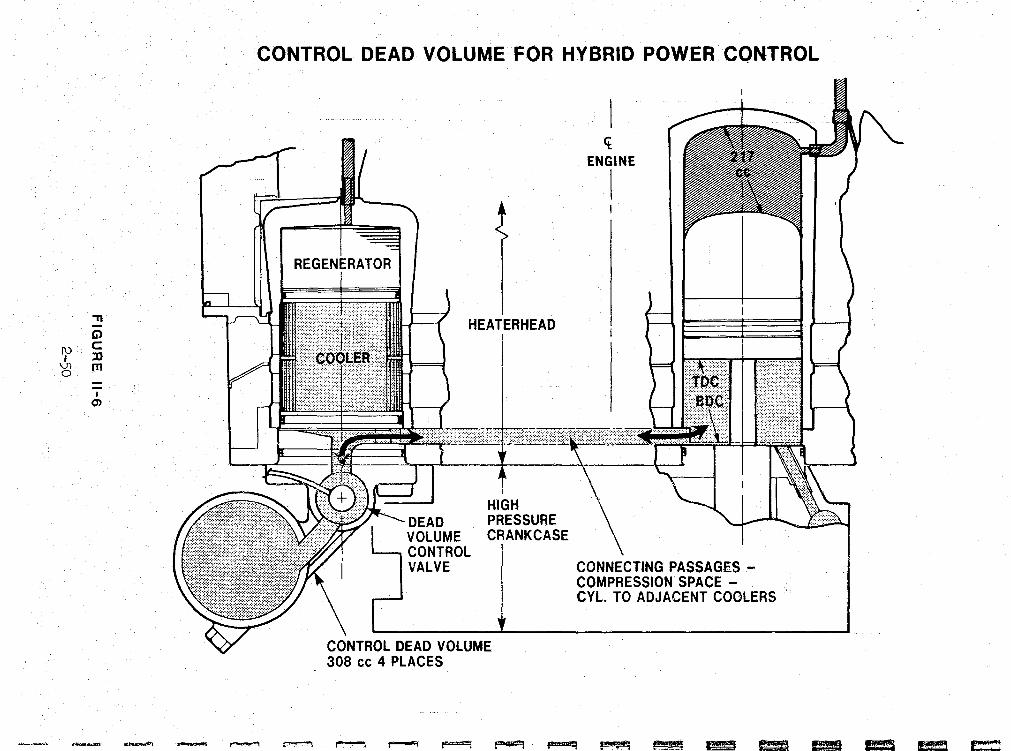
Engineering Notes PEN-159 and PEN-160 were written during this reporting period. PEN-159 summarizes the procedure and result of control component slzlng. PEN-160 summarizes the control dead volume valve area computer program and results obtained thus far. A synopsis of each of these Engineering Notes is attached (refer to Attachments 4 and 5).
Figure 11-6 illustrates a control dead volume module of 308 cc (Xc with minor engine modifications.
1.42) that can be used on the 4-215 engine
The linear power control valve testing indicated leakage across the transfer valve portion. Because the transfer valve function is not an essential operation, it has been sealed off and the function will be performed externally with an existing valve. Indications are that spool friction is low.
The 4-215 linear power control module was tested. The results are:
~ a. Cycling tests have indicated no sealing deterioration after 10,300 full stroke cycles for eight of the nine (n seals. The ninth seal developed an excessive leak at 3600 cycles. A new seal ring was installed and the
remaining 6700 cycles were run without deterioration of the new seal.
b.
c.
d.
The power control module (including the servo valve tare floW) required an oil flow of .48 liters per minute (30 cubic inches per minute) at 827 kPa (120 psi) p~essure to open the supply to 20 mm2 in 0.072 seconds. Because the total supply stroke has considerable over travel, 0.25 seconds were required for the spool to travel the full supply stroke.
Assuming a 50% efficiency in converting shaft power to hydraulic power, the .48 liter per minute flow at 827 kPa pressure represents a fuel economy penalty of approximately 0.02 MPG {gasoline).
In general, the control module with the associated electronics operated smoothly and the spool position was repeatable within 0.1 mm (.004 inches).
e. The original valve spool resulted in B-~ excessive dead band between the supply and pump-off mode. The spool drawing (NASA 760722) has been changed to reflect a smaller dead band.
I\)
Power Control - Sub-task 08 (Continued)
The computer program initially written to determine the mechanical losses of the hydrogen compressor has been expanded to enable the additional calculation of pumping work. The program has the capability of determining sliding seal friction and the resultant shaft power.
The Compressor Test Rig experienced scuffing in both cylinder walls after 3 hours of initial steady running. The cylinder walls were rebored, the plunger-posts were realigned, and testing was resumed.
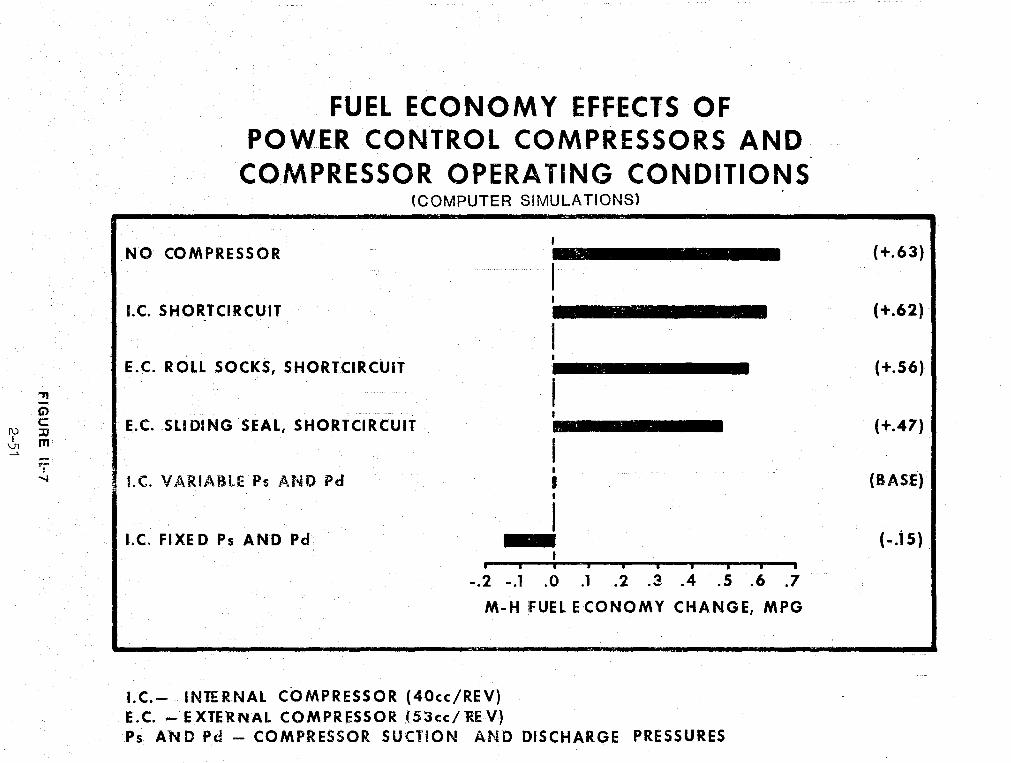
The initial analytical study of compressor losses and their impact on fuel economy has been completed. Figure 11-7 is a tabulated summary of this study, indicating a fuel economy opportunity of 0.56 l1PG (gasoline) with an external compressor. The study also indicates that a fuel economy opportunity of 0.62 MPG (gasoline) may be realized by short circuiting the internal compressors in the 4-215 engine. However, engine tests with short circuited compressors have indicated 0.32 MPG ·opportunity. This discrepancy is attributed to initial compressor flow losses that are not considered in the analytical model.
.b- FUEL ECONOMY ASSESSMENT 0'\
The assessed maximum fuel economy improvement opportunity of Power Control, sub-task 08, was decreased in May, 1978 from 1.44 MPG to 1.39 MPG (gasoline). This decrease was due to a reassessment of the Sealed Dome subsub-task. It was decided that this sub-sub-task would be reduced from 0.05 MPG to 0.00 MPG. However, in June, 1978 the fuel economy opportunity of Power Control was increased from 1.39 MPG to 1.40 MPG (gasoline). This increase was the result of a better hydrogen compressor loss analysis.
,..-..-, ~ ~ r-'"l ~ r--! ~ ~f ~ f"~ r~~.!:\ f .. ~!"l ~ ~ f=t ~ =:a amt ~
Attachment 4
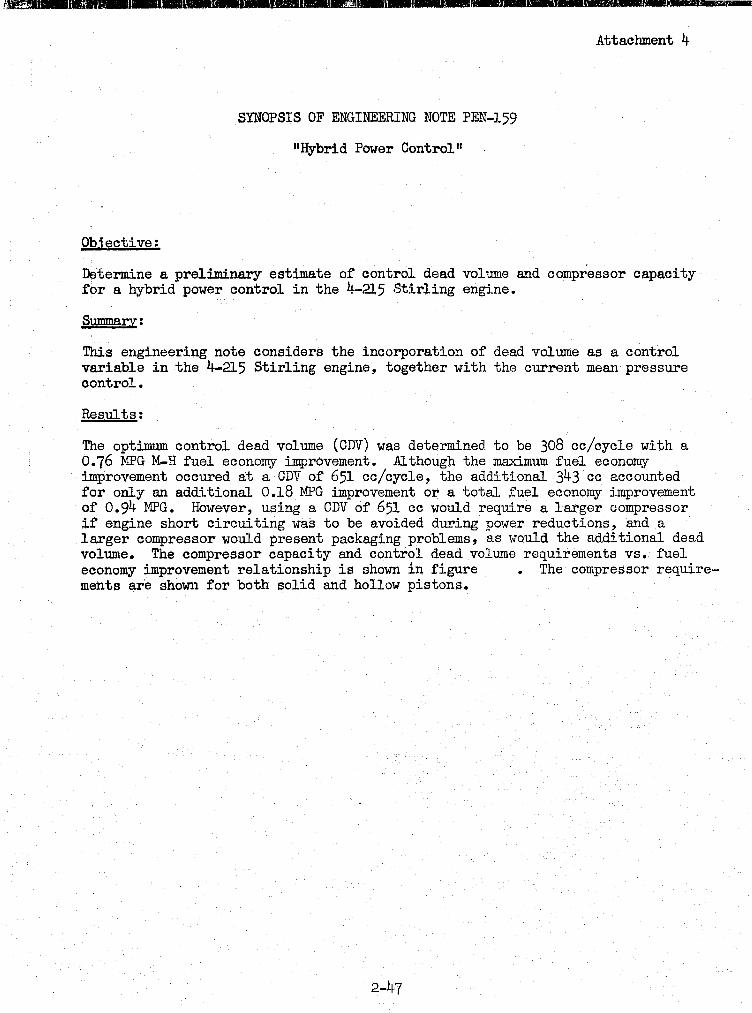
SYNOPSIS OF ENGINEERING NOTE PEN-159
"Hybrid Power Control"
Objective:
Determine a preliminary estimate of control dead volume and compressor capacity for a hybrid power control in the 4-2l5 Stirling engine.
Summary:
This engineering note considers the incorporation of dead volume as a control variable in the 4-2l5 Stirling engine, together with the current mean pressure control.
Results:
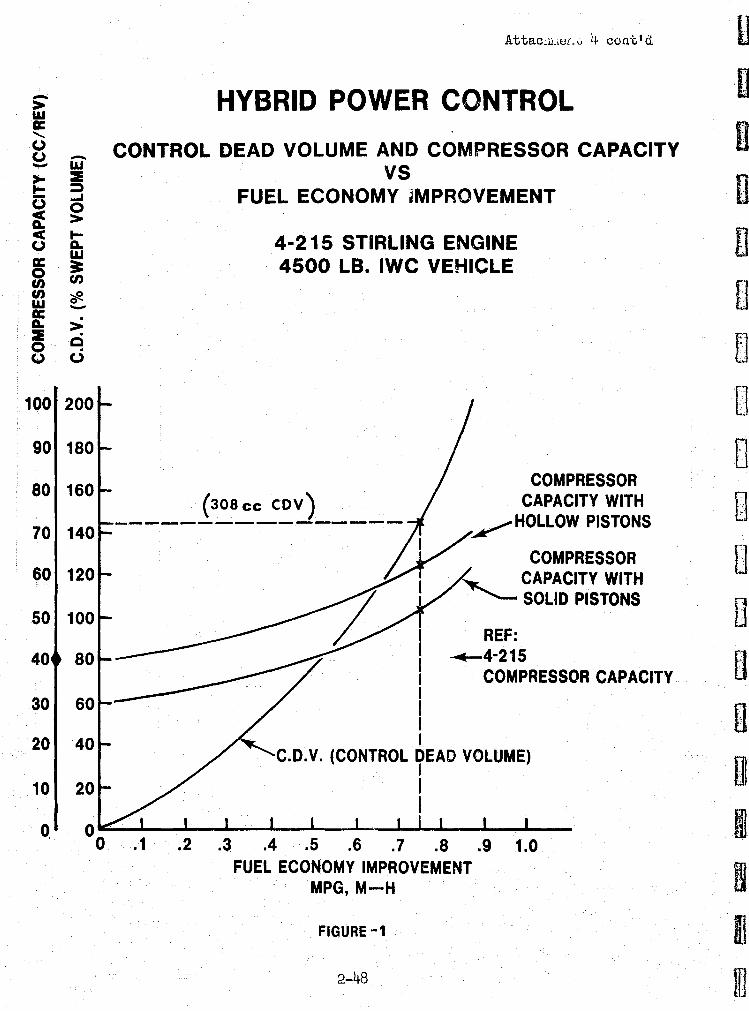
The optimum control dead volume (CDV) was determined to be 308 cc/cycle with a 0.76 MPG M-H fuel economy improvement. Although the maximum fuel economy improvement occured at a CDV of 651 cc/cycle, the additional 343 cc accounted for only an additional 0.18 MFG improvement or a total fuel economy improvement of 0.94 MFG. However, using a CDV of 651 cc would require a larger compressor if engine short Circuiting was to be avoided during power reductions, and a larger compressor would present packaging problems, as would the additional dead volume. The compressor capacity and control dead volume requirements vs. fuel economy improvement relationship is shown in figure The compressor require-ments are shown for both solid and hollow pistons.
2-47
-> w a: ........ (J (J -- w >- ::E .... ;:)
(j ..... 0
f > < t-(J a.. a: w 0 ~ U) U)
U) ';:R w 0 -a: · A. > ::E · 0 c · (J 0
100' 200
90 180
80 1S0
70 140
60 120
50 100
40 80
30 SO
20 40
10 20
0, o ' 0
At tac~ll;,eL u 4 con-c' d
HYBRID POWER CONTROL
CONTROL DEAD VOLUME AND COMPRESSOR CAPACITY VS
FUEL ECONOMY ~MPROVEMENT
4-215 STIRLING ENGINE 4500 LB. IWC VEHICLE
(308 cc CDV) ----------------
COMPRESSOR CAPACITY WITH
~HOLLOW PISTONS
.1 .2 .3
I I I I I I I
COMPRESSOR CAPACITY WITH SOLID PISTONS
REF: ~4-215
COMPRESSOR CAPACITY
C.D.V. (CONTROL DEAD VOLUME) I I I
.4 .5 .S .7 .8 .9 1.0 FUEL ECONOMY IMPROVEMENT
MPG, M-H
FIGURE -1
2-48
Attachment 5
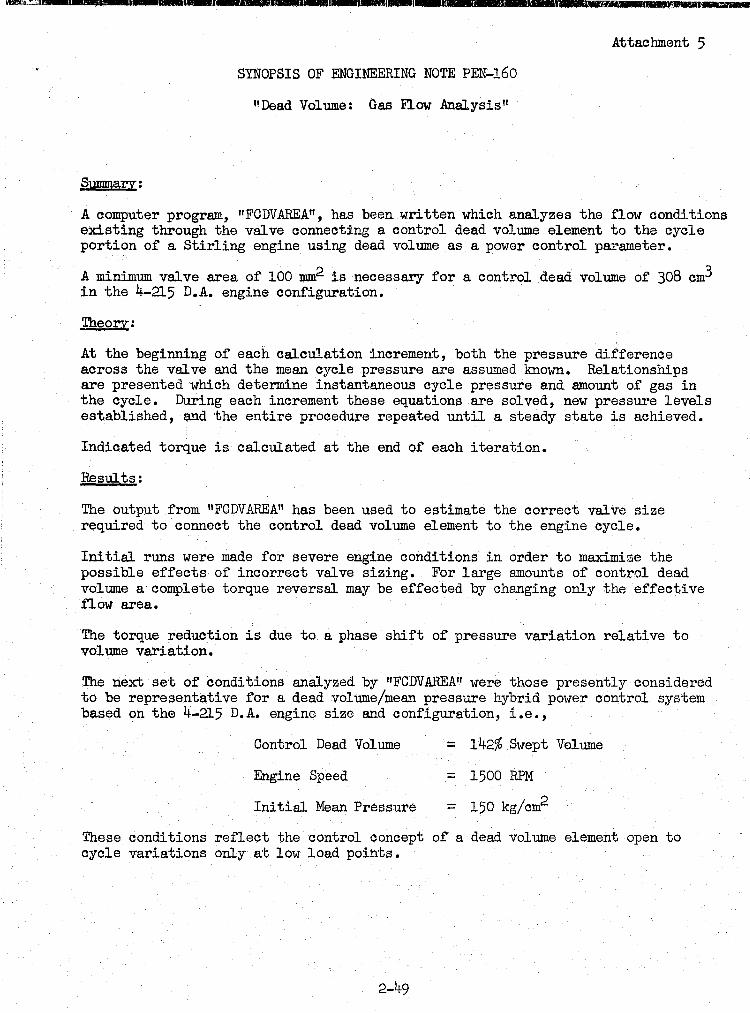
SYNOPSIS OF ENGINEERING NOTE PEN-160
"Dead Volume: Gas Flow .Anal.ysisll
Summary:
A computer program, "FCDVAREA", has been written which analyzes the flow conditions existing through the valve connecting a control dead volume element to the cycle portion of a Stirling engine using dead volume as a power control parameter.
A minimum valve area of 100 mm2 is necessary for a control dead volume of 308 cm3 in the 4-215 D.A. engine configuration.
Theory:
At the beginning of each calculation increment, both the pressure difference across the valve and the mean cycle pressure are assumed known. Relationships are presented which determine instantaneous cycle pressure and amount of gas in the cycle. During each increment these equations are solved, new pressure levels established, and the entire procedure repeated until a steady state is achieved.
Indicated torque is calculated at the end of each iteration.
Results:
The output from "FCDVAREA" has been used to estimate the correct valve size required to connect the control dead volume element to the engine cycle.
Initial runs were made for severe engine conditions in order to maximize the possible effects of incorrect valve sizing. For large amounts of control dead volume a complete torque reversal may be effected by changing only the effective flow area.
The torque reduction is due to a phase shift of pressure variation relative to volume variation.
The next set of conditions analyzed by "FCDVAREA" were those presently considered to be representative for a dead VOlume/mean pressure hybrid power control system based on the 4-215 D.A. engine size and configuration, i.e.,
Control Dead Volume = 142% Swept Volume
Engine Speed = 1500 RPM
Initial Mean Pressure = 150 kg/cm2
These conditions reflect the control concept of a dead volume element open to cycle variations only at low load points.
2-49
"11
Ci)
f\) C I :0
Vl rn 0 -I 0>
.............
f-./
CONTROL DEAD VOLUME FOR HYBRID POWER CONTROL
"--\-IIWtHr •• ·(:J{;{h :,:IHUI--I--( HEATERHEAD
DEAD VOLUME CONTROL VALVE
HIGH PRESSURE CRANKCASE
CONTROL DEAD VOLUME 308 cc 4 PLACES
<t ENGINE
I I
CONNECTING PASSAGES -COMPRESSION SPACE -CYL. TO ADJACENT COOLERS
.- ,-.-., c:--! ,.......,..-: ~ F""""1 ~ ~ ~ "':: ... ~ ~ ~ ~ ~ ~ E.::::
"" CO) c:
(\) JJ I m Vl -"
~,
.....
I
FUEL ECONOMY EFFECTS OF POWER CONTROL COMPRESSORS AND
COMPRESSOR OPERATING CONDITIONS (COMPUTER SIMULATIONS) .
NO COMPRESSOR
I.C. SHORTCIRCUIT
E.C. ROLL SOCKS, SHORTCIRClJlT
I E.C.SLI DING SEAL, SHORTCIRCUIT
i I.e. VARIABLE Ps AND Pd
LC. FIXE D Ps AND Pd
I
I
.-------------. - ----.- -,---- I - --.---- - - y-----.
-.2 -.1 .0 .1 .2 .3 .4 .5 .6 .7
M-HfUEL ECONOMY CHANGE, MPG
I.C.- INTE RNAL COMPRESSOR (40cc/REV) E.C. - EXTERNAL COMPRESSOR ,(53cc/"RE V) Ps A"N 0 Pd - COMPRESSOR SUCTiON AND DISCHARGE PRESSURES
(+.63)
( +.62)
(+.56)
(+.47)
(BASE)
(-.1 5) .
I\) !
\Jl I\)
............. --
SUB-TASK
SUBJECT YEAR 1977
MOS I SEP
1. Manu~ Mapping Controls
2. Vortair & Fuel Injector Control System
3. Alternate A!F Controls and Eff'ects on M-H EconolllV
SubTask No.
09
.--.
Sub-Task Description
pressure drop control
.Improve A/F control
.Reduce power loss of electronic power and control systems
.-.... ~ ~
ERDA Proposal Estimate (1)
,...,.......,
.2
.04
.10
~
CONTROL SYSTEM
1978
!:IEC J JAN
Develop Auto EGR Program.
JUL
Evaluate Dual Pump Eval. Proportional I Other Controls I on Flow Bench ~ Solenoid ~Investigations
Investigate Fueloff' on Decel
w/Fuel Closed Loop on Temp
® ® @ Theoretical Component
Estimate Analysis Test
J Analyze .Prog. Htr. Head Temp.
D ....... Engine
Test
7/31/78
Vehicle Projection
.25
r---""'l r--"'\ ~ ~ p:=:::=l ~ ~ ~
OCT
~ ~ ~
(\) I
Vl LA.l
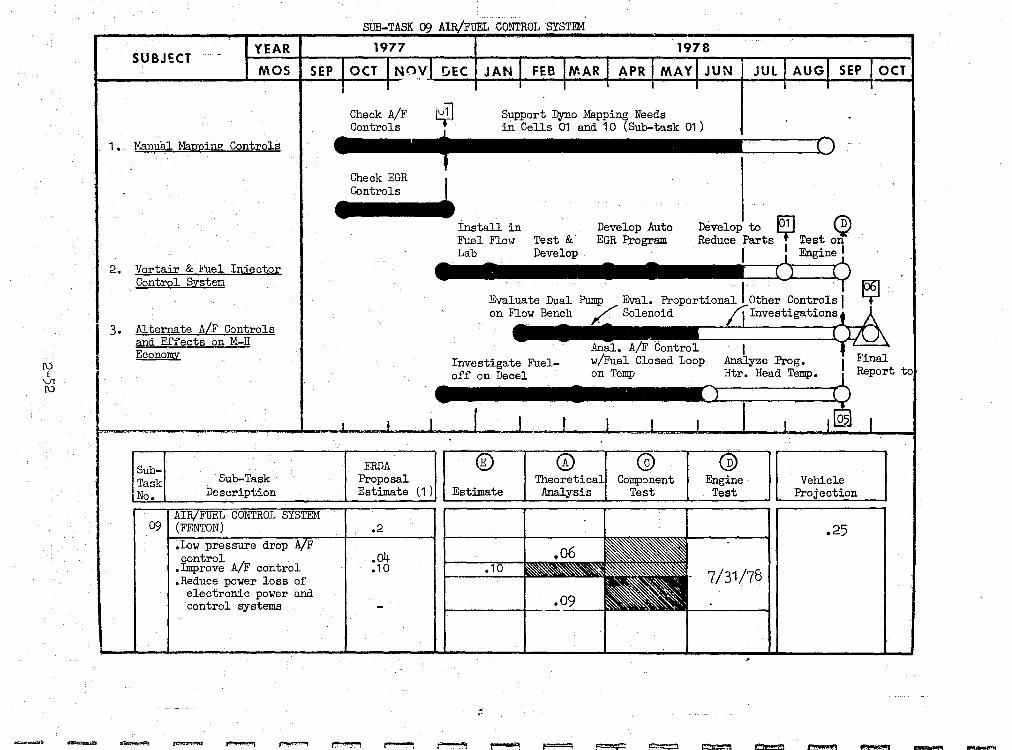
AIR/FUEL CONTROL - SUB-TASK 09
Technical representatives from Ultra Electronics spent two weeks investigating a noise problem in the PAC 500 control. The problem was traced to a propagation delay that generated an erroneous pulse which introduced noise in the throttle valve drive circuitry. A circuit modification to the control eliminated the problem. The PAC 500 was then installed in cellI.
The air/fuel control system in cell 10 was removed due to an apparent shift in calibration. This system was replaced with one from the fuel flow lab. Investigation revealed the shift in calibration was apparently due to slight circuit bias voltage shifts. The fuel control board circuit was modified to provide a stable reference voltage for the bias circuits.
The control and instrumentation systems in cell 1 have been checked-out by successfully controlling engine operations. A few problems were uncovered such as a defective integrated circuit in the fuel control board and a ground loop in the engine speed measuring circuit, but these problems were easily corrected. The PAC 500 programmable controller will allow rapid control loop changes during engine operation.
The wiring of the Engine Simulator Rig in cell 3 was completed and the air throttle and EGR valve positioning systems have been installed and checked out. .
The test and evaluation of the United Stirling dual pump metering system has been completed. The varying frictional forces presented by the dual pump at low speeds, in the 0.4 grams/sec. fuel flow range, make it very difficult to provide a motor drive capable of holding a constant low RPM speed. It appears a special design motor and speed control would be required. An Engineering Note (PEN-169) of this evaluation was written and a synopsis is included (refer to Attachment 6). No further investigation of this metering system will be attempted during Task I.
A special readout device has been designed for use with the hydrogen pressure measurement instrument in cellI. The instrument provides 0.05% accuracy measurement of engine hydrogen pressure.
~~~-'~--~~--~----".-.--,.---.,---. ,-"-""---
I I I I I I
I I I
I I I
..,.
~j . .,:
;1 i
~ ~.i
,4
!i
'j
'1 ~ '1
i :J j .,
.'l
'1 .. :; J J J
~ J
j ~
1 i
fl ~
[\) I
\Jl ..j::""
E:EJ
Air/Fuel Control - Sub-task 09 (Continued)
.Acoustic sensing Vortair air flow meters from J-TEK Corporation are being tested on the air now rig to determine if they are candidates for use on the Stirling engine.
The test and evaluation ofa turbine air flow meter from Autotronics CorPoration has been completed and an Engineering Note (PEN-180) was written describing the results of those tests. A synopsis of that Engineering Note is attached (refer to Attachment 7).
FUEL ECONOMY ASSESSMENT
The assessed maximum fuel economy improvement opportunity of Air/Fuel Control, sub-task 09, remained unchanged at 0.25 MPG (gasoline).
~ ~ ~ f;?iiffi EEl rzo ~ L.:J ~ ..:...,~; ~ c ;'] t'" ';'J ~ ~ c::J ~ ~ ~ ~
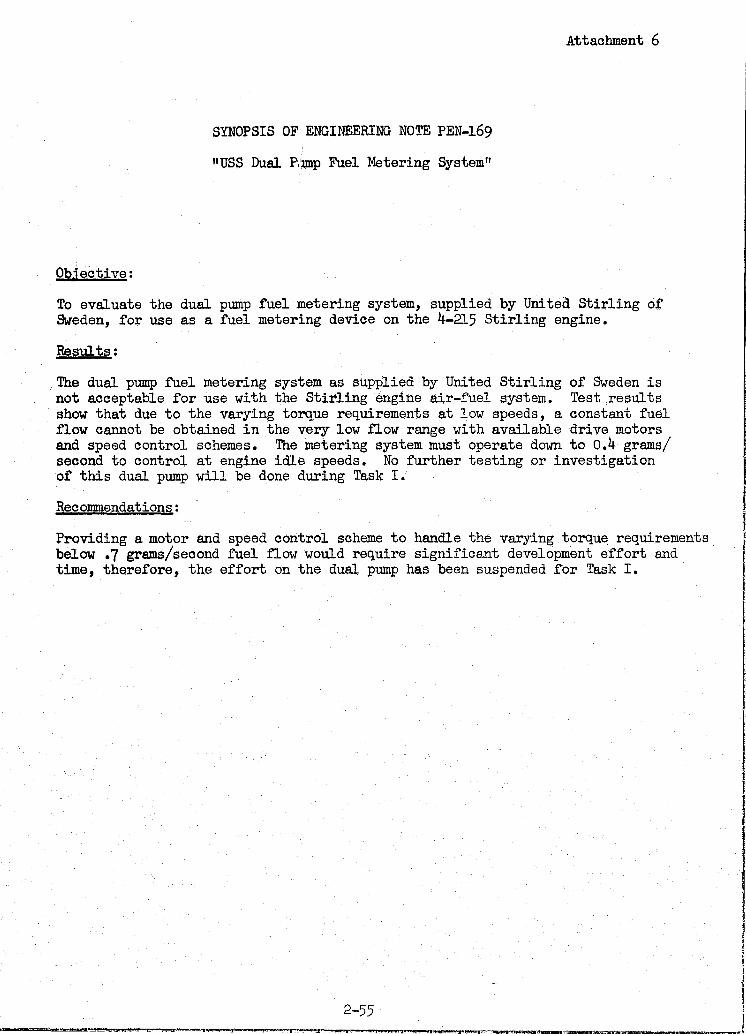
Attachment 6
SYNOPSIS OF ENGINEERING NOTE PEN-169
"USS Dual P,;unp Fuel Metering System"
Objective:
To evaluate the dual pump fuel metering system, supplied by United Stirling of Sweden, for use as a fuel metering device on the 4-2l5 Stirling engine.
Results:
The dual pump fuel metering system as supplied by United Stirling of Sweden is not acceptable for use with the Stirling engine air-fuel system. Test results show that due to the varying torque requirements at low speeds, a constant fuel flow cannot be obtained in the very low flow range with available drive motors and speed control schemes. The metering system must operate down to 0.4 grams/ second to control at engine idle speeds. No further testing or investigation of this dual pump will be done during Task I.
Reconnnendations:
Providing a motor and speed control scheme to handle the varying torqu~ requirements below .7 grams/second fuel flow would require significant development effort and time, therefore, the effort on the dual pump has been suspended for Task I.
2-55
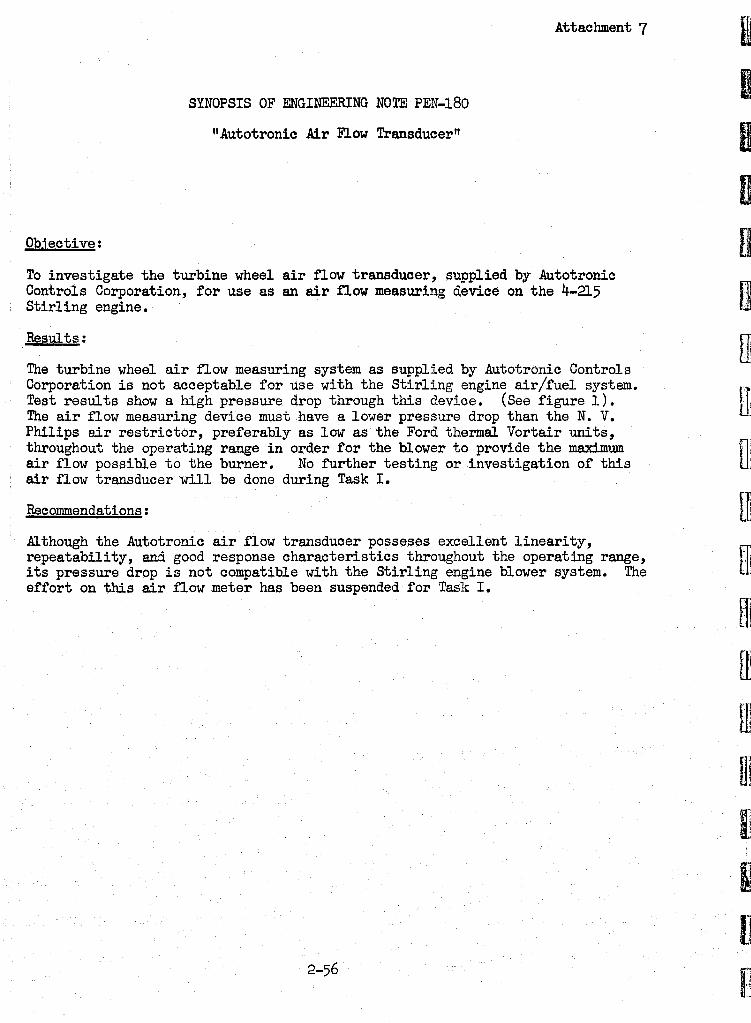
Attachment 7
SYNOPSIS OF ENGINEERING NOTE PEN-180
"Autotronic Air F.l.ow Transducer"
Objective:
To investigate the turbine wheel air flow transducer, supplied by Autotronic Controls Corporation, for use as an air flow measuring device on the 4-2l5 Stirling engine.
Results:
The turbine wheel air flow measuring system as supplied by Autotrbnic Controls Corporation is not acceptable for use with the Stirling engine air/fuel system. Test results show a high pressure drop through this device. (See figure J.). The air flow measuring device must have a lower pressure drop than the N. V. Philips air restrictor, preferably as low as the Ford thermal Vortair units, throughout the operating range in order for the blower to provide the maximum air flow possible to the burner. No further testing or investigation of this air flow transducer will be done during Task I.
Recommendations:
Although the Autotronic air flow transducer posseses excellent linearity, repeatability, and good response characteristics throughout the operating range, its pressure drop is not compatible with the Stirling engine blower system. The effort on this air flow meter has been suspended for Task I.
2-56
DJ
rn
rn
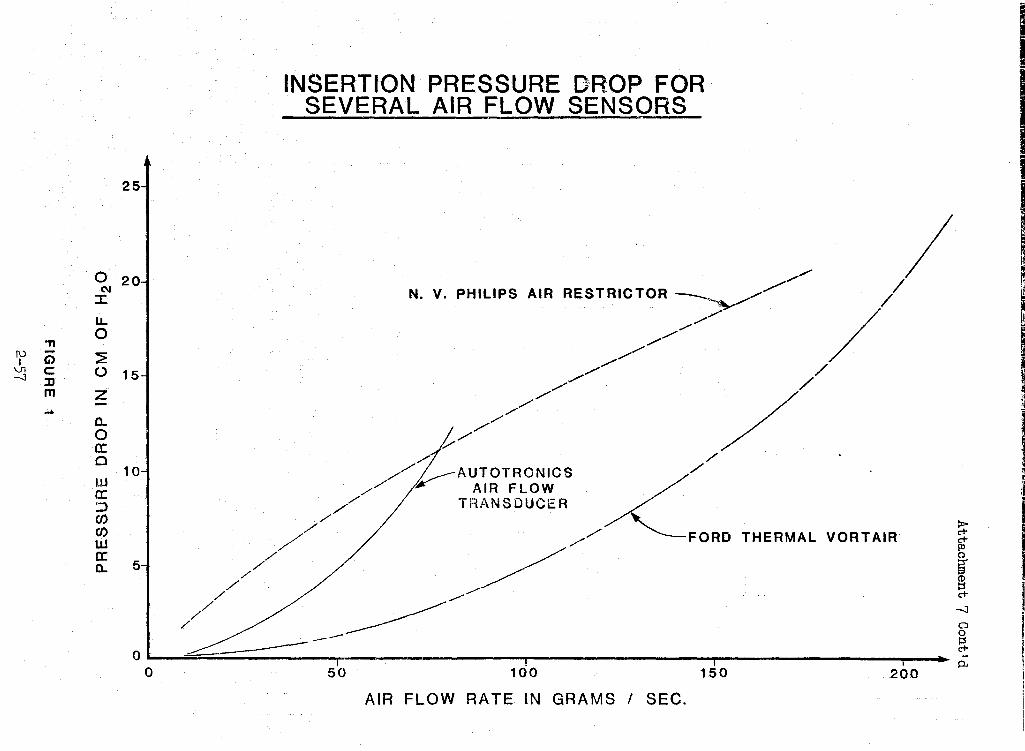
"T1 [\)
G) I \.Jl C -...J ::IJ
m ....
0 (\J
::r: u. 0
~ 0
Z
0-o a: Cl
IJJ a: :.:J en en UJ
25
20
15
10
a: 0- 5
INSERTION PRESSURE D'ROP FOR SEVERAL AIR FLOW SENSORS
N. V. PHILIPS AIR RESTRICTOR ___ ~// ~...-
/ //
//
//
/////
// 1",//
//
//
// / ./
,// AIR FLOW ,/./ TRANSDUCER
./
/1 //
// ~AUTOTRONICS ~./
./ /./ // FORD THERMAL VORTAIR
///// /~ /// ~--
OL ~-----O
I ill
50 100 150 200
AIR FLOW RATE IN GRAMS I SEC.
I I I I ~
I I I I
~ I ci" ci" I Pl Q
~ I CD ::s ci" I -...J
0
I 0 ::s ci"
p.
I 1 ,
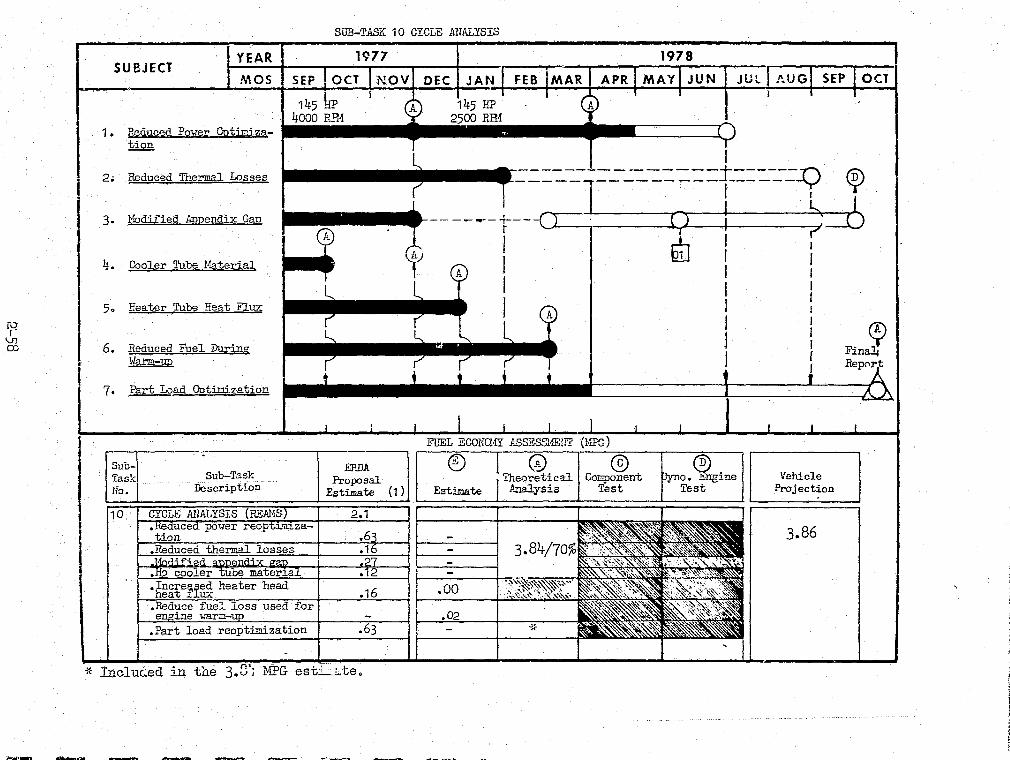
~ VI OJ
~ ~
SIlE-TASK 10 CYCLE PlIP.LYSIS
1977 YEAR SUBJECT
MOS I SEP
145
1. P~dl.lced Power Opt. . . 4000 _. u E.!2!l :!Jill.za- I ~r- - --
2. Reduced Thermal Losses
3. Hodified lmuendix Gau
4. Cooler Tube 11aterial
5 c F..eater Tube Heat Flux
6. Reduced Fuel Durino IoTa..T"ll:-up
7. Part L:Jad Ootimization
SubTask lb.
10
Sub-Task
* Inclucied in tn.e 3.D'; NPG estL;.te.
~ .r--! ~ r---. ;-~
® (1 ) Estimate
1978
JUl
I 0
---= == =f===:::-':-,:<?
~
Vehicle Projection
3.86
OCT
~
(1:)
FmaT
" ~
,.
; r
e
h i I r ~ , f

l\) I
V1 \,!)
CYCLE ANALYSIS - SUB-TASK 10
The proje~ted fuel economy improvement opportunity for sub-sub-task "Heater Tube Heat Fluxll has been reduced from 0.16 MPG to 0.00 MPG~ This is due to the fact that heater tube heat flux is primarily dependent on full-load power, engine length, and engine diameter. Once these factors and the geometric config-Ilration of the engine are specified, an independent function of flux versus fuel economy cannot be determined. In addition, if flux levels much greater than those in the range of current Stirling engine experiences 'lITere projected, a detailed stress analysis would be required to have a sufficient confidence level for engine application.
An optimization was completed ivith the cold start fuel penalty incorporated into the optimized function. Analysis revealed that, using the same constraints and requirements of the fourth generation fuel economy engine on the 4-215 Stirling engine, there is no fuel economy improvement available. Therefore, the fuel economy improvement opportunity of sub-sub-task IlReduced Fuel During WIU"IIlUp" has been reduce<;1 from 0.02 MPG to 0.00 MPG (gasoline).
An engine with the correct maximum. power to meet the baseline performance level has been optimized. Work on finalizing the engine map for this fourth generation fuel economy assessment engine is under way.
Due to same problems in the optimization procedure (not the algorithm that calculates the Stirling cycle), previous optimizations were not searching properly for the maximum fuel economy. With these problems corrected, the results from the optimized engine indicate an increase in the incremental fuel economy improvement of 1.40 MPG (gasoline).
Work on a slow speed (2500 BPl1) Stirling engine W'lS discontinued because no fuel economy improvement opportunity was expected over the 4000 RPM engine.
"\-lork -was initiated to investigate a smaller Stirling engine with approximately the same perfonnance as a 302 OlD IC engine.
FUEL ECONOMY ASSESSMENT
The assessed maximum fuel economy improvement opportunity of CYCle Analysis, sub-task 10, was increased from 2.38 to 3.60 MPG (gasoline).
I I I ~
I I
I
i !
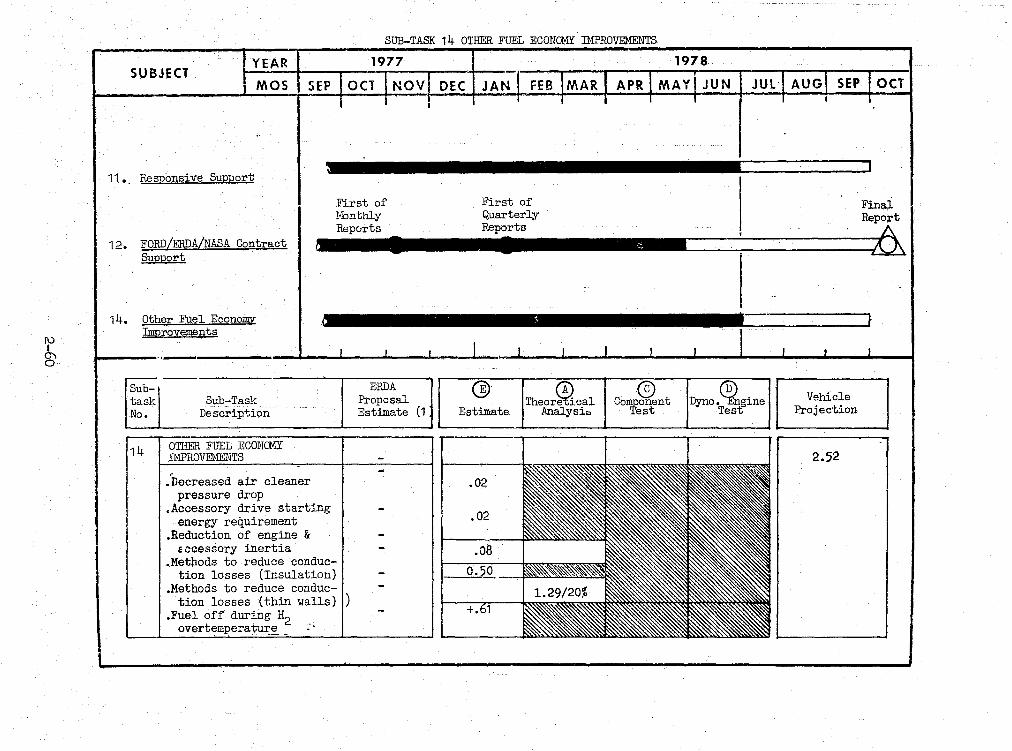
~ 0"1 o
SUB-TASK 14 OTHER FUEL ECONOMY IMPROVEMENTS
1977 1978
MOS I SEP JUl DEC I JAN OCT
YEAR SUBJECT
11. Resu6nsive Support
First of First of Final Honthly Quarterly Report Repurts • RePits ft.
12. FORD/ERDA/NASA Contract Support
14. other Fuel EconoI!I'l Improvements
,..- --------------,--------. Sub- ERDA I
task Sub-::-Task Proposal ' No. Description Estimate (1 J
I
1 4 OTHER FUEL ECONOMY IMPROVEt'-1ENTS
.Decreased air cleaner pressure drop
.Accessory drive starting energy requirement
.Reduction of engine & fccessory inertia
.Methods to reduce conduction losses (Insulation)
.Methods to reduce conduction losses (thin walls) )
.Fuel off during ~ overtempera~~e _
® Component Test
(§) ! r1', Theor~cal Estimate Analysi~
Dyno.~gine Test
Vehicle Projection
2.52
I\) I 0'\ ......
OTHER FUEL ECONOMY IMPROVEMENTS - SUB-TASK 14
Sub-sub task "Methods to Reduce Conduction Losses (Insulation)" has been added to this sub-task and the associated estimate for improvement.in fuel economy of the fourth generation engine is 0.5 MPG (gasoline). This improvement estimate is based on the assumption that an insulating material may be installed in the engine which will decrease the conductive heat losses from the regenerator and cylinder walls to the engine coolant. It has been initially assumed that the insulating material will be 1/16 11 (1.588 rom) thick with a thermal conductivity of 0.090 BTU/hr-ft-OF (0.158 watts/m-OC).
FUEL ECONOMY ASSESSMENT
The assessed maximum fuel economy improvement contribution of Other Fuel Economy Improvements, sub-task 14, was increased from 2.02 NPG to 2.52 MPG (gasoline).
i 1
I
I I i I
I I i I I
I
I
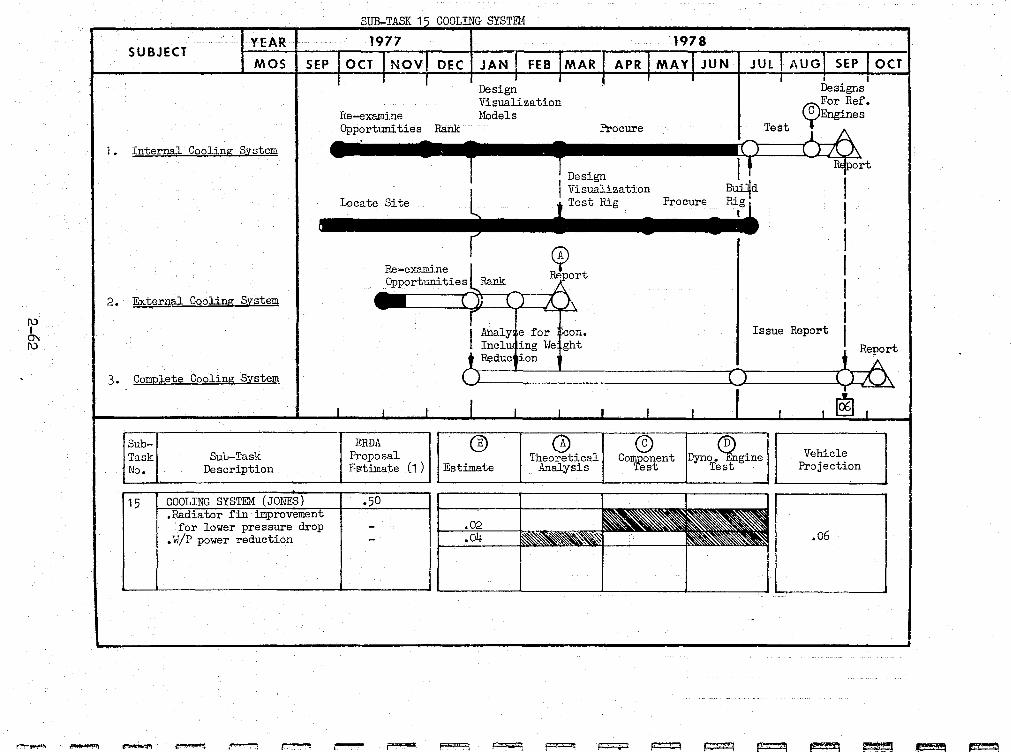
f\) I 0'. f\)
r~~ -..
SUBJECT YEAR MOS SEP
i. Internal Cooling System
2. Ext~rnal Cooling System
3. Complete Cooling System
~1-Task SuL-Task No. .. Description
15 COOLING SYSTEM (JONES) .Radiator fin improvement
for lower pressure drop .W/P power reduction
- - .~ ~
SUB-TASK 1') COOLUG SYSTEM
1977
DEC I JAN JUl I
Design Designs Visualization For Ref.
Re-examine ... 1·1odels (c)Engines .CJpp~rtunitie,. Rani< Procure Teet ~
"~dP I? orl
l I Visualization Blll .. * I Locate Site
r 1 Test Rig • Procure. ru..g~ I
I I I I
Re. cAl
-examJ.ne I Y Opportunities RruL~ BE:port
ERDA Proposal Estimate (1)
.50
-------_.-
AnalYie for tcon. Inclu ing ioJ'e ght Reduc ion
@ ~ Theoretical
Estimate Analysis --------.----~
® Comfeonent
est
Issue Report I
Dyno.~gine Test
Vehicle Projection
.06
OCT
r""""""" ~. f=9 !"=1 I . " p::;:::p ~ ~ ~ ~ ~ ~ ~
(\) I 0'\ l.O
COOLING SYSTEM ANALYSIS - SUB-TASK 15
The transparent plastic model which simulates the Stirling engine water jacket in the vicinity of the piston rod seals was fabricated, inspected, checked for leakage, and delivered. This water jacket model will be evaluated simultaneously in a parallel flow configuration with the previously fabricated model of the 4-215 water jacket which simulates the area in the vicinity of the cylinder and regenerator-cooler housing walls. This evaluation will determine if modifications to the coolant distributions and local flow velocities to minimize flow resistance losses are required.
FUEL ECONOMY ASSESSMENT
The assessed maximum fuel economy improvement opportunity of Cooling System Analysis, sub-task 15, remained unchanged at 0.06 MPG (gasoline).
~
~
I I
I I •
I
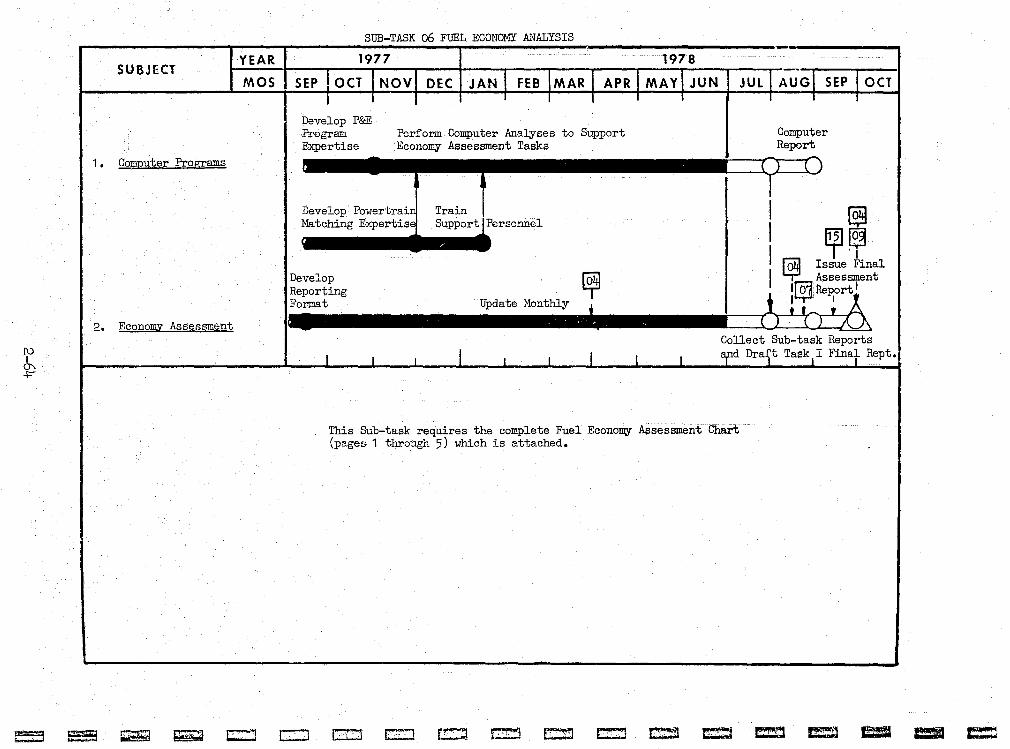
(\) I 0'\ +
e::::a
SUBJECT YEAR
MOS
1 • Computer Programs
2. EconomY Assessment
e9 ~ ~ c::::l
SUB-TASK 06 FUEL ECONOMY ANALYSIS
1977 1978
SEP loeTl NOVI DEC JAN 1 FEB IMAR r-APR I MAyl JUN JUl I Au'Ci\sEPT OCT r---~I-T I - ,-----r---r
Develop P&E Program Expertise
Perform Computer Analyses to Support Economy Assessment Tasks
Develop Povlertrain ~~tching Expertise
Train SupportiPersonnel
T-- 1---1
Computer Report
II L 1 I I$J I ~ff3 I rriiJ Issue Final
Develop roiil I ~ . Assessment Reporting 'T' Iro:lReport I
,Foit Update MonthlY .. t~ i . _~
I
CJ
Collect Sub-task Reports
I I I I I I I I Bfd Dr~t TasklI Finat Rept.
This Sub-task requires the complete Fuel Economy Assessment Chart(pages 1 through 5) which is attached.
cr::J c:::J P""'''';! ~ ~ ~ c:::::l ~ c:::1 ~ c:::J ~ a::IJ ~
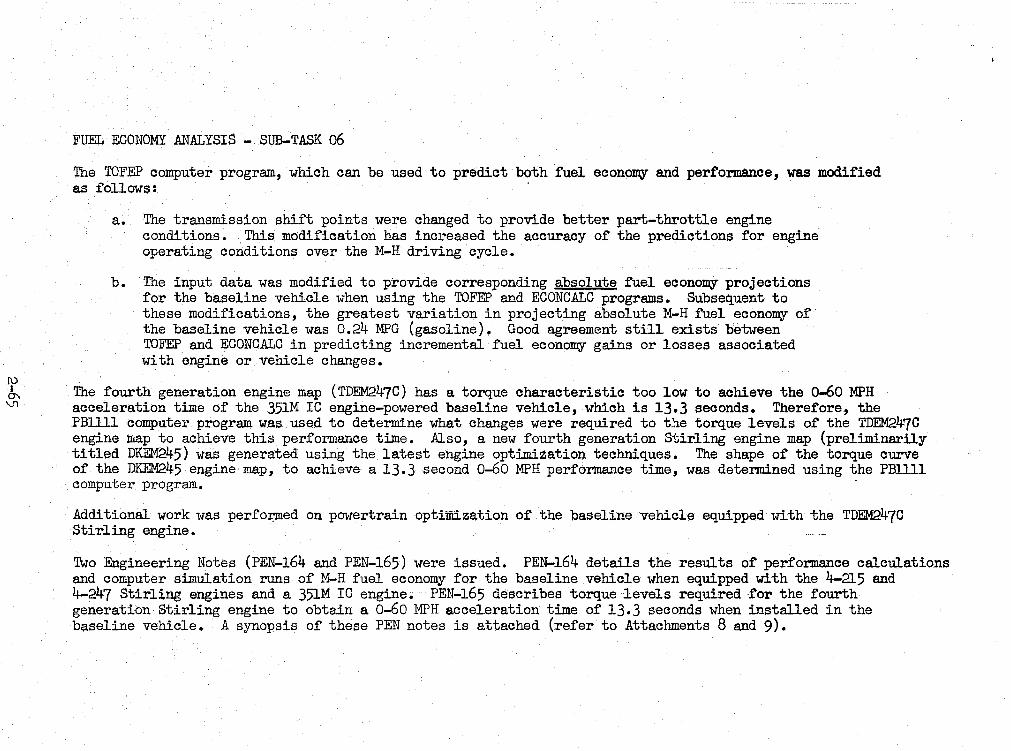
If> 0'\ V1
FUEL ECONOMY ANALYSIS - SUB-TASK 06
The TOFEP computer program, which can be used to predict both fuel economy and performance, was modified as f'ollows:
a. The transmission shift points were changed to provide better part-throttle engine conditions. This modification has increased the accuracy of the predictions for engine operating conditions over the M-H driving cycle.
b. The input data was modified to provide corresponding absolute fuel economy projections for the baseline vehicle when using the TOFEP and EOONOALO programs. Subsequent to these modifications, the greatest variation in projecting absolute M-H fuel economy of the baseline vehicle was 0.24 MPG (gasoline). Good agreement still exists between TOFEP and EOONOALO in predicting incremental fuel economy gains or losses associated with engine or vehicle changes.
The fourth generation engine map (TDEM2470) has a torque characteristic too low to achieve the 0-60 MPH acceleration time of the 351M 10 engine-powered baseline vehicle, which is 13.3 seconds. Therefore, the PBllll computer program was used to determine what changes were required to t~e torque levels of the TDEM2470 engine map to achieve this performance time. Also, a new fourth generation Stirling engine map (preliminarily titled DKEM245) was generated using the latest engine optimization techniques. The shape of the torque curve of the DKEM245 engine map, to achieve a 13.3 second 0-60 MPH performance time, was determined using the PBllll computer program. .
Additional work was perfor,ned on powertrain optimization of the baseline vehicle equipped with the TDEM247C Stirling engine.
Two Engineering Notes (PEN-164 and PEN-165) were issued. PEN-164 details the results of performance calculations and computer simulation runs of M-H fuel economy for the baseline vehicle when equipped with the 4-2l5 and 4-247 Stirling engines and a 351M 10 engine •.. PEN-165 describes torque levels required for the fourth generation Stirling engine to obtain a 0-60 MPH acceleration time of 13.3 seconds when installed in the baseline vehicle. A synopsis of these PEN notes is attached (refer to Attachments 8 and 9).
If> ~ ~
Fuel Economy Analysis - Sub-task 06 (Continued)
The Task I Fuel Economy Assessment Chart has been periodically updated to reflect changes in fuel economy projections that have occurred during each month of this reporting period. The latest changes for the" month of June, 1978 include:
a. In the Fuel Economy Assessment Chart Monthly Summary (Attachment 10) a new column titled "Confidence Weighted Opportunities" has been added. The number in this column represents the confidence-weighted fuel economy projection for the respective month. The confidence-weighted projection is determined by multiplying each maximum incremental fuel economy opportunity by its respective confidence level weighting factor. These numbers are totaled and added to the base fuel economy which is 13.9 MPG. (Fuel economy opportunities with confidence levels of 70% or greater are not weighted.)
b. In the Task I Fuel Economy Assessment Chart (Attachment 11) the incremental fuel economy, which is listed in the "Vehicle Projection" column, was changed to include both minimum and maximum projections.
c. Expected completion dates have been added to the open boxes in the "Component Test" and "Dynamometer Test" columns.
d. 'fivo baseline fuel economy projection numbers, 13.9 MPG and 15.7 MPG, now appear in the "Vehicle Projection" column on the summary page. These numbers represent the "best" e{:3timate of current 4-215 capability (13.9) and the original 4-215 objective (15.7). The 13.9 MPG has been established on the basis of chassis dynamometer testing results of the 4-215 Stirling engine and will be "used as the basis for fuel economy improvement projections.
~C:::~I>'i~~~~~~~~~~~~~~~~
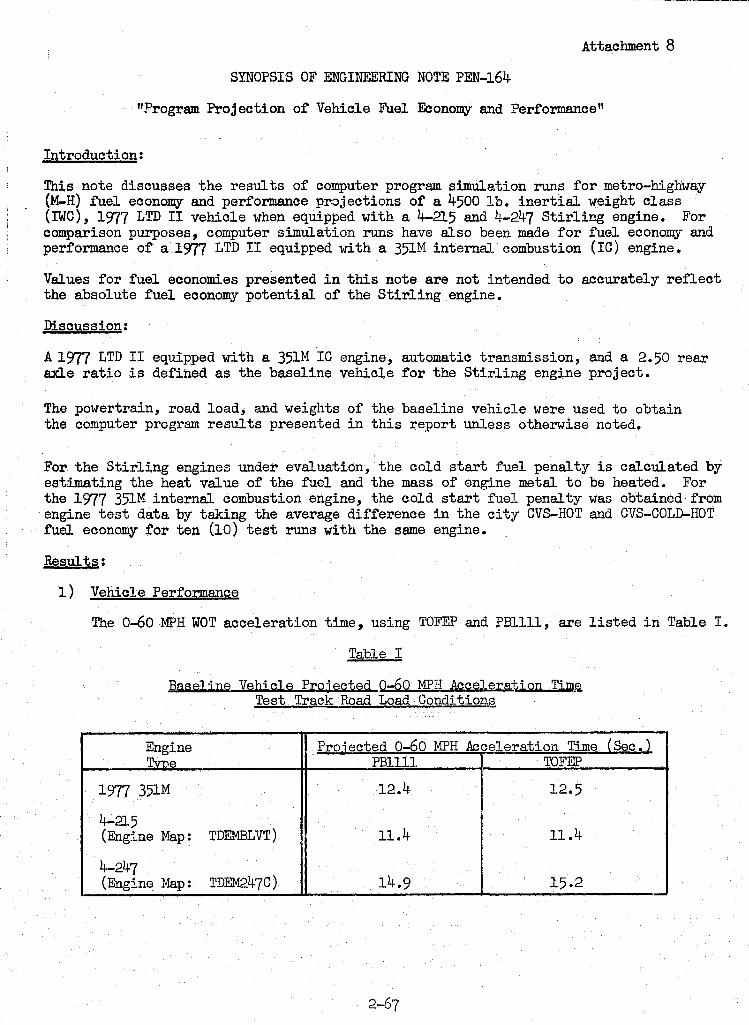
Attachment 8
SYNOPSIS OF ENGINEERING NOTE PEN-164
"Program Projection of Vehicle Fuel Economy and Performance"
Introduction:
This note discusses the results of computer program simulation runs for metro-highway eM-H) fuel economy and performance projections of a 4500 lb. inertial weight class (!WC), 1977 LTD II vehicle when equipped with a 4-2l5 and 4-247 Stirling engine. For comparison purposes, computer simulation runs have also been made for fuel economy and performance of a 1977 LTD II equipped with a 351M internru. combustion (IC) engine.
Values for fuel economies presented in this note are not intended to accurately reflect the absolute fuel economy potential of the Stirling engine.
Discussion:
A 1977 LTD II equipped with a 351M IC engine, automatic transmission, and a 2.50 rear axle ratio is defined as the baseline vehicle for the Stirling engine project.
The powertrain, road load, and weights of the baseline vehicle were used to obtain the computer program results presented in this report unless otherwise noted.
For the Stirling engines under evaluation, the cold start fuel penalty is calculated by estimating the heat value of the fuel and the mass of engine metal to be heated. For the 1977 351M internal combustion engine, the cold start fuel penalty was obtained from engine test data by taking the average difference in the city CVS-HOT and CVS-COLD-HOT fuel economy for ten (10) test runs with the same engine.
Results:
1) Vehicle Performance
The 0-60 MPH WOT acceleration time ~ using TOFEP and PBllll, are listed in Table I.
Table I
Baseline Vehicle Projected 0-60 MPH Acceleration Tim~ Test Track Road Load Condition2
Engine Proiected 0-60 MPH Acceleration Time (Sec.) TvDe PBllll TOFEP
1977 351M 12.4 12.5
4-215 (Engine Map: TDEMBLVT) 11.4 11.4
4-247 (Engine Map: TDEM247C) 14.9 15·2
2-67
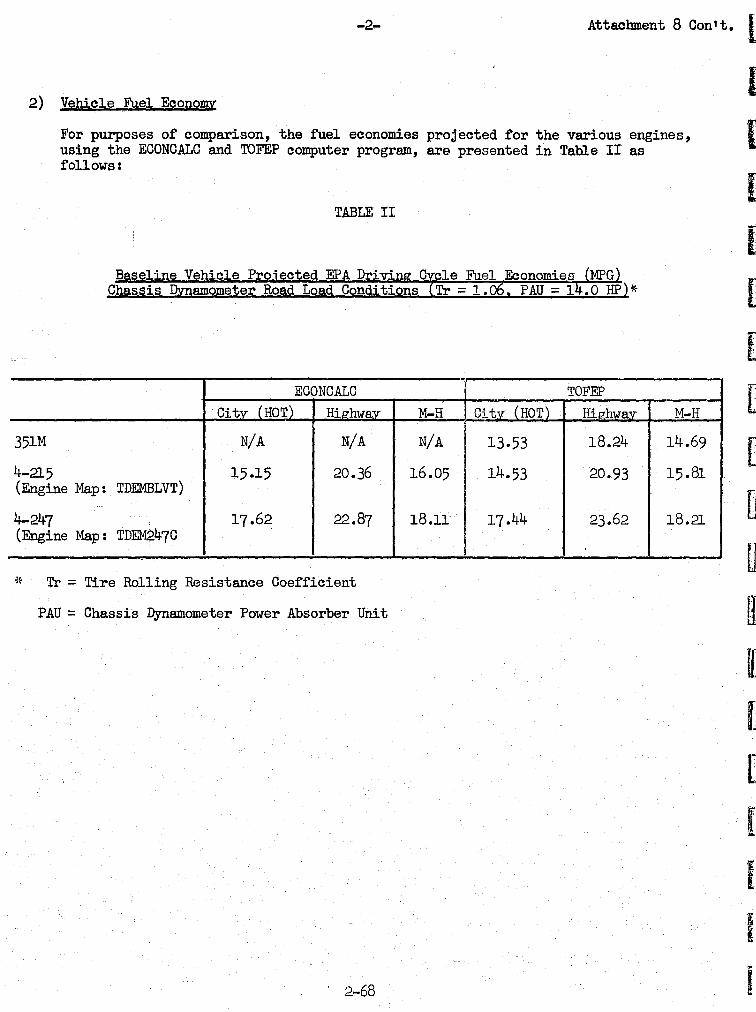
-2- Attachment 8 Con't. U
2) Vehicle Fuel Economy n
For purposes of comparison, the fuel economies projected for the various engines, II using the ECONCALC and TOFEP computer program, are presented in Table II as follows:
TABLE II
ECONCALC
Citv (HOT) Hi1hWJ:!..Y
351M N/A N/A
4-215 15·15 20.36 (Engine Map: TDEMBLVT)
4-247 17.62 22.87 (Engine Map: TDEM247C
1~ Tr = Tire Rolling Resistance Coefficient
PAU = Chassis PYnamometer Power Absorber Unit
. 2-68
-M-H citylHO~)
N/A 13.53
16.05 14.53
18.11 17.44
TOFEI?
lli,.RhwaY
18.24
20.93
23.62
M-H
14.69
15.81
18.21
D o n
ill [
[
[
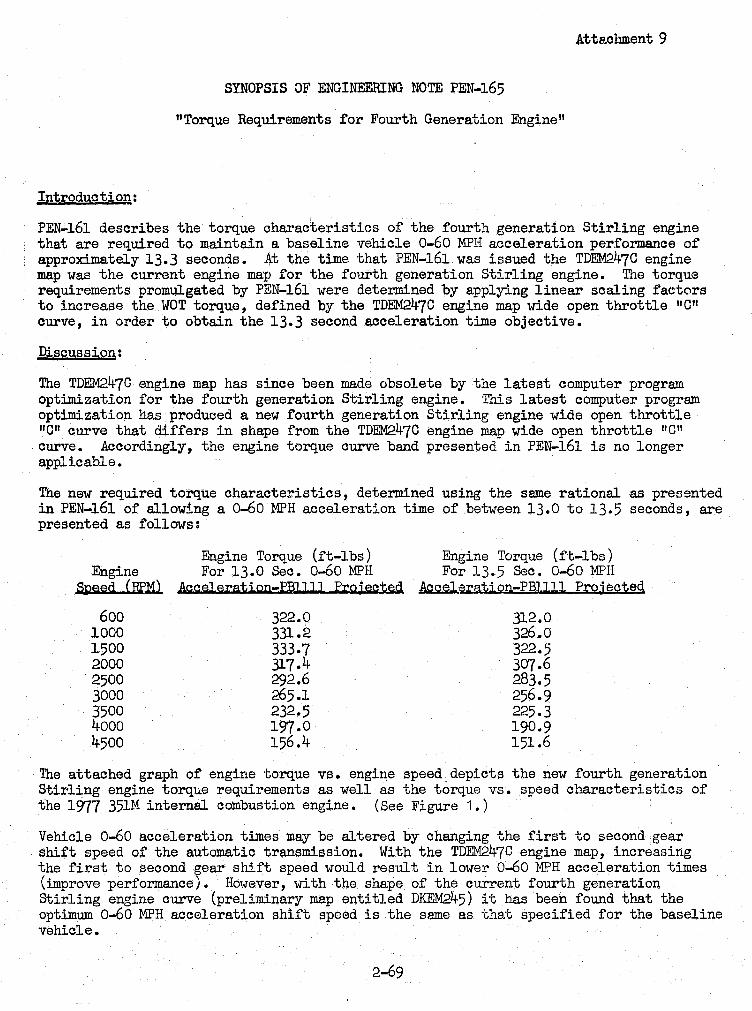
,(ltte.chment 9
SYNOPSIS OF ENGINEERING NOTE PEN-165
"Torque Requirements for Fourth Generation Engine"
Introducti0l!:
PEN-16l describes the torque characteristics of the £ourth generation Stirling engine that are required to maintain a baseline vehicle 0-60 MPH acceleration performance of approximately 13.3 seconds. !t the time that PEN-16l was issued the TDEM247C engine map was the current engine m~p for the fourth generation Stirling engine. The torque requirements promulgated by PEN-16l were determined by applying linear scaling fa~tors to increase the WOT torque, defined by the TDEM247C engine map wide open throttle "C" curve, in order to obtain the 13.3 second acceleration time objective.
Discussion:
The TDEM247C engine map has since been made obsolete by the latest computer program optimization for the fourth generation Stirling engine. This latest computer program optimization he.s produced a new fourth generation Stirling engine wide open throttle "C" curve that differs in shape from the TDEM247C engine map wide open throttle IIC" curve. Accordingly, the engine torque curve band presented in PEN-16l is no longer applicable.
The new required torque characteristics, determined using the same rational as presented in PEN-161 of allowing a 0-60 MPH acceleration time of between 13.0 to 13.5 seconds, are presented as follows:
Engine §peed (RPMl
600 1000 1500 2000 2500 3000 3500 4000 4500
Engine Torque (ft-lbs) Engine Torque (ft-lbs) For 13.0 Sec. 0-60 MPH For 13.5 Sec. 0-60 MPH
Acceleration-PBJ J]] Prgj ected. ~~ra.tion-PBllll Proj ected
322.0 331.2 333.7 317.4 292.6 265.1 232.5 197·0 156.4
312.0 326.0 322.5 307.6 283.5 256.9 225.3 190.9 151.6
The attached graph of engine torque vs. engine speed depicts the new fourth generation Stirling engine torque requirements as well as the torque vs. speed characteristics of the 1977 351M internal combustion engine. (See Figure 1.)
Vehicle 0-60 acceleration times may be altered by changing the first to second gear shift speed of the automatic transmission. With the TDEM247C engine map, increasing the first to second gear shift speed would result in lower 0-60 MPH acceleration times (improve performance). H01.J"ever, with the shape of the current fourth generation Stirling engine curve (preliminary map entitled DKEM245) it has been found that the optimum 0-60 MPH acceleration shift speed is the same as JGhat specified for the baseline vehicle.
2-69
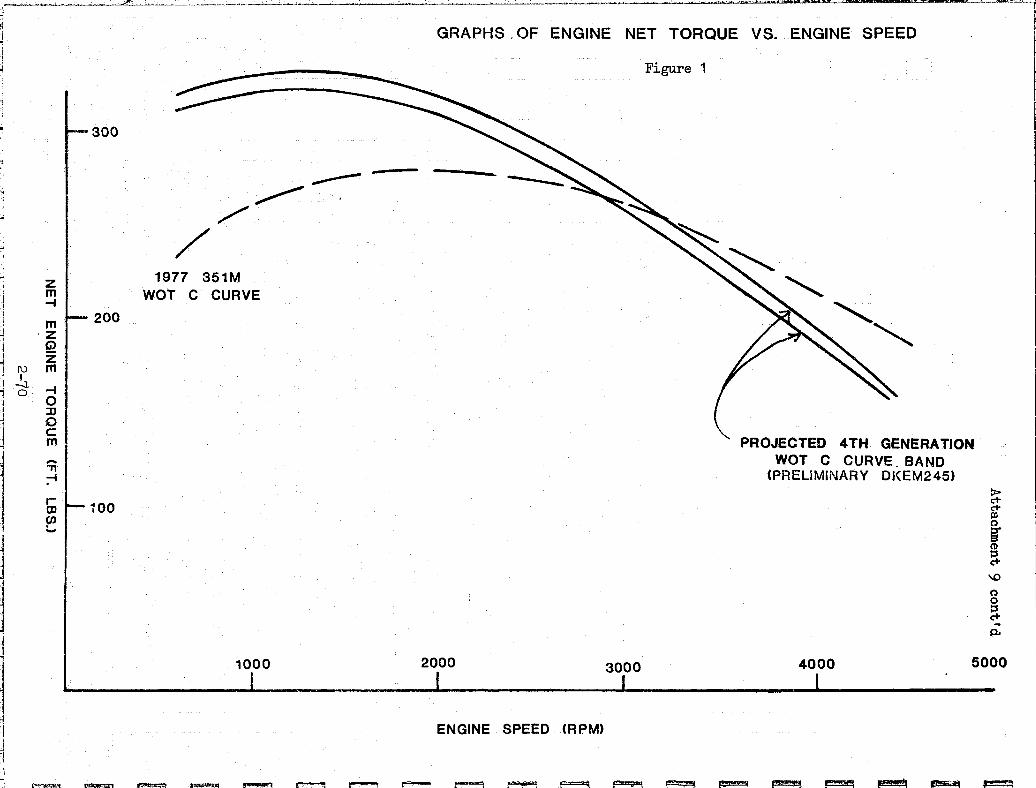
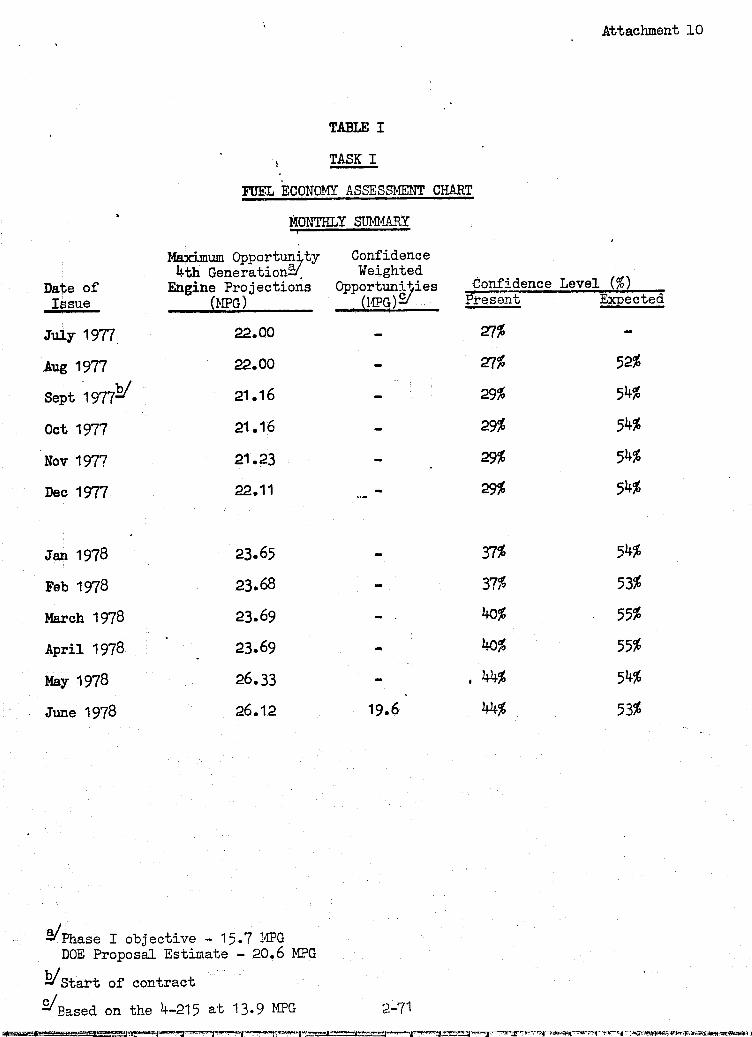
Attachment 10
TABLE I
\ TASK I
FUEL ECONOMY ASSESSMENT CHART
MOlmn,y SIDviMARY
Date of Issue
July 1977.
Aug 1977
Sept 1977Pi
Oct 1977
Nov 1977
Dec 1977
J~ 1978
Feb 1978
March 1978
April 1978
May 1978
June 1978
I
l~um Opport~~ty 4th Generation~
Engine Projections (HPG)
22.00
22.00
21.16
21.16
21.23
22.11
23.65
23.68
23.69
23.69
26.33
26.12
YPhase I objective - 15.7 HPG DOE Proposal Estimate - 20.6 MPG
BlStart of contract
Confidence Weighted
Opportun~~ies (HPG)Si
19.6
£lEased on the 4-215 at 13.9 MFG 2-71
Confidence Level (%) Present Expected
'Zf%
'Zl%
29%
29%
29%
29%
37%
37%
40%
40%
• 44%
44%
52%
54%
54%
54%
54%
54%
53%
55%
55%
54%
53%
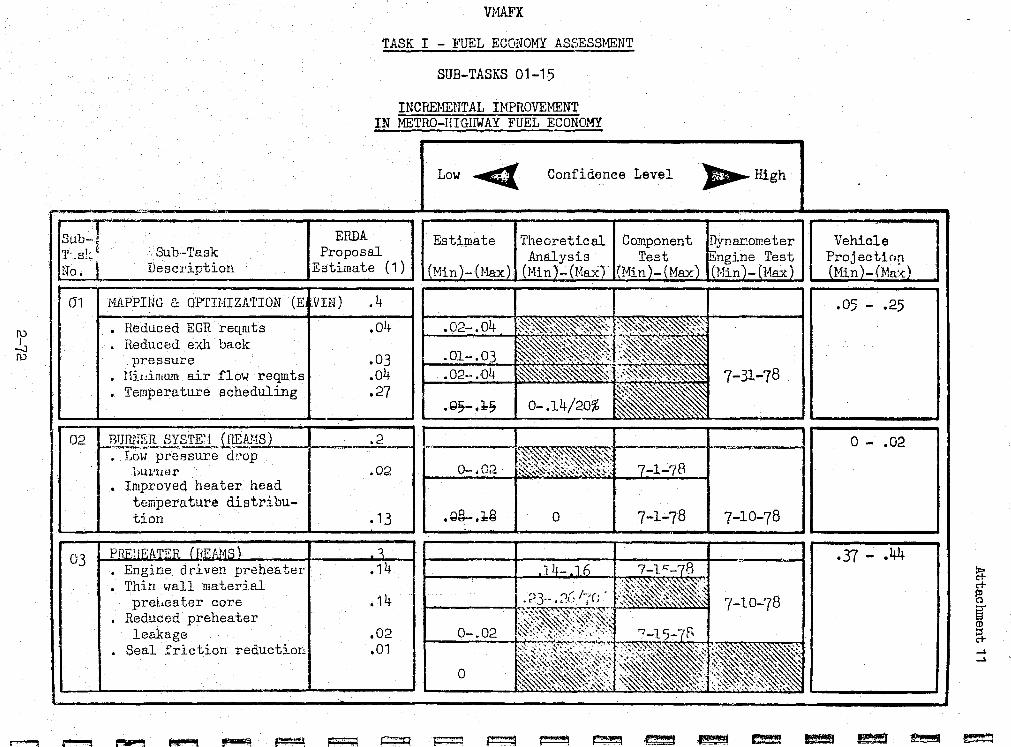
... .., .,.--~ -
SUb-J T'.s!: ~ Sub~Task
No. I Description
(J1 NAPPInG e: OPTIMIZATION (E
ro • Heduced EGR reqmts -!..J • Reduced e~l back ro pressure
• llillinlWll air flow reqmts
I • Temperature scheduling
02 ~l!illlli!!i. SYSTE\1_.LllEA:'.1S) • Low prcf1sure d~.'op
hlu'lwr • Improved heater head
temperature dis'tribu-tion
03 PflF!IFA.TER (m;;AJlJs) · Engine driven preheater • Thin \-rall material
preheater core · Reduced preheater
leakage • Seal friction reductioll
VMAFX
TASK I - FUEL ECONOMY ASSESSHENT
SUB-TASKS 01-15
INCREMENTAL IHPROVEMENT IN METRO-HIGHWAY FUEL ECONOMY
I Low ~ Confidence Level "... High I ERDA Estimate Theoretical Component DynaI:'.ometer
Proposal Analysis Test IEngine Test Estimate (1) (Min)-(Hax) (Hin)- (Hax) (Min)-(Max) (Nin)-(Max)
VIN) .4
.04 .02-.04 ,~~~~:::~ .. '~~~~~" ~",~',":-~ :~~~ ,,,:-,:.~,~ ""~';:'~"
_~~ir. .03 .01-.03 .04 .02-.04 ~~~~~< .~~~,~~ 7-31-78 .27 .. .Q,-.l-, 0-.14/20%
.2.~_ ....,.-" .. "'. "b~ ~
~;~,~'c~-::'~~~~ .02 0-.02 :;S,:"I- -""'~~~0~' , ... .,;:- 7-1-78 ~..;;~~~,~~"~:;.,:,~~,,,~~:).,,.
.13 .Q~.l-g 0 7-1-78 7-10-78
~ ~-~
.14 14- .16 7-11;"-78 ::~:~~",~~ ..
. 23-- . ';>('/7(:" , ...... '., ~~' ~ ....
.14 <~~:,,~~,~~z~~ 7-10-78 ~;:,:~~~:~.;:~~:\>~.~ c";-~~~,,,.,,,\:-, ~~\
.02 0-.02 ~~;?~~~t:;~~~~ :~;~::',~ :~.:~.~.- :-15-70 • 01 .;: ~.~ :.:~~~~~:-- :77;. ~~:::~'~~~:~~~:'
~ • ,~ .. ,~~:-. "~,\,~,~.."",,,,:,\,,~ ~~~~~~: ~~.~~.~ ,~:~:~, 0 , ~. -',':. ~,~ ... ~~~>., ,~-~> "'~~~~~' ~~~~,~~'..~::: ~'~ .. ~~~~~ '"
Vehicle ProjectiCl[l (Hin)- (Ha:d
.05 - .25
o - .02
.37 - .44
1 1
~ I
,
I
I
8: c+ ~
i ~ .-. .-.
r-""'"1 r--""'! ~ ~ ~ ~ ~ a:::::::;:l ~ ~ ~ ~ .fJ''"'±J ~ ~ ~ ~l ~ ~
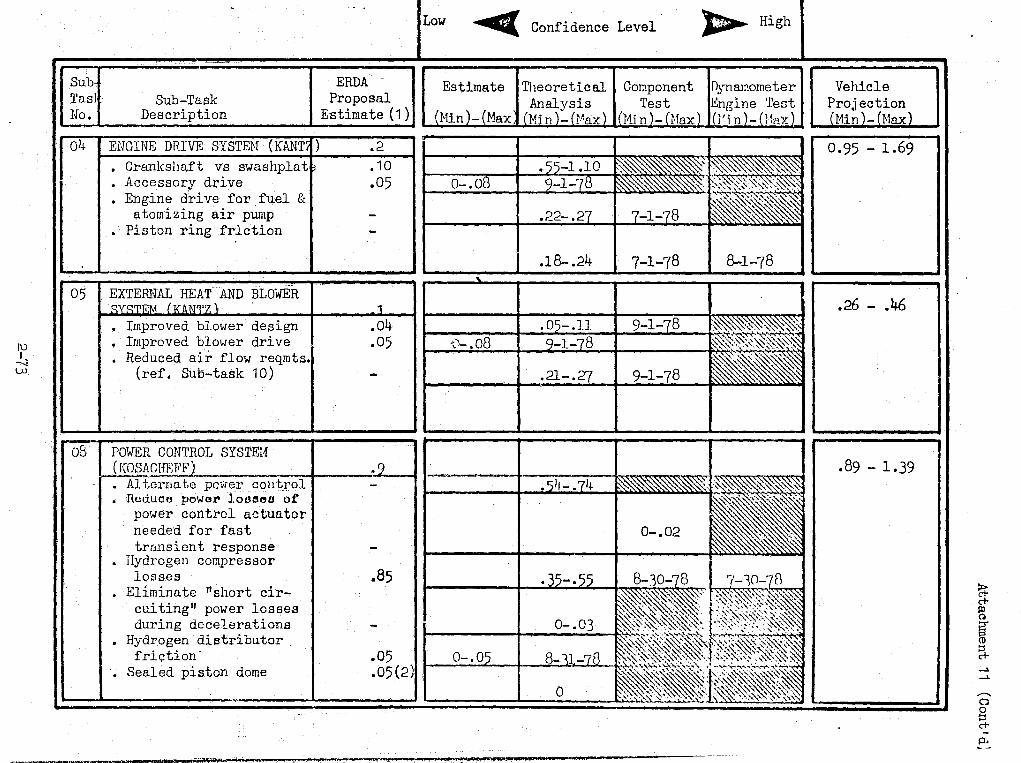
I\)
II I --.,J w
Sub Tas] Sub-Task Ilo. Description
04 I ENGINE DRIVE SYSTEH (KANTI ) • Crankshaft vs swashpla t ~ • Accessory drive • Engine drive for fuel &
atomizing air pump Piston ring frlction
---
05 I EXTEillfAL IlliAT AND BLOWER
08
• Improved blower design • Improved blower drive
Reduced air flow reqmts. (ref. Sub~task 10)
POi-fER CONTROL SYSTEH ~KosAglmTI'Fl . • Al terna te pmrer coll :trol
• Reduce powar loaeeu o£ power contrel actuator needed for fast trw1sient response
• Hydrogen compressor losses
• Eliminate "short circuiting" power losses during decelerations
• Hydrogen distributor friction"
• Sealed piston dome
Low .......r(' Confidence Level ~ High
ERDA Estimate COf.!ponent Proposal Test
Estimate (1 )
.2
.10
.05 0-.08
-1-78
I I
.04
.05
.9
.85
.05 • 05(2)
.18- .24 7-1-78 8-1-78
H
~.)- .08
.21-·27 9-1-78
.511- .71~
0-.02
·35- . 55 ~. 8-30-i' '. 7 -. W~-:ill . ~\~~ •. j ~~~~:~:>.'.~ ~~1i:~~~ .. t··,·~~~-,~·-· ~,;~~~
0- .03 ~~~~~~~~ "~·~},'~'?:~<t~~~~· t-----f---,.;..;..;;;......w., ...... ::,: ' .... '~~ ........... ~~~
.~~~~~~~'\;r:~·:&~~~:~ 0-.0 , ~~~~:S>~*~>i. ~~;;~~~:,.,.:~~%,~ '""~"\.;":"- .... ~ ... ~\~ ......... '" . "- ..... --"" ... ~ ... , ........ ,~...,:...... ........
o ~~~~.:1~~~~~~1~.~.' ,: ... ~':''i~~1~~~~~~\~~~~~
*,J2i;l1.u~~ ,QAffI~--,4.U~·· ~"*"';; '-'. . ...... ',. . La.i:W*;sr;z
Vehicle
0.95 - 1.69
.26 - .46
.89 - 1.39
8: et-
~ [ ~ ~
~
........ o § et-
A>
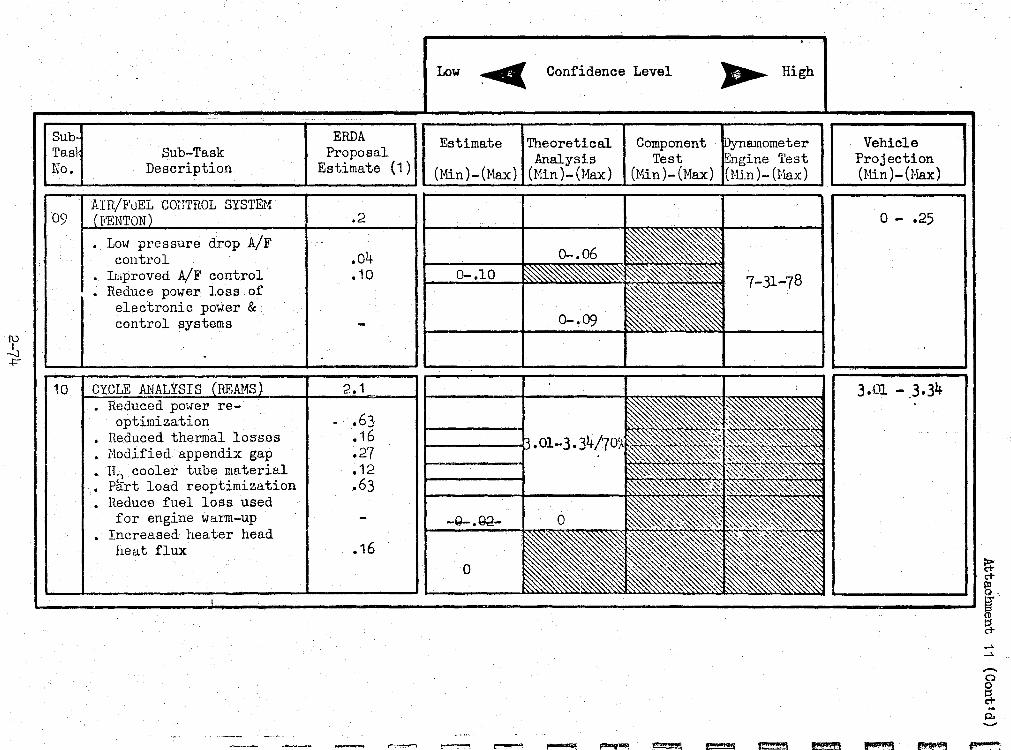
I\)
..!.J +"
Sub Tas1 No.
09
Sub-Task Description
• Low pressure drop A/F control
• hiproved A/F control • Reduce power loss of
electronic power & control systems
10 I CYCLE ANALYSIS • Reduced power re
optimization • Heduced thermal losses
?10dified appendix gap • II') cooler tube material
Part load reoptimization • Reduce fuel loss used
for engine w~rm-up · Increased heater head
he~t flux
ERDA Proposal
Estimate (1)
.2
.04
.10
2.1
- .63 .16 .27 .12 .63
.16
Low ~ Confidence Level
Estimate Theoretical Component Analysis Test
(Min)-(Max) (Min)- (l1a.x) (Min)-(Max)
0-.10
0-.09
-Q-.Qa-
o
~ High
pyn81nometer IEngine Test (Nin)-(Hax)
7-31-78
Vehicle Projection (Nin)-(Nax)
o - .25
3.01 -.3.34
~ c+ Pl Q.
i 8-~
~
,..... o o 8-0. '-'
,.,.-.,.....-,r--'!~~~~~~~r:::!l~t=
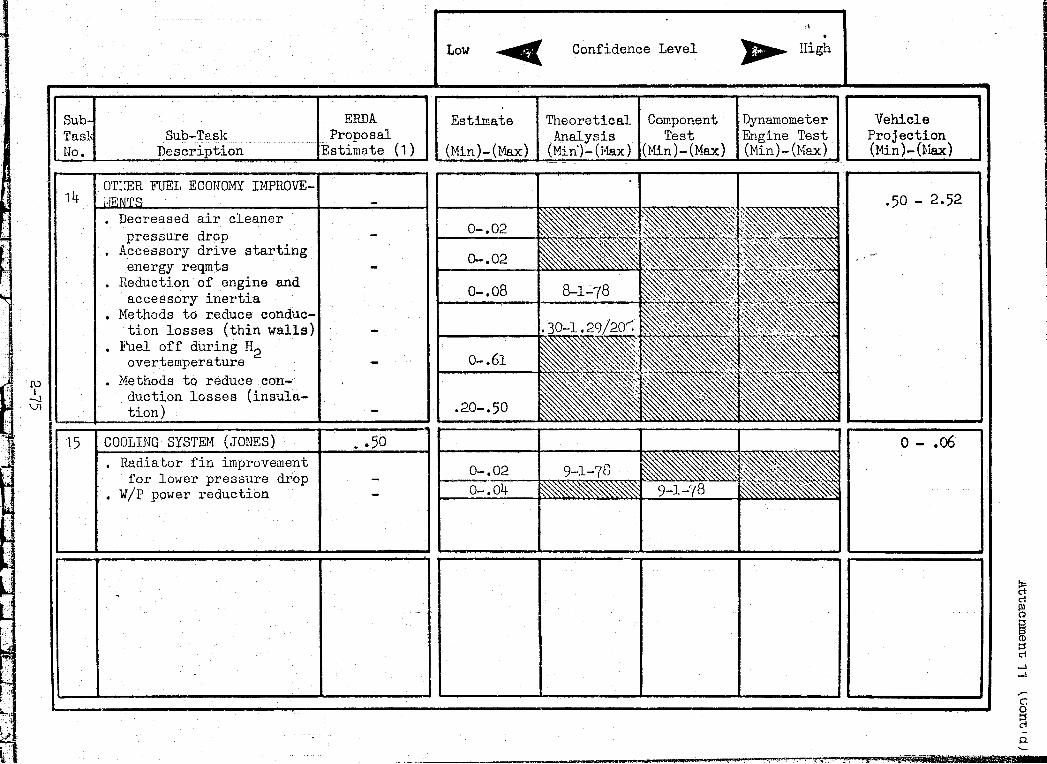
.-
I Sub- ERDA Tas1 Sub-Task ...
Proposal No. Description Estimate (1)
11t O'eER FUEL ECONOMY IMPROVE-'·iENTS -• Decreased air cleaner
pressure drop -• Accessory drive starting
energy reqmts -• Reduction of engine and
accessory inertia • Methods to reduce conduc-
tion losses (thin walls) -• Fuel off during H2
overtemperature -~
• Nethods to reduce con-duction losses (insula-
V1 tion) -15 COOLING SYSTEM (JONES) _ .50
• Radiator fin improvement for lower prensure drop -
• W/p power reduction -
,
-
f·
\ . Low ~ Confidence Level ~ High
Estimate Theoretical Component Dynamometer Vehicle Analysis Test Engine Test Projection
(Min)-(Max) (Min')- (J>1a.x) (Min)-(Max) (Min)-(Nax) (Min)-(Hax)
.50 - 2.52
~ ~, .. 0-.02
~~ ~awl.'~ 0-.02 .'~'~~' -
0-.08 8-1-78 ~~ .. , .~ .30-1 • .29/20'''', _:' ~. ~ ~".~ ~ ~ ~~~~~'~
0-.61 ."'. • '~~~-~~ "~~ .20-.50
~ ~ '~~ ~~~~~ ~ ~ ~~
o - .06 •• • 0-.02 9-1-7cJ ., 0-.04 ~ 9-1-'(8
----------
K i .tt1@KitliBlf
:
8 c'I
~
i ~ -' -'
.--c: o ~ p.
I
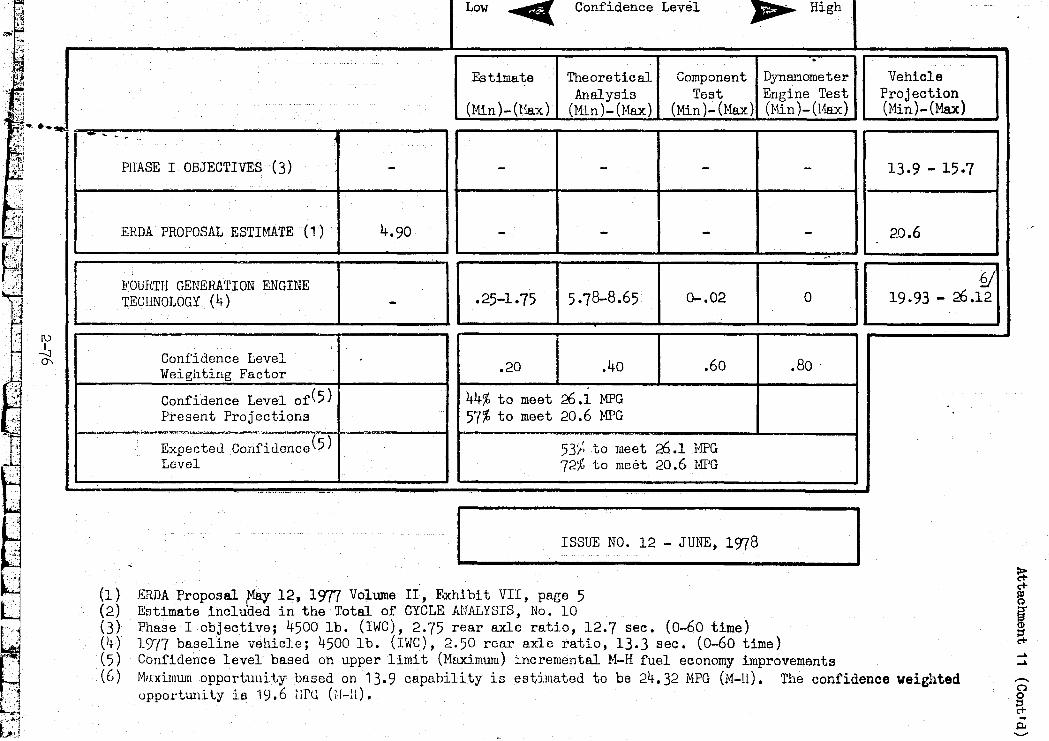
~':J ~
r,"jj
N~
-1
/j " '1 I.":,,,~ ~ -,"'1 ~~.j
-
[\)
~ 0"\
Low ~ Confidence Level ~ High
. Estimate Theoretical Component Dynamometer Vehicle
Analysis Test Engine Test Projection (l1in)- (l1ax) (l1in)-(l1ax) (Min)-(Hax) (Hin)-(Hax) (~1in)- (Hax)
~ ........... "-
PHASE I OBJECTIVES (3) - - - - - 13.9 - 15.7
ERDA PROPOSAL ESTIMATE (1) 4.90 - - - - 20.6
- -§/
1 1 5• 78-8.65
FOURTH GEl\TERATION ENGINE
1 1 I TECHNOLOGY (4) - .25-1.75 0-.02 0 19.93 - ~.12
I
Confidence Level .20 .40 • 60 Weighting Factor
Confidence Level of(5) 44% to meet ~.l MFG Present Projections 57% to meet 20.6 MFG
. --"t_ Exp:~ted Con~~ence(5) 53~ to meet 26.1 BPG Level 72% to moet 20.6 14PG
.... - ... -" -- -
[ ISSUE NO. 12 - JUNE, 1978
(1) ERDA Proposal ~Y 12, 1977 Volume II, Exhibit VII, page 5 (2) Estimate included in the Total of CYCLE AtJALYSIS, No. 10 (3) Phase I objective; 4500 lb. (IWC), 2.75 rear axle ratio, 12.7 sec. (0-60 time) (l.t) ln7 baseline vehicle; 4500 lb. (IWC) , 2.50 rear axle ratio, 13.3 sec. (0-60 time)
.80 .
(5) Confidence level based on upper limit (Maximum) :'ncremental. M-H fuel economy improvements (6) MlllCimum opportunity based on 13.9 capability is estililated to be 24.32 MPG (M-II). The confidence weighted
uppor"tunity is 19.6 uru (n-it).
:; c+ ~
i ::s c+ ...... ......
........ Q
~ -p. .....,.
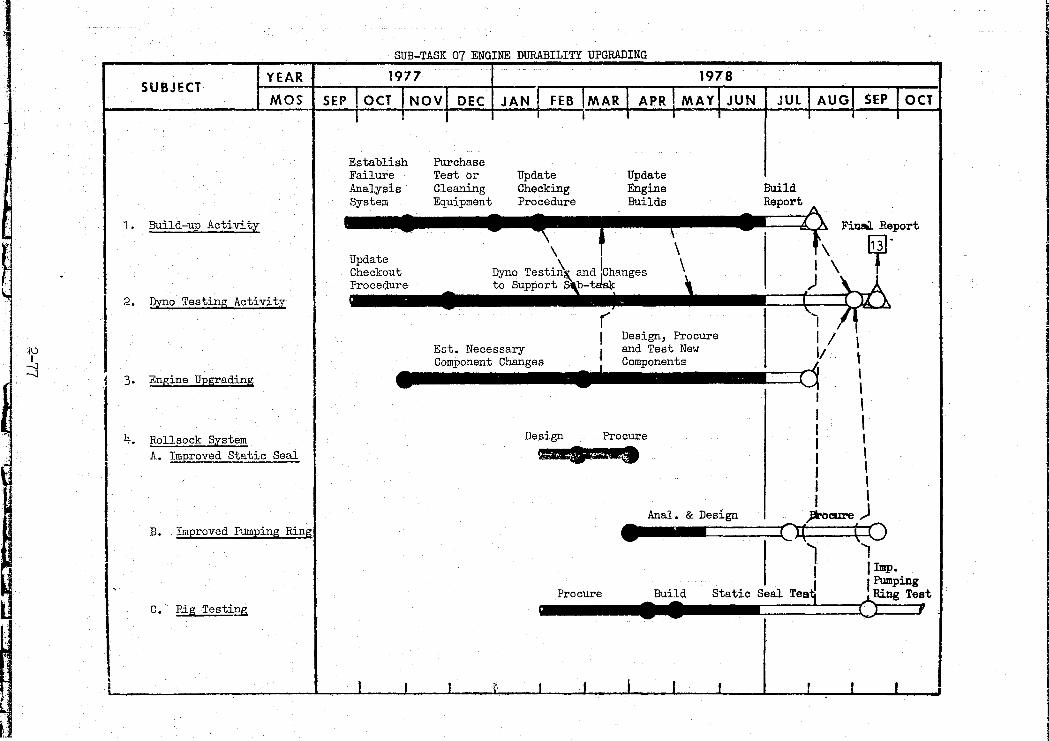
SUB-TASK 07 ENGINE DURABILITY UPGRADING
MOS SUBJECT
YEAR 1977 1978
JAN-I FEB IMAR I APRI MAUJUN SEP TOCT IN-ovT DEC JUlJAuQl_~EP IOCT -I -.-----.---- r --I
Establish Purchase Failure Test or Update Update Analysis Cleaning Checking Engine Build
·<
f\)
-lJ -.J
1. Build-up Activity
2. Dyno Testing Activity
3. Engine Upgrading
System Equipment Procedure Builds Report
• • __ t I '. 1 fual ~Port Update \ I \ \ lU1 Checkout Dyno Testi~ and ,C?anges )1 \ f Procedure to Support Sj-t~) M
• J ( (
I ").1 4. Rollsock System Design Procure
A. ImRroved Static Seal ~~
ij
B. Improved Pumping Ring
C. Rig Testing
, I I ,~, I I I , I I I I I
t:
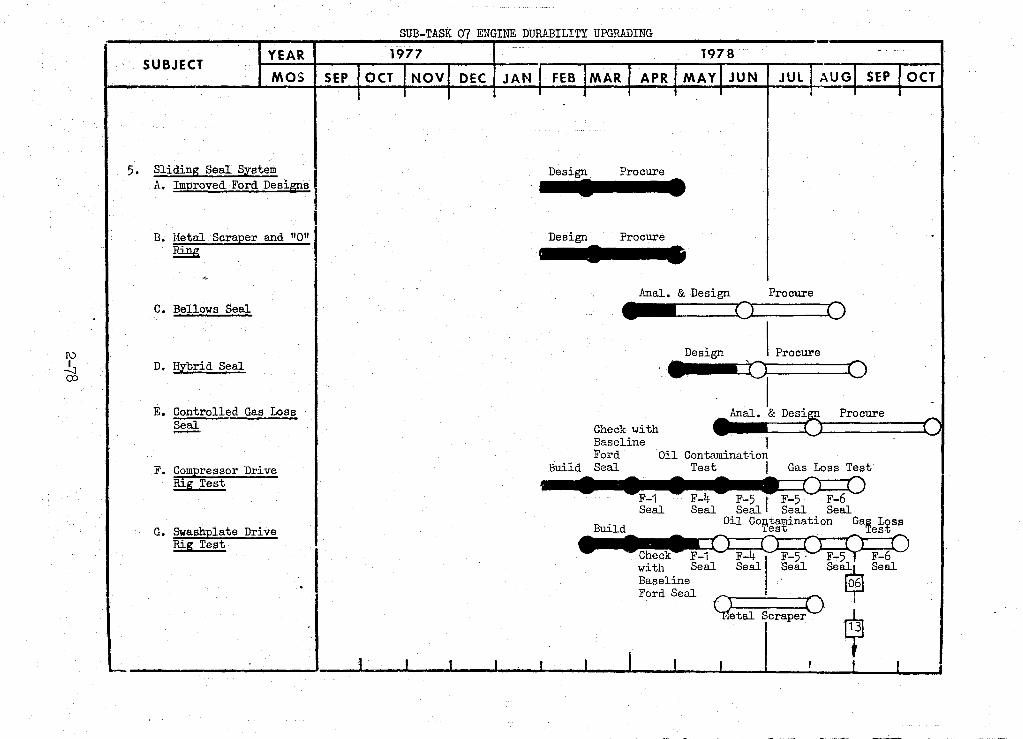
I\)
~ (»
SUBJECT YEAR
MaS
5. Sliding Seal System A. Improved Ford Designs
B. Metal Scraper and non Ring
C. Bellows Seal
D. Hybrid Seal
E. Controlled Gas Loss Seal
F. Compressor Drive Rig Test
G. SWashplate Drive Rig Test
SUB-TASK 07 ENGINE DURABILITY UPGRADING I
1977 1978
SEP JJ:>_~~ovl DEC JANJ FEBIMAR I APRIMAyl JUN JUL 1 AUGI SEP 10CT
Design Procure • • Design Procure .... -------- -~
Anal. & Design Procure
• C> 0
Design I Procure
• D 0 I
• Anal. & Desit)- Procure ........ Check with
'-'"
Build - --Check- F-1- F=4---=-C
1
F-~-- F-5 1 F-6
Baseline . 06
- with Seal Seal Seal seS Seal
Ford Seal '\ 0 j
~ Go'" rper ~
_. - -- --
ENGINE DURABILITY UPGRADING - SUB-TASK 07
Pressure drops were recorded on ten regenerators which were received from N. V. Philips. The data from the testing of these regenerators was transmitted to N. V. Philips for a theoretical analysis.
The Rollsack Seal Test Rig set-up was completed and testing was initiated on seal assemblies which were modified to include a check valve seal between the pumping ring and the rollsock. The purpose of this seal is to provide improved oil sealing during engine shut down. During engine running, the high pressure oil from the pumping rings will lift the check valve off its seat and flow past it to support the rollsock. During engine shut down, the pressure will reverse and force the seal ring between its seat and the shaft~ thus establishing a static seal.
Two sets of F-1 seals were run on the Compressor Drive Test Rig. Each set allowed large amounts of oil into the gas space in a relatively short time. It has been determined that the oil was getting past the scraper. The scraper, Parker type D-562, is designed for a .562 in. (14.3 mm) diameter rod. Parker's Technical Services Department stated that this scraper would work on the 15 mm rod presently used in testing. Investigation of the
~ scrapers removed from the first set of seals revealed that there was inadequate clearance between the 15 mm rod d5 and the scraper behind the scraper lid. This was preventing the lip from contaGting the rod properly.
Parts for the F-4 seals were delayed in shipping, so a Simrit oil scraper was installed in each F-1 seal cartridge and the oil contamination test was repeated. The scrapers are similar to those used by United Stirling of Sweden and are designed for use on 15 mm rods. The seals completed 100 hours of testing at 1000 RPM and 1100 psi mean pressure with no evidence of oil either jn the cylinder gas space or inside the cartridge on the dry side of the scraper.
When the parts for the F-4 seals arrived, testing of a set of F-4 seal cartridges began on the Compressor Drive Test Rig. These seals use Parker "Polypak" seals as oil scrapers. The first set of cartridges completed approximately 65 hours of testing at 1000 RPM and 800 psi mean pressure with no indication of oil in the gas space. A temporarJ loss of cooling water caused the gas space temperature to increase to 2400F. The water supply was restored and the temperature was reduced to 1600 F; however, within two hours a large quantity of oil was found in the gas space. Inspection revealed that both cap seals had failed and both Polj~ak scrapers had portions of their scraping edges melted. A second set of F-4 seals was installed in the rig and the test was repeated. One of the seals is using a solid ring instead of a cap seal to determine if the high wear and failure rates experienced
I\)
6:, o
Engine Durability Upgrading - Sub-task 07
with cap seals can be avoided. This set has completed 87 hours at 1000 RPM and 850 psi mean pressure with n~ indication of oil in the gas space. The seal cartridge with the solid ring seal develops a maximum pressure 10% below that of the cartridge with the cap seal. This is probably caused by greater gas leakage past the slip ring seal. To date, this has had no noticeable effect on the performance of the seal.
The Swashplate Drive Test Rig modifications are complete and the reworked parts have been received. The following changes were made:
a. The block holding the seal cartridges was welded for increased stiffness and to eliminate the gas leaks that developed during testing. The cartridge bores were also reground.
b. The cylinder bores were reground to eliminate piston scuf£ing.
c. Piston rings were added to the pistons to eliminate any pressure drop across the guide bushings. This will prevent excess friction on the guide bushings and will prevent the bushing from loosening.
Assembly of the rig is now complete.
International Packings Corporation, which is the United States distributor of "SIMRIT" seals, has been asked to quote on rod wipers similar to those used on the F-1 seals that will fit into the seal cartridge without modification.
The pumping rings failed to maintain pressure after 100 hours of running on the Rollsock Compressor Drive Test Rig. The rig was disassembled and the components are being checked.
The second pair of F-4 seals completed 100 hours of testing on the Compressor Drive Test Rig at 1000 RPM and 800 psi mean pressure. One seal assembly allowed no oil past the scraper either into the test cylinder or the seal cartridge. The other seal had a light film of oil inside the seal cartridge and possibly in the test cylinder. These seal assemblies differ in that one contained a piston ring type seal and the other contained a Philips cap seal.
A third pair of' F-4 seals also completed 100 hours of testing on the Compressor Drive Test Rig at 1000 RPM and 1000 psi mean pressure. Both seal assemblies were equipped with a Parker SCL seal. One of the SCL seals failed after 50 hours of testing and was replaced with a solid ring made of Rulon LD. At the end of the test, the
C3 t:::'.3 ~ ~J r:;::;n ~ Er.:) r:::J em o:::J C!..J EZ:J CJ ~ ~ o::J c::::3 E:::Zl ~ r:::!:l ~ ... ~
I\)
~ -l.
Engine Durability Upgrading - Sub-task 07
cylinder with the solid ring had no oil in either the cartridge or the cylinder; however, the Rulon ring was badly worn and had extruded into the clearance gap. The other seal had a slight film of oil on theSCL seal only. None was found inside the cylinder or cartridge.
Testing of the fourth set of F-4 seals has been initiated on the Compressor Drive Test Rig. These seals have a Rulon LD scraper similar in design to the Philips white metal scraper.
Pressure switches were installed on the gas, oil, and cooling water lines of the Compressor Drive Test Rig. The rig is now running 24 hours/day.
Shakedown of the Swashplate Drive Test Rig revealed excessive power consumption. At 600 RPM, with a mean pressure of 700 psi, 220 ft-Ibs of torque were required to drive the rig, and the gas temperatures were approximately 400oF. Some modifications were performed but affected the problem only slightly. Work on rectifj~ng this problem will continue.
Two sets of Leningrader seal rings with pressure balancing grooves in two locations have been fabricated. These will be compared to standard Leningrader seals for friction vs gas pressure and gas leakage vs gas pressure.
It was determined that a bellows type oil seal is not feasible for Stirling engine application due to stroke, frequency, and fatigue-life requirement and geometric constraint. .
An analysis was performed to determine the order of magnitude of the temperature gradient which exists along the piston rod, since a large gradient could possibly result in less effective sealing. Approximate modeling of the spatial heat generation, conduction, and rejection indicates that the expected temperature gradient is not acceptable. Measurement of the temperature along the rod will be attempted in the Sliding Seal Compressor Test Rig.
f\.)
~ f\.)
~ ~
RESPONSIVE SUPPORT - SUB-TASK 11
No official presentations were given during this reporting period. Therefore, responsive support was not required.
~ c:::::::::::::J !.~. ~ E::8 ~ ~ .. ~ t::::l Ij~W r::=:l r:=l ~ ~ ~ ~ =.I ~ 5r'l""M,
CONTRACT SUPPORT - SUB-TASK 12
Three Monthly Technical Progress Narrative Reports were written and distributed during this reporting period. .
(\)
~ VJ
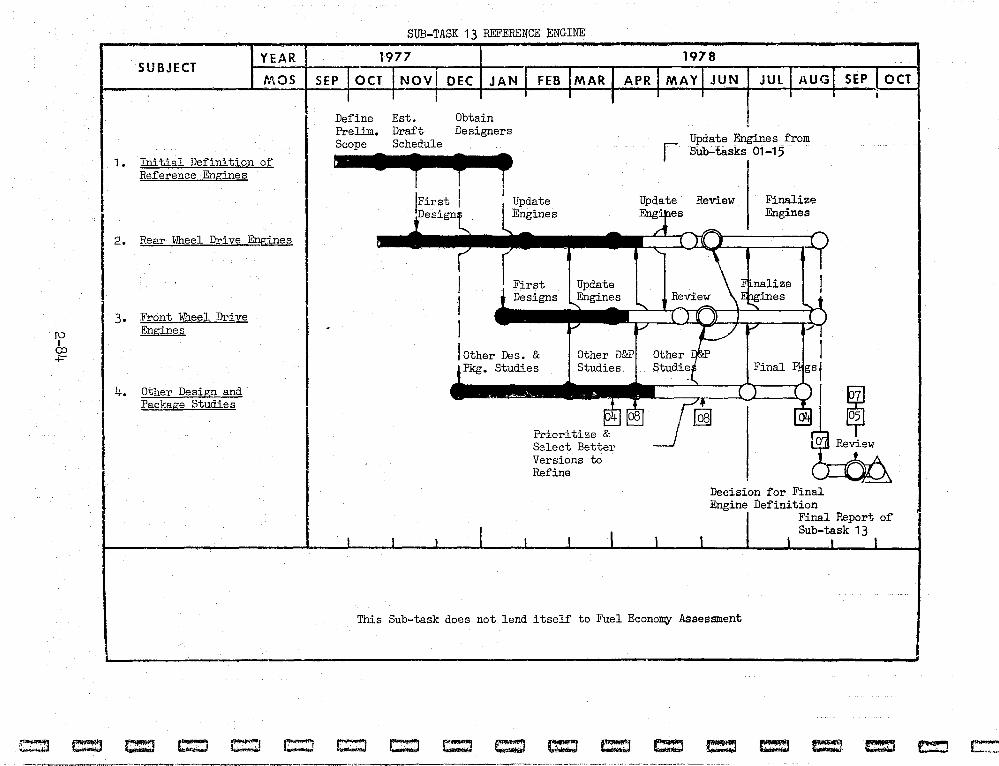
t::::Z1
SUB-TASK 13 REFERENCE ENGI11E
YEAR SUBJECT
1977 1978
NiOS I SEP Novi DEC I JAN JUl OCT
f\) I CO +""
t::!lj
1 • Initial De£inition o£ Re£erence Engines
2. Rear Wheel Drive Engines
3. Front Hheel Drive Engines
4. other Desigg and Package Studies
c:::.:l e::J t:::::I t::::'J .. ~--;-,~~-;:-:-"~-:----'~,..
De£ine Est. Obtain Prelim. Dra£t Designers Scope Schedule
First Designs
Update Engines
I Other Des. & Pkg. Studies
Prioritize Select Better Versions to Refine
r Update Engines £rom SUb-tasks 01-1$
I
Review Finalize Engines
I .~gsi
~l Decision £or Final Engine Definition
Final Report of Sub-task 13
This Sub-task does not lend itsel£ to Fuel Econo~ Assessment
c::::I c::::::J t:::l c.::l r:::o c:l r:::l c:l r=! !!:1. .c::t '."~ -.---- .. -~---... - ,,-~~~. ..' ~ --- --~--.--.-
e::J ~ ~,-
J\)
~ VI
REFERENCE ENGINE - SUB-TASK 13
A more det~iled version of a double crank engine is presently being laid out. Engine auxiliary mountings will be investigated in an effort to have more realistic engine installation studies.
A new swashplate engine layout was initiated which incorporates the" following changes over the current 4-215 design.
a. Crosshead modifications to reduce friction.
b. A pin connection between the rod ruld crosshead to eliminate bending moments in the rod.
c. Thinner swashplate.
d. Shorter engine (3 inches). R flJd On·-'t=
JAN If -117<f