development of year 2050 anthropogenic emissions inventory in support of future regional air quality...
TRANSCRIPT
Development of Year 2050 Anthropogenic Emissions Inventory in Support of Future Regional Air Quality Modeling
J. Woo, S. He, P. AmarNESCAUM
E. Tagaris, K. Liao, K. Manomaiphiboon, A. G. RussellGeorgia Institute of Technology
CMAS Conference, Oct, 2006, Chapel Hill, NC

Background and Objectives
* A part of “Global Climate Change Impacts on Regional Air Quaility over North America” modeling work
- In support of air quality modeling (GISS/MM5 and CMAQ-DDM) - Did not create new future energy/emissions scenarios * Develop 2050 EI - Target year : Year 2050, Annual - Format : SMOKE-ready - Sector : Anthropogenic only - Geographical domain : US/CAN/MEX
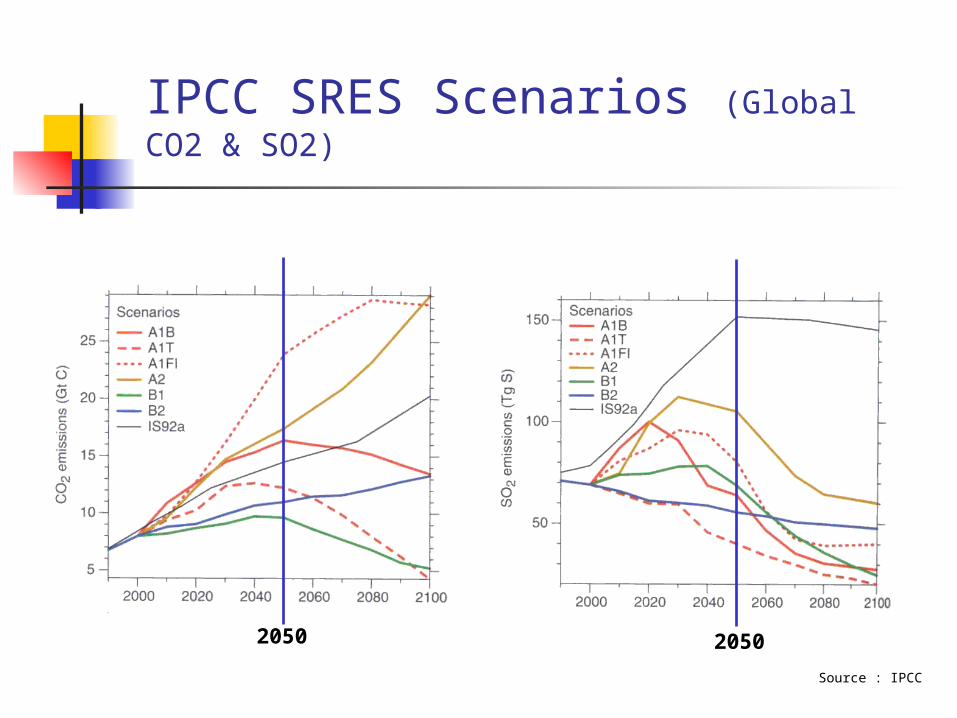
IPCC SRES Scenarios (Global CO2 & SO2)
2050 2050
Source : IPCC
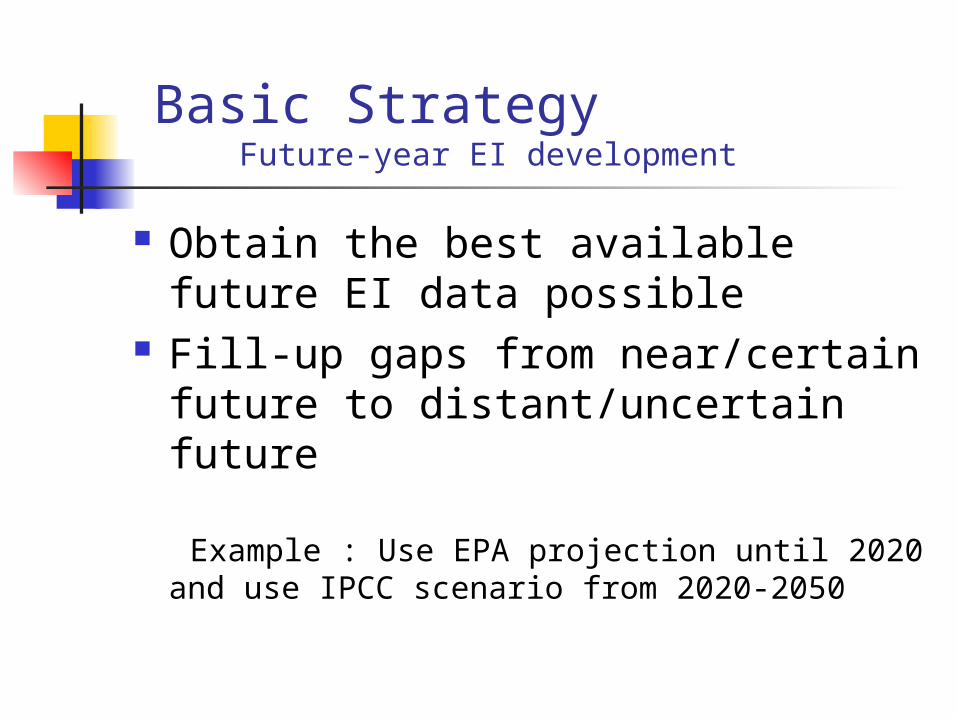
Basic Strategy Future-year EI development
Obtain the best available future EI data possible
Fill-up gaps from near/certain future to distant/uncertain future
Example : Use EPA projection until 2020 and
use IPCC scenario from 2020-2050
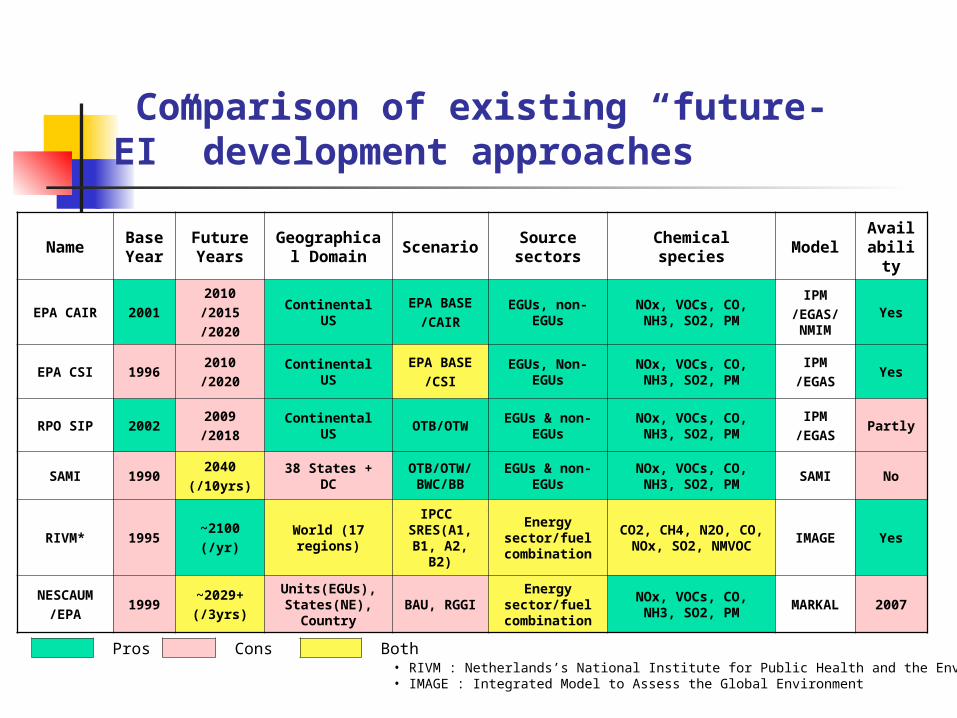
Comparison of existing “future-EI” development approaches
NameBase Year
Future Years
Geographical Domain
Scenario
Source sectors
Chemical species
ModelAvailabilit
y
EPA CAIR 20012010/2015/2020
Continental US
EPA BASE/CAIR
EGUs, non-EGUs
NOx, VOCs, CO, NH3, SO2, PM
IPM/EGAS/NMIM
Yes
EPA CSI 19962010/2020
Continental US
EPA BASE/CSI
EGUs, Non-EGUs
NOx, VOCs, CO, NH3, SO2, PM
IPM/EGAS
Yes
RPO SIP 20022009/2018
Continental US
OTB/OTWEGUs & non-
EGUsNOx, VOCs, CO, NH3, SO2, PM
IPM/EGAS
Partly
SAMI 19902040
(/10yrs)38 States +
DC
OTB/OTW/
BWC/BB
EGUs & non-EGUs
NOx, VOCs, CO, NH3, SO2, PM
SAMI No
RIVM* 1995~2100(/yr)
World (17 regions)
IPCC SRES(A1, B1, A2,
B2)
Energy sector/fuel
combination
CO2, CH4, N2O, CO, NOx, SO2, NMVOC
IMAGE Yes
NESCAUM/EPA
1999~2029+(/3yrs)
Units(EGUs), States(NE),
Country
BAU, RGGI
Energy sector/fuel
combination
NOx, VOCs, CO, NH3, SO2, PM
MARKAL
2007
Pros Cons Both• RIVM : Netherlands’s National Institute for Public Health and the Environment • IMAGE : Integrated Model to Assess the Global Environment
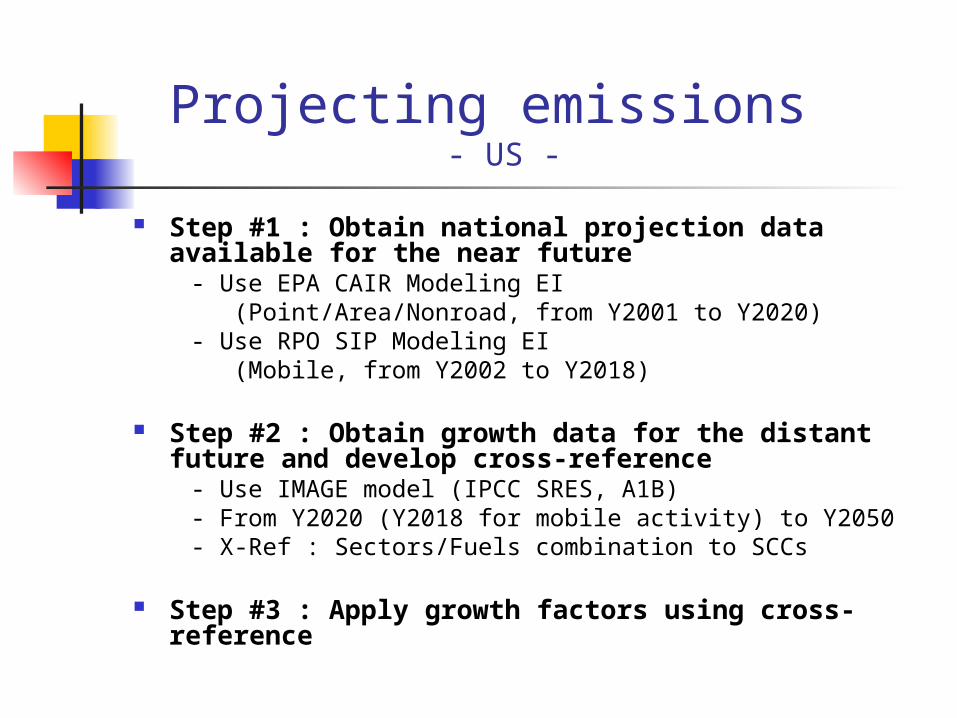
Projecting emissions - US -
Step #1 : Obtain national projection data available for the near future
- Use EPA CAIR Modeling EI (Point/Area/Nonroad, from Y2001 to Y2020) - Use RPO SIP Modeling EI (Mobile, from Y2002 to Y2018)
Step #2 : Obtain growth data for the distant future and develop cross-reference
- Use IMAGE model (IPCC SRES, A1B) - From Y2020 (Y2018 for mobile activity) to Y2050 - X-Ref : Sectors/Fuels combination to SCCs
Step #3 : Apply growth factors using cross-reference

Projecting emissions - CANADA/MEXICO -
Step #1 : Obtain national projection data available for the near future or update base year inventory
- Use Y2020 Environmental Canada Future EI (Area/Mobile) - Use Y2002 Point source inventory (NYS DEC) scaled with Y2000
by-state point source summary from Environment Canada - Update base year Mexico inventory using Mexico NEI for 6 US-
Mexico Border states
Step #2 : Obtain simple growth data for the distant future and apply them
- Use IMAGE model (IPCC SRES, A1B) - From Y2020 to Y2050 (CAN, Area/Mobile) - From Y2000 to Y2050 (CAN, Point) - From Y1999 to Y2050 (MEX, All)

Developing cross-references (CAIR and IMAGE)
no SCC CO NOx VOC NH3 SO2 PM10 PM2_5 sec fuel cntry SCC_Description407 10300101 2.08811 2.08811 2.08811 2.08811 0.522028 0.868927 0.868927 COM COAL USA External Combustion Boilers_Commercial/Institutional_Anthracite Coal_Pulverized Coal 408 10300102 2.08811 2.08811 2.08811 2.08811 0.522028 0.868927 0.868927 COM COAL USA External Combustion Boilers_Commercial/Institutional_Anthracite Coal_Traveling Grate (Overfeed) Stoker 409 10300103 2.08811 2.08811 2.08811 2.08811 0.522028 0.868927 0.868927 COM COAL USA External Combustion Boilers_Commercial/Institutional_Anthracite Coal_Hand-fired 410 10300203 2.08811 2.08811 2.08811 2.08811 0.522028 0.868927 0.868927 COM COAL USA External Combustion Boilers_Commercial/Institutional_Bituminous/Subbituminous Coal_Cyclone Furnace (Bituminous Coal) 411 10300205 2.08811 2.08811 2.08811 2.08811 0.522028 0.868927 0.868927 COM COAL USA External Combustion Boilers_Commercial/Institutional_Bituminous/Subbituminous Coal_Pulverized Coal: Wet Bottom (Bituminous Coal) 412 10300206 2.08811 2.08811 2.08811 2.08811 0.522028 0.868927 0.868927 COM COAL USA External Combustion Boilers_Commercial/Institutional_Bituminous/Subbituminous Coal_Pulverized Coal: Dry Bottom (Bituminous Coal) 413 10300207 2.08811 2.08811 2.08811 2.08811 0.522028 0.868927 0.868927 COM COAL USA External Combustion Boilers_Commercial/Institutional_Bituminous/Subbituminous Coal_Overfeed Stoker (Bituminous Coal) 414 10300208 2.08811 2.08811 2.08811 2.08811 0.522028 0.868927 0.868927 COM COAL USA External Combustion Boilers_Commercial/Institutional_Bituminous/Subbituminous Coal_Underfeed Stoker (Bituminous Coal) 415 10300209 2.08811 2.08811 2.08811 2.08811 0.522028 0.868927 0.868927 COM COAL USA External Combustion Boilers_Commercial/Institutional_Bituminous/Subbituminous Coal_Spreader Stoker (Bituminous Coal) 416 10300214 2.08811 2.08811 2.08811 2.08811 0.522028 0.868927 0.868927 COM COAL USA External Combustion Boilers_Commercial/Institutional_Bituminous/Subbituminous Coal_Hand-fired (Bituminous Coal) 417 10300216 2.08811 2.08811 2.08811 2.08811 0.522028 0.868927 0.868927 COM COAL USA External Combustion Boilers_Commercial/Institutional_Bituminous/Subbituminous Coal_Pulverized Coal: Dry Bottom (Tangential) (Bituminous Coal) 418 10300217 2.08811 2.08811 2.08811 2.08811 0.522028 0.868927 0.868927 COM COAL USA External Combustion Boilers_Commercial/Institutional_Bituminous/Subbituminous Coal_Atmospheric Fluidized Bed Combustion: Bubbling Bed (Bituminous Coal) 419 10300218 2.08811 2.08811 2.08811 2.08811 0.522028 0.868927 0.868927 COM COAL USA External Combustion Boilers_Commercial/Institutional_Bituminous/Subbituminous Coal_Atmospheric Fluidized Bed Combustion: Circulating Bed (Bitum. Coal) 420 10300222 2.08811 2.08811 2.08811 2.08811 0.522028 0.868927 0.868927 COM COAL USA External Combustion Boilers_Commercial/Institutional_Bituminous/Subbituminous Coal_Pulverized Coal: Dry Bottom (Subbituminous Coal) 421 10300223 2.08811 2.08811 2.08811 2.08811 0.522028 0.868927 0.868927 COM COAL USA External Combustion Boilers_Commercial/Institutional_Bituminous/Subbituminous Coal_Cyclone Furnace (Subbituminous Coal) 422 10300224 2.08811 2.08811 2.08811 2.08811 0.522028 0.868927 0.868927 COM COAL USA External Combustion Boilers_Commercial/Institutional_Bituminous/Subbituminous Coal_Spreader Stoker (Subbituminous Coal) 423 10300225 2.08811 2.08811 2.08811 2.08811 0.522028 0.868927 0.868927 COM COAL USA External Combustion Boilers_Commercial/Institutional_Bituminous/Subbituminous Coal_Traveling Grate (Overfeed) Stoker (Subbituminous Coal) 424 10300226 2.08811 2.08811 2.08811 2.08811 0.522028 0.868927 0.868927 COM COAL USA External Combustion Boilers_Commercial/Institutional_Bituminous/Subbituminous Coal_Pulverized Coal: Dry Bottom Tangential (Subbituminous Coal) 425 10300309 2.08811 2.08811 2.08811 2.08811 0.522028 0.868927 0.868927 COM COAL USA External Combustion Boilers_Commercial/Institutional_Lignite_Spreader Stoker 426 10500202 2.08811 2.08811 2.08811 2.08811 0.522028 0.868927 0.868927 COM COAL USA External Combustion Boilers_Space Heaters_Commercial/Institutional_Coal ** 427 2103001000 2.08811 2.08811 2.08811 2.08811 0.522028 0.868927 0.868927 COM COAL USA Stationary Source Fuel Combustion_Commercial/Institutional_Anthracite Coal_Total: All Boiler Types 428 2103002000 2.08811 2.08811 2.08811 2.08811 0.522028 0.868927 0.868927 COM COAL USA Stationary Source Fuel Combustion_Commercial/Institutional_Bituminous/Subbituminous Coal_Total: All Boiler Types 539 10300601 0.55543 0.96362 0.55543 0.96362 1.03203 1.123573 1.123573 COM GAS USA External Combustion Boilers_Commercial/Institutional_Natural Gas_> 100 Million Btu/hr 540 10300602 0.55543 0.96362 0.55543 0.96362 1.03203 1.123573 1.123573 COM GAS USA External Combustion Boilers_Commercial/Institutional_Natural Gas_10-100 Million Btu/hr
5159 SCCs
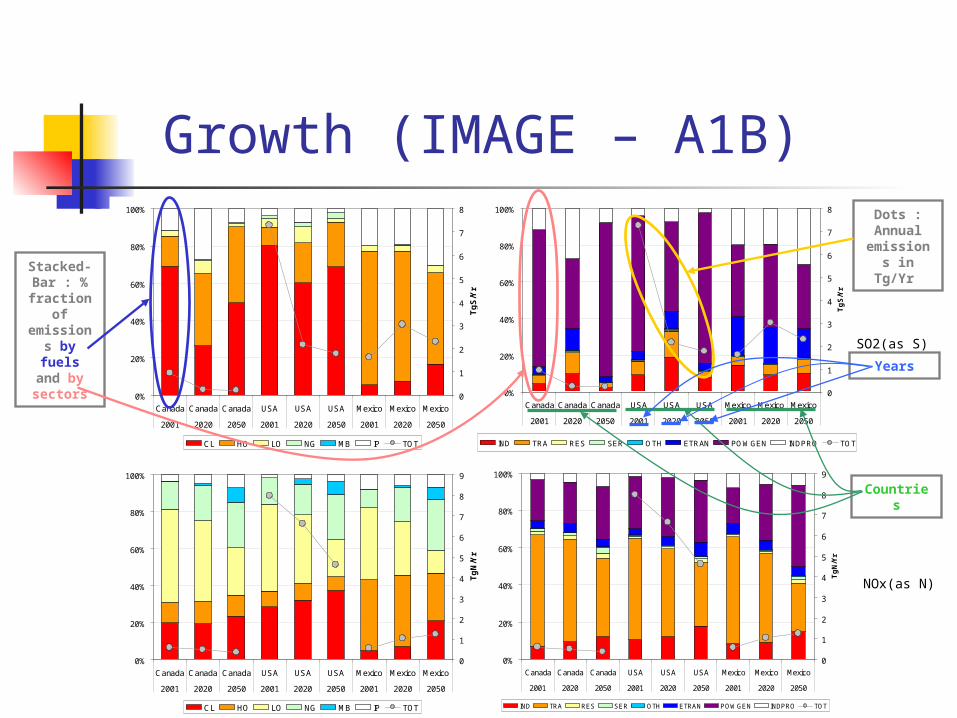
Growth (IMAGE – A1B)
SO2(as S)
0%
20%
40%
60%
80%
100%
Canada Canada Canada USA USA USA Mexico Mexico Mexico
2001 2020 2050 2001 2020 2050 2001 2020 2050
0
1
2
3
4
5
6
7
8
Tg
S/Y
r
CL HO LO NG MB IP TOT
0%
20%
40%
60%
80%
100%
Canada Canada Canada USA USA USA Mexico Mexico Mexico
2001 2020 2050 2001 2020 2050 2001 2020 2050
0
1
2
3
4
5
6
7
8
Tg
S/Y
r
IND TRA RES SER OTH ETRAN POWGEN INDPRO TOT
NOx(as N)
0%
20%
40%
60%
80%
100%
Canada Canada Canada USA USA USA Mexico Mexico Mexico
2001 2020 2050 2001 2020 2050 2001 2020 2050
0
1
2
3
4
5
6
7
8
9T
gN
/Yr
CL HO LO NG MB IP TOT
0%
20%
40%
60%
80%
100%
Canada Canada Canada USA USA USA Mexico Mexico Mexico
2001 2020 2050 2001 2020 2050 2001 2020 2050
0
1
2
3
4
5
6
7
8
9
Tg
N/Y
r
IND TRA RES SER OTH ETRAN POWGEN INDPRO TOT
Stacked-Bar : % fraction
of emission
s by fuels and
by sectors
Dots : Annual
emissions in Tg/Yr
Countries
Years

2020
0
4
8
12
16
20
2001 2020 2050
Mill
ion
s TP
Y
Pnt Area Nonroad Onroad
Spatial Distribution of US Emissions (SO2)
2001
2050
Bkgrnd Map : State-level
annual emission
s
Pie Chart : State-level emissions fraction by
source types

Spatial Distribution of US Emissions (NOx)
2001
2050
2020
0
5
10
15
20
25
2001 2020 2050
Mill
ion
s TP
Y
Pnt Area Nonroad Onroad

Future Emissions (CANADA)
-
2
4
6
8
10
12
14
CO NOX VOC NH3 SO2 PM10 PM2_5
Mill
ion
s T
PY
CAN00_Pt CAN00_Ar CAN00_Nr CAN00_Mb
-
2
4
6
8
10
12
14
CO NOX VOC NH3 SO2 PM10 PM2_5
Mill
ions
TP
Y
CAN50_Pt CAN50_Ar CAN50_Nr CAN50_Mb
2000
2050

Future Emissions (Mexico)
-
1
2
3
4
5
6
CO NOX VOC NH3 SO2 PM10 PM2_5
Mill
ion
s T
PY
Mex1999_Pt Mex1999_Ar
-
1
2
3
4
5
6
CO NOX VOC NH3 SO2 PM10 PM2_5
Mill
ion
s T
PY
MEX2050_Pt MEX2050_Ar
1999
2050
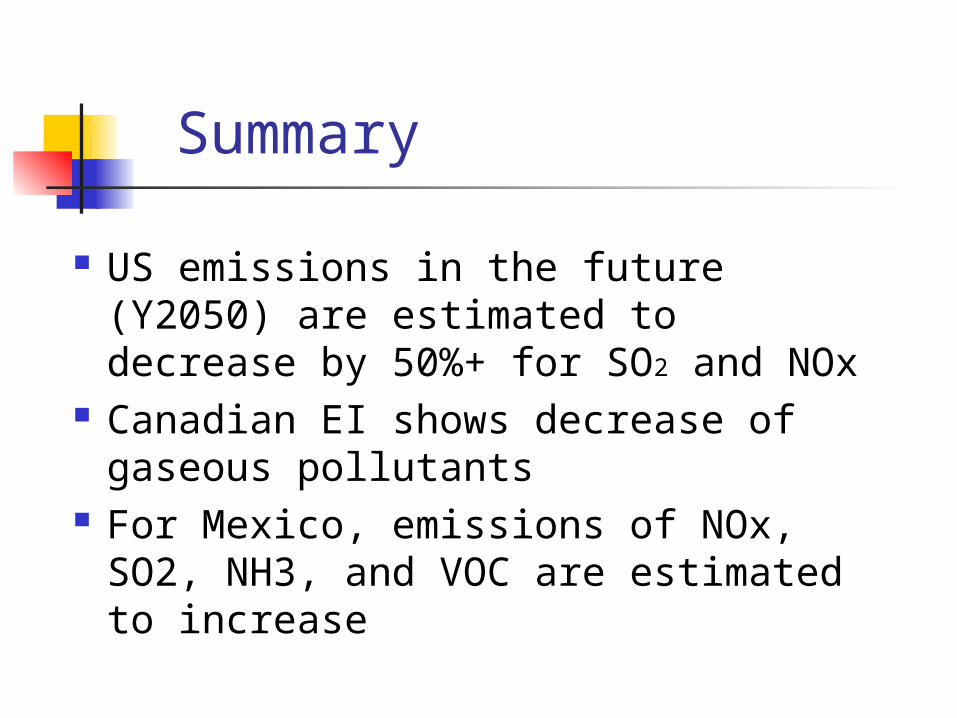
Summary
US emissions in the future (Y2050) are estimated to decrease by 50%+ for SO2 and NOx
Canadian EI shows decrease of gaseous pollutants
For Mexico, emissions of NOx, SO2, NH3, and VOC are estimated to increase
On-going work & Acknowledgement
Air quality modeling using CMAQ-DDM for three cases
- Base year emissions with base year meteorology - Base year emissions with future year (2050) meteorology - future year (2050) emissions with future year (2050) meteorology
Dr. Efthimios Tagaris will present AQM effort tomorrow
This study has been financially supported by the US EPA under Grant No. R830960

Near Future EI (EPA CAIR)
Base Case - Current controls except CAIR Control Case (Clean Air Interstate Rule)* - The same as base case except for EGUs Available for Y2001, Y2010, Y2015, Y2020 Based on 1999 NEI Pollutants : NOx, CO, NMVOC, SO2, NH3, PM10, PM2.5 Available in SMOKE/IDA format
* CAIR region : AL, AR, CT, DE, DC, FL,GA, IL, IN, IA, KY, LA, MD, MA, MI, MN, MS, MO, NJ, NY, NC, OH, PA, SC, TN, TX,VA, WV, WI
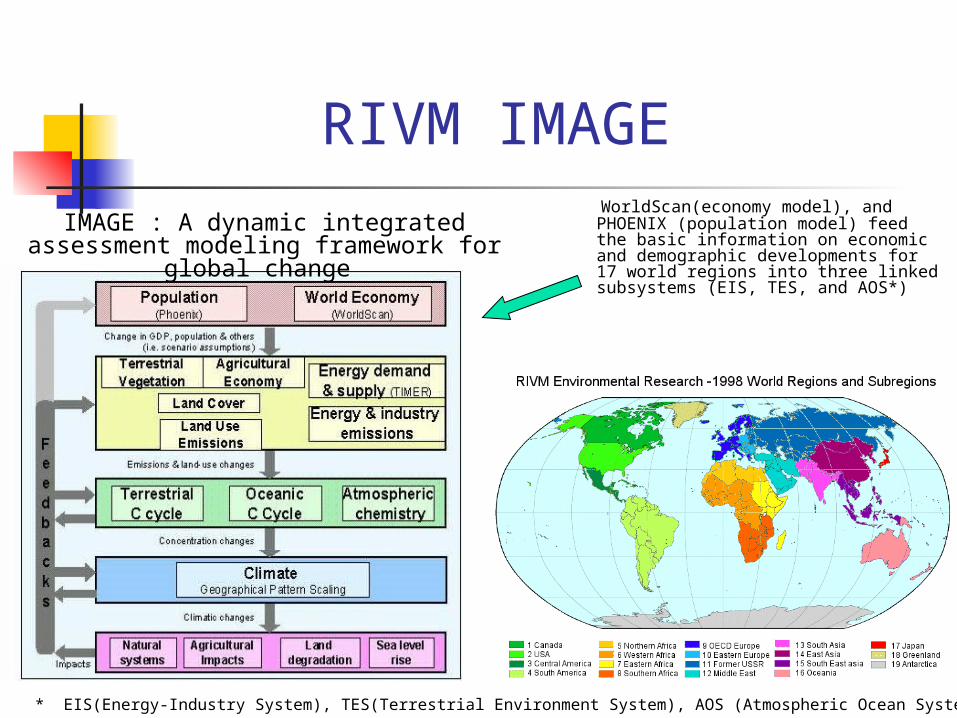
RIVM IMAGE WorldScan(economy model), and PHOENIX
(population model) feed the basic information on economic and demographic developments for 17 world regions into three linked subsystems (EIS, TES, and AOS*)
* EIS(Energy-Industry System), TES(Terrestrial Environment System), AOS (Atmospheric Ocean System)
IMAGE : A dynamic integrated assessment modeling framework for global change

0%
20%
40%
60%
80%
100%
Canada Canada Canada USA USA USA Mexico Mexico Mexico
2001 2020 2050 2001 2020 2050 2001 2020 2050
0
2
4
6
8
10
12
14
16
18
20
Tg
NM
VO
C/Y
r
IND TRA RES SER OTHETRAN POWGEN LOSS INDPRO TOT
Growth (IMAGE – A1B)
CO(as C)
NMVOC
0%
20%
40%
60%
80%
100%
Canada Canada Canada USA USA USA Mexico Mexico Mexico
2001 2020 2050 2001 2020 2050 2001 2020 2050
0
5
10
15
20
25
30
Tg
C/Y
r
CL HO LO NG MB IP TOT
0%
20%
40%
60%
80%
100%
Canada Canada Canada USA USA USA Mexico Mexico Mexico
2001 2020 2050 2001 2020 2050 2001 2020 2050
0
5
10
15
20
25
30
Tg
C/Y
r
IND TRA RES SER OTH ETRAN POWGEN INDPRO TOT
0%
20%
40%
60%
80%
100%
Canada Canada Canada USA USA USA Mexico Mexico Mexico
2001 2020 2050 2001 2020 2050 2001 2020 2050
0
2
4
6
8
10
12
14
16
18
20
Tg
NM
VO
C/Y
r
CL HO LO NG MB IP TOT

Growth (IMAGE – A1B)
Agricultural Production
BC+EC -Streets et al. (2004)
0%
20%
40%
60%
80%
100%
Canada Canada Canada USA USA USA Mexico Mexico Mexico
2000 2020 2050 2000 2020 2050 2000 2020 2050
0
300
600
900
1200
1500
1800
2100
2400
2700
Tg
/yr
Animal FdCrop FlCrop Pasture Total
0%
20%
40%
60%
80%
100%
Canada Canada Canada USA USA USA Mexico Mexico Mexico
1996 2030 2050 1996 2030 2050 1996 2030 2050
0
200
400
600
800
1000
Gg
/yr
IND TRA RES POW CropBrn Tot
Surrogates for NH3 for OTH sector
Surrogates for PM species

Spatial Distribution of US Emissions (NMVOC)
2001 2020
2050
0
4
8
12
16
20
2001 2020 2050
Mill
ion
s TP
Y
Pnt Area Nonroad Onroad
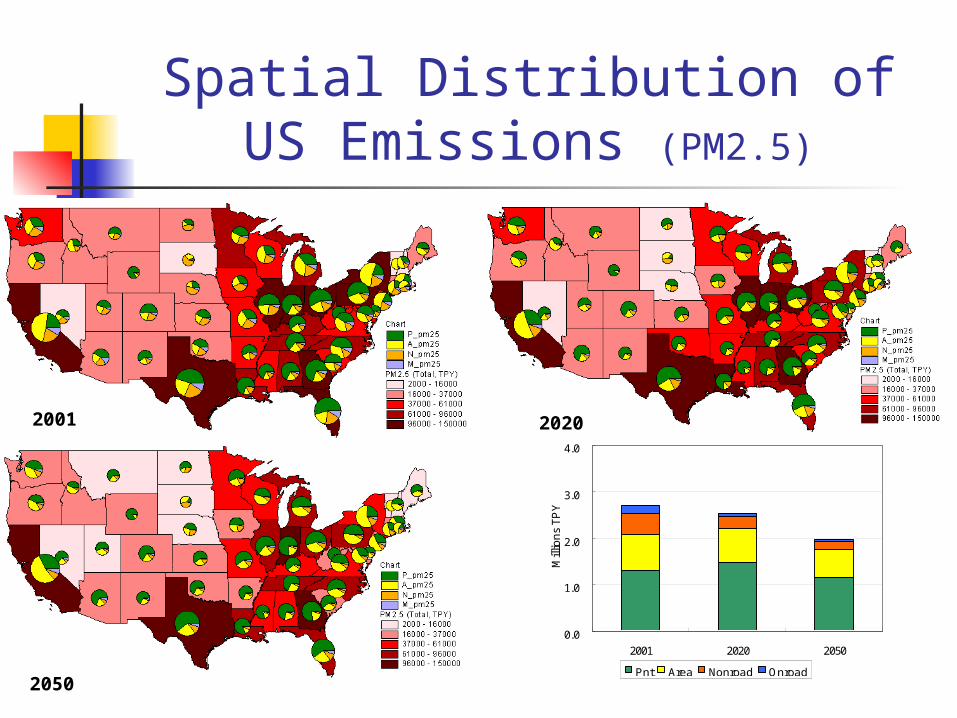
Spatial Distribution of US Emissions (PM2.5)
2001 2020
2050
0.0
1.0
2.0
3.0
4.0
2001 2020 2050
Mill
ion
s TP
Y
Pnt Area Nonroad Onroad
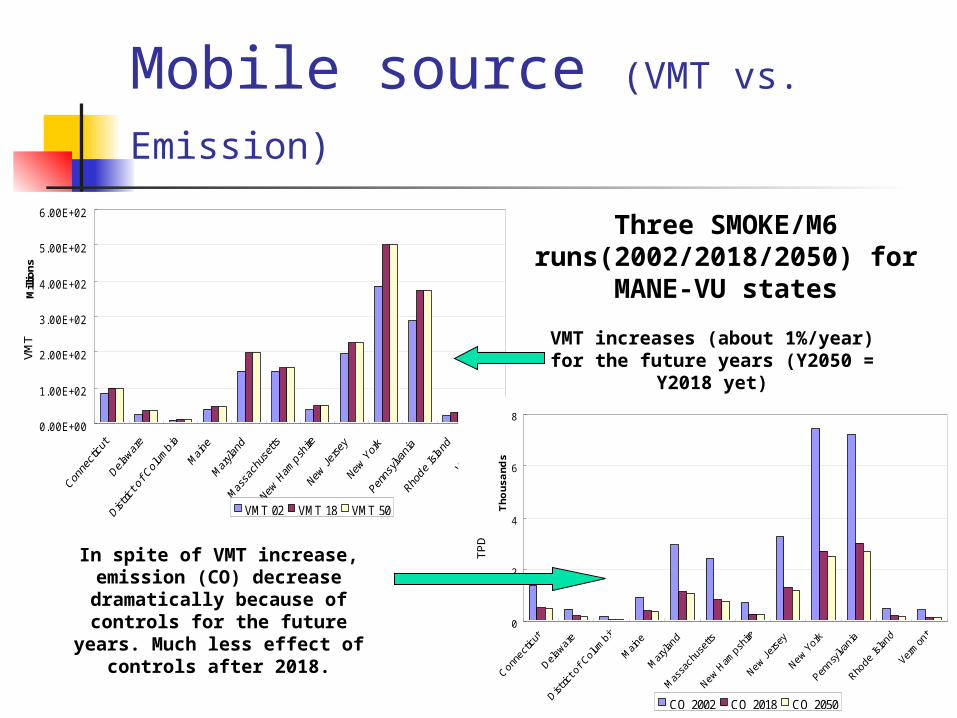
Mobile source (VMT vs. Emission)
0.00E+00
1.00E+02
2.00E+02
3.00E+02
4.00E+02
5.00E+02
6.00E+02
Mill
ions
VMT
VMT_02 VMT_18 VMT_50
VMT increases (about 1%/year) for the future years (Y2050 =
Y2018 yet)
In spite of VMT increase, emission (CO) decrease dramatically because of
controls for the future years. Much less effect of controls
after 2018.
0
2
4
6
8
Tho
usand
s
TPD
CO_2002 CO_2018 CO_2050
Three SMOKE/M6 runs(2002/2018/2050) for
MANE-VU states