development of the optimal charge and discharge control
TRANSCRIPT
55JR EAST Technical Review-No.37-2017
Special edition paper
In 2007, JR East put a Kiha E200 diesel hybrid train (hereinafter, “hybrid train”), into commercial operation on the Koumi Line.1) Since then, we further introduced the series HB-E300 (Nagano, Aomori, and Akita areas) and series HB-E210 (Sendai area), which have contributed to reduction of environmental load. The effects include approx. 10% reduction of fuel consumption, reduction of nitrogen oxide (NOx) and particulate matter (PM) emissions, and engine noise reduction by employing an engine start-stop system at stations.
At the introduction of Kiha E200, we estimated life of the lithium-ion batteries (hereinafter, “storage batteries”) installed to the hybrid railcars to be eight years or longer based on past test results. However, in detailed investigation of the storage battery modules of series HB-E300 railcars that had run more than four years since their operation start, internal resistance of some storage batteries was found to have risen faster than expected (i.e. they deteriorated). It seemed that the difference of operation patterns between Kiha E200 and series HB-E300 affected deterioration of storage batteries, so we planned to carry out analysis of factors that could shorten storage battery life and to develop a hybrid system control method suitable to individual operation patterns.
This paper will report on the results of evaluation of the effect that different operation patterns have on storage battery life based on the data collected using actual trains. It will also introduce the developed optimal charge and discharge control method where energy saving can be secured and also storage batteries receive less load.
2. Operation Patterns of Hybrid Railcars
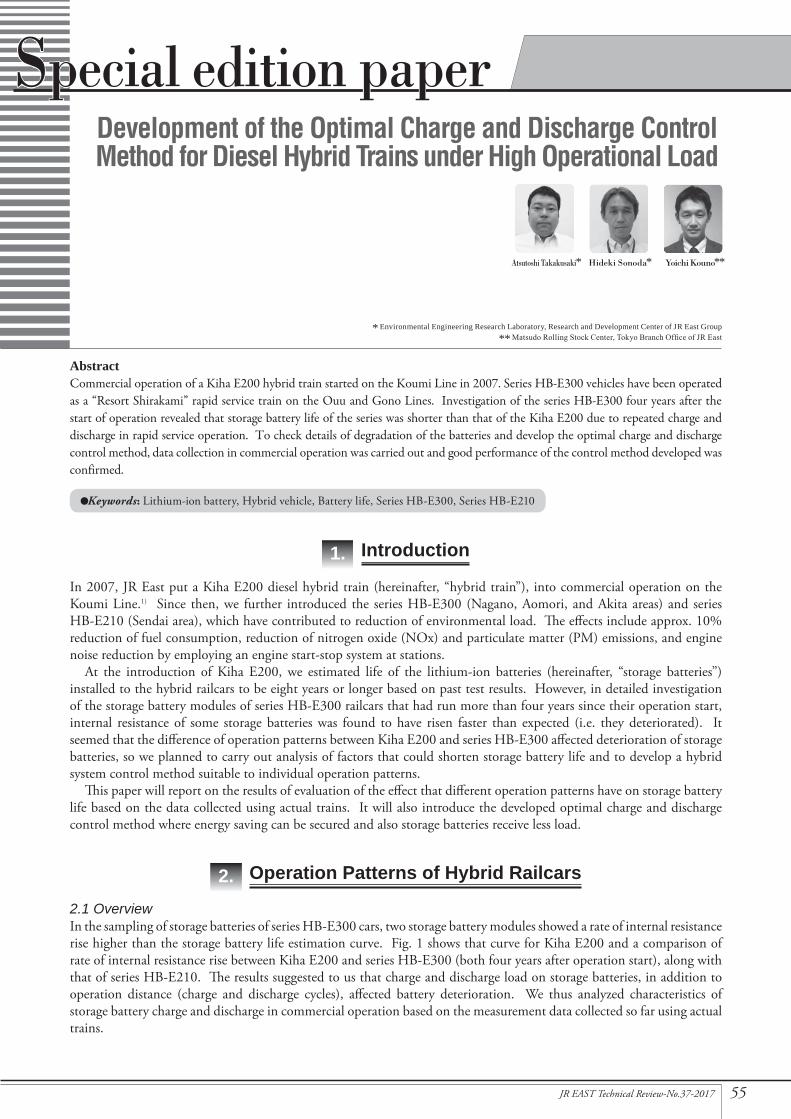
2.1 OverviewIn the sampling of storage batteries of series HB-E300 cars, two storage battery modules showed a rate of internal resistance rise higher than the storage battery life estimation curve. Fig. 1 shows that curve for Kiha E200 and a comparison of rate of internal resistance rise between Kiha E200 and series HB-E300 (both four years after operation start), along with that of series HB-E210. The results suggested to us that charge and discharge load on storage batteries, in addition to operation distance (charge and discharge cycles), affected battery deterioration. We thus analyzed characteristics of storage battery charge and discharge in commercial operation based on the measurement data collected so far using actual trains.
1. Introduction
Development of the Optimal Charge and Discharge Control Method for Diesel Hybrid Trains under High Operational Load
* Environmental Engineering Research Laboratory, Research and Development Center of JR East Group
** Matsudo Rolling Stock Center, Tokyo Branch Office of JR East
Commercial operation of a Kiha E200 hybrid train started on the Koumi Line in 2007. Series HB-E300 vehicles have been operated as a “Resort Shirakami” rapid service train on the Ouu and Gono Lines. Investigation of the series HB-E300 four years after the start of operation revealed that storage battery life of the series was shorter than that of the Kiha E200 due to repeated charge and discharge in rapid service operation. To check details of degradation of the batteries and develop the optimal charge and discharge control method, data collection in commercial operation was carried out and good performance of the control method developed was confirmed.
Abstract
Yoichi Kouno**Hideki Sonoda*
•Keywords: Lithium-ion battery, Hybrid vehicle, Battery life, Series HB-E300, Series HB-E210
Atsutoshi Takakusaki*
56 JR EAST Technical Review-No.37-2017
Special edition paper
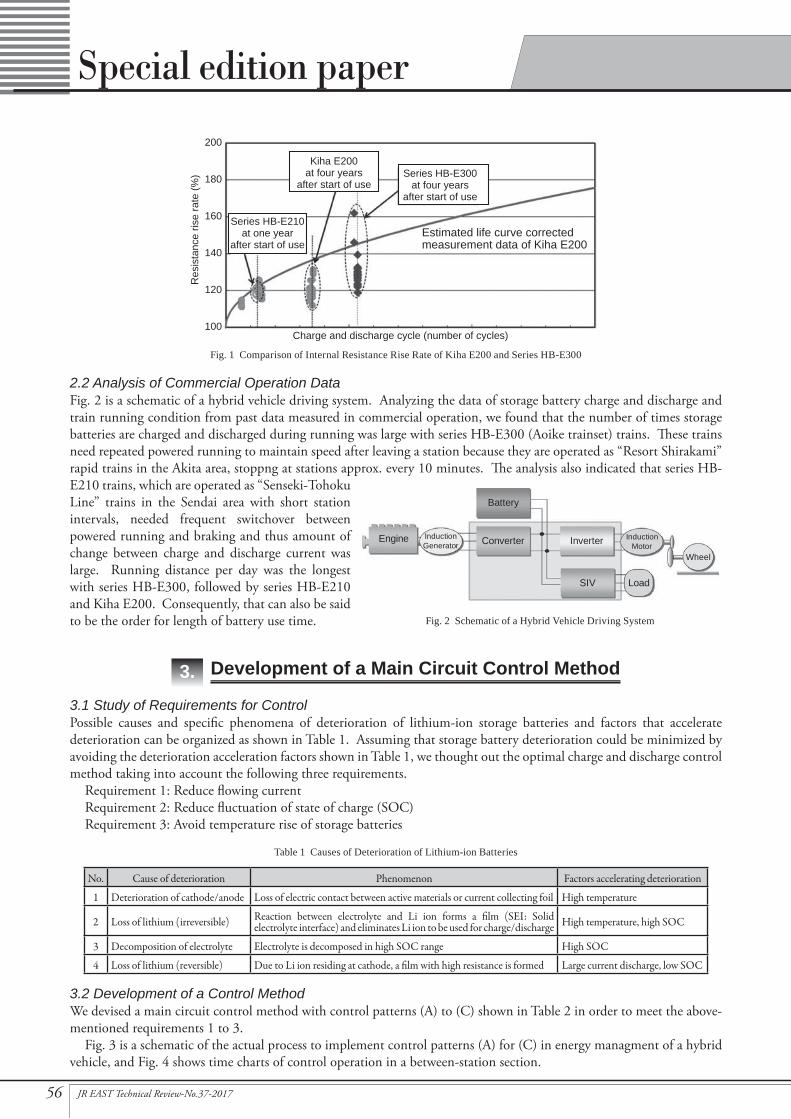
2.2 Analysis of Commercial Operation DataFig. 2 is a schematic of a hybrid vehicle driving system. Analyzing the data of storage battery charge and discharge and train running condition from past data measured in commercial operation, we found that the number of times storage batteries are charged and discharged during running was large with series HB-E300 (Aoike trainset) trains. These trains need repeated powered running to maintain speed after leaving a station because they are operated as “Resort Shirakami” rapid trains in the Akita area, stoppng at stations approx. every 10 minutes. The analysis also indicated that series HB-E210 trains, which are operated as “Senseki-Tohoku Line” trains in the Sendai area with short station intervals, needed frequent switchover between powered running and braking and thus amount of change between charge and discharge current was large. Running distance per day was the longest with series HB-E300, followed by series HB-E210 and Kiha E200. Consequently, that can also be said to be the order for length of battery use time.
3. Development of a Main Circuit Control Method
3.1 Study of Requirements for ControlPossible causes and specific phenomena of deterioration of lithium-ion storage batteries and factors that accelerate deterioration can be organized as shown in Table 1. Assuming that storage battery deterioration could be minimized by avoiding the deterioration acceleration factors shown in Table 1, we thought out the optimal charge and discharge control method taking into account the following three requirements.
Requirement 1: Reduce flowing currentRequirement 2: Reduce fluctuation of state of charge (SOC)Requirement 3: Avoid temperature rise of storage batteries
3.2 Development of a Control MethodWe devised a main circuit control method with control patterns (A) to (C) shown in Table 2 in order to meet the above-mentioned requirements 1 to 3.
Fig. 3 is a schematic of the actual process to implement control patterns (A) for (C) in energy managment of a hybrid vehicle, and Fig. 4 shows time charts of control operation in a between-station section.
Charge and discharge cycle (number of cycles)
200
180
160
140
120
100
Res
ista
nce
rise
rate
(%)
Series HB-E210at one year
after start of use
Kiha E200at four years
after start of use
Estimated life curve correctedmeasurement data of Kiha E200
Series HB-E300at four years
after start of use
No. Cause of deterioration Phenomenon Factors accelerating deterioration
1 Deterioration of cathode/anode Loss of electric contact between active materials or current collecting foil High temperature
2 Loss of lithium (irreversible) Reaction between electrolyte and Li ion forms a film (SEI: Solid electrolyte interface) and eliminates Li ion to be used for charge/discharge High temperature, high SOC
3 Decomposition of electrolyte Electrolyte is decomposed in high SOC range High SOC
4 Loss of lithium (reversible) Due to Li ion residing at cathode, a film with high resistance is formed Large current discharge, low SOC
Table 1 Causes of Deterioration of Lithium-ion Batteries
Fig. 1 Comparison of Internal Resistance Rise Rate of Kiha E200 and Series HB-E300
InverterInductionGenerator ConverterEngine
Wheel
LoadSIV
InductionMotor
Battery
Fig. 2 Schematic of a Hybrid Vehicle Driving System

57JR EAST Technical Review-No.37-2017
Special edition paper
In control pattern (A), engine power generation amount is determined according to power consumption of inverters and static inverters (SIV). The aim is to control the maximum storage battery charge and discharge current that is the difference between power consumption and power generation and to reduce SOC fluctuation as well.
In control pattern (B), engine start speed is lowered and engine power generation starts earlier at leaving a station when using a start-stop system. The aim is to control the maximum storage battery charge and discharge current.
In control pattern (C), SOC at leaving a station is reduced. The aim is to shift to a lower SOC range as a whole in combination with control pattern (A).
3.3 Verification by Simulated OperationWe carried out operation simulation tests to evaluate the effects of the control patterns. The effects were evaluated in actual train conditions for and with operation that reproduces train movement curves of a series HB-E300 as a “Resort Shirakami” rapid train (round trip operation between Akita and Hirosaki) and a series HB-E210 as a Senseki-Tohoku Line train (round trip operation between Sendai and Ishinomaki).
Fig. 5 and Fig. 6 show the verification results of the effect of individual control patterns in the operation simulation tests. The evaluation indices were defined as follows.
(1) Charge and discharge I2*t value (to evaluate heating of storage battery cell): 30 sec. integration value of the square of charge and discharge current (per storage battery)
(2) Integrated current value (to evaluate charge and discharge energy amount): Time-integrated value of charge and discharge current (per storage battery)
Trad
ition
al c
ontro
lC
ontro
l pat
tern
(A)
Con
trol p
atte
rn (B
)C
ontro
l pat
tern
(C)
Peak I2t value Average I2t value Integratedcurrent value Peak I2t value Average I2t value Integrated
current value
Rat
io to
trad
ition
al c
ontro
l [%
]
Rat
io to
trad
ition
al c
ontro
l [%
]
Trad
ition
al c
ontro
lC
ontro
l pat
tern
(A)
Con
trol p
atte
rn (B
)C
ontro
l pat
tern
(C)
Control pattern Outline Applicability Requirement 1 Requirement 2 Requirement 3
Control pattern (A)
Minimize deviation between VVVF + SIV power consumption and engine power generation
Applicable to train operation where trains stop at fewer station and keep running by switching powered running: Rapid trains
Control pattern (B)
Reduce start-stop system upper limit speed when moving from stopped to powered running
Applicable to train operation where trains stop at many stations and often run with start-stop system: Local trains
Control pattern (C)
Change charge/discharge range where SOC is maintained while stopped at stations
Applicable to train operation where trains stop for a long time before turning back or park with their systems kept on: Local trains
Table 2 Main Circuit Control Patterns to Reduce Load on Storage Batteries
Vehicle speed (rotor frequency)
Charge limit
Discharge limit
Usual charge/discharge range
Limit of charge margin
Δ
Limit of discharge marginControl
pattern (B)Engine start speedreduced by 5 km/h
Controlpattern (A)
Power generation controlaccording to inverterpower consumption
Controlpattern (C)
Limit of charge margin5% reduction
Speed - SOC track
4) while stopped SOC 45 - 55%
Charge/dischargecurrent
Charge/dischargecurrent
3) Engine start 15 km/h
2) while cruising
E2N
2) while cruising
E1N
SOC
E2NEngine notching
1) in powered running E2N
Speed
Time(a) Traditional control (b) Control patterns (A) - (C)
Off Off0
Li Li
Traditionalcontrol
4) while stopped SOC 40 - 50%
SOC
E2NEngine notching
E1NE1N
1) in powered running E1N or E2N(according to INV + SIV power consumption)
Speed
TimeOff
0
LiLi
Life control
Fig. 4 Control Operation Time ChartFig. 3 Energy Management Map While Control Patterns (A) - (C) are Applied
Fig. 6 Effect Verification by Operation Simulation (Series HB-E210)Fig. 5 Effect Verification by Operation Simulation (Series HB-E300)
58 JR EAST Technical Review-No.37-2017
Special edition paper
In control pattern (C), SOC transitioned to a lower range, so voltage at the DC part that storage batteries were connected to became lower than before. In this condition, we observed that charge and discharge current value tended to increase at the same power, i.e. deterioration actually tended to progress. We thus decided to employ control patterns (A) and (B) as the optimal charge and discharge control method.
4. Verification Using Actual Trains
4.1 Measurement of Data in Commercial OperationIn order to verify the effect of storage battery charge and discharge current by those control patterns, we collected running data in commercial operation for approx. two weeks with a logger. This was done using trainsets composed of a car with control pattern (A) or a car with control patterns (A) + (B) and cars with traditional control as shown in Fig. 7.
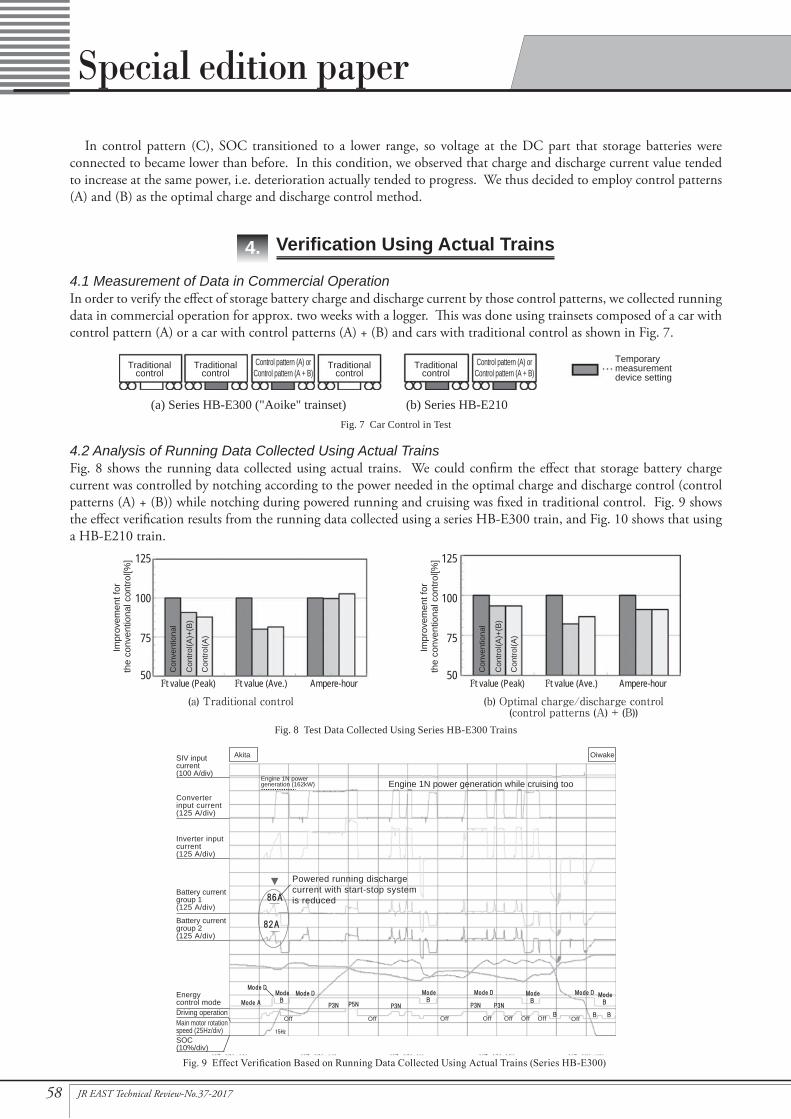
4.2 Analysis of Running Data Collected Using Actual TrainsFig. 8 shows the running data collected using actual trains. We could confirm the effect that storage battery charge current was controlled by notching according to the power needed in the optimal charge and discharge control (control patterns (A) + (B)) while notching during powered running and cruising was fixed in traditional control. Fig. 9 shows the effect verification results from the running data collected using a series HB-E300 train, and Fig. 10 shows that using a HB-E210 train.
Traditionalcontrol
Traditionalcontrol
Traditionalcontrol
Traditionalcontrol
Temporary measurement device setting
Control pattern (A) orControl pattern (A + B)
Control pattern (A) orControl pattern (A + B)
(a) Series HB-E300 ("Aoike" trainset) (b) Series HB-E210Fig. 7 Car Control in Test
(a) Traditional controlI2t value (Peak) I2t value (Ave.)
Con
vent
iona
l
Con
trol(A
)+(B
)
Con
trol(A
)
Ampere-hour50
75
100
125
Impr
ovem
ent f
or
the
conv
entio
nal c
ontro
l[%]
Impr
ovem
ent f
or
the
conv
entio
nal c
ontro
l[%]
I2t value (Peak) I2t value (Ave.)
Con
vent
iona
l
Con
trol(A
)+(B
)
Con
trol(A
)
Ampere-hour50
75
100
125
(b) Optimal charge/discharge control(control patterns (A) + (B))
Fig. 8 Test Data Collected Using Series HB-E300 Trains
OffOff Off Off
Engine 1N power generation (162kW)
Powered running discharge current with start-stop system is reduced
Akita Oiwake
▼
Engine 1N power generation while cruising too
Off Off Off Off
Energy control mode
Battery current group 2(125 A/div)
Battery current group 1(125 A/div)
Inverter input current(125 A/div)
Converterinput current(125 A/div)
SIV input current(100 A/div)
Main motor rotationspeed (25Hz/div)
Driving operation
SOC(10%/div)
Fig. 9 Effect Verification Based on Running Data Collected Using Actual Trains (Series HB-E300)
59JR EAST Technical Review-No.37-2017
Special edition paper
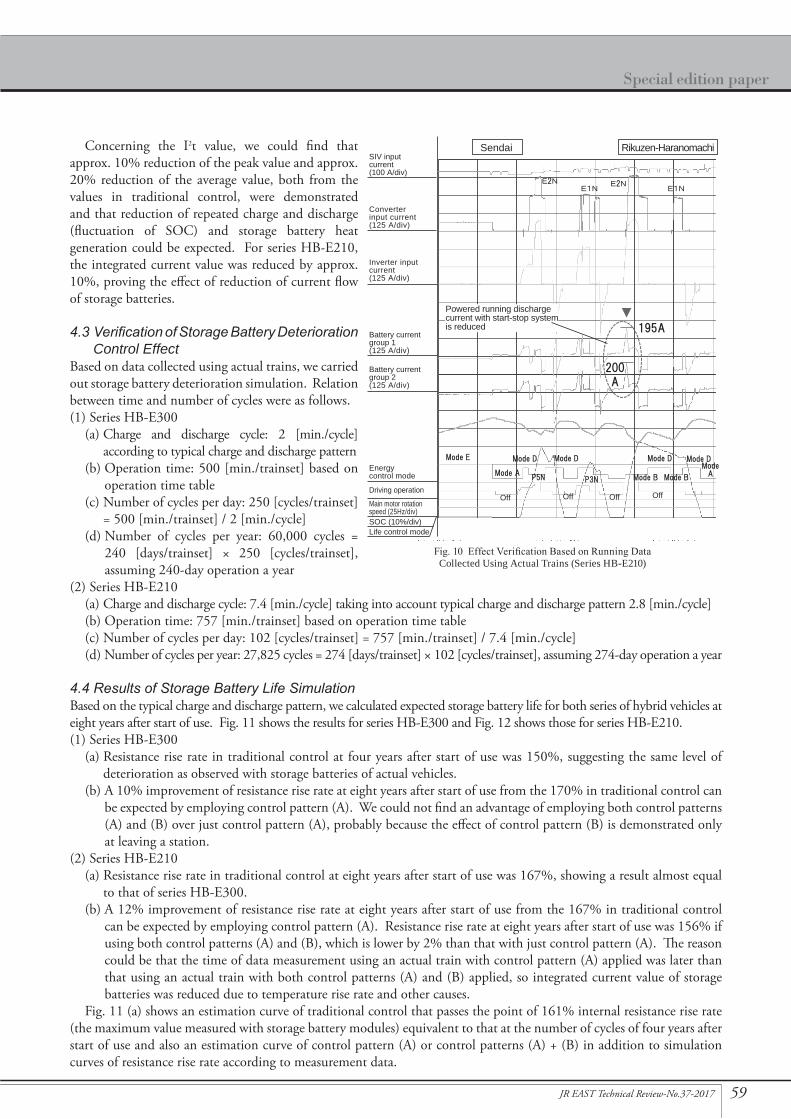
Concerning the I2t value, we could find that approx. 10% reduction of the peak value and approx. 20% reduction of the average value, both from the values in traditional control, were demonstrated and that reduction of repeated charge and discharge (fluctuation of SOC) and storage battery heat generation could be expected. For series HB-E210, the integrated current value was reduced by approx. 10%, proving the effect of reduction of current flow of storage batteries.
4.3 Verification of Storage Battery Deterioration Control Effect
Based on data collected using actual trains, we carried out storage battery deterioration simulation. Relation between time and number of cycles were as follows.(1) Series HB-E300
(a) Charge and discharge cycle: 2 [min./cycle] according to typical charge and discharge pattern
(b) Operation time: 500 [min./trainset] based on operation time table
(c) Number of cycles per day: 250 [cycles/trainset] = 500 [min./trainset] / 2 [min./cycle]
(d) Number of cycles per year: 60,000 cycles = 240 [days/trainset] × 250 [cycles/trainset], assuming 240-day operation a year
(2) Series HB-E210(a) Charge and discharge cycle: 7.4 [min./cycle] taking into account typical charge and discharge pattern 2.8 [min./cycle] (b) Operation time: 757 [min./trainset] based on operation time table(c) Number of cycles per day: 102 [cycles/trainset] = 757 [min./trainset] / 7.4 [min./cycle](d) Number of cycles per year: 27,825 cycles = 274 [days/trainset] × 102 [cycles/trainset], assuming 274-day operation a year
4.4 Results of Storage Battery Life SimulationBased on the typical charge and discharge pattern, we calculated expected storage battery life for both series of hybrid vehicles at eight years after start of use. Fig. 11 shows the results for series HB-E300 and Fig. 12 shows those for series HB-E210.(1) Series HB-E300
(a) Resistance rise rate in traditional control at four years after start of use was 150%, suggesting the same level of deterioration as observed with storage batteries of actual vehicles.
(b) A 10% improvement of resistance rise rate at eight years after start of use from the 170% in traditional control can be expected by employing control pattern (A). We could not find an advantage of employing both control patterns (A) and (B) over just control pattern (A), probably because the effect of control pattern (B) is demonstrated only at leaving a station.
(2) Series HB-E210(a) Resistance rise rate in traditional control at eight years after start of use was 167%, showing a result almost equal
to that of series HB-E300.(b) A 12% improvement of resistance rise rate at eight years after start of use from the 167% in traditional control
can be expected by employing control pattern (A). Resistance rise rate at eight years after start of use was 156% if using both control patterns (A) and (B), which is lower by 2% than that with just control pattern (A). The reason could be that the time of data measurement using an actual train with control pattern (A) applied was later than that using an actual train with both control patterns (A) and (B) applied, so integrated current value of storage batteries was reduced due to temperature rise rate and other causes.
Fig. 11 (a) shows an estimation curve of traditional control that passes the point of 161% internal resistance rise rate (the maximum value measured with storage battery modules) equivalent to that at the number of cycles of four years after start of use and also an estimation curve of control pattern (A) or control patterns (A) + (B) in addition to simulation curves of resistance rise rate according to measurement data.
Off OffOffOff
▼
Sendai Rikuzen-Haranomachi
Energy control mode
Battery current group 2(125 A/div)
Battery current group 1(125 A/div)
Inverter input current(125 A/div)
Converterinput current(125 A/div)
SIV input current(100 A/div)
Main motor rotationspeed (25Hz/div)
Driving operation
SOC (10%/div)Life control mode
Powered running discharge current with start-stop system is reduced
Fig. 10 Effect Verification Based on Running Data Collected Using Actual Trains (Series HB-E210)

60 JR EAST Technical Review-No.37-2017
Special edition paper
This data proved that applying control pattern (A) or patterns (A) + (B) can reduce resistance rise rate to 174% while that in traditional control at eight years after start of use is 187% (13% reduction). We therefore can say that applying the optimal charge and discharge control method can control storage battery deterioration including internal resistance rise rate.
4.5 Fuel ConsumptionWe compared fuel supply data of the rolling stock center for cars with traditional control and for cars with optimal charge and discharge control, but the fuel consumption difference was within ±2%, demonstrating no remarkable difference. We therefore could say that optimal charge and discharge control has little effect on fuel efficiency.
5. Conclusion
We examined an optimal charge and discharge control method that could extend storage battery life of diesel hybrid vehicles with large operation load. We confirmed that control pattern (A) where notching is selected according to power needed could control sharp charge and discharge of storage batteries and consequently storage battery life for series HB-E300 (Aoike trainset) and HB-E210 both. In contrast, we could find no evident effect of control pattern (B) where speed at the end of start-stop when leaving a station (engine start) is reduced.
We are going to go forward with control method development with the aim of extending storage battery life by controlling load on storage batteries in view of rolling total stock system including diesel control instead of just main circuit control.
Reference:1) Naoki Shiraki, Yoko Kato, Yoshitaka Yasui, Takashi Kaneko, Ryoichi Oishi, “A Hybrid System for Diesel R ailcar Series Ki-Ha E200
[abstract in English]”, Proceedings of the 17th Jointed Railway Technology Symposium ( J-Rail 2009) (December 2010): 33 - 36.
Eightyears
Traditional control
Number of cycles
Res
ista
nce
rise
rate
(%)
Cap
acity
rete
ntio
n (%
)
HB-E300 traditional control
HB-E210 traditional control
HB-E210 control pattern (A)
HB-E210 control pattern (A)+(B)
HB-E210 control pattern (A)
HB-E210 control pattern (A)+(B)
HB-E210 traditional control
HB-E300 control pattern (A)
HB-E300 control pattern (A) + (B)
HB-E300 traditional control
HB-E300 control pattern (A)
HB-E300 control pattern (A) + (B)
Eightyears
Fouryears
Fouryears
Traditional control
Control pattern (A),(A) + (B)
Control pattern (A),(A) + (B)
Control pattern (A),(A) + (B)
Control pattern (A),(A) + (B)
Number of cycles
Estimation curve passing internal resistance rise rate 161% at condition equivalent to four years after start of use
Estimation curve
(a) Internal resistance rise rate (b) Capacity retention
Number of cycles
Res
ista
nce
rise
rate
(%)
Cap
acity
rete
ntio
n (%
)
Number of cycles
(a) Internal resistance rise rate (b) Capacity retention
Traditional controlTraditional control
Eightyears
Eightyears
OneyearOne
year
Fig. 11 Results of Storage Battery Life Simulation (Series HB-E300)
Fig. 12 Results of Storage Battery Life Simulation (Series HB-E210)