development of the measurement of injury risk (miri) index
TRANSCRIPT

Transport Research Laboratory
Development of the Measurement of
Injury Risk (MIRi) Index
by C Fowler, S Clark, I Rillie, R Cuerden and L Smith
CPR1106
Task 400(1308)HALC
CLIENT PROJECT REPORT

Transport Research Laboratory
CLIENT PROJECT REPORT CPR1106
Development of the Measurement of Injury Risk (MIRi) Index
By C Fowler, S Clark, I Rillie, R Cuerden and L Smith (TRL)
Prepared for: Project Record: Task 400(1308)HALC
Development of the Measurement of Injury Risk
(MIRi) Index
Client: Highways Agency, NetServ
Paul Mitchell
Copyright Transport Research Laboratory April 2011
This Draft Report has been prepared for Highways Agency for the sole purpose of Project
Report Review. It may only be disseminated once it has been completed and issued with
a final TRL Report Number.
The views expressed are those of the author(s) and not necessarily those of Highways
Agency.
Name Date
Approved
Project
Manager Paul Walton 27/05/2011
Technical
Referee Iain Rillie 27/05/2011
Client Project Report
TRL CPR1106
When purchased in hard copy, this publication is printed on paper that is FSC (Forest
Stewardship Council) registered and TCF (Totally Chlorine Free) registered.
Contents Amendment Record
This report has been issued and amended as follows
Version Date Description Editor Technical
Referee
1.0 31/3 First draft sent for client comment SC IR
2.0 25/3 Second draft incorporating client comments SC IR

Client Project Report
TRL i CPR1106
Contents
List of Figures iv
List of Tables v
Executive summary vi
1 Introduction 1
2 Relationship between vehicle impact speed and pedestrian injury
outcome 2
2.1 Background 2
2.2 Car and pedestrian collisions 3
2.3 Larger vehicle and pedestrian collisions 4
2.4 Summary – risk of pedestrian injury by impact speed 5
3 Examination of Accident Data for Road Workers 6
3.1 Stats19 HA data for road workers 6
3.2 Accident circumstances 6
3.3 Striking vehicle details 8
3.4 Casualty 9
3.5 Contributory Factors 10
3.6 Fatal files 11
3.7 Summary 12
4 Examination of AIRSWeb Data 14
4.1 Quality of data 16
4.2 Analysis 17
4.3 Summary 21
5 The Development of the MIRi Index 22
5.1 Current Practices for Temporary Traffic Management Procedures 22
5.2 Phases of Temporary Traffic Management (TTM) 22 5.2.1 Installation of Advanced Signing 22 5.2.2 Installation of Detail A 24 5.2.3 Taper Installation 25 5.2.4 Taper Removal 26 5.2.5 Advanced Sign Removal 26
5.3 Task Analysis 26
5.4 Development of the MIRi Index 27
5.5 Populating the MIRI Index 31 5.5.1 Probability levels 31 5.5.2 Exposure to the hazard 32 5.5.3 Consequences 32 5.5.4 Risk Levels 33
5.6 Calculation of the Benchmark MIRI Index 33

Client Project Report
TRL ii CPR1106
6 Discussion 34
7 Conclusions and Future Developments 41
7.1 Benefits realisation 42
References 43
Glossary of terms and abbreviations 44
Appendix A Impact speed and pedestrian injury outcome 45
Appendix B Current Practices 65
Appendix C Variables 70
Appendix D Subtasks 79
Appendix E Scope and Assumptions 83
Appendix E Tables of Comparative MIRi Index values and Carriageway
Crossings 85

Client Project Report
TRL iii CPR1106
Client Project Report
TRL iv CPR1106
List of Figures
Figure 2-1: Injury severity by age (STATS19) ........................................................... 2
Figure 2-2: Injury severity and vehicle type (STATS19) ............................................. 3
Figure 2-3: Risk of pedestrian injury by impact speed (front of cars, all ages of
pedestrian) ..................................................................................................... 4
Figure 4-1: AIRSWeb reported near miss and injury data relative to 2006 .................. 16
Figure 5-1: Components and location of Detail A ..................................................... 24
Figure 5-2 Highways Agency Risk Matrix ................................................................ 28
Figure 5-3: Example use of the MIRi calculator ....................................................... 30
Figure 5-4 Example use of the MIRi calculator ......................................................... 31
Figure 6-1 Overlap of MIRi Index values with various interventions ........................... 36
Figure 6-2 Effect of changing generic method of installation of TTM on MIRi Index ...... 37
Figure A-1. Risk of pedestrian fatality calculated using logistic regression from Ashton
and Mackay data ........................................................................................... 52
Figure A-2. Risk of pedestrian fatality calculated using logistic regression from Rosén and
Sander GIDAS dataset ................................................................................... 53
Figure A-3. Cumulative impact speed for pedestrian casualties in the OTS and Police fatal
file dataset ................................................................................................... 54
Figure A 4. Risk of pedestrian fatality calculated using logistic regression from the OTS
and Police fatal file dataset ............................................................................. 55
Figure A 5. Comparison of impact locations between HVCIS and STATS19 by vehicle
type. ............................................................................................................ 56
Figure A 6. Pedestrian impact location on front of LPV (left), HGV (centre) and LCV
(right). ......................................................................................................... 57
Figure A 7. Cumulative percentage of impact speed by vehicle type. .......................... 58
Figure A 8. Cause of death for pedestrians in impacts with the front of LPVs, HGVs and
LCVs. ........................................................................................................... 59
Client Project Report
TRL v CPR1106
List of Tables
Table 3-1: Number of pedestrians injured in the course of on the road work by road
type and severity (2005-09) ............................................................................. 6
Table 3-2: Number of pedestrians injured in the course of on the road work by time and
severity (2005-09) .......................................................................................... 7
Table 3-3: Number of pedestrians injured in the course of on the road work by special
conditions at site and severity (2005-09) ............................................................ 7
Table 3-4: Number of pedestrians injured in the course of on the road work by Vehicle
type and severity (2005-09) ............................................................................. 8
Table 3-5: Number of pedestrians injured in the course of on the road work by Vehicle
manoeuvre and severity (2005-09) .................................................................... 8
Table 3-6: Number of pedestrians injured in the course of on the road work by Vehicle
location and severity (2005-09) ........................................................................ 9
Table 3-7: Number of pedestrians injured in the course of on the road work by Age and
Severity (2005-09) .......................................................................................... 9
Table 3-8: Number of pedestrians injured in the course of on the road work by Location
and Severity (2005-09) .................................................................................. 10
Table 3-9: Number of pedestrians injured in the course of on the road work with
pedestrian and vehicle factors (2005-09) .......................................................... 10
Table 3-10: Number of pedestrians injured in the course of on the road work with
pedestrian and vehicle factors (2005-09) .......................................................... 11
Table 4-1: Number of incident types/people reported in AIRSWeb by incident type and
year ............................................................................................................. 15
Table 4-2: Number of injuries and near misses by „road works which part‟ and year ... 17
Table 4-3: Number of injuries and near misses by „road works which part‟ (where
known) and injury type .................................................................................. 18
Table 4-4: Incident descriptions for five fatalities which occurred on live carriageway . 19
Table 4-5: Number of injuries and near misses by „when in TTM process‟ and year ..... 20
Table 4-6: Incident sub type injuries by „when in TTM process‟ ................................ 20

Client Project Report
TRL vi CPR1106
Executive summary
Every year a number of road workers suffer fatal or life changing injuries as a
consequence of their work. Other road workers suffer less serious injuries but the
Highways Agency is committed to ensuring the safety of all road workers involved in
maintaining the strategic road network. This requires prioritisation of investment and
activity to ensure that safety of road workers is improved and that the benefits from
these improvements can be measured and realised.
The highest risk process undertaken by road workers is traditionally viewed to be the
deployment and removal of temporary traffic management (TTM). The MIRi Index has
been developed from an in-depth understanding of the work processes involved with
deploying TTM. The index applies to the deployment and retrieval of TTM associated with
relaxation closures (excluding the longitudinal coning), which accident and incident data
suggests is the highest risk activity undertaken by road workers.
The MIRi Index has been supplemented with a carriageway crossing value. This is based
on an aggregated value of carriageway crossings and is not a precise value against
which the Supply Chain should be assessed, but instead is designed to allow
quantification of the substantial reductions in carriageway crossings that can be achieved
by changes in working practices.
Examining the data from the MIRi Index demonstrates that the selection of the base
method for deployment and retrieval of TTM is critical to achieving the lowest possible
MIRi Index score. Elimination of carriageway crossings is an important part of reducing
risk but without a sound base MIRi Index score it is likely that eliminating carriageway
crossings will not drive down risk to road workers to a level that can be shown to be as
low as reasonably practicable.
The analysis of the MIRi Index and carriageway crossing data was extended to two
potential techniques that have been identified as approaches to reduce carriageway
crossings. The TTM Sign Simplification (TTMSS) approach seeks to eliminate the 600
yard and 200 yard advance signing together with the Detail „A‟ elements on the hard
shoulder adjacent to the entry taper. This approach has the potential to reduce the MIRi
Index by up to 22% and to decrease carriageway crossings by up to 52%.
If an aggregated value is calculated for likely decrease (based on best-estimate for the
number of TM installations carried out using each method), TTMSS can achieve a
national reduction in MIRi Index of 19% and a reduction in carriageway crossings of
46%. This is a substantial reduction which can be achieved with no additional equipment
or requirements for road workers.
The second approach considered is that of offside signs relaxation (OSSR), where for
nearside lane closures the offside signs are omitted. This achieves a similar reduction in
MIRi Index (up to 28%) but reduces carriageway crossings by 100%. However, as this
technique is only applicable to nearside lane closures its contribution towards achieving a
substantial reduction in carriageway crossings is limited; if the two techniques are
combined the indications are that the MIRi Index will decrease by an additional 2% to
21%, with carriageway crossings decreasing by an additional 9% to 55%.
These figures are based on a number of assumptions; it is recommended that these are
validated from the Schedule of Road Works before these values are cited as evidence of
likely benefit.

Client Project Report
1
1 Introduction
Every year a small number of road workers are seriously injured or killed whilst
maintaining the Highways Agency (HA) strategic road network and a significant number
of other road workers suffer less serious harm. A number of these operatives are
involved in setting out the cones, signs and lamps associated with road works. These
road workers undertake some of the most hazardous activities during their work, as they
work in close proximity to live traffic travelling at or above the national speed limit with little or no physical protection and often during the hours of darkness.
The HA‟s „Aiming for Zero(AfZ): Safety for Our Road Workers‟ strategy sets out a bold
vision to achieve a “substantial” reduction in crossings of the live carriageway by the end
of 2011 and eliminate completely the requirement for road workers to be on foot on live
carriageways during routine maintenance operations carried out after 2016
(“Exposure:Zero”). Quantifying the risk associated with on-road operations gives a
measurement of injury risk (MIRi) that can be used to prioritise activity and demonstrate
progress and improvements toward AfZ targets.
The work required for development of the MIRi Index has required investigation of
current practices for road works and analysis of the current level of exposure to injury
risk associated with these operations. A three dimensional risk matrix has been designed
which, unlike other risk matrices, incorporates a measure of the road workers‟ duration
of exposure to risk, thus allowing a benchmark Measurement of Injury Risk (MIRi) Index
to be calculated. The MIRi Index has been developed in such a way that it will remain a
useful measure for road worker safety improvements once the vision of “Exposure:Zero”
is achieved.
This report presents the results from the development of the MIRi Index as described
above. It begins by looking at the relationship between vehicle impact speed and injury
outcome, and investigates accident data via analyses of Stats 19 and AIRSWeb data for
accidents to road workers. The report then outlines the methodology for the
development of the MIRi Index and presents the results from applying this methodology
to deriving the MIRi Index values for currently reported industry practice (benchmark
MIRI Index for 2010), and for two proposed temporary traffic management initiatives
(reduction in advanced signing; and offside signs relaxation). The effect of combining
initiatives is discussed along with potential future developments in the MIRi Index that
would enable quantification of risk to all road workers.

Client Project Report
2
2 Relationship between vehicle impact speed and
pedestrian injury outcome
When the front of a moving vehicle strikes a pedestrian there are a number of factors
which directly contribute to the risk and the type of injuries that he or she may sustain,
these include:
the biomechanical tolerance of the pedestrian, often related to their age and
state of health;
the height of the pedestrian, which has a bearing on where and how the different
parts of the body are loaded by the vehicle;
the shape and stiffness properties of the vehicle‟s front structure, from flat
fronted vans or lorries to low profile sports cars; and
the speed of the vehicle on impact.
This section summarises the larger body of work presented in Appendix A
2.1 Background
The overall risk of injury for an individual accident is complex, as a number of different
parameters need to be understood. Figure 2-1 gives a breakdown of Great Britain‟s
reported pedestrian road casualties (STATS19, 2009),with injury severities classified by
the police according to the British government‟s definitions of Fatal, Serious or Slight.
Proportionally more males suffered fatal injuries when involved in pedestrian accidents
than females, whilst younger pedestrians received a higher proportion of serious injuries,
with older pedestrians suffering fatal outcomes more frequently.
Figure 2-1: Injury severity by age (STATS19)
Figure 2-2 shows the distribution of pedestrian injury severity by the type of vehicle
involved in the accident. Nearly 70% of the fatalities and over 80% of the serious
casualties are due to impacts with cars. As would be expected, heavy transport vehicles

Client Project Report
3
are over-represented when the pedestrian is fatally injured whereas cars/taxis were
under-represented.
Figure 2-2: Injury severity and vehicle type (STATS19)
2.2 Car and pedestrian collisions
Recent research by TRL (Richards, 2010, Cuerden et al. 2008) has quantified the risk of
pedestrian injury when struck by the front of a car (Figure 2-3).
Figure 2-3 highlights the risk of suffering injury of a given severity depending on the
impact speed, where for low speeds, for example less than 10mph, over 90% sustain
slight injuries; whereas for high speeds, for example above 60mph, over 90% are killed.
For pedestrians struck by the front of cars at 20mph, approximately 1% are killed, 26%
are seriously injured and 73% are slightly injured. When the impact speed increases to
50mph, approximately 72% are killed, 21% are seriously injured and 7% are slightly
injured.
Due to the wide range of impact types and people considered there are outliers in the
data, with some individuals surviving very high speed impacts and others being killed at
relatively low speeds. However, the overall pattern is very clear, with a significant rise in
the gradient of the fatal risk curve above impact speeds of 30mph.

Client Project Report
4
Figure 2-3: Risk of pedestrian injury by impact speed (front of cars, all ages of
pedestrian)
For low speeds, for example less than 10mph, over 90% sustain slight injuries; whereas
for high speeds, for example above 60mph, over 90% are killed. For pedestrians struck
by the front of cars at 20mph, approximately 1% are killed, 26% are seriously injured
and 73% are slightly injured. When the impact speed increases to 50mph, approximately
72% are killed, 21% are seriously injured and 7% are slightly injured.
Due to the wide range of impact types and people considered there are outliers in the
data, with some individuals surviving very high speed impacts and others being killed at
relatively low speeds. However, the overall pattern is very clear, with a significant rise in
the gradient of the fatal risk curve above impact speeds of 30mph.
2.3 Larger vehicle and pedestrian collisions
Compared with car impacts, the pedestrian kinematics during an impact are generally
different when larger goods vehicles or buses or coaches are involved, with associated
different injury mechanisms. For accidents involving larger vehicles, there are a
significant minority of casualties, perhaps up to 30% in the UK, who are struck at
relatively low speeds (less than 15mph) and are literally run-over by the tyres. The
remaining casualties experience higher impact-energy crashes, but much less is known
about the relationship of the impact speed and the risk of injury compared with car
impacts.
For the purpose of this project it is reasonable to assume that larger vehicles present at
least the same risk as passenger cars for travelling speeds above 15 mph, which would
represent a lower estimate.
0%
10%
20%
30%
40%
50%
60%
70%
80%
90%
100%
0 10 20 30 40 50 60 70 80
Pe
rce
nta
ge
of
inju
re
d c
asu
alt
ies
Impact speed (mph)
Fatal Serious Slight

Client Project Report
5
2.4 Summary – risk of pedestrian injury by impact speed
This work has not attempted to account for travelling speed and any possible braking or
pre-impact avoidance manoeuvres that may occur in road traffic accidents, it has simply
considered the speed of the vehicle at the point of impact. This equates to a road worker
being struck by a vehicle when the driver has not seen the road worker or has had
insufficient time to react to their presence.
The risk of injury is presented for pedestrians who were struck by the fronts of cars with
respect to their impact speed. This is likely to be a conservative estimate for larger
vehicles, especially where the pedestrian is struck by the corner of the HGV and
experiences head contact with the metal windscreen surround; for this group of
accidents it is anticipated that the risk of serious and fatal injury will be considerably
more than the average values derived for cars (Figure 2-3). It is not possible to quantify
this increase, but it is reasonable to assume that a factor of 1.5 could be applied (i.e.
divide the impact speed axis by 1.5). This would mean that over 90% of pedestrians
struck at 50mph by the front corner of a lorry would be expected to be killed.
It is unfortunately the case that road workers are at potentially higher risk of being
struck by the front corner of a lorry than by the front itself. Most heavy vehicle
incursions onto hard shoulders involve only partial encroachment of the vehicle into the
closed lane. This increases the likelihood of impact between the road worker and the
front corner of the vehicle and so increases the likelihood of fatal injury.
Where the vehicle fleet is largely made-up of cars (approximately 70% of the reported
deaths) the data presented represent a realistic parameter for assessing risk with the
current impact speed values. This situation would apply to road workers working
adjacent to the central reservation barrier where (except on two-lane dual carriageways)
heavy goods vehicles are prohibited from using the offside lane
Thus, in summary, at 50 mph, 72% of people struck by a car will be killed. Based on a
synthesis of these data and expert opinion it is likely that over 90% of pedestrians struck
at 50 mph by the front corner of a lorry would be expected to be killed. From this, it can
also be deduced that impact between a road worker and any vehicle moving at 50mph is
likely to have a fatal outcome. This influences the risk to road workers exposed to live
traffic especially where workers are at risk from collision with HGVs.

Client Project Report
6
3 Examination of Accident Data for Road Workers
3.1 Stats19 HA data for road workers
Stats19 is the national database of injury accidents reported to and by the police and
includes details on the accident circumstances, the vehicles involved and the casualties
involved. Since 2005, the casualty details have included whether a pedestrian casualty
was „in the course of on the road work‟ which relates to a work activity carried out on the
public highway and not trips made between different work locations.
The circumstances given in Stats19 of the pedestrians injured in the course of on the
road work on the HA network have been analysed in order to assess the number of road
worker accidents on the network.
Accidents which did not involve a member of the public, that is, those accidents which
occurred within a road works site may not be included, and those accidents included are
likely to include some pedestrians that were not road workers, for example, emergency
service or vehicle recovery personnel.
3.2 Accident circumstances
Between 2005 and 2009, 94 pedestrians were recorded as being killed or injured in the
course of on the road work. These 94 pedestrians were injured in 79 accidents; 7
fatalities were in 6 accidents. Table 3-1 shows the severity of the pedestrian‟s injury by
road class and type
Table 3-1: Number of pedestrians injured in the course of on the road work by
road type and severity (2005-09)
Road type Killed Seriously injured
Slightly injured Total Percentage
Motorway 4 9 37 50 53%
A-single 1 1 11 13 14%
A-dual 2 10 19 31 33%
Total 7 20 67 94 100%
About 43% of the length of the HA network is motorway, and 53% of the 94 pedestrians
injured in the course of on the road work on the road network between 2005 and 2009
were on motorways (although the amount of road works on each road type and the
traffic on each road type will affect the number of road workers injured).
Table 3-2 shows the times of day when the pedestrians were injured in the course of on
the road work.

Client Project Report
7
Table 3-2: Number of pedestrians injured in the course of on the road work by
time and severity (2005-09)
Time Killed Seriously injured
Slightly injured Total Percentage
00.00-03.59 2 2 9 13 14%
04.00-07.59 0 3 4 7 7%
08.00-11.59 1 4 13 18 19%
12.00-15.59 0 5 12 17 18%
16.00-19.59 0 2 9 11 12%
20.00-23.59 4 4 20 28 30%
Total 7 20 67 94 100%
Four of the seven pedestrians that were killed, were between 8pm and midnight. This is
the period where there is both darkness and a reasonable amount of traffic (compared to
after midnight). Short term road works often occur overnight to reduce disruption to
traffic, although not all of the pedestrians injured in the course of on the road work were
injured where road works were present, as shown in Table 3-3.
Table 3-3: Number of pedestrians injured in the course of on the road work by
special conditions at site and severity (2005-09)
Special Conditions at site Killed
Seriously injured
Slightly injured Total percentage
Auto traffic signal out 0 0 1 1 1%
Road works 4 4 23 31 33%
None 3 16 43 62 66%
Total 7 20 67 94 100%
The results show that of the 94 pedestrians injured on the road network, 31 were
working in the presence of road works. The largest proportion of the 94 had no special
conditions linked to where they were injured. This suggests that two-thirds of the
pedestrians injured in the course of on the road work were probably not road workers.
These pedestrians may have been other pedestrians that were on the road as part of
their work, for example, traffic officers, emergency services and vehicle recovery
operators.
Client Project Report
8
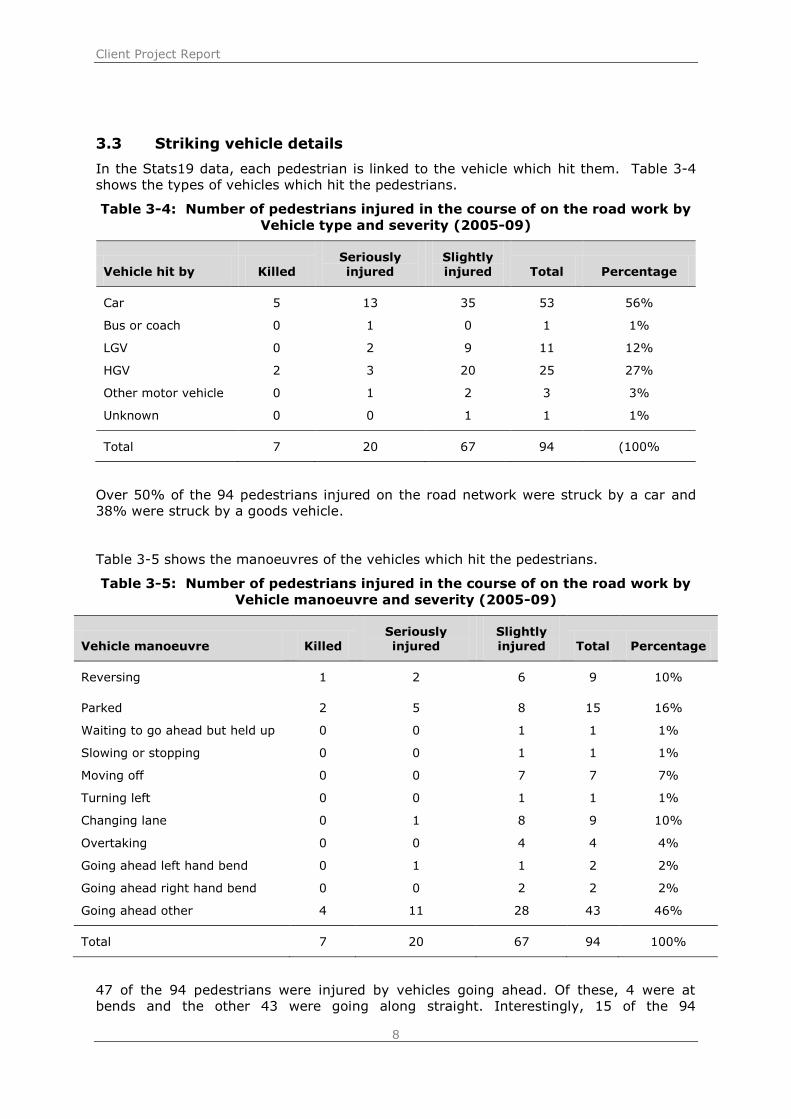
3.3 Striking vehicle details
In the Stats19 data, each pedestrian is linked to the vehicle which hit them. Table 3-4
shows the types of vehicles which hit the pedestrians.
Table 3-4: Number of pedestrians injured in the course of on the road work by
Vehicle type and severity (2005-09)
Vehicle hit by Killed Seriously injured
Slightly injured Total Percentage
Car 5 13 35 53 56%
Bus or coach 0 1 0 1 1%
LGV 0 2 9 11 12%
HGV 2 3 20 25 27%
Other motor vehicle 0 1 2 3 3%
Unknown 0 0 1 1 1%
Total 7 20 67 94 (100%
Over 50% of the 94 pedestrians injured on the road network were struck by a car and
38% were struck by a goods vehicle.
Table 3-5 shows the manoeuvres of the vehicles which hit the pedestrians.
Table 3-5: Number of pedestrians injured in the course of on the road work by
Vehicle manoeuvre and severity (2005-09)
Vehicle manoeuvre Killed Seriously injured
Slightly injured Total Percentage
Reversing 1 2 6 9 10%
Parked 2 5 8 15 16%
Waiting to go ahead but held up 0 0 1 1 1%
Slowing or stopping 0 0 1 1 1%
Moving off 0 0 7 7 7%
Turning left 0 0 1 1 1%
Changing lane 0 1 8 9 10%
Overtaking 0 0 4 4 4%
Going ahead left hand bend 0 1 1 2 2%
Going ahead right hand bend 0 0 2 2 2%
Going ahead other 4 11 28 43 46%
Total 7 20 67 94 100%
47 of the 94 pedestrians were injured by vehicles going ahead. Of these, 4 were at
bends and the other 43 were going along straight. Interestingly, 15 of the 94
Client Project Report
9
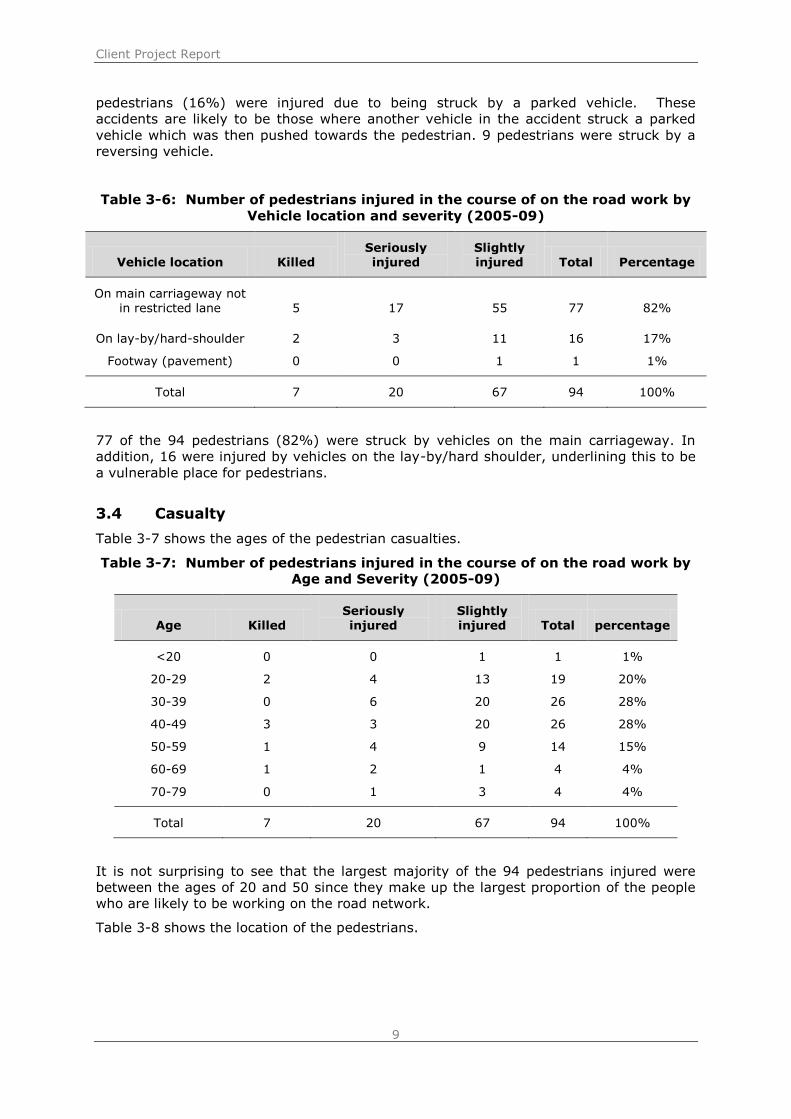
pedestrians (16%) were injured due to being struck by a parked vehicle. These
accidents are likely to be those where another vehicle in the accident struck a parked
vehicle which was then pushed towards the pedestrian. 9 pedestrians were struck by a
reversing vehicle.
Table 3-6: Number of pedestrians injured in the course of on the road work by
Vehicle location and severity (2005-09)
Vehicle location Killed Seriously injured
Slightly injured Total Percentage
On main carriageway not in restricted lane 5 17 55 77 82%
On lay-by/hard-shoulder 2 3 11 16 17%
Footway (pavement) 0 0 1 1 1%
Total 7 20 67 94 100%
77 of the 94 pedestrians (82%) were struck by vehicles on the main carriageway. In
addition, 16 were injured by vehicles on the lay-by/hard shoulder, underlining this to be
a vulnerable place for pedestrians.
3.4 Casualty
Table 3-7 shows the ages of the pedestrian casualties.
Table 3-7: Number of pedestrians injured in the course of on the road work by
Age and Severity (2005-09)
Age Killed
Seriously
injured
Slightly
injured Total percentage
<20 0 0 1 1 1%
20-29 2 4 13 19 20%
30-39 0 6 20 26 28%
40-49 3 3 20 26 28%
50-59 1 4 9 14 15%
60-69 1 2 1 4 4%
70-79 0 1 3 4 4%
Total 7 20 67 94 100%
It is not surprising to see that the largest majority of the 94 pedestrians injured were
between the ages of 20 and 50 since they make up the largest proportion of the people
who are likely to be working on the road network.
Table 3-8 shows the location of the pedestrians.

Client Project Report
10
Table 3-8: Number of pedestrians injured in the course of on the road work by
Location and Severity (2005-09)
Location Killed Seriously injured
Slightly injured Total Percentage
In carriageway, crossing 0 2 3 5 5%
On footway or verge 0 3 3 6 6%
On refuge, central island or central reservation 1 0 4 5 5%
In carriageway, not crossing 4 13 47 64 68%
Unknown or other 2 2 10 14 15%
Total 7 20 67 94 100%
61% of pedestrians injured on the road network were in the carriageway but not for the
purpose of crossing to the other side. There were 14 pedestrians whose location was
unknown.
3.5 Contributory Factors
There were 49 pedestrians injured in the course of on the road work in the study period
in accidents that were attended by the police and had contributory factors reported.
Table 3-9: Number of pedestrians injured in the course of on the road work
with pedestrian and vehicle factors (2005-09)
Factors Killed
Seriously
injured
Slightly
injured Total
Vehicle factor(s) only 1 4 22 27
Pedestrian factor(s) only 0 10 10 20
Vehicle and pedestrian factor(s) 4 2 6 12
Other 2 2 1 5
Total 5 11 33 49
More than half (27/49) of the pedestrians were in accidents where there were vehicle
factors only, that is, the actions of the pedestrian did not contribute to the accident.
20 of the pedestrians were in accidents where the pedestrian was reported with
contributory factors and none were attributed to any vehicles, suggesting that the
actions of the vehicle did not contribute to the accident.
12 pedestrians were in accidents where actions of the vehicle and the pedestrian were
reported as contributing towards the accident.
The most common pedestrian factor was „failed to look properly‟, recorded for 10
pedestrians.

Client Project Report
11
Table 3-10: Number of pedestrians injured in the course of on the road work
with pedestrian and vehicle factors (2005-09)
Pedestrian Factor Killed
Seriously
injured
Slightly
injured Total
Failed to look properly 2 3 5 10
Dangerous action in carriageway 1 3 1 5
Other 0 1 2 3
Pedestrian wearing dark clothing at night 0 2 1 3
Failed to judge other person‟s path or speed 0 1 2 3
Careless, reckless or in a hurry 1 1 1 3
Impaired by alcohol 0 1
1
Wrong use of pedestrian crossing facility 0 0 1 1
Crossing road masked by stationary or parked vehicles 0 0 1 1
Temporary road layout 0 0 1 1
Disability or illness, mental or physical 0 0 1 1
No pedestrian factor 3 6 23 32
Total 5 11 33 49
The most common factors for vehicles were:
Failed to look properly
Careless, reckless or in a hurry
„Other‟
Loss of control
Aggressive driving
3.6 Fatal files
TRL hold an archive of fatal files from selected police forces, consisting of the files
relating to fatal accidents when a police force has completed their investigation.
Details of the six fatal accidents involving a pedestrian injured in the course of on the
road work were matched with the fatal files archive held at TRL.
Only one file was available in the fatal file archive and the summary of this file is
presented below:
Triple fatality when car enters road works site
Two road workers were killed when a car driven by a member of the public ploughed into a coned
area. The driver of the car was also killed.
The accident was on the motorway in the evening. There were road works in progress, which were barrier repairs due to a previous accident. The road works were laid out according to guidelines and Lane 3 was coned off.
The taper started about 400m from collision scene, VMS were displayed with advance warning of works with „workforce in carriageway – slow‟ and 50mph advisory limit displayed.
Client Project Report
12
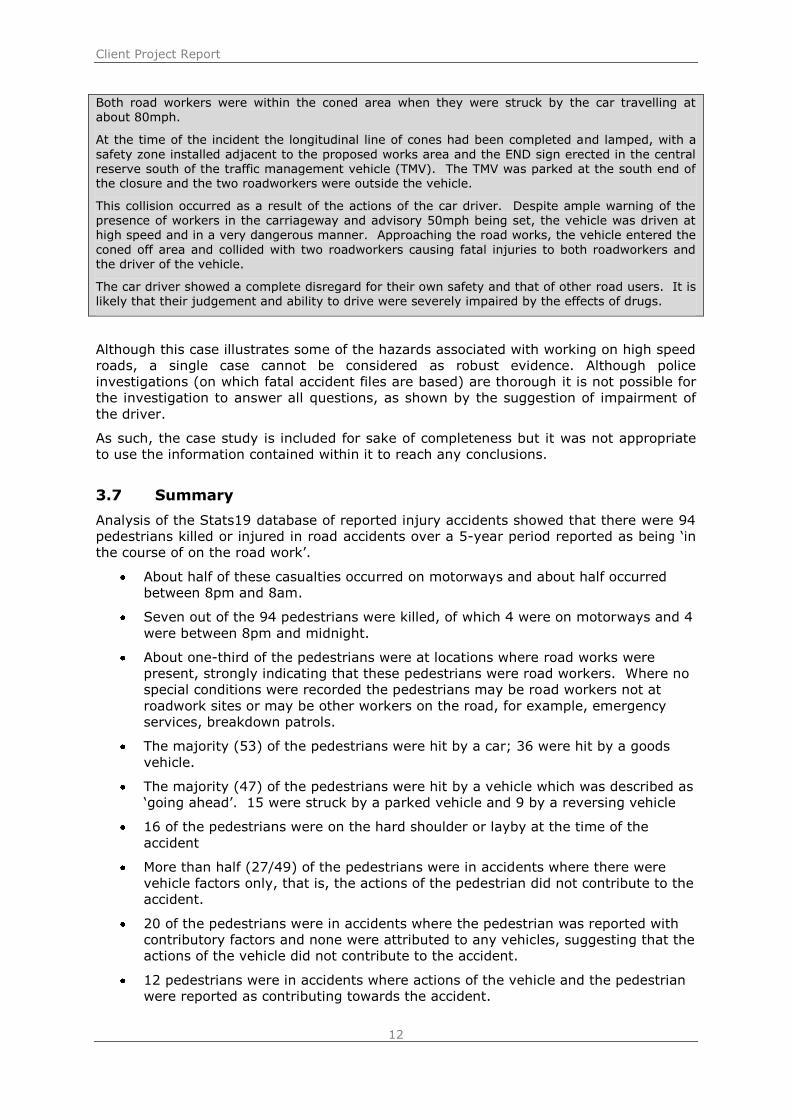
Both road workers were within the coned area when they were struck by the car travelling at about 80mph.
At the time of the incident the longitudinal line of cones had been completed and lamped, with a
safety zone installed adjacent to the proposed works area and the END sign erected in the central reserve south of the traffic management vehicle (TMV). The TMV was parked at the south end of the closure and the two roadworkers were outside the vehicle.
This collision occurred as a result of the actions of the car driver. Despite ample warning of the presence of workers in the carriageway and advisory 50mph being set, the vehicle was driven at high speed and in a very dangerous manner. Approaching the road works, the vehicle entered the
coned off area and collided with two roadworkers causing fatal injuries to both roadworkers and the driver of the vehicle.
The car driver showed a complete disregard for their own safety and that of other road users. It is likely that their judgement and ability to drive were severely impaired by the effects of drugs.
Although this case illustrates some of the hazards associated with working on high speed
roads, a single case cannot be considered as robust evidence. Although police
investigations (on which fatal accident files are based) are thorough it is not possible for
the investigation to answer all questions, as shown by the suggestion of impairment of
the driver.
As such, the case study is included for sake of completeness but it was not appropriate
to use the information contained within it to reach any conclusions.
3.7 Summary
Analysis of the Stats19 database of reported injury accidents showed that there were 94
pedestrians killed or injured in road accidents over a 5-year period reported as being „in
the course of on the road work‟.
About half of these casualties occurred on motorways and about half occurred
between 8pm and 8am.
Seven out of the 94 pedestrians were killed, of which 4 were on motorways and 4
were between 8pm and midnight.
About one-third of the pedestrians were at locations where road works were
present, strongly indicating that these pedestrians were road workers. Where no
special conditions were recorded the pedestrians may be road workers not at
roadwork sites or may be other workers on the road, for example, emergency
services, breakdown patrols.
The majority (53) of the pedestrians were hit by a car; 36 were hit by a goods
vehicle.
The majority (47) of the pedestrians were hit by a vehicle which was described as
„going ahead‟. 15 were struck by a parked vehicle and 9 by a reversing vehicle
16 of the pedestrians were on the hard shoulder or layby at the time of the
accident
More than half (27/49) of the pedestrians were in accidents where there were
vehicle factors only, that is, the actions of the pedestrian did not contribute to the
accident.
20 of the pedestrians were in accidents where the pedestrian was reported with
contributory factors and none were attributed to any vehicles, suggesting that the
actions of the vehicle did not contribute to the accident.
12 pedestrians were in accidents where actions of the vehicle and the pedestrian
were reported as contributing towards the accident.

Client Project Report
13
The most common pedestrian factor was „failed to look properly‟, recorded for 10
pedestrians.
The most common factors for vehicles were: „Failed to look properly‟, „Careless,
reckless or in a hurry‟, „Other‟, „Loss of control‟ and „Aggressive driving‟.
The Stats19 data link to the TRL fatal file archive was used to find more detailed
information regarding the circumstances of these accidents. Only one file was available,
involving a high-speed collision between a vehicle and two road workers in which the
workers and driver were all killed. This single case could not be used to reach any robust
conclusion.

Client Project Report
14
4 Examination of AIRSWeb Data
AIRSWeb is the database of reported hazards, near misses and accidents involving road
workers who are working for the HA. The HA‟s supply chain partners complete this
database as a contractual commitment.
The extracted AIRSWeb data covered the period from 1997 up to 15th December 2010
and included details such as:
Incident date
Incident description (free text)
Incident type (for example fatality, near miss, fire)
Types of work present
Activities/tasks undertaken
TTM (temporary traffic management) scheme type
Which part of TTM
When in TTM process (for example, setting out or removal)
Speed limit
Vehicle involvement
Investigation causes
131 records, including 119 in 2008, had the description „dummy record‟ (relating to the
testing of the database) and were removed from the analysis. Removing these 131
records left 8,748 incident occasions in the dataset.
Table 4-1 shows the incidents and involved contractors and members of the public by
incident type and year. Incidents are categorised as
Abuse
Damage/loss
Hazard
Illness
Injury
Near miss
Service strike
Each incident can be recorded as one or more of the types listed above and each incident
may involve more than one person, therefore the total in Table 4-1 sums to more than
8,748. Near misses could be categorised as a near miss which would have resulted in an
accident or a near miss which could have resulted in a different incident type, e.g. fire,
service strike.
Excluding the „dummy records‟, there were 4,863 recorded incident occurrences in 2010
which included 4,881 incident types/people.
Client Project Report
15
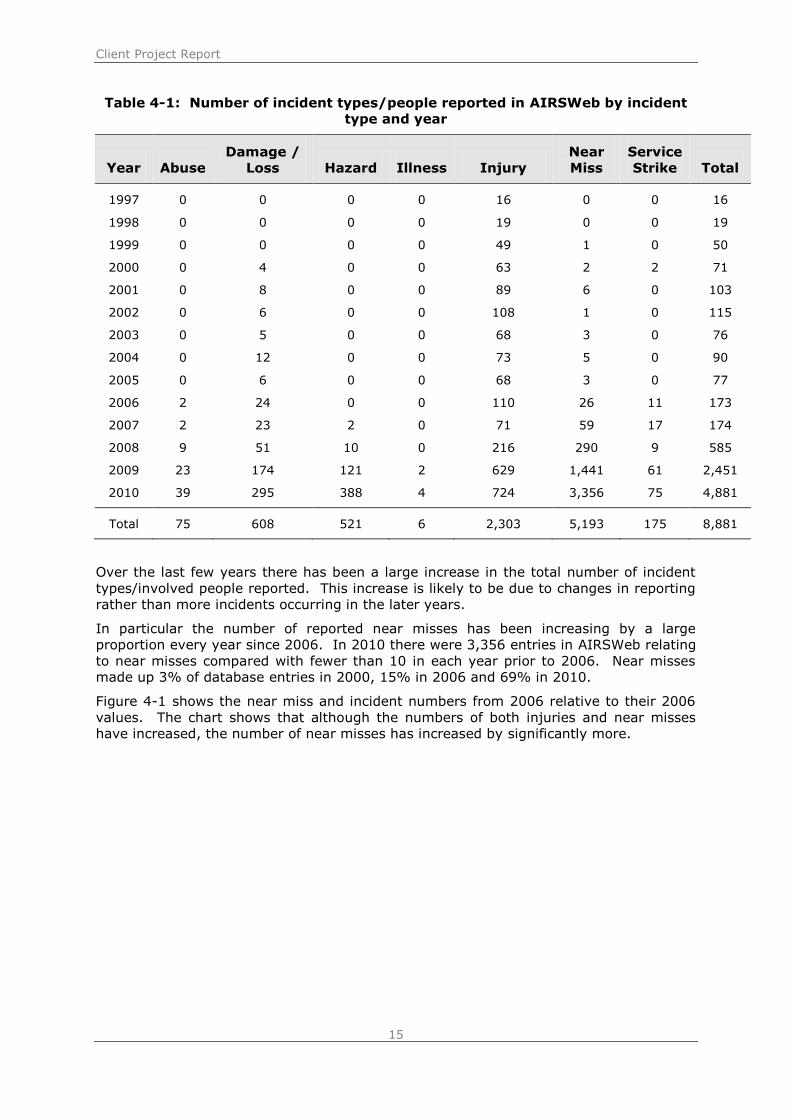
Table 4-1: Number of incident types/people reported in AIRSWeb by incident
type and year
Year Abuse
Damage /
Loss Hazard Illness Injury
Near
Miss
Service
Strike Total
1997 0 0 0 0 16 0 0 16
1998 0 0 0 0 19 0 0 19
1999 0 0 0 0 49 1 0 50
2000 0 4 0 0 63 2 2 71
2001 0 8 0 0 89 6 0 103
2002 0 6 0 0 108 1 0 115
2003 0 5 0 0 68 3 0 76
2004 0 12 0 0 73 5 0 90
2005 0 6 0 0 68 3 0 77
2006 2 24 0 0 110 26 11 173
2007 2 23 2 0 71 59 17 174
2008 9 51 10 0 216 290 9 585
2009 23 174 121 2 629 1,441 61 2,451
2010 39 295 388 4 724 3,356 75 4,881
Total 75 608 521 6 2,303 5,193 175 8,881
Over the last few years there has been a large increase in the total number of incident
types/involved people reported. This increase is likely to be due to changes in reporting
rather than more incidents occurring in the later years.
In particular the number of reported near misses has been increasing by a large
proportion every year since 2006. In 2010 there were 3,356 entries in AIRSWeb relating
to near misses compared with fewer than 10 in each year prior to 2006. Near misses
made up 3% of database entries in 2000, 15% in 2006 and 69% in 2010.
Figure 4-1 shows the near miss and incident numbers from 2006 relative to their 2006
values. The chart shows that although the numbers of both injuries and near misses
have increased, the number of near misses has increased by significantly more.

Client Project Report
16
Figure 4-1: AIRSWeb reported near miss and injury data relative to 2006
The incident types/involved people are further split in incident type subcategories, the
subcategories for incident type „injury‟ being:
Fatality-Riddor
Fatality-Other
Major Injury
Lost Time > 3 days
Lost Time ≤ 3 days
Injuries - First Aid
Injuries - Medical Treatment
Injuries - Self/Non treatment
MOP (member of public) taken from the scene to hospital
No indication is given (apart from in the text description) whether the fatalities are
members of the public or road workers.
4.1 Quality of data
Through analysis of the dataset it became apparent that a large proportion of the fields
are left blank / unknown. It is sometimes unclear from the data whether a blank record
means no, not present, not applicable or is just an unknown/unrecorded value.
For example, the fatal incident described in Section 3.6 was matched with the AIRSWeb
data. Whilst the incident description included references to traffic management and the
incident type was recorded as fatal, much of the other data relating to the TTM was left
blank.

Client Project Report
17
4.2 Analysis
Between 2006 and 2010 there were 6,920 injuries and near misses recorded in the AIRS
database. 5,170 (66%) of these were near misses. Two of the near misses were
recorded for incidents where there was also a reported injury; these two near misses
were therefore removed from the dataset.
5,537 (80%) of the 6,918 entries in the analysed dataset had no data recorded for the
field „was there scheduled works‟. 80% of the entries with valid data were recorded as
having scheduled works present.
Table 4-2 shows that 6,280 (91%) of the entries in the dataset had no value recorded
for „road works which part‟. 21% of the remaining entries took place on the live
carriageway. 56% were within the works area / safety zone, adjacent to a live
carriageway.
Table 4-2: Number of injuries and near misses by ‘road works which part’ and
year
Road Works Which Part 2006 2007 2008 2009 2010 Total
% of all
parts
On a live carriageway (i.e. open to traffic) 35 22 27 27 22 133 1.9%
On a hard shoulder 7 8 13 6 12 46 0.7%
On a not normally trafficked carriageway (e.g. chevroned area) 0 0 1 3 2 6 0.1%
In a central reservation 2 2 5 5 10 24 0.3%
Off carriageway (e.g. green field site) 16 30 8 6 10 70 1.0%
Within works area / safety zone ( adjacent to a live carriageway) 20 32 133 96 78 359 5.2%
Unknown 56 36 319 1925 3,944 6,280 90.8%
Total 136 130 506 2,068 4,078 6,918 100.0%
Table 4-2 shows the injuries that were received for each of the known categories above.

Client Project Report
18
Table 4-3: Number of injuries and near misses by ‘road works which part’
(where known) and injury type
Road Works Which Part
Fata
lity
-Oth
er
Fata
lity
-Rid
do
r
MO
P t
aken
fro
m t
he
scen
e t
o h
osp
ital
Majo
r I
nju
ry
Lo
st
Tim
e >
3 d
ays
Lo
st
Tim
e =
< 3
days
In
jurie
s -
Fir
st
Aid
In
jurie
s -
Med
ical
Treatm
en
t
In
jurie
s -
Self
/N
on
treatm
en
t
Near M
iss
To
tal
On a live carriageway (i.e. open to traffic) 1 4 31 3 11 1 3 3 4 72 133
On a hard shoulder 0 0 2 2 14 0 3 2 1 22 46
on a not normally trafficked carriageway (e.g. chevroned area) 0 0 0 0 0 0 0 0 0 6 6
In a central reservation 0 0 0 3 5 1 0 1 2 12 24
off carriageway (e.g. green field site 0 0 2 14 22 2 5 2 3 20 70
Within works area / safety zone ( adjacent to a Live carriageway) 1 6 10 18 38 7 5 13 9 252 359
Total 2 10 45 40 90 11 16 21 19 384 638
The text descriptions recorded for the five fatalities which occurred on a live carriageway
in the table above were as shown below. Three of the fatalities were members of the
public and two were road workers.

Client Project Report
19
Table 4-4: Incident descriptions for five fatalities which occurred on live
carriageway
Incident Description Description Of Contracted
Works
A 3 man TM crew were pre-laying equipment when they were struck from behind by a LGV.
The TM crew were pre-laying TTM equipment in preparation for a closure and diversion that was programmed to take place at a later date.
Gully cleaning works were being carried out in Lane 3 under the protection of a standard mobile lane closure. The operation had
commenced but the operation halted while the RCC were contacted and requested to set the matrix signs between the next junctions. While waiting for the matrix signs to be set the IPV was hit from the rear by two or three vans. The collision pushed the IPV into the central reservation safety fence with the driver incurring minor
injuries to the arms, neck, and back. The drivers of two of the vans
were killed, with the driver of the third van suffering a broken leg (2 fatalities)
Highway Maintenance
N/B vehicle within TM for works, collided with central barrier and veered to left. Went through TM which was closing off lane 1, over hard shoulder and travelled behind temporary varidguard barrier which was protecting bridge parapet. Vehicle then over turned and went over edge of bridge parapet dropping upside down onto verge
road below. Metal Fence post penetrated vehicle and killed rear seat passenger.
Replacement of Bridge Parapets following significant accident damage to Northbound parapet. New parapets to current standards
The collision was within the road works for [location] improvements. 2 vehicles collided the driver of one of the vehicles died at the scene, A passenger in the other vehicle was taken to hospital with serious injuries
On line widening / construction of structures
6,442 (93%) of the 6,918 entries had no value recorded for „which part of TTM‟. 76% of
those entries with valid values were recorded as „in, or alongside, main works area.
11% were recorded as within entrance taper.
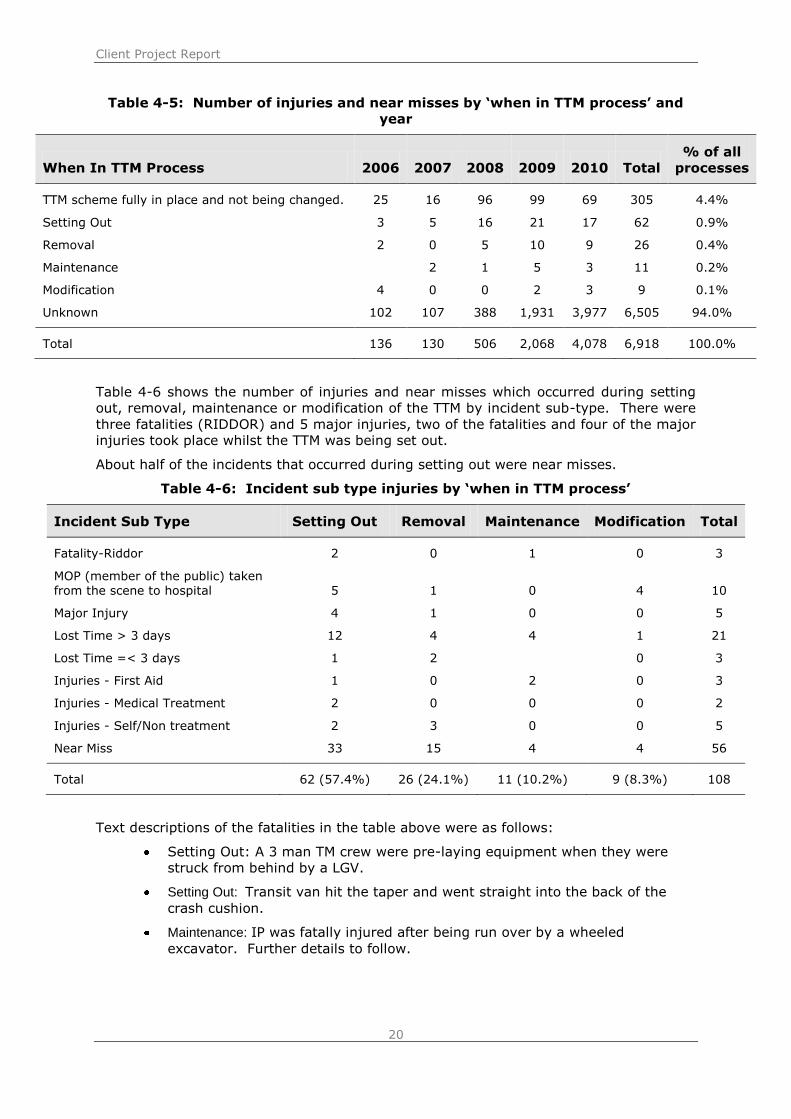
Table 4-5 shows the number of injuries and near misses by the field „when in TTM
process‟. 6,505 (94%) entries had no process recorded and 74% of the remaining
incident type injuries occurred when the TTM scheme was fully in place and not being
changed. 62 entries are recorded as having occurred as the TTM was being set out, and
26 during removal of TTM, however, these numbers are very likely to be underestimates
given the amount of unknown data.
Client Project Report
20
Table 4-5: Number of injuries and near misses by ‘when in TTM process’ and
year
When In TTM Process 2006 2007 2008 2009 2010 Total
% of all
processes
TTM scheme fully in place and not being changed. 25 16 96 99 69 305 4.4%
Setting Out 3 5 16 21 17 62 0.9%
Removal 2 0 5 10 9 26 0.4%
Maintenance
2 1 5 3 11 0.2%
Modification 4 0 0 2 3 9 0.1%
Unknown 102 107 388 1,931 3,977 6,505 94.0%
Total 136 130 506 2,068 4,078 6,918 100.0%
Table 4-6 shows the number of injuries and near misses which occurred during setting
out, removal, maintenance or modification of the TTM by incident sub-type. There were
three fatalities (RIDDOR) and 5 major injuries, two of the fatalities and four of the major
injuries took place whilst the TTM was being set out.
About half of the incidents that occurred during setting out were near misses.
Table 4-6: Incident sub type injuries by ‘when in TTM process’
Incident Sub Type Setting Out Removal Maintenance Modification Total
Fatality-Riddor 2 0 1 0 3
MOP (member of the public) taken from the scene to hospital 5 1 0 4 10
Major Injury 4 1 0 0 5
Lost Time > 3 days 12 4 4 1 21
Lost Time =< 3 days 1 2
0 3
Injuries - First Aid 1 0 2 0 3
Injuries - Medical Treatment 2 0 0 0 2
Injuries - Self/Non treatment 2 3 0 0 5
Near Miss 33 15 4 4 56
Total 62 (57.4%) 26 (24.1%) 11 (10.2%) 9 (8.3%) 108
Text descriptions of the fatalities in the table above were as follows:
Setting Out: A 3 man TM crew were pre-laying equipment when they were
struck from behind by a LGV.
Setting Out: Transit van hit the taper and went straight into the back of the
crash cushion.
Maintenance: IP was fatally injured after being run over by a wheeled
excavator. Further details to follow.

Client Project Report
21
4.3 Summary
AIRSWeb data were used to assess the number of road worker casualties associated with
various parts of their work. The number of incidents recorded in AIRSWeb has increased
significantly over the last few years, especially the number of near misses reported.
AIRSWeb contains many data fields relating to what TTM were present, where the
incident occurred in relation to the TTM and when in the process the incident occurred.
However, these fields are not completed for the majority of incidents. This means that
analyses of these fields in the AIRSWeb data are limited to those incidents where these
data are available, which may not be a representative sample of all incidents that
occurred.
The AIRSWeb data showed that there were 6,920 injuries and near misses reported
between 2006 and 2010, of which about two-thirds were near misses.
Where data were available:
133 (21%) injuries and near misses occurred on a live carriageway
359 (56%) occurred within the works area or safety zone (adjacent to the live
carriageway)
There were 12 fatalities where „road works which part‟ was known, 7 within
the works area and 5 on a live carriageway. The text description of the 5
fatalities on a live carriageway showed that 3 were members of the public.
62 injuries and near misses (15%) occurred during the setting out of TTM and
26 occurred during removal
There were 2 fatalities where „when in TTM process‟ was reported as „during
setting out and 1 which occurred during TTM maintenance. All three were
road workers.
This analysis supports the assertion that setting out and taking down of TTM represent
the most significant risks to road workers. This provides some context for the
development of the risk index, although the data from both AIRSWeb and STATS 19 did
not provide as much risk data as originally hoped.

Client Project Report
22
5 The Development of the MIRi Index
5.1 Current Practices for Temporary Traffic Management Procedures
The Traffic Signs Manual Chapter 8 (DfT, 2009) sets out clear guidance for temporary
traffic management (TTM) layouts for all roads, including high-speed roads such as those
on the Highways Agency network. Chapter 8 does not, however, specify the method
used to install the TTM schemes; this varies between Service Providers and traffic
management contractors as well as being influenced by the location in which the works
are installed.
Developing a suitable and effective MIRi Index required a full understanding of the
different methods used to install TTM. An understanding of operational procedures was
gained during meetings which were set up with key service providers such as Carillion
WSP, A-one+, Colas, HW Martin and Balfour Beatty Mott Macdonald to discuss
techniques used to install TTM and the methods employed by their subcontractors.
Method statements were gathered where possible from these contractors; in addition to
this, members from the TRL project team joined traffic management crews in several
Areas on the HA network and observed the TTM installation and removal. Observations
were undertaken on different road types (with and without hard shoulder) and for
different lane closures (nearside and offside).
Through discussions with service providers, reviewing associated methods statements
and observation of operational procedures on the network, a clear understanding of TTM
installation methods was gained. The key methods used in TTM installation have been
outlined in Appendix B (Current On-road Practices).
5.2 Phases of Temporary Traffic Management (TTM)
The basic MIRi Index applies to relaxation layouts for the setting out and removal of
advance signing and the entry taper on unlit dual carriageways with and without hard
shoulder. The full scope is in Appendix E
For the purposes of the development of the MIRi Index, TTM has been considered in five
key phases:
1. Installation of advanced signing
2. Installation of Detail A
3. Taper Installation
4. Taper Removal (including the removal of Detail A)
5. Removal of advanced signing
5.2.1 Installation of Advanced Signing
Currently, advanced signing for a relaxation layout consists of the workforce in road sign
(nearside only), road works 1 mile ahead and the 800yd, 600yd, 400yd and 200yd
wicket signs – all of which are installed on the off side and near side. All central reserve
sign installations require carriageway crossings, with the exception of remotely operated
signs (ROS) which are operated remotely from the nearside. ROS however, do need
carriageway crossings for initial installation, routine maintenance and repair. It must be
noted that Chapter 8 Plan DZA2 does not require a „road works one mile ahead‟ sign to
be installed on all-purpose dual carriageways where relaxations apply. However,
through discussions with contractors, it became apparent that the „1 mile ahead‟ sign is
installed regardless of the road type.
Fixed plate temporary signs are either secured with sand bags, ratchet straps (or
similar) or are barrier mounted. Where a relaxed closure is going to be repeated on

Client Project Report
23
consecutive nights, signs may be laid flat and secured with sandbags, to reduce
subsequent carriageway crossings. Some organisations use folding signs so the sign can
be folded shut when not in use.
Remotely operated signs can be installed if TTM is required for several consecutive
nights (generally more than 5 nights). Some areas of the motorway network have
preplaced remotely operated signs at strategic locations to be used during the
installation of TTM.
For a lane 2 or lane 3 closure with a hard shoulder, advanced signing is installed from
the hard shoulder. For a lane 1 closure, with no hard shoulder, the advanced signing is
installed from lane 1. For a lane 2 or a lane 3 closure with no hard shoulder, advanced
signing is installed from lane 1 for the workforce in road sign, road works 1 mile ahead,
800yd and 600yd wicket and typically from lane 2/3 for the 400yd and 200yd wicket.
The movement from the nearside to offside lane after the installation of the 600yd
wicket is to minimise the time a traffic management vehicle is conflicting with the wicket
message.
There are some key factors that influence the way in which advanced signing is installed
and therefore influence the risks associated with advanced sign installation. These
factors are:
Vehicle type. The risk level associated with advanced sign installation varies with
vehicle type due to different levels of impact protection, number of vehicles
required and the number of operatives involved. The vehicle types to be included
are as follows:
o Traffic Management Vehicle (TMV)
o Traffic Management Impact Protection Vehicle fitted with a lorry mounted
crash cushion (LMCC) device (TMIPV)
o Traffic management vehicle with a separate impact protection vehicle (TM
+ IPV)
Road Type. The method used to install advanced signing varies depending on the
road type, that is, whether or not there is a hard shoulder and the number of
lanes. Where a hard shoulder is present, advanced signing is installed from the
hard shoulder. Where there is no hard shoulder, the position of the vehicle will
depend on the closure type. The number of lanes will also affect the amount of
time that a road worker is exposed to the hazard of crossing a carriageway as it
takes more time to cross 3 lanes than 2 lanes.
Closure type. The position of the vehicle whilst installing advanced signing will
depend on whether lane 1 or lane 2/3 is being closed. This is only relevant where
there is no hard shoulder. For a lane 1 closure, with no hard shoulder, the
advanced signing is installed from lane 1. For a lane 2/3 closure with no hard
shoulder, advanced signing is installed from lane 1 for the workforce in road sign,
road works 1 mile ahead, 800yd and 600yd wicket and from lane 2/3 for the
400yd and 200yd wicket. Whilst the initial signs are being installed and the
vehicle is in lane 1, the position of the vehicle conflicts with the lane closure
information displayed on the wicket.
Sign type. There are numerous sign types, and the methods of installing and
fixing the signs depend on the contractor and the barrier present. The signs/
fixing methods being considered for the basic MIRi index are as follows:
o Fixing using sandbags/ sand bag bars on the sign A-frame
o Ratchet straps/ similar straps attaching the A-frame to a barrier or similar
o Laying signs flat for TTM on consecutive nights
o Remotely operated signs

Client Project Report
24
o Barrier mounted signs deployed in previously installed sockets
The reliability of remotely operated signs and the subsequent maintenance requirements
have been discussed with various contractors. The installation and maintenance has not
been considered for the basic MIRi index.
5.2.2 Installation of Detail A
Detail A (shown below) requires a 610 arrow above and behind 3 traffic cones on the
hard shoulder in line with the start and end of the taper on a lane 2 or 3 closure.
Figure 5-1: Components and location of Detail A
There are 2 core methods for installing Detail A:
Method DA1 Put up advanced signing
Put up detail A at start and end of taper.
Drive round link to start of temporary traffic management (TTM) and position in lane 2/3 for taper installation
Method DA2 Put up advanced signing
Move into lane 2/3 for taper installation
Walk detail A (x2) across carriageway onto hard shoulder
When considering the risk levels associated with the installation of Detail A, the following
factors must be considered:
Vehicle type. The type of vehicle used when installing Detail A is important as the
consequences of the passengers in the vehicle if it is struck by a road user will
vary depending on the vehicle type. The following vehicle types are considered:
o TMV (Method DA1 only as a TMV would not be in lane 3 without an IPV)
o TMIPV (Methods DA1 and DA2)
o TM + IPV (Methods DA1 and DA2)
The method of installation as detailed above. From discussions with contractors,
it is clear that there are numerous variations on the core methods used to install
Detail A. In some instances, Detail A is preplaced on the hard shoulder; in this
way Method DA2 does not require operatives to cross the carriageway carrying
the signs, cones and sandbags. Where an additional TM crew is available to
assist, the additional crew installs Detail A from the hard shoulder whilst the
initial crew installs the taper. For the basic MIRi index methods DA1 and DA2
have been considered as they are the most commonly used methods

Client Project Report
25
Road type. Detail A is only installed on carriageways where there is a hard
shoulder; therefore carriageways without hard shoulders have not been
considered. However, the number of lanes a road worker is required to cross will
affect the exposure duration to the hazard, therefore 2 and 3 lane carriageways
have been considered
5.2.3 Taper Installation
It is generally accepted that there are four main methods of taper installation.
Method TI1 Separate IPV and TMV, IPV follows the TMV into the closure
Method TI2 Separate IPV and TMV, IPV remains at start of taper
Method TI3 TMIPV
Method TI4 No vehicle in the lane to be closed, operative walk closure out.
The methods detailed above are currently used to install temporary traffic management
TTM. Typically, contractors have their preferred option but may use a variety of
techniques. For example, it may be a contractor‟s preferred option to use Method TI4
and walk the taper out from the hard shoulder but the same contractor may use one of
the other methods when a hard shoulder is not present.
When considering the risk levels associated with the installation of the taper, the
following factors were considered:
Method used; TI1, TI2, TI3 and TI4
Road type. It is important to know whether the carriageway has a hard shoulder
for several reasons, primarily because a TMV without an IPV cannot operate in
the live lane. In addition, lane 1 closures will be installed from the hard shoulder
where possible, which will therefore reduce the probability of being struck by a
vehicle
Closure type. The position of the vehicle will vary depending on whether a lane 1
or a lane 2/3 closure is being installed. A lane 1 closure with a hard shoulder will
be installed from the hard shoulder, whereas a lane 2/3 closure will be installed
from the live lane being closed where a crash cushion is present

Client Project Report
26
5.2.4 Taper Removal
The three main methods for taper removal are as follows:
Method TR1 Separate IPV and TM vehicles
Method TR2 Combined TM vehicle and crash cushion
Method TR3 No vehicle in lane, operatives walk in closure
It can be seen that there are three methods for taper removal compared with four for
taper installation. This is because whereas an IPV may follow a TMV into the closure for
taper installation, it will not reverse with the TMV to collect cones. The IPV will instead
remain at the start of the taper. When considering the risk levels associated with taper
removal the following factors were considered:
Method used; TR1, TR2 or TR3.
Road type. A lane 1 closure taper will often be removed from the hard shoulder
where present, thus reducing the probability of being struck by a vehicle. Method
TR3 cannot be conducted on carriageway without a hard shoulder as it would
require a TMV without IPV to be in the live lane. Therefore it is necessary to
distinguish between carriageways with and without hard shoulders.
Closure type. The type of closure will change the position of the vehicle and
therefore the probability of being struck and the severity of the consequences.
5.2.5 Advanced Sign Removal
Advanced signs are removed using the same method as advanced sign installation. It is
likely that traffic flows may be different from advanced sign installation depending on the
time of removal. Traffic flows and operation times have not been considered in the basic
MIRi index, where it has been assumed that flows are less than 1200 vehicles per hour
per lane and remain constant. Therefore it is assumed that the risks associated with
advanced sign removal are the same as those associated with advanced sign installation.
The different variables for each of the phases of temporary traffic management (TTM)
installation (that is road type, method used, vehicle type, equipment used etc) can be
seen in Appendix C (Variables).
5.3 Task Analysis
One of the aims of the MIRi Index is to create a tool that can demonstrate the influence
of safety initiatives on the MIRi Index value. It may be that future initiatives concern
part of a task or the operations of one of the crew members. Therefore it was essential
to separate the tasks involved in temporary traffic management (TTM) installation and
removal into subtasks for the TM crew and then by individual TM operative member.
This subtask analysis was supported by information received from contractors during
discussions, method statements and observations of TTM installation on the HA network.
The exact methods used do vary between contractors. For example one contractor may
cross the carriageway carrying the sign and stand together whilst another may carry
them separately. The roles of crew members also vary between contractors, with the
key difference being the role of the TMIPV driver. Some contractors require the driver to
remain in the vehicle throughout the TTM installation, whilst others require the driver to
get out of the vehicle and assist in the installation. Using the varying practices outlined

Client Project Report
27
for each of the phases of TTM, there are 181 variations. It was necessary, for
practicality) to limit the permutations and ensure that common practices were indexed,
thus the following assumptions were made:
Two crew members are required to install a barrier mounted sign. One to install
and one to act as „look out‟. Signs and stands are crossed over the carriageway
separately.
Two crew members are required to carry sufficient sandbags to fix the sign. The
driver of the IPV remains in the vehicle at all times.
The driver of a TMV or TMIPV assists with the TTM installation.
The vehicle driver installs signs on the verge/ hard shoulder whilst the other two
crew members install signs on the off side.
The installation, repair and maintenance of remotely operated signs have not
been considered.
Signs and cones can be unloaded from either side of the vehicle, meaning that
equipment is always loaded and unloaded away from live traffic.
An example of the breakdown of tasks into subtasks and roles of crew members can be
seen in Appendix D (Substasks).
5.4 Development of the MIRi Index
Risk is defined as „the probability or exposure to a hazard, combined with the
consequences of such exposure‟. Traditional risk matrices combine the likelihood of an
event occurring with the severity of the consequences to calculate a risk level. This risk
level can then be used to determine whether the level of risk is tolerable. For example,
the following risk matrix is outlined in BS8800: Guide to Occupational Health and Safety
Management Systems:
Slightly Harmful Harmful Extremely Harmful
Highly Unlikely Trivial Risk Tolerable Risk Moderate Risk
Likely Tolerable Risk Moderate Risk Substantial Risk
Unlikely Moderate Risk Substantial Risk Intolerable Risk
In this case, there are five different levels of risk for different likelihood and severity
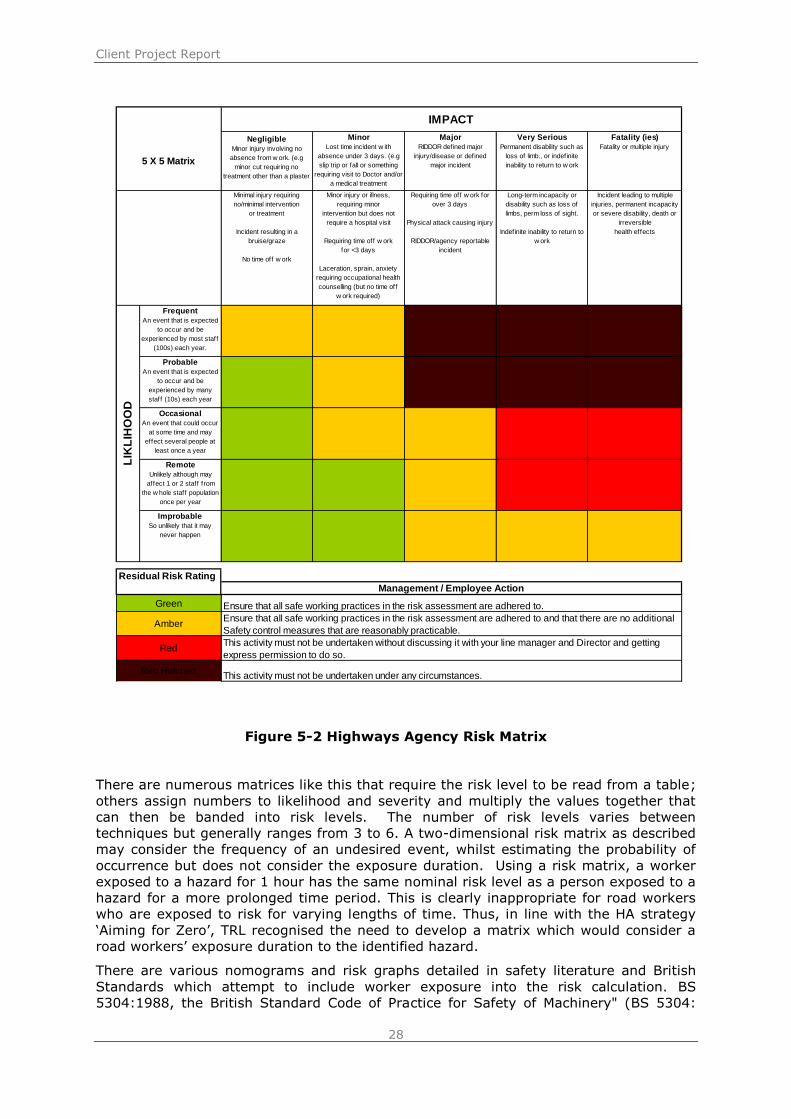
consequences. The HA currently use a five by five matrix but only four risk levels (Figure
5.2). Other matrices may have three levels in line with the HSE Tolerability of Risk
Criteria (2001); that is an unacceptable region, tolerable region and broadly acceptable
region.
Client Project Report
28
Figure 5-2 Highways Agency Risk Matrix
There are numerous matrices like this that require the risk level to be read from a table;
others assign numbers to likelihood and severity and multiply the values together that
can then be banded into risk levels. The number of risk levels varies between
techniques but generally ranges from 3 to 6. A two-dimensional risk matrix as described
may consider the frequency of an undesired event, whilst estimating the probability of
occurrence but does not consider the exposure duration. Using a risk matrix, a worker
exposed to a hazard for 1 hour has the same nominal risk level as a person exposed to a
hazard for a more prolonged time period. This is clearly inappropriate for road workers
who are exposed to risk for varying lengths of time. Thus, in line with the HA strategy
„Aiming for Zero‟, TRL recognised the need to develop a matrix which would consider a
road workers‟ exposure duration to the identified hazard.
There are various nomograms and risk graphs detailed in safety literature and British
Standards which attempt to include worker exposure into the risk calculation. BS
5304:1988, the British Standard Code of Practice for Safety of Machinery" (BS 5304:
Minimal injury requiring
no/minimal intervention
or treatment
Incident resulting in a
bruise/graze
No time off w ork
Minor injury or illness,
requiring minor
intervention but does not
require a hospital visit
Requiring time off w ork
for <3 days
Laceration, sprain, anxiety
requiring occupational health
counselling (but no time off
w ork required)
Requiring time off w ork for
over 3 days
Physical attack causing injury
RIDDOR/agency reportable
incident
Long-term incapacity or
disability such as loss of
limbs, perm loss of sight.
Indefinite inability to return to
w ork
Incident leading to multiple
injuries, permanent incapacity
or severe disability, death or
irreversible
health effects
Probable An event that is expected
to occur and be
experienced by many
staff (10s) each year
Frequent An event that is expected
to occur and be
experienced by most staff
(100s) each year.
LIK
LIH
OO
D
Improbable So unlikely that it may
never happen
Remote Unlikely although may
affect 1 or 2 staff from
the w hole staff population
once per year
Occasional An event that could occur
at some time and may
effect several people at
least once a year
Minor Lost time incident w ith
absence under 3 days. (e.g
slip trip or fall or something
requiring visit to Doctor and/or
a medical treatment
Major RIDDOR defined major
injury/disease or defined
major incident
Very Serious Permanent disability such as
loss of limb., or indefinite
inability to return to w ork
Negligible Minor injury involving no
absence from w ork. (e.g
minor cut requiring no
treatment other than a plaster
IMPACT
5 X 5 Matrix
Fatality (ies) Fatality or multiple injury
Management / Employee Action
Ensure that all safe working practices in the risk assessment are adhered to.
Ensure that all safe working practices in the risk assessment are adhered to and that there are no additional
Safety control measures that are reasonably practicable.
This activity must not be undertaken without discussing it with your line manager and Director and getting
express permission to do so.
This activity must not be undertaken under any circumstances.Red Hatched
Residual Risk Rating
Green
Amber
Red

Client Project Report
29
1988) included a nomogram with three scales: potential severity of injury, probability of
injury and exposure time ranging from minutes to days. Similarly the BSEN 954-1 Risk
Graph considers probability, severity and exposure. When probability of occurrence is
multiplied by the highest foreseeable severity, the outcome is an overestimation of risk.
Interestingly, this risk graph requires „usual‟ consequences to be selected as opposed to
the more standard „worst‟ consequences. In 1989 a risk calculator was developed
(Raafat, 1995) that provided a tool for the ranking of risks resulting from work
machinery and equipment. This calculator considers the probability of an event
occurring ranging from 1 in 10 to 1 in 1 million; the frequency and duration of exposure
to the hazard ranging from very rare (1%) to continuous exposure (100%) and the
potential severity of injury/ damage measured on a scale ranging from minor loss to
multiple fatalities.
These graphs and calculators have primarily been developed for the rapid screening of
risks associated with machinery and allow risks to be ranked in terms of high, medium
and low.
The MIRi Index, on the other hand, needed to consider factors such as probability,
exposure duration and consequence severity to allow meaningful comparisons of risk
levels to be made. When developing the MIRi index, the following factors were
considered:
1. Probability levels. Typically probability scales used within risk management tools
range from 1 in 10 (frequent) to 1 in 1,000 000 (extremely remote). The accident
data analysis in sections 3 and 4 showed that road worker injury is an infrequent
event. Using a typical scale, the risks being calculated for a road worker would
largely fall within the lower categories of the scale, resulting in risks being ranked
using only a small amount of the scale. It was considered to be more appropriate
to create a scale that would allow probabilities to be ranked using the full length
of the scale to allow for greater variation and improve the resolution of the index.
Accident data exists for incidents that have occurred during the installation of
temporary traffic management (TTM) but there is insufficient data to create
quantitative probability for each of the subtasks. Therefore, it was considered to
be appropriate to create a scale where the probability of being struck by a vehicle
for each of the subtasks could be ranked relative to other probabilities, rather
than on a predetermined scale of absolute probability.
2. Exposure to the hazard. The exposure scale on the BS 5304:1988 nomogram
range from 1 minute to 5 days on a logarithmic scale. One of the key elements of
the MIRi index is to be able to demonstrate the risk reduction a future safety
initiative creates. An initiative may reduce road worker carriageway crossings by
2, which over a 3 lane motorway may account to 18 seconds exposure reduction.
It was therefore important to create a scale where a few seconds difference in
exposure would create a noticeable risk level change. A logarithmic scale was
developed that would allow for a time range from a few seconds to several hours
to be included on the same scale.
3. Consequences. The Abbreviated Injury Scale (AIS) 2005 was considered as the
basis for the consequence severity scale. However the AIS is more appropriately
used to categorise injuries of people who have already been involved in an
accident. The MIRi index needed to be developed as a proactive tool to allow
future risk decisions to be evaluated. Therefore it was considered to be most
appropriate to use existing HA severity descriptions that are used within the
current HA risk matrix. As detailed in Section Two, TRL has expert knowledge of
the likely consequences for vehicle occupants and pedestrians from vehicle
impact testing, accident studies and research. This knowledge was used to
determine likely consequences of vehicle impact as opposed to highest
foreseeable severity. Of key consideration was the effect of vehicle type on road
worker risk and the mechanism by which an impact could occur between a worker

Client Project Report
30
and a vehicle. This suggested that the risk for road workers on the hard shoulder
would be greater than that for road workers in offside lanes of the live
carriageway, as the likelihood of an HGV encroaching into the hard shoulder and
the front corner of the vehicle striking a road worker would be greater due to the
significant proportion of HGVs in the nearside lane.
4. Risk level. For the MIRi index, it was considered to be important to be able to
categorise risks into more than 3 levels, so that movement between levels after
the implementation of safety initiatives could be easily demonstrated. In addition
to this, risks levels needed to be calculated for individual subtasks and traffic
management operative members and then combined to create overall risk levels
for each task and method. A scale was created with numbered levels to allow the
effectiveness of risk reduction measures to be easily demonstrated and to allow
combination of individual risk scores into overall risk level values.
Example use of the MIRi calculator
Figure 5-3: Example use of the MIRi calculator
Figure 5.3 shows the MIRi calculator with input parameters of probability level 90, time
of exposure to hazard of 12 seconds, with a consequence of a fatality. The MIRi risk level
for these conditions is 267.
1
3
7
20
55
148
403
148
55
20
7
3
1 Multiple Fatalities VI
Fatality V
Severe IV
Major III
Minor II
Insignificant I
1
2
5
13
36
99
Probability Level Exposure to hazard Tie line Consequences Risk

Client Project Report
31
Figure 5-4 Example use of the MIRi calculator
Figure 5-4 shows what happens if the consequence of the hazard occurring is reduced
from a fatality to a minor injury. In this set of circumstances, for a probability level of
90, with an exposure time to hazard of 12 seconds, the MIRi value is 13.
5.5 Populating the MIRI Index
Detailed research into the installation of temporary traffic management (TTM) revealed
that it is a vast subject area with an almost infinite number of operating practices,
equipment types and personal preferences. It was important for the basic MIRI index to
set a suitable scope that allowed baselines and index scores to be calculated for „typical‟
TTM installations but still allowed for future indices to be calculated for more „less typical‟
and more in depth methods of TTM installation. The population of each of the 3
dimensions of the MIRi index is outlined below. Scope and assumptions for each
dimension can be seen in Appendix E (Scope and Assumptions).
5.5.1 Probability levels
The probability of being struck by a vehicle varies depending on the task the road worker
is conducting. For example, during advanced sign installation the probability of being
struck by a vehicle may be different when installing a sign than when the sign is being
unloaded from the vehicle. Similarly the probability of being struck by a vehicle is
1
3
7
20
55
148
403
148
55
20
7
3
1 Multiple Fatalities VI
Fatality V
Severe IV
Major III
Minor II
Insignificant I
1
2
5
13
36
99
Probability Level Exposure to hazard Tie line Consequences Risk

Client Project Report
32
different for the operative member waiting in the IPV than the operative member waiting
to cross the carriageway with sandbags.
Appendix D shows a detailed example of the subtasks. For example, the subtasks for
taper installation, when using a separate traffic management vehicle (TMV), with the
impact protection vehicle (IPV) are:
TMV and IPV stop on hard shoulder at start of taper.
Unload 610 arrow, stand and sandbags
Install sign at start of taper
TMV and IPV travel along hard shoulder dropping cones from non-trafficked side
of the vehicle at appropriate spacings
TMV and IPV stop on hard shoulder at end of the lane closure
Operatives walk back along hard shoulder to start of taper
Walk cones and lights out from hard shoulder to form the taper
Install 610 arrow sign at end of taper
Probability data was obtained using a combination of professional judgement and expert
knowledge. The experience of traffic management specialists was used to guide and
advise the ranking of tasks via a focus group. The focus group ranked all of the subtasks
for each of the phases of TTM installation based on the probability of being struck by a
vehicle whilst conducting that subtask. The subtasks were considered separately for
different carriageway types including:
3 lane carriageway with hard shoulder off side closure
3 lane carriageway with hard shoulder, near side closure
2 lane carriageway, no hard shoulder, off side closure
2 lane carriageway, no hard shoulder, near side closure.
The effect of vehicle type, equipment, and TM operative role on probability levels was
also considered.
All subtasks were assigned a probability level. These probability figures were verified
using information gained through discussions with contractors during site visits and
observations on the network.
5.5.2 Exposure to the hazard
The exposure times for the MIRI scale were calculated primarily through timing the
subtasks during observations whilst on the network. Subtasks which were not observed
were discussed with TM experts and exposure times estimated based on expert and
operational knowledge.
5.5.3 Consequences
The HA definitions of consequence severity were used to categorise the consequence
severity of being struck by a vehicle. The HA categories are as follows:
I. Negligible: Minor injury involving no absence from work (e.g. minor cut
requiring no treatment other than a plaster)

Client Project Report
33
II. Minor: Lost time accident with absence under 3 days (e.g. slip, trip, fall or
something requiring visit to doctor and or medical treatment)
III. Major: RIDDOR defined major injury/ disease or defined major incident
IV. Very Serious: Permanent disability such as loss of limb, or indefinite inability
to return to work
V. Fatality: fatality or multiple injuries
An additional level VI, „multiple fatalities‟, was added to these categories to ensure the
MIRi Index can calculate catastrophic consequences, should this be required in the
future. This “future proofing” of the MIRi Index was included, as it was identified early on
in the index development that an advanced index may be required in the future to
assess additional risks not included in the basic index. This would include, for example,
the risk to road workers laying the longitudinal, working in the coned off area or working
at the side of the hard shoulder. Section 6 explores the advanced MIRi Index
requirement in more detail.
Although accident data does exist for TTM installation accidents, there have not been
enough accidents to provide detailed consequence severity data for each of the identified
subtasks. Therefore, subtasks were assigned a consequence severity rating based on
experience and knowledge of vehicle crash testing, high speed road networks and
accident investigation
5.5.4 Risk Levels
The risk levels calculated allowed comparison of methods of installation by road type.
Calculating the risk levels allowed the highest risk activities to be identified and targeted,
to allow risks to be eliminated or reduced at source. The MIRI Index also allows safety
improvements to be demonstrated clearly through the reduction of the risk levels.
5.6 Calculation of the Benchmark MIRI Index
For each of the TTM variables listed in Appendix 5, the sub task list was populated with
the appropriate probability value, exposure to hazard time (in seconds) and consequence
category. The risk value was calculated for each of the subtasks and risk values for each
variable were then combined to give a total MIRi value for each method of TTM
installation.
The MIRi value for each of the four current methods TTM installation was averaged to
give the benchmark MIRi value. Table F-1

Client Project Report
34
6 Discussion
The accident data examination exercise carried out for this task indicated there was a
scarcity of data suitable for quantification of risk. Near-miss reports are unfortunately
subjective (as there is no centrally agreed and defined reporting criterion for near-
misses) and as such should only be considered indicative. The injury accident data
available comprised higher severity injuries. It is unlikely that this is due to under-
reporting of RIDDOR reportable accidents, which suggests that when a road worker is
involved in an injury accident the severity of that accident is likely to be high.
The investigation into injury outcome confirms this suggestion from the accident data
study, namely when road workers are struck by vehicles the injury consequences are
severe or fatal. The injury outcome work also provides a speed/injury relationship that
can be used to understand the consequence of impact; this allows the relative risk of
being struck by a large vehicle (such as a HGV) or a lighter vehicle (such as a car) to be
taken into account when determining risk. Understanding this speed/injury relationship
leads to the (perhaps) slightly counter-intuitive position whereby the risk from impacting
vehicles is greater for workers on the hard shoulder than in the central reservation. This
would not be apparent without considering the injury risk associated with the proportion
of large vehicles in Lane 1 compared to Lane 3.
The risk to road workers on the hard shoulder would appear at first instance to be lower
than for workers in the offside lane of a carriageway. However, if the injury criteria are
taken into consideration the risk to road workers on the hard shoulder from heavy
vehicle encroachments into the hard shoulder would cause a greater risk of serious or
fatal injury compared to an impact with a lighter vehicle such as a car. Thus the risk for
road workers on foot on the hard shoulder was considered to be greater than for those in
the offside lane. This also suggests that risk to road workers operating on foot on the
hard shoulder should be considered more fully once the key risks to road workers such
as carriageway crossings and operating in live lanes are fully understood. This could be
approached via a more advanced version of the MIRi Index applied to all road workers
that would ensure the risks associated with on-road operations by any road worker
(including recovery operatives) could be fully quantified and understood.
Similarly, the data from the accident study indicate that the risk to road workers is
greatest from setting out and taking in road works. When near-misses are taken into
account from AIRSWeb data, the data indicate that over 75% of all reported accidents,
incidents or near-misses involved a road worker either setting out or removing traffic
management. When examining the two activities in further depth, it appears that setting
out is the higher risk activity, with over 50% of all reported accidents, incidents or near-
misses associated with setting out operations. This is reasonably intuitive, as the
situation of taking a live carriageway containing high-speed traffic and closing part of it
would be expected to carry a higher risk than reopening a closed portion of that
carriageway.
These indications provide a sound foundation for the development of the MIRi Index. The
speed/injury relationship is not directly applicable to the basic index but as described
above will provide a significant input parameter to any enhancements necessary to
develop an advanced MIRi Index. Any advanced index would need to consider the risk to
all road workers (as opposed to just traffic management operatives) from passing traffic,
taking into consideration the type of vehicle and potentially the traffic flow and
composition. The consideration of speed/injury risk will form a key part of the index,
together with risk exposure duration and proximity to the live traffic. More detailed
considerations of the advanced MIRi Index are presented in Appendix A

Client Project Report
35
The complexity of traffic management operations presented a particular challenge when
constructing the MIRi Index. It is true to say that there is no such thing as a “standard”
technique for deployment of traffic management nor any “approved” method that is
required by the HA. While guidance on traffic management layouts is provided in the
Traffic Signs Manual Chapter 8 Part 1: Design, this is a performance specification and
does not prescribe how the traffic management should be installed. Similarly, the Manual
of Contract Documents for Highway Works Volume Volume 1 Section 117 (MCHW, 2006)
sets out compliance with the requirements of Chapter 8 as a contract condition but only
specifies that “The Contractor shall … provide, erect, maintain, reposition, cover and
uncover and finally remove traffic signs as required by the Works. In so doing, such
other measures shall be taken by the Contractor as may be necessitated by the Works in
accordance with … recommendations in Chapter 8 of the Traffic Signs Manual published
by The Stationery Office”.
This defines the outcome required from the contractor in terms of traffic management
that complies with the layouts specified in the Traffic Signs Manual Chapter 8. It does
not, however, specify the operational technique required to install and remove these
layouts, which presented a particular technical challenge for this task.
Previous work had been undertaken for the HA in an attempt to determine the basic
methods used by the Supply Chain to install and remove traffic management. This work
significantly predated the „Aiming for Zero‟ road worker safety initiatives and thus a
number of changes had been introduced over the intervening years that made the
previous work not representative of current practice. As a consequence, the range and
variation in traffic management techniques encountered in this task necessitated
development of a number of generic technique definitions (as described in Section 5)
based on a series of base assumptions (documented in Appendix E).
These generic techniques provided a framework to calculate MIRi Index values but in
themselves provide valuable information into techniques used for traffic management.
Examination of these techniques indicates that the risk associated with deploying even
one type of traffic management layout varies considerably. For example, considering the
baseline MIRi Index value, Table 6-1 shows the baseline value for an offside lane closure
is obtained from a significant range of individual values and involves a varying number of
carriageway crossings:
Traffic management method MIRi Index
Offside lane closure benchmark value 256259
TM+IPV, IPV following 240321
TM + IPV 231337
TMIPV 264043
TM 289336
Table 6-1 MIRi Index for a Chapter 8 (diagram DZB3) relaxation layout for an
offside closure
The significantly greater MIRi Index value for the last technique in the list comes from
the increased carriageway crossings associated with installation of the entry taper from
the hard shoulder. However, the three other techniques share the same number of

Client Project Report
36
carriageway crossings but there is still a variation of 32,706 between the highest and
lowest MIRi Index values that share a common number of carriageway crossings. This is
primarily due to the different levels and durations of exposure to risk within the different
methods rather than the number of crossings of the carriageway.
This indicates that while reduction in carriageway crossings is a potential indicator of a
lower MIRi Index value, it is not the sole indicator nor can it be assumed that a zero
carriageway crossing value will result in the lowest possible MIRi Index value. This point
is further illustrated by the comparison between the TTM Sign Simplification and the
Offside Sign Relaxation examples for a nearside lane closure.
The TTM Sign Simplification approach of removing the 600 yard and 200 yard wicket
signs decreases the MIRi Index value by 34,800. This gives a range of MIRi values for
the various techniques from 178274 (TMIPV) to 217351 (TM+IPV).
For the offside signs relaxation there are no carriageway crossings and the MIRi value
drops by 59390. This, on first inspection, would suggest that the offside signs relaxation
technique will always be superior to the TTM sign simplification technique as it eliminates
all carriageway crossings. However, there is a significant overlap in the range of MIRi
Index values for the offside signs relaxation significant versus the TTM Sign
Simplification values, as the chart below shows:
Figure 6-1 Overlap of MIRi Index values with various interventions
Thus, while it is possible to state that for the same method (e.g. installation from a
TMIPV) elimination of carriageway crossings should achieve a relative reduction in MIRi
Index value, cross-technique comparison indicates this generalisation cannot and should
not be applied to absolute MIRi Index values.
This also demonstrates that the base method of TM deployment and retrieval is critical to
driving down risk and thus achieving the lowest overall MIRi Index value. The base
method has a significant effect on the absolute score and can result in techniques
involving carriageway crossings having a lower MIRi Index than those which do not.
150
170
190
210
230
250
270
None TTMSS OSSR
MIR
i In
de
x va
lue
(th
ou
san
ds)
Risk reduction innovation

Client Project Report
37
A proper understanding of the base MIRi Index value for any particular technique is
critical to achieving the greatest safety improvement. Significant decreases in MIRi Index
can be achieved simply by changing the generic method. While it is recognised this has
practical limitations due to vehicle fleet and operational procedure issues, this approach
could realise a significant risk reduction depending on the nature of the change in
technique applied.
Figure 6-2 shows the effect of changing between the four generic methods for
installation of an offside lane closure:
New method for installing an offside lane closure
Original
method
for
installing
an
offside
lane
closure
TM + IPV TM + IPV (f) TMIPV TM
TM + IPV no change
+8984
(+4%)
+32706
(+14%)
+57999
(+25%)
TM + IPV
following
-8984
(-4%) no change
+23722
(+10%)
+49015
(+20%)
TMIPV -32706
(-12%)
-23722
(-9%) no change
+25293
(+10%)
TM -57999
(-20%)
-49015
(-17%)
-25293
(-9%) no change
Figure 6-2 Effect of changing generic method of installation of TTM on MIRi
Index
Although the magnitudes of the numerical changes between the methods are identical,
varying only in sign (e.g. -57,999 versus +57,999), comparison of these with the base
methods result in different percentage values. For example:
TM+IPV changing to TM vehicle only (numerical change +57999): Base MIRi Index for TM+IPV = 231337 (from Table 6.1 above) Percentage change = 57999 ÷ 231337 x 100 = 25.0%
Thus, if the current method is a TM vehicle, shifting to a TM vehicle with separate IPV
will reduce risk by 20% but moving to using a TMIPV would only realise a 9% risk
reduction. Similarly, if a company using a TMIPV chose to move to a TM + IPV
arrangement this would decrease the MIRi Index score by 12% compared to their
current situation; moving to a TM vehicle alone would also increase the score, but only
by 10%.
It should be noted that this change in method matrix shown in Figure 6-2 applies only to
an offside lane closure. Different matrices could be developed using the base data for
other conditions and specific methods or sub-methods.
Change in method thus has the potential to achieve MIRi Index reductions of up to 20%.
In addition, changing methods also has the potential to reduce carriageway crossings
significantly. For example, considering the MIRi Index values for installation of an offside
taper (from Table 6-2):
TM vehicle only changing to TM + IPV (numerical change -57999): Base MIRi Index for TM vehicle only = 289336 (from Table 6.1 above) Percentage change = 57999 ÷ 289336 x 100 = 20.0%

Client Project Report
38
Technique Carriageway Crossings
TM + IPV 99
TM + IPV, IPV following 99
TMIPV 99
TM 162
Table 6-2 Carriageway crossings for an offside relaxation closure for the
different generic methods
Hypothetically, if the view is taken that the only unavoidable carriageway crossings are
those associated with installation of advanced signing (notwithstanding the benefits to
be gained from TTM sign simplification or offside signs relaxations), then the number of
carriageway crossings in all techniques will decrease to 99. Estimating the effect of this
change is difficult as there is a scarcity of data on exactly which technique is used for
installation of specific road works TTM, which presents an issue in calculating any
benchmark index for all TTM operations across the HA network.
It is possible to obtain details of which specific TTM contractor has installed each set of
road works on the network from the Schedule of Road Works maintained by the HA.
However, this information is only part of the data required to calculate the total risk
exposure and likely number of carriageway crossings. Without the knowledge of which
technique is used by which contractor (and, where more than one technique could be
used by a specific contractor which is most likely to have been used) it is impossible to
calculate or estimate a benchmark value with any accuracy. Such data would be required
for the calculation of an advanced MIRi Index value, but falls outside of the scope and
requirements of the basic index.
If, however, it is assumed for the sake of this hypothetical example each technique
accounts for 25% of the total relaxed TTM operations on the network, then only
permitting carriageway crossings associated with the installation of advanced signing
would drop the average number of carriageway crossings for installation of an offside
lane closure by 17%. This is, perhaps, a generous figure insofar as it assumes that 25%
of offside lane closures are installed using a TM vehicle alone.
However, even if the technique where the taper is installed from the hard shoulder is
only used 15% of the time, restricting carriageway crossings to advance signing only
would still yield a reduction in carriageway crossings of 11%.
Although this approach is only given as an example, it indicates how the MIRi Index can
be used to calculate where initiatives can contribute to achieving a substantial reduction
in carriageway crossings in support of HA targets. It should be pointed out that the TM
vehicle technique carries the greatest risk for installation of a taper in an offside lane
because the vehicle cannot be used to provide protection for the workers, necessitating
their crossing the carriageway to install the taper. However, where a nearside lane taper
is installed from the hard shoulder and carriageway crossings are not required the risk
from the TM vehicle technique has a comparable (and in some cases lower) risk than the
other techniques examined.
In terms of the benefits achievable at present from changing methods of installation of
road works, the TTM sign simplification and offside signs relaxation approaches offer
perhaps the best opportunity to reduce carriageway crossings and reduce risk to road
workers. The TTM sign simplification (omission of Detail „A‟ plus 600 yard and 200 yard
advance signing) can achieve a 52% reduction in carriageway crossings for installation of
an offside lane taper. This applies for all techniques except the TM vehicle method,

Client Project Report
39
where the reduction in carriageway crossings is only 28% due to the influence of the
carriageway crossings required to install the taper.
Using the same proportions as before (i.e. 15% of closures installed using the TM vehicle
method), national adoption of the TTM sign simplification technique would reduce
carriageway crossings by around 45%.
Looking at offside sign relaxations is slightly more difficult as this technique can only be
applied for nearside lane closures, unlike the sign simplification technique which could be
applied at all relaxed road works. Additionally, when claiming benefits it is not possible
simply to add the reductions in carriageway crossing percentages as the percentage
reduction is a relative and not an absolute measure. It is also necessary to consider
whether benefits are genuinely cumulative (i.e. initiatives are complementary) or
whether one initiative will effectively replace part or all of another, thus reducing the
benefit realised from it.
However, with some modelling it is possible to calculate the overall cumulative effect.
For the sake of this worked example, the following assumptions have had to be made:
Relaxed works only will benefit from changes in technique
80% (estimated) of relaxed works are offside lane closures
Remaining 20% of relaxed works are nearside lane closures
15% of closures are installed using a TM vehicle
25% of closures are installed using a TM vehicle + IPV following
25% of closures are installed using a TM vehicle + IPV
35% of closures are installed using a TMIPV
Thus, in Scenario 1, the benefit of TTM sign simplification (TTMSS) is realised nationally
on 100% of relaxed works
This achieves a reduction in MIRi Index for both nearside lane closures and offside lane
closures from the application of the TTMSS technique. As offside lane closures represent
the majority of closures in this worked example, the change in MIRi Index and
carriageway crossing value are dominated by the benefits to the offside lane closure
situation.
Scenario 1: TTMSS only - MIRi Index reduction: 19%
Scenario 1: TTMSS only - carriageway crossing reduction: 46%
In Scenario 2, the benefit of TTMSS is again realised nationally on 100% of relaxed
works but the additional benefit of offside signs relaxation (OSSR) is realised on any
nearside lane closures. This results in the benefit realised from TTMSS on nearside lane
closures being removed and replaced instead with the benefit from OSSR. For offside
lane closures, the benefit from TTMSS remains.
As offside lane closures represent the majority of closures in this worked example, the
additional benefit from introducing OSSR in terms of MIRi Index reduction is only 2%.
The carriageway crossings benefit is limited as crossings can only be eliminated in 20%
of closures, which provides an additional 9% of carriageway crossing reductions
compared to the original baseline.
Scenario 2: TTMSS + OSSR - MIRi Index reduction: 21%
Scenario 2: TTMSS + OSSR - carriageway crossing reduction: 55%

Client Project Report
40
Comparing this approach with the 100% reduction in carriageway crossings achievable
from the offside signs relaxation and the 45% reduction in carriageway crossings from
TTM sign simplification shows that new initiatives may not always deliver the huge
reductions in carriageway crossings that they may at first sight promise to deliver. The
key element is uptake i.e. how often will the new approach be used and thus realise its
benefits? This is critically dependent on opportunities to apply the new technique, which
is in turn dictated by the Schedule of Road Works. As shown in the example, the
relatively small number of nearside lane closures leads to a relatively small additional
benefit being realised from the offside signs relaxation technique.
Better estimates for the effectiveness of cumulative interventions could be made with
greater knowledge of the types of road works carried out. Sensitivity analysis of the
model used to prepare the worked example shows for each 10% increase in the number
of nearside closures reduces the carriageway crossings by around 5%. The model also
assumes 100% uptake by the Supply Chain; experience from the roll-out of the
innovative entry taper technique (via AMM125/10) indicates that there is often
reluctance to change established methods in favour of something considered unproven
or even “unsafe”.
Calculating the benefit from adding three or four initiatives together is possible, but it is
clearly important that initiatives must be genuinely cumulative. Similarly, logic dictates
that any initiative added must have a MIRi Index and carriageway crossing reduction at
least as great as the initiative or practice that it replaces. Failure to ensure that both
these criteria are satisfied is critical as failing to do so will result in either marginal gains
or potentially in an increase in MIRi Index and/or carriageway crossing value.

Client Project Report
41
7 Conclusions and Future Developments
The workers who maintain the Highways Agency road network operate in close proximity
to fast-moving traffic that is not under their direct control. This presents an injury risk
that can result in fatal or life-changing injury to road workers.
Understanding this risk is a key step towards improving its management by prioritising
initiatives to ensure the safety of road workers. This is a complicated task as there is no
single common approach taken to deploy temporary traffic management (TTM) at road
works, necessitating an in-depth understanding of the work processes used.
The MIRi Index has been developed from an in-depth understanding of the work
processes involved with deploying TTM. This knowledge has been used to identify four
generic methods for deployment of TTM; from these methods and a detailed study of the
individual processes involved in their execution the benchmark MIRi Index has been
calculated. This applies to the deployment and retrieval of TTM associated with
relaxation closures (excluding the longitudinal coning), which accident and incident data
suggests is the highest risk activity undertaken by road workers.
The MIRi Index has been supplemented with a carriageway crossing value. This is based
on an aggregated value of carriageway crossings and is not a precise value (thus should
not be used as a benchmark) but allows quantification of the benefits from changing TTM
installation methods in terms of risk and carriageway crossings.
Examining the data from the MIRi Index demonstrates that the selection of the base
method for deployment and retrieval of TTM is critical to achieving the lowest possible
MIRi Index score. Elimination of carriageway crossings is an important part of reducing
risk but without a sound base MIRi Index score it is likely that eliminating carriageway
crossings will not drive down risk to road workers to a level that can be shown to be as
low as reasonably practicable.
Comparison of methods also shows that there is a significant range from the lowest risk
to highest risk and that the MIRi Index value for a technique varies depending on
whether it is used to deploy a nearside or offside lane closure. This information is
important as it can be used to direct interventions and guidance issued to the Supply
Chain to reduce carriageway crossings to a minimum level (typically those associated
with installation of advance signing), which has the potential to reduce carriageway
crossings by 10%. It also indicates that there is not a “one size fits all” approach to
reducing risk and that selection of TTM vehicle and technique will usually be a
compromise between the two types of lane closure commonly deployed at relaxed
works.
The analysis of the MIRi Index and carriageway crossing data was extended to two
potential techniques that have been identified as approaches to reduce carriageway
crossings. The TTM Sign Simplification (TTMSS) approach seeks to eliminate the 600
yard and 200 yard advance signing together with the Detail „A‟ elements on the hard
shoulder adjacent to the entry taper. This approach has the potential to reduce the MIRi
Index by up to 22% and to decrease carriageway crossings by up to 52%. If an
aggregated value is calculated for likely decrease (based on best-estimate for the
number of TM installations carried out using each method), TTMSS can achieve a
national reduction in MIRi Index of 19% and a reduction in carriageway crossings of
46%. This is a substantial reduction which can be achieved with no additional equipment
or requirements for road workers.
The second approach considered is that of offside signs relaxation (OSSR), where for
nearside lane closures the offside signs are omitted. This achieves a similar reduction in

Client Project Report
42
MIRi Index (up to 28%) but reduces carriageway crossings by 100%. However, as this
technique is only applicable to nearside lane closures its contribution towards achieving a
substantial reduction in carriageway crossings is limited; if the two techniques are
combined the indications are that the MIRi Index will decrease by an additional 2% to
21%, with carriageway crossings decreasing by an additional 9% to 55%. These figures
are based on a number of assumptions; it is recommended that these are validated from
the Schedule of Road Works before these values are cited as evidence of likely benefit.
7.1 Benefits realisation
The primary benefit of the MIRi Index and linked carriageway crossing index is the ability
to quantify reduction in risk associated with changes to operating methods within the
Supply Chain. This will enable the HA to demonstrate that the target of a “substantial”
reduction in carriageway crossings (which was launched at the Aiming for Zero: Safety
for our Road Workers event in November 2009) has been realised. This will require on-
road implementation of initiatives identified by the MIRi Index as contributing to the
target (and subsequent monitoring using the Schedule of Road Works to ensure that the
benefits realised are valid and auditable) but this will drive and deliver a significant
improvement to road worker safety.
A key secondary benefit from the MIRi Index is the ability to pre-screen potential
interventions for effectiveness. This enables the index to predict the likely benefit and
contribution to the Aiming for Zero targets that could be realised from introduction of
any specific intervention. The overall assessment of any particular intervention requires
understanding of the whether its effect is cumulative with existing safety improvements
or replaces an existing intervention. In either case, the MIRi Index can be used to
calculate its overall impact on risk and carriageway crossings, which can then be put in
the context of its impact on cost and operational considerations.
The basic MIRi Index approach could also be applied to new techniques for deployment
or retrieval that fall outside of current practices. While this would not be a direct
calculation, the principles and knowledge used to develop the index can be applied to
techniques such as using high-level signs to replace offside signing at offside lane
closures, the innovative cone taper technique or use of mobile lane closures to deploy
advanced signing. This enables the effectiveness of these techniques to be compared
with the current practices and generic techniques identified in this report and for
investment decisions to be taken based on sound data and prediction of likely benefit.
Although the basic MIRi Index only applied to traffic management operatives, the need
to develop an advanced MIRi Index has been examined and a number of key enablers
included in the basic index. Development of an advanced MIRi Index will be important
once the early benefits from the Aiming for Zero programme are realised and
carriageway crossings have been significantly reduced. An advanced index would be an
evolution of the basic index, but would increase the scope of activities for which risk was
quantified to include the longitudinal coning and in-site activity. This would also
incorporate the speed/injury relationship defined in Section 2 to quantify relative risk
levels for road workers by proximity to live traffic, traffic flow and traffic composition.
The approach devised and adopted for the MIRi Index could be applied to any area
where operational safety concerns require prioritisation of activity or quantification of
risk. The MIRi Index could be applied to other HA „Aiming for Zero‟ workstreams such as
the construction safety workstream or the Traffic Officer Service, subject to collection of
appropriate data to enable modelling and quantification of risk exposure and duration.
Client Project Report
43
References
HSE Books 2001 Reducing risks, protecting people, HSE‟s decision-making process
http://www.hse.gov.uk/risk/theory/r2p2.pdf DfT (2009) The Traffic Signs Manual Chapter 8: Traffic Safety Measures and
Signs for Road Works and Temporary Situations, London:TSO
BS 8800:1996 Guide to occupational health and safety management systems (since withdrawn and revised 2004)
H. Raafat (1995) Machinery safety: the risk based approach, practical guidelines on risk assessment, standards and legislation. Technical Communications
(Publishing) Ltd BS 5304:1988, obsolete British Standard Code of practice for safety of
machinery.
ISO 13849-1 (EN 954) Safety of machinery – safety related parts of control systems Part 1. General principles for design
The Reporting of Injuries, Diseases and Dangerous Occurrences Regulations 1995
Pasanen, E. (1992). Driving speeds and pedestrian safety; a mathematical
model. Helsinki University of Technology, Transport Engineering, Publication 77. Pasanen, E., Salmivaara, H. (1993). Driving speeds and pedestrian safety in the
city of Helsinki. Traffic Engineering & Control 34(6): 308-310.
Rosén, E., and Sander, U. (2009). Pedestrian fatality risk as a function of car impact speed. Accident Analysis and Prevention 41:536-542.
Rosén, E., Stigson, H., and Sander, U. (2010). Literature review of pedestrian fatality risk as a function of car impact speed. To be submitted for publication.

Client Project Report
44
Glossary of terms and abbreviations
MIRi Measurement of Injury Risk Index
TTM Temporary Traffic Management
TMV Traffic Management Vehicle
TMIPV Traffic management vehicle combined with a cushion
TM +IPV Traffic management vehicle with a separate impact protection vehicle
AIS Abbreviated Injury Scale
TTMSS Temporary Traffic Management Sign Simplification
OSSR Offside Signs Relaxation

Client Project Report
45
Appendix A Impact speed and pedestrian injury
outcome
Relationship between vehicle impact speed and pedestrian injury outcome
Significant numbers of pedestrians are injured or killed as a result of being struck by
motor vehicles every year. The relative importance of pedestrians with respect to all
traffic casualties varies between different countries, but typically the most common
pedestrian crash scenario involves them being struck by the front of a passenger car.
Pedestrians account for approximately 14% of the road fatalities in the EU 15 (2004). In
Great Britain the proportion of pedestrians with respect to the number of people killed
each year in traffic collisions is higher at roughly 21%.
One major factor that influences pedestrian injury outcome during a collision is the
vehicle speed at the point of impact. This study provides a comparative review of real
world casualty injury severity for pedestrians who were struck by the front of a car with
respect to the speed at impact. The report only considers the risk of injury for the data
available and does not present precise probability measures of injury related to a given
impact speed; rather it outlines the general trends. Further the report does not present
any data or comment on the contributory or causal factors associated with the accidents.
A.1 Background
Vehicle speed affects both the risk of an accident and the associated injury severity. It
has been observed that a reduction of the speed limit on a road from 60 kph to 50 kph
produced a 20 % drop in pedestrian accidents, and a 50 % drop in pedestrian fatalities
[6]. Section A.6 considers the travelling speed of vehicles and their potential to brake to
avoid or lessen the severity of a potential collision.
Pedestrian accidents are known to occur at a wide variety of impact speeds [7], although
the majority (about 85 %) are believed to be below 50 kph [8]. Pedestrians are usually
hit from the side, and are 3 to 4 times more likely to be crossing the path of the vehicle
than travelling in a parallel direction to it [8]. Cases where the vehicle runs over the
pedestrian (where the wheels travel over the pedestrian as they lie in the road) are rare,
with estimates varying between 2 % and 10 % [5] of pedestrian casualties.
It has been found that children and the elderly are overrepresented in pedestrian
casualties (where “children” refers to under 16s and the elderly to over 60s) [6]. The
impact kinematics of a child and adult pedestrian are known to be different when struck
by the front of a car. One reason for this is that pedestrian height is directly related to
the structure on the car they strike, with taller casualties more frequently striking the
upper bonnet and/or windscreen.
The body parts with the highest risk of injury (frequency x severity) for a pedestrian
struck by a vehicle are the head, followed by the lower extremities, the thorax, and the
pelvis [5]. For non-fatal injuries, the lower extremities have been seen as the most
frequently injured. These injuries tended to be to the knee ligaments for impacts speeds
around 20-30 kph, and to be fractures for accidents around 40 kph [2].
The head is often subject to two impacts, the first with the car itself, and the second with
the ground as the pedestrian is thrown from the car. In relation to the relative severity
of these two impacts, the literature is divided. Some observe that the primary impact
(with the car) is the most severe impact [5]. This is in line with papers suggesting that
the injuries caused by secondary impact are fewer and less serious than those caused by
primary impact [9]. However, others claim that the secondary impact is often a source of
injury comparable to the primary impact [8].
Euro NCAP undertakes pedestrian sub-system impactor tests that are designed to rate
new car models on the protection they offer to pedestrians in a frontal impact. In order
Client Project Report
46
to produce repeatable and scientific measurements leg forms and head forms are used
to represent the pedestrian‟s associated body regions. The leg and head forms are
projected towards the vehicle at 40 kph. The leg forms impact with the bumper and the
bonnet leading edge and the head forms strike the bonnet at a variety of locations. The
impactors are instrumented and the resulting measurements are used to predict the risk
of injury.
While speed is certainly a factor directly linked to the severity of injury during
pedestrian-vehicle collisions, other factors also come into play, making a pure
assessment of the effects of speed very difficult. For example one study has shown that
a long bonnet on a car reduces the injury risk of pedestrians in collision with that car [5].
This difficulty is exacerbated by the varied nature of pedestrians, who will be of all ages,
heights and weights and have very different biomechanical tolerances [7]. As people age
their biomechanical strength decreases leaving them more vulnerable to injury for a
given loading condition.
For several reasons, including those noted above, it is impossible to predict solely from
the speed of an accident what the injury outcome of a given pedestrian will be. Fatal
accidents have occurred at very low speeds, under 20 kph and as low as 12 kph; and
slight injuries have been seen at much higher speeds (above 40 kph) [5] [7]. However,
it is possible to identify boundary speeds, where the proportion of accidents changes
from being mainly slight accidents to mainly severe accidents, and where the proportion
changes from mainly survivable accidents to mainly fatal accidents.
A.2 Data sources
This study has used real world accident data from the On The Spot (OTS), Heavy Vehicle
Crash Injury Study (HVCIS), the UK Police fatal file archive and an International
Harmonized Research Activity (IHRA) dataset.
A.2.1 On The Spot (OTS)
As part of this study, pedestrian casualties recorded in the On The Spot (OTS) study and
Police fatal files have been used to estimate the relationship between impact speed and
pedestrian injury severity.
In 1999, the UK‟s Department for Transport and Highways Agency (HA) commissioned
the „On the Spot‟ (OTS) accident research project to collect information at the scene of
all types of road accidents. In-depth accident investigations were carried out to study
their causes, injury mechanisms, human involvement, highway design and vehicle
design. This allows research to be conducted to investigate the causes of crashes, their
subsequent injuries and the associated societal costs.
The project started to collect data in June 2000, which is incorporated into a database
detailing 500 in-depth investigations per year. Two investigation teams, the Vehicle
Safety Research Centre (VSRC) at Loughborough University and the Transport Research
Laboratory (TRL), work in close co-operation to produce the joint dataset. The teams
work in the Nottinghamshire and Thames Valley Police Force areas respectively, and
each investigate 250 accidents per year.
A comprehensive description of the methodology and investigations achieved was
published in February 2008 (Cuerden et al). A brief outline of the number and type of
accidents investigated by each research centre can be found in this report, and further
details may be viewed on the project website (www.ukots.org).
A.2.2 Heavy Vehicle Crash Injury Study (HVCIS)
The HVCIS fatal accident database contains over 2000 fatal accident cases involving
larger vehicles. Fatalities are comprised of large vehicle occupants and their opponents.
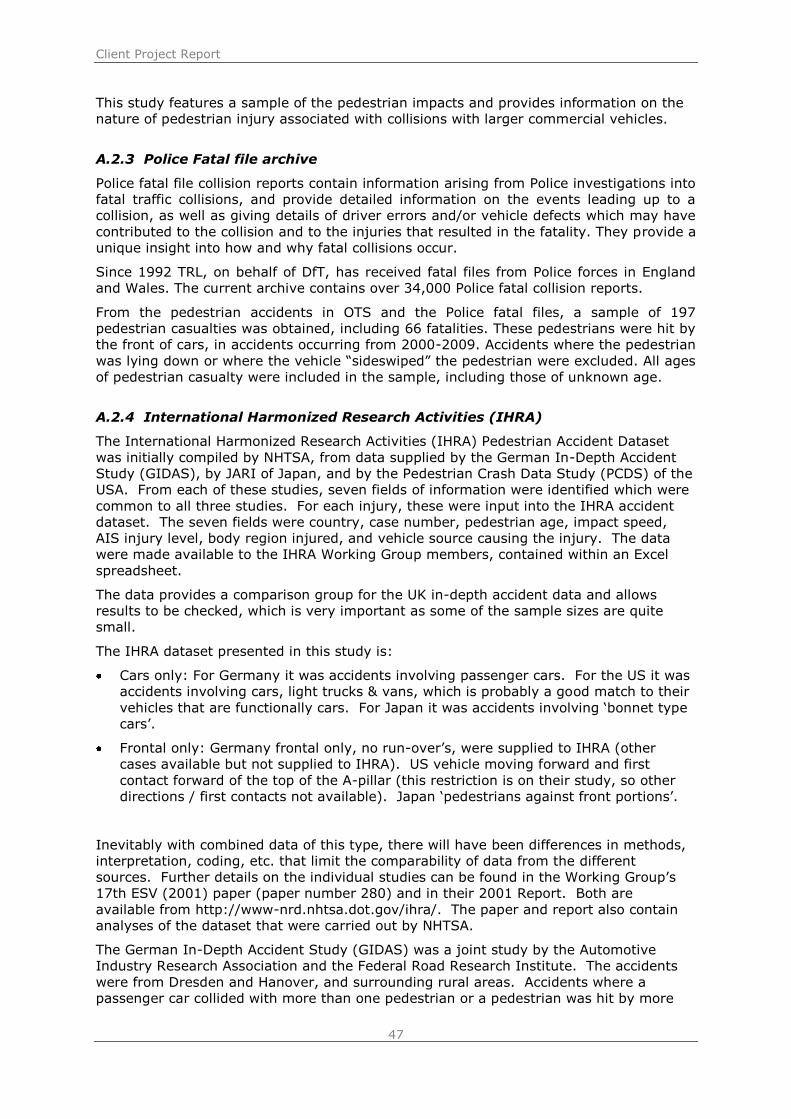
Client Project Report
47
This study features a sample of the pedestrian impacts and provides information on the
nature of pedestrian injury associated with collisions with larger commercial vehicles.
A.2.3 Police Fatal file archive
Police fatal file collision reports contain information arising from Police investigations into
fatal traffic collisions, and provide detailed information on the events leading up to a
collision, as well as giving details of driver errors and/or vehicle defects which may have
contributed to the collision and to the injuries that resulted in the fatality. They provide a
unique insight into how and why fatal collisions occur.
Since 1992 TRL, on behalf of DfT, has received fatal files from Police forces in England
and Wales. The current archive contains over 34,000 Police fatal collision reports.
From the pedestrian accidents in OTS and the Police fatal files, a sample of 197
pedestrian casualties was obtained, including 66 fatalities. These pedestrians were hit by
the front of cars, in accidents occurring from 2000-2009. Accidents where the pedestrian
was lying down or where the vehicle “sideswiped” the pedestrian were excluded. All ages
of pedestrian casualty were included in the sample, including those of unknown age.
A.2.4 International Harmonized Research Activities (IHRA)
The International Harmonized Research Activities (IHRA) Pedestrian Accident Dataset
was initially compiled by NHTSA, from data supplied by the German In-Depth Accident
Study (GIDAS), by JARI of Japan, and by the Pedestrian Crash Data Study (PCDS) of the
USA. From each of these studies, seven fields of information were identified which were
common to all three studies. For each injury, these were input into the IHRA accident
dataset. The seven fields were country, case number, pedestrian age, impact speed,
AIS injury level, body region injured, and vehicle source causing the injury. The data
were made available to the IHRA Working Group members, contained within an Excel
spreadsheet.
The data provides a comparison group for the UK in-depth accident data and allows
results to be checked, which is very important as some of the sample sizes are quite
small.
The IHRA dataset presented in this study is:
Cars only: For Germany it was accidents involving passenger cars. For the US it was
accidents involving cars, light trucks & vans, which is probably a good match to their
vehicles that are functionally cars. For Japan it was accidents involving „bonnet type
cars‟.
Frontal only: Germany frontal only, no run-over‟s, were supplied to IHRA (other
cases available but not supplied to IHRA). US vehicle moving forward and first
contact forward of the top of the A-pillar (this restriction is on their study, so other
directions / first contacts not available). Japan „pedestrians against front portions‟.
Inevitably with combined data of this type, there will have been differences in methods,
interpretation, coding, etc. that limit the comparability of data from the different
sources. Further details on the individual studies can be found in the Working Group‟s
17th ESV (2001) paper (paper number 280) and in their 2001 Report. Both are
available from http://www-nrd.nhtsa.dot.gov/ihra/. The paper and report also contain
analyses of the dataset that were carried out by NHTSA.
The German In-Depth Accident Study (GIDAS) was a joint study by the Automotive
Industry Research Association and the Federal Road Research Institute. The accidents
were from Dresden and Hanover, and surrounding rural areas. Accidents where a
passenger car collided with more than one pedestrian or a pedestrian was hit by more

Client Project Report
48
than one passenger car were excluded, as were accidents where the car ran over the
pedestrian or where the impact speed could not be established.
Japan supplied two datasets to NHTSA for the IHRA dataset. The first was collected from
1987 to 1988 and the second from 1993 to 1998. See “The present situation of
pedestrian accidents in Japan” by H Ohashi, K Ono (both JARI), A Sasaki (JAMA), N
Ohashi, & S Misawa, presented at IRCOBI, 1990. Although this reference describes data
collection, selection of accident locations, etc. for the first dataset, the second dataset
was collected in the same way.
A.3 Terminology and definitions of key variables
A.3.1 Collision Severity Measures (Impact Speed)
The collision or impact severity is determined by the OTS investigation team. Wherever
possible, physical scene evidence is used to derive estimates of the speed of the vehicle
at the point of impact. These techniques include mathematical reconstructions based on
the trace marks vehicle tyres leave on the road surface due to heavy braking and
evaluation of the pedestrians‟ throw distance correlated to the probable impact speed.
Often there is very little physical evidence either on the road surface or vehicle that can
be used to calculate an impact speed. Sometimes the only evidence of pedestrian
impact with the vehicle are faint cleaning marks on the bumper or bonnet surface. In
such cases it is still possible to estimate impact speeds, but the level of accuracy is
clearly lower. The OTS team collates information from witnesses, crash participants and
the characteristics of traffic flow along with other scene related information to validate
and help inform any vehicle to pedestrian impact speed measures.
A.3.2 Classification of Casualty Injury Severity
Casualties‟ injuries are classified by their severity by the police according to the British
government‟s definitions of Fatal, Serious or Slight. Further, the OTS and other in-depth
crash research studies use a more refined and detailed methodology to classify injuries
with respect to the risk of death (Abbreviated Injury Scale).
A.3.3 Police Injury Classification of Injury Severity
The casualties‟ injury severity is classified by RRCGB and by OTS according to the UK
government‟s definitions of Fatal (Killed), Serious or Slight.
„Fatal‟ injury includes only those where death occurs in less than 30 days as a result of
the accident. Fatal does not include death from natural causes or suicide.
Examples of „Serious‟ injury are:
Fracture of bone
Internal injury
Severe cuts
Crushing
Burns (excluding friction burns)
Concussion
Severe general shock requiring hospital treatment
Detention in hospital as an in-patient, either immediately or later
Injuries to casualties who die 30 or more days after the accident from injuries
sustained in that accident

Client Project Report
49
Examples of „Slight‟ injuries are:
Sprains, not necessarily requiring medical treatment
Neck whiplash injury
Bruises
Slight cuts
Slight shock requiring roadside attention
A.3.4 Abbreviated Injury Scale Classification of Injury Severity
The OTS casualties‟ injuries and characteristics (gender, age, height, weight etc.) are
obtained from police reports, questionnaires, hospital records or HM coroner reports
depending on the casualties‟ injury severity. The injuries sustained are coded using „The
Abbreviated Injury Scale (AIS) 1990 Revision‟ (Association for the Advancement of
Automotive Medicine, AAAM). Each injury description is assigned a unique six digit
numerical code in addition to the AIS severity score. The first digit summarises the body
region; the second digit identifies the type of anatomical structure; the third and fourth
digits identify the specific anatomical structure or, in the case of injuries to the external
region, the specific nature of the injury; the fifth and sixth digits identify the level of
injury within a specific body region or anatomical structure. Finally, the digit to the right
of the decimal point is the AIS severity score. This study specifically uses the AIS code
for the body region injured and the AIS severity score. The body regions injured are
classified by:
Head
Face
Neck
Thorax
Abdomen
Spine (cervical, thoracic and lumbar)
Upper Extremity
Lower Extremity
Unspecified
The AIS severity score is a consensus-derived anatomically-based system that classifies
individual injuries by body region on a six point ordinal severity scale ranging from AIS 1
(minor) to AIS 6 (currently untreatable), shown in Table A 1
Table A 1: AIS Values
AIS Score Description
1 Minor
2 Moderate
3 Serious
4 Severe
5 Critical
6 Maximum
9 Unknown

Client Project Report
50
MAIS denotes the maximum AIS score of all injuries sustained by a particular occupant.
It is a single number that attempts to describe the seriousness of the injuries suffered by
that occupant.
The AIS system therefore allows injuries to be coded by their type and severity in terms
of threat to life. In OTS, the injuries are then correlated with the associated vehicle
damage to try to determine the ultimate cause of each individual injury.
A.4 Relationship between speed and injury outcome
This section considers passenger cars and larger commercial vehicles separately as their
geometry and stiffness properties are very different and this has a direct affect on the
mechanism of pedestrian injury observed and the influence of impact speed.
A.4.1 Relationship between speed and injury outcome for passenger cars
Figure A 1 and Figure A 2 compare OTS and IHRA data and provide a cumulative
percentage distribution for seriously injured pedestrians (non-minor) and fatally injured
pedestrians who were struck by the front of passenger cars. They confirm that the OTS
data and the IHRA data are very similar. There appears to be a small shift towards
higher speeds in the OTS data, but the curves are very similar shapes.
Figure A 1 Cumulative impact speed for pedestrians with non-minor injuries
in OTS and IHRA
Cumulative impact speed - IHRA and OTS: non-minor
0
10
20
30
40
50
60
70
80
90
100
0 10 20 30 40 50 60 70 80 90 100
Impact speed (kph)
Cu
mu
lati
ve
%
IHRA - non-minor casualties (n=210)
OTS - non-minor casualties (n=58)

Client Project Report
51
Figure A 2 – Cumulative impact speed for fatalities in IHRA and OTS
Figure A 3 is an approximate risk curve for the pedestrians in the OTS and IHRA
datasets, produced from the data. It shows the probability given by the two datasets of
suffering injury of a given severity depending on the impact speed. There were very few
casualties in the OTS and IHRA datasets with impact speeds above 60 kph, therefore the
probabilities given above this speed are a best estimate, to give the reader an
impression of what the probabilities may be above these speeds. The probability of a
fatal injury has been set to 100 % at 95 kph, and the probability of a MAIS>1 injury has
been set to zero at 95 kph.
Figure A 3 – Approximate risk of injury given by OTS and IHRA data
Cumulative impact speed - IHRA and OTS: fatalities
0
10
20
30
40
50
60
70
80
90
100
0 20 40 60 80 100 120 140 160
Impact speed (kph)
Cu
mu
lati
ve
%
IHRA - fatalities (n=32)
OTS - fatalities (n=7)
Risk of injury with increasing impact speed
0
10
20
30
40
50
60
70
80
90
100
0 10 20 30 40 50 60 70 80 90 100
Impact speed - kph
% i
nju
ry r
isk
OTS - fatalities
OTS - MAIS>1
OTS - MAIS=1
IHRA - fatalities
IHRA - MAIS>1
IHRA - MAIS=1

Client Project Report
52
Figure A 3 highlights some boundary condition between serious and fatal injury
outcome, where the respective injury severity distribution lines cross.
A.4.2 Pedestrian fatal injury risk for passenger cars
A review of the literature on the relationship between impact speed and pedestrian injury
found that two main sources of accident data have been used to calculate this
relationship. These are data collected by Ashton and Mackay in Birmingham in the
1970s, and data collected by the German In-Depth Accident Study (GIDAS). In addition
to these, recent data from the UK has been used for the pedestrian injury risk curves in
this study (Police fatal files and the On The Spot project).
There are two main stages to calculating pedestrian injury risk curves. The first involves
weighting the data to match national statistics, and the second is the calculation of the
injury risk curves themselves and their associated confidence using logistic regression.
These curves have been calculated for three sources: Ashton and Mackay data from the
1970s; GIDAS data from 1999-2007; and OTS and Police fatal file data from 2000-2009.
Richards (2010) used logistic regression on the weighted pedestrian dataset in Ashton
(1980). The result of using this method on the total Ashton and Mackay pedestrian
sample is shown in Figure A-1. This figure shows that the estimated risk of a pedestrian
being killed if they are hit at a speed of 30 mph is approximately 9%. The risk at an
impact speed of 40 mph is much higher, approximately 50%. This figure also shows that
the confidence intervals (the dashed lines in the figure) get much wider as the impact
speed increases. This is because there are fewer pedestrians in the sample at higher
speeds, which reduces the precision of the estimated risk at these speeds.
Richards (2010) applied a nonlinear regression model based on the least squared
method, and calculated the following relationship between impact speed in metres per
second (v) and probability of fatality (P):
027.0371
027.12017.0 ve
P
Equation 7-1
Figure A-1. Risk of pedestrian fatality calculated using logistic regression from
Ashton and Mackay data
0%
10%
20%
30%
40%
50%
60%
70%
80%
90%
100%
0 10 20 30 40 50 60 70
Ris
k o
f p
ed
est
rian
fat
alit
y
Impact speed (mph)
Ashton data (all ages, front of cars, n = 358)

Client Project Report
53
A study by Rosén and Sander (2009) used GIDAS data to calculate the relationship
between impact speed and risk of pedestrian fatality. This sample included pedestrian
impacts occurring between 1999 and 2007, where the pedestrian was hit by the front of
the car and the impact speed was known. Pedestrians hit by sport utility vehicles,
pedestrians who were lying down, and pedestrians who were “sideswiped” were removed
from the sample. The final sample used contained 490 pedestrians aged 15-96, including
36 fatalities. There were no children under the age of 15 in the GIDAS pedestrian
dataset. The number of fatal, serious, and slight casualties in this sample was weighted
to the number of pedestrian casualties in Germany from 2003-2007. Rosén and Sander
used logistic regression to calculate the relationship between impact speed v (in kph)
and risk of pedestrian fatality P. The relationship found was:
veP
090.09.61
1
Equation 7-2.
Rosén and Sander did not publish full details of their sample. However, through a
collaborative work with Autoliv it was possible to analyse the relevant dataset for use in
this project.
Figure A-2 shows the results of using the logistic regression on the GIDAS data supplied
by Rosén and Sander, and also shows the function calculated by Rosén and Sander
themselves. This data contains pedestrians aged 15-96 years. Only one of these curves
is visible, because the results are identical: the logistic regression method matches that
used by Rosen and Sander themselves. This figure shows that the risk of pedestrian
fatality at an impact speed of 30mph is approximately 7%, and the risk of fatality at
40mph is approximately 25%.
Figure A-2. Risk of pedestrian fatality calculated using logistic regression from
Rosén and Sander GIDAS dataset
Richards (2010) collated pedestrian accidents in OTS and the Police fatal files, a sample
of 197 pedestrian casualties was obtained, including 66 fatalities. These pedestrians
were hit by the front of cars, in accidents occurring from 2000-2009. Accidents where
0%
10%
20%
30%
40%
50%
60%
70%
80%
90%
100%
0 10 20 30 40 50 60 70
Ris
k o
f p
ed
est
rian
fat
alit
y
Impact speed (mph)
Rosén and Sander data (ages 15-96, front of car, n = 490)
Rosén and Sander function

Client Project Report
54
the pedestrian was lying down or where the vehicle “sideswiped” the pedestrian were
excluded. All ages of pedestrian casualty were included in the sample, including those of
unknown age.
Figure A-3 shows the cumulative impact speed of the pedestrians in the OTS and Police
fatal file dataset. This shows that approximately half of fatally injured pedestrians in the
dataset were hit at an impact speed of 30 mph or less. In order to perform the logistic
regression, the number of slight, serious, and fatal casualties in this dataset was
weighted to match the number of pedestrian casualties in the national statistics.
Figure A-3. Cumulative impact speed for pedestrian casualties in the OTS and
Police fatal file dataset
Figure A 4 shows the relationship between impact speed and the risk of pedestrian
fatality, calculated using the logistic regression method. This figure gives the risk of
pedestrian fatality at an impact speed of 30 mph as approximately 7%, and the risk at
an impact speed of 40 mph as approximately 31%. The number of cases in the sample is
too small to allow the results to be broken down by age group.
Data from three pedestrian datasets (for Great Britain in the 1970s, Germany from
1999-2007, and Great Britain from 2000-2009) has been treated in the same way for
comparison. The conclusions of this study are as follows:
The three pedestrian datasets show a similar pattern in fatality risk. The risk
increases slowly until impact speeds of around 30 mph. Above this speed, risk
increases rapidly – the increase is between 3.5 and 5.5 times from 30 mph to 40
mph.
The risk of fatality is generally higher for the dataset from the 1970s, indicating
that the risk of pedestrian fatality has reduced over the last 30 years.
Even though the risk of pedestrians being killed at 30 mph is relatively low,
approximately half of pedestrian fatalities occur at this impact speed or below.
0%
10%
20%
30%
40%
50%
60%
70%
80%
90%
100%
0 10 20 30 40 50 60 70
Cu
mu
lati
ve p
erc
en
tage
of
seve
rity
Impact speed (mph)
All ages, pedestrian impacts with front of cars
Slight (n = 57) Serious (n = 74) Fatal (n = 66)

Client Project Report
55
Figure A 4. Risk of pedestrian fatality calculated using logistic regression from
the OTS and Police fatal file dataset
A.5 Relationship between speed and injury outcome for larger vehicles
The data contained 173 pedestrians where the most severe impact was with an HGV,
116 that were impacted by an LPV and 59 pedestrians in impacts with LCVs. Figure A 5
shows a comparison of the distribution of differences between impact locations. It is
important to note that STATS19 records the first point of impact and the HVCIS data
contains multiple impacts and is analysed using the most severe impact. This may
explain some of the differences but pedestrian accidents are more likely to involve single
impacts than multiple vehicle collisions.
Figure A 5 shows that the representativeness of the data for accidents involving HGVs
extends to the distribution of impact location. For LPVs and LCVs the data is less
representative and when considering the following analysis, which considers impacts to
the front of the vehicle, the data will be under-representing the national picture.
0%
10%
20%
30%
40%
50%
60%
70%
80%
90%
100%
0 10 20 30 40 50 60 70
Ris
k o
f p
ed
est
rian
fat
alit
y
Impact speed (mph)
OTS and Police fatal file data (all ages, front of cars, n = 197)

Client Project Report
56
Figure A 5. Comparison of impact locations between HVCIS and STATS19 by
vehicle type1.
The HVCIS database contains data in addition to what is available from STATS19 such
as:
Driver behaviour factors
Impact speed
Cause of death
More detail on impact location/sequence
Fatality (pedestrian) behaviour factors
The following analysis compares some of this additional data for the three vehicle types
LPV, HGV and LCV, focusing on impacts to the front of the HGV.
The impacts are coded using the direction of force, side and part components of the
collision damage classification (CDC) (Nelson, 1980). Figure A 6 summarises the impact
locations on the front of the vehicles where this was known.
1 The HVCIS data has an additional impact location of the underside of the vehicle. For the purpose of the comparison, the small number of impacts to the underside has been excluded as unknown. For LPVs and LCVs they account for 1.7% of fatalities and for HGVs 1.2%.
60%
70%
80%
90%
100%
HGV HGV LPV LPV LCV LCV
HVCIS STATS19 HVCIS STATS19 HVCIS STATS19
Vehicle Type and Data Source
Perc
en
tag
e o
f fa
tali
ties
Back
Right
Left
Front

Client Project Report
57
Figure A 6. Pedestrian impact location on front of LPV (left), HGV (centre) and
LCV (right).
The left side of the front of the vehicle is the most frequent impact location, which is to
be expected for right hand drive vehicles because this is the side nearest to the footpath.
The proportion of pedestrians in impacts with the front left of the vehicle varies by
vehicle type. For LPVs and HGVs approximately 50% of the pedestrians impact the front
left, whereas for LCVs the distribution of impact locations is more even. There are some
cases where the impact is described as being distributed across two-thirds of the vehicle.
In these cases, the exact impact location may not have been clear.
Data on impact speed is taken from witness statements, police calculations or from
tachograph charts where they were analysed by the police. The data for impacts
between the front of the vehicle and pedestrians is shown in Figure A 7.
LCV
33% 28%30%
2%
7%
N=43
HGV
46% 26%26%
2%
1%
N=124
LPV
52% 20%19%
2%
6%
N=84

Client Project Report
58
Figure A 7. Cumulative percentage of impact speed by vehicle type.
The median impact speed is approximately 25km/h for HGVs, 30 km/h for LPVs and
45km/h for LCVs. Offering protection to pedestrian in impacts up to 40 km/h could
protect up to 25% of those in impacts with LCVs, up to 65% of those in impacts with
HGVs and up to 80% of those in impacts with LPVs. However, when considering potential
countermeasures, the primary impact with the vehicle may not always be the cause of
the fatal injuries. For example the pedestrian could be run over or the secondary impact
with the ground may be more severe than the impact with the vehicle.
For impacts with LCVs, 10% of the LCVs have a collision speed of zero which is
consistent with frequency of parked LCVs involvement in accidents
The cause of death is also an important factor when considering potential
countermeasures. Figure A 8 summarises the cause of death where the information was
available.
0%
10%
20%
30%
40%
50%
60%
70%
80%
90%
100%
0 20 40 60 80 100
Impact Speed (km/h)
Cu
mu
lati
ve P
erc
en
tag
e o
f F
ata
liti
es
LPV N=51
HGV N=95
LCV N=32
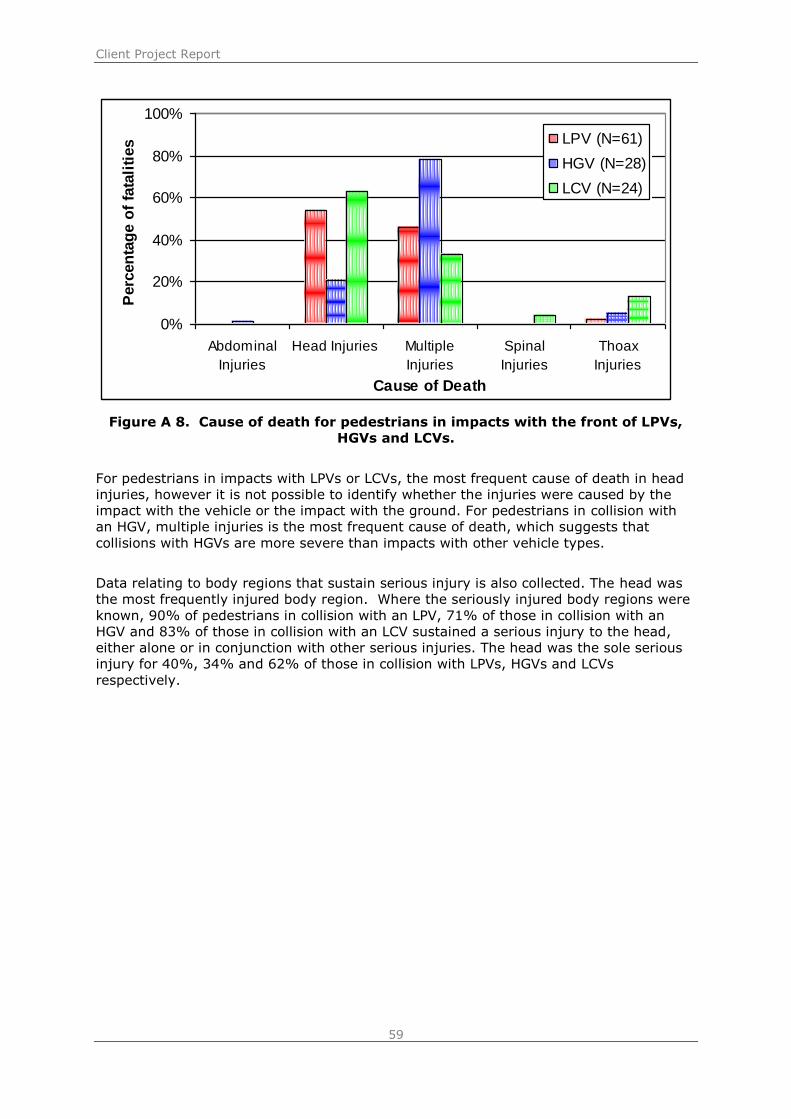
Client Project Report
59
Figure A 8. Cause of death for pedestrians in impacts with the front of LPVs,
HGVs and LCVs.
For pedestrians in impacts with LPVs or LCVs, the most frequent cause of death in head
injuries, however it is not possible to identify whether the injuries were caused by the
impact with the vehicle or the impact with the ground. For pedestrians in collision with
an HGV, multiple injuries is the most frequent cause of death, which suggests that
collisions with HGVs are more severe than impacts with other vehicle types.
Data relating to body regions that sustain serious injury is also collected. The head was
the most frequently injured body region. Where the seriously injured body regions were
known, 90% of pedestrians in collision with an LPV, 71% of those in collision with an
HGV and 83% of those in collision with an LCV sustained a serious injury to the head,
either alone or in conjunction with other serious injuries. The head was the sole serious
injury for 40%, 34% and 62% of those in collision with LPVs, HGVs and LCVs
respectively.
0%
20%
40%
60%
80%
100%
Abdominal
Injuries
Head Injuries Multiple
Injuries
Spinal
Injuries
Thoax
Injuries
Cause of Death
Perc
en
tag
e o
f fa
tali
ties LPV (N=61)
HGV (N=28)
LCV (N=24)

Client Project Report
60
A.6 Travelling speed of vehicles and driver reaction
Collision avoidance and impact speed
Understanding the avoidance manoeuvres, if any, that the drivers or riders undertook
just prior to the collisions with the pedestrians, provides valuable insight into how future
accidents could be prevented or the injuries mitigated. Smith et al (2010) undertook an
in-depth review of approximately 100 police fatal forensic reports. This included an
investigation of the travelling speed of the vehicles involved and avoidance manoeuvres
undertaken by the drivers and riders with the impact speed of the vehicle (Table A 2).
The impact speed is defined as the speed of the vehicle at the moment it strikes the
pedestrian; this is equal to the travelling speed for those who took no avoiding actions.
Table A 2: Vehicle avoidance manoeuvre by impact speed
Avoidance
manoeuvre
Vehicle impact speed (mph)
Total 0-9 10-19 20-29 30-39 40-49 50-59 60-69 70-79
Not
known
None 7 3 5 7 7 6 3 3 2 43
Braking only:
Skid marks 1 1 2 9 0 2 2 0 0 17
No marks - driver stated 2 1 5 2 1 1 0 0 1 13
Other evidence 0 0 1 1 0 0 0 0 1 3
Steering only 0 0 0 1 1 0 0 0 0 2
Steering &
braking 0 1 4 4 3 0 0 0 2 14
Other manoeuvre 0 0 0 1 0 0 0 0 1
Not known 0 0 0 0 0 0 0 0 2 2
Total 10 6 17 25 12 9 5 3 8 95
Table A 3 details 43 drivers and riders (avoidance manoeuvre was known for 93
collisions), who did not actively alter the speed or directions of their vehicles
(brake and/ or steer) prior to the impact.
Nearly half the drivers in the sample did not take avoiding action. Failure to take any
avoiding action does not appear to be associated with any particular travel speed. It
should be noted that this section of the project did not differentiate between drivers and
riders who failed to take avoiding action because, perhaps, they were not paying
sufficient attention and those who were unable to take any avoiding action because the
pedestrian „stepped out‟ in front of them without sufficient warning. However, the
accident descriptions provide a variety of reasons for the lack of reaction. These
included the immediate nature of the incident from the perspective of the driver or rider
and the lack of warning time and distance; in some instances the driver simply didn‟t see
the pedestrian, because they were obscured by part of the vehicles structure or other
obstacle; or he/she did not perceive or judge correctly the impending impact.
Forty seven of the drivers and riders applied their brakes prior to the collision, with 14 of
this group steering to avoid the collision too. This is an important gauge for the
potential effectiveness of brake assist (BAS) technologies in the real world. However, it

Client Project Report
61
was beyond the scope of this study to evaluate whether the fitment of such technologies
could have prevented any of the fatalities.
In total, 16 of the drivers or riders reacted by steering in an attempt to avoid the
collision with the pedestrian.
Braking confirmed by skid mark evidence tended to be associated with slightly higher
travel and therefore impact speeds (76% were higher than 30mph), as would be
expected, compared to braking claimed by the driver. For these cases where the
braking was not supported by evidential trace marks on the road surface, 33% (of those
with known travel speed) were higher than 30mph. Overall, braking is the most common
avoiding action in this sample. Steering and braking also appears to be associated with
slightly higher speed accidents (58% of those with known travel speed higher than
30mph).
The effect of the avoidance manoeuvres with respect to the impact speed the
pedestrians experienced is shown in Table A 4 . Approximately 43% of vehicles have
unknown impact speeds, compared to only about 8% with unknown travel speeds. In
the majority of cases, the impact speed is in the same range as the travel speed. One
vehicle has an impact speed in a higher range than the travel speed. On investigation,
this vehicle was pulling off from rest, and is recorded as having a travel speed of
between 8 and 9mph and an impact speed of 11mph. The 30-39mph travel speed
category is the only one where a significant number of vehicles (7) change to a lower
impact speed category. Most of these were travelling at or just above a 30mph limit,
and they braked to just under the limit.
The total distance travelled by a vehicle from the time an event occurs and prompts the
driver to brake, to it stopping, is the sum of the reaction (thinking) distance and the
braking distance, both of these are subject to variability. The reaction distance is related
to the human performance with respect to perceiving the danger and then physically
applying the brakes. The stopping distance is directly related to the amount of force
applied to the brake pedal by the driver and the associated vehicle braking performance
and environmental factors (such as the coefficient of friction of the road surface and the
gradient of the road). The vehicle related factors include the roadworthiness of the
brake system and tyres and the characteristics of any advanced brake assist or similar
technologies.
Table A 4 Vehicle travel speed by impact speed
Vehicle
travel speed
(mph)
Vehicle impact speed (mph)
Total 0-9 10-19 20-29 30-39 40-49 50-59 60-69 70-79 Not
known
0-9 4 1 5 10
10-19 1 5 6
20-29 1 11 5 17
30-39 1 7 10 7 25
40-49 1 4 7 12
50-59 1 4 4 9
60-69 1 1 2 1 5
70-79 1 2 3
Not known 1 7 8
Total 4 4 19 11 6 6 2 2 41 95

Client Project Report
62
Considering those collisions with known travel and impact speeds only, it is worth noting
that 18 vehicles were known to have been travelling at less than 30mph, but 26
experienced impact speeds below 30mph (8 vehicles which were travelling at 30mph or
above braked prior to the impact).
Unlike the distance a vehicle travels during the reaction phase of an emergency event,
the distance required to stop from the point when full braking is applied is not linear.
For example, a modern car travelling at 20mph (8.9m/s) could stop in a braking distance
of 6m, compared to 24m if it was travelling at 40mph (17.8m/s). The non-linear
relationship between travelling speed and stopping distance means that reducing the
original travel speed by a relatively small margin can affect a proportionally much
greater reduction with respect to the actual impact speed experienced in a collision
where prior braking is applied. It could be argued that if the vehicles which had time to
brake in this sample had been travelling at slower speeds prior to their avoidance
manoeuvre or they had been braked more efficiently, the tragic consequences could
have been avoided or at least mitigated as the impact speed would have been reduced
further.

Client Project Report
63
[1] Speed and Pedestrians (Cullen, P -1998 Aston University Civil Engineering
Conference)
[2] Effects of Vehicle Bumper Height and impact Velocity on type of lower extremity
injury in vehicle-pedestrian accidents (Accident Analysis and Prevention, 2005-06 v37 n4
p633-40)
[3] San Francisco pedestrian injury surveillance: Mapping, under-reporting and injury
severity in police and hospital records (Sciortino, S; Vassar, M; Radetsky, M; Knudson,
MM – Accident Analysis and Prevention, 2005-11 v37 n6 p1114-20)
[4] Pedestrian Subsystem Head Impact results reflect the severity of pedestrian head
injuries (Anderson, R; Street, L; Ponte G; Van de Griende, M; Lindsay, T; Mclean, J –
International Journal of Vehicle Design, 2003 v32 n1/2 p1-15)
[5] Influence of Impact speed and vehicle parameter on injuries of children and adults in
pedestrian accidents. (Appel, H; Sturtz, G; Gotzen, L)
[6] General Problems concerning Car-Pedestrian collision (Costano, A – Tenth
International ESV conference, 1985 vol 2, p943-8)
[7] Some characteristics of the population who suffer trauma as pedestrians when hit by
cars and some resulting implications (Ashton, S J; MacKay, G M – Proceedings of the 4th
IRCOBI conference 1979)
[8] Vulnerable Road User Scenario Analysis (Gavrila, DM; Marchal, P; Meinecke, MM –
SAVE-U Project Deliverable 1-A, 2003)
[9] Analysis and Load Assessment of Secondary Impact to Adult Pedestrians after Car
Collisions on Roads (Dietmar,O; Pohlemann, T – IRCOBI 2001)
[10] “Think” campaign website - www.thinkroadsafety.com
[11] Road Accident Data in the Enlarged European Union (ETSC - 2006)
[12] The Physics of Throw Distance in Accident Reconstruction (Searle, J.A., SAE paper
No. 930659, 1993)
[13] Car Design for Pedestrian Injury Minimization (Ashton, S.J., Mackay, G.M. 7th
International Technical Conference on Experimental Safety of Vehicles, Paris, June 1979)
[14] Safety of Pedestrians and Cyclists in Urban Areas (European Transport Safety
Council, Brussels, 1999)
[15] Summary of IHRA Pedestrian Safety WG Activities – Proposed Test Methods to
Evaluate Pedestrian Protection Afforded by Passenger Cars (Y Mizuno, 2005)
[16] Development and implementation of the UK On The Spot accident data collection
study. Phase I. (Hill, J.R. and Cuerden, R., AR2501 , November 2005, Department for Transport http://www.dft.gov.uk/stellent/groups/dft_rdsafety/documents/page/dft_rdsafety_610416.pdf)
[17] Injury Patterns In Pedestrian Accidents And The Associated Methodology Of A Real
World In-Depth Study. (Cuerden, R., Automotive Environmental Impact and Safety
IMechE Autotech 1997 Congress, Birmingham, UK. November 1997. ISBN 1860581161,
Paper reference C524/155/97, pages 215-229)
[18] 'On The Spot' Crash Investigations in the UK: New Insights for Vehicle Safety
Research, (Cuerden, R., Lunt, H., Fails, A. and Hill, J.R. , Proceedings of the 18th
International Technical Conference on the Enhanced Safety of Vehicles , US Department
of Transportation, National Highway Traffic Safety Administration, Nagoya, Japan, 12 pp
, [CD-ROM]. 19-22 May, 2003)
[19] The methodology of on the spot accident investigations in the UK. Hill, J.R.,
Thomas, P. D., Smith, M. and Byard, N., ESV Conference, National Highway Traffic
Safety Administration, 17th International Technical Conference on the Enhanced Safety
of Vehicles, pp 1-10. Amsterdam, June 2001)
Client Project Report
64
[20] A Preliminary Assessment of the Potential for Pedestrian Injury Reduction Trough
Vehicle Design. (Ashton, S. Proceedings of the 24th Stapp Car Crash Conference, 1980,
p607-35)
[21] The UK On The Spot Accident Data Collection Study – Phase II Report. Cuerden R,
Pittman M, Dobson E and Hill J. Department for Transport Road Safety Research Report
No. 73, 2007.)
[22] A correlation of car impact speed and pedestrian injury. Cuerden R, Richards D,
Brightman T, Danton D, Dobson E and Hill J. TRL Unpublished Project Report
(UPR/T/062/07). 2008.
[23] Relationship between speed and risk of fatal injury – Pedestrians and car occupants.
Richards D. Department for Transport Road Safety Web Publication No.16.
http://www.dft.gov.uk/pgr/roadsafety/research/rsrr/theme5/researchreport16/pdf/rswp116.pdf
[24] Review of pedestrian fatal road traffic accidents. Smith L and Cuerden R. TRL
Unpublished Project Report (CPR103). 2010.

Client Project Report
65
Appendix B Current Practices
Stage Method Reference Description
Detail A Method DA1 Once advanced signing (workforce in road sign, one mile road works, 800yd, 600yd, 400yd, 200yd wickets) has been installed from the hard shoulder, the vehicle remains on the hard shoulder until parallel to the start of the taper. Detail A is assembled on the hard shoulder parallel with the start and end of the taper. The vehicle drives round to start of advanced signing and manoeuvres into offside lane in preparation for taper installation.
Detail A Method DA2 Once advanced signing (workforce in road sign, one mile road works, 800yd, 600yd, 400yd, 200yd
wickets) has been installed from the hard shoulder, the vehicle manoeuvres from the hard shoulder into the off side lane in preparation for taper installation. Equipment required for 2 Detail A is walked across the carriageway onto the hard shoulder where Detail A‟s are assembled. Operatives cross carriageway for start of taper installation.
Taper Installation Method TI1 This method requires the use of a separate IPV and TMV. The TMV stops at the start of the taper
with the IPV approximately 50 metres behind, to ensure a safe clearance zone. The TMV, followed by the IPV drops cones along the non-trafficked lane line of the lane being closed. Operatives install taper once initial cones have been dropped, behind the IPV.
Taper Installation Method TI2 This method requires the use of a separate IPV and TMV. The TMV stops at the start of the taper with the IPV approximately 50 metres behind, to ensure a safe clearance zone. The TMV, drops cones along the non-trafficked lane line of the lane being closed. The IPV remains at the start of
the taper. Operatives install the taper once initial cones have been dropped and are positioned in between the TMV and the IPV.
Taper Installation Method TI3 TMIPV stops at start of the taper. TMIPV drops cones along the non-trafficked lane line of the lane being closed. Operative walk back to start of cone line and install taper.
Taper Installation Method TI4 TMV drops cones along hard shoulder. Operatives walk cones across carriageway and position along central reserve. Operatives walk the cones out to form the taper.
Taper Removal Method TR1 IPV is positioned at the start of the taper. Operatives walk cones along lane line. TMV reverses along cone line and collects from the well of the vehicle.
Taper Removal Method TR2 TMIPV is positioned at the end of the taper. Operatives walk the cones along the lane line. The
TMIPV reverses along the lane line collecting cones from the vehicle well.
Taper Removal Method TR3 Operatives walk the cones along the non-trafficked lane line. Cones are then walked across the
carriageway to the hard shoulder.

Client Project Report
66
Figure B 1 Method TI 1: Separate IPV and TM vehicle. IPV follows TM vehicle
into the closure

Client Project Report
67
Figure B 2 Separate IPV and TM vehicle. IPV remains at start of taper

Client Project Report
68
Fig B-3: Traffic management vehicle with LMCC device

Client Project Report
69
Fig B-4: No vehicle in lane to be closed. Operatives walk the closure out

Client Project Report
70
Appendix C Variables
C.1 Advanced Signing
Option TM
Vehicle TM vehicle with crash cushion
TMV and separate IPV
No hard shoulder
Hard shoulder
2 lanes
3 lanes
Nearside closure
Offside closure
Sandbags Ratchet straps
Laying signs flat
Smart Signs
Barrier Mounted Signs
1. n/a n/a
2. n/a n/a
3. n/a n/a
4. n/a n/a
5. n/a n/a
6. n/a n/a
7. n/a n/a
8. n/a n/a
9. n/a n/a
10. n/a n/a
11. n/a n/a
12. n/a n/a
13. n/a n/a
14. n/a n/a
15. n/a n/a
16. n/a n/a
17. n/a n/a
18. n/a n/a
19. n/a n/a
20. n/a n/a
21.
22.
23.
24.
25.
26.
27.
28.
29.

Client Project Report
71
Option TM Vehicle
TM vehicle with crash cushion
TMV and separate IPV
No hard shoulder
Hard shoulder
2 lanes
3 lanes
Nearside closure
Offside closure
Sandbags Ratchet straps
Laying signs flat
Smart Signs
Barrier Mounted Signs
30.
31.
32.
33.
34.
35.
36.
37.
38.
39.
40.
41. n/a n/a
42. n/a n/a
43. n/a n/a
44. n/a n/a
45. n/a n/a
46. n/a n/a
47. n/a n/a
48. n/a n/a
49. n/a n/a
50. n/a n/a
51.
52.
53.
54.
55.
56.
57.
58.
59.
60.
61.
62.
63.
64.

Client Project Report
72
Option TM Vehicle
TM vehicle with crash cushion
TMV and separate IPV
No hard shoulder
Hard shoulder
2 lanes
3 lanes
Nearside closure
Offside closure
Sandbags Ratchet straps
Laying signs flat
Smart Signs
Barrier Mounted Signs
65.
66.
67.
68.
69.
70.

Client Project Report
73
C.2 Detail A
Method 1 Put up advanced signing
Put up detail A at start and end of taper. Drive round to start of TTM and position in lane 2/3 for taper installation
Method 2 Put up advanced signing
Move into lane 2/3 for taper installation Walk detail A (x2) across carriageway onto hard shoulder
Option TM Vehicle TM with crash
cushion IPV 2 lane 3 lane Method 1 Method 2
1
2
3
4
5
6
7
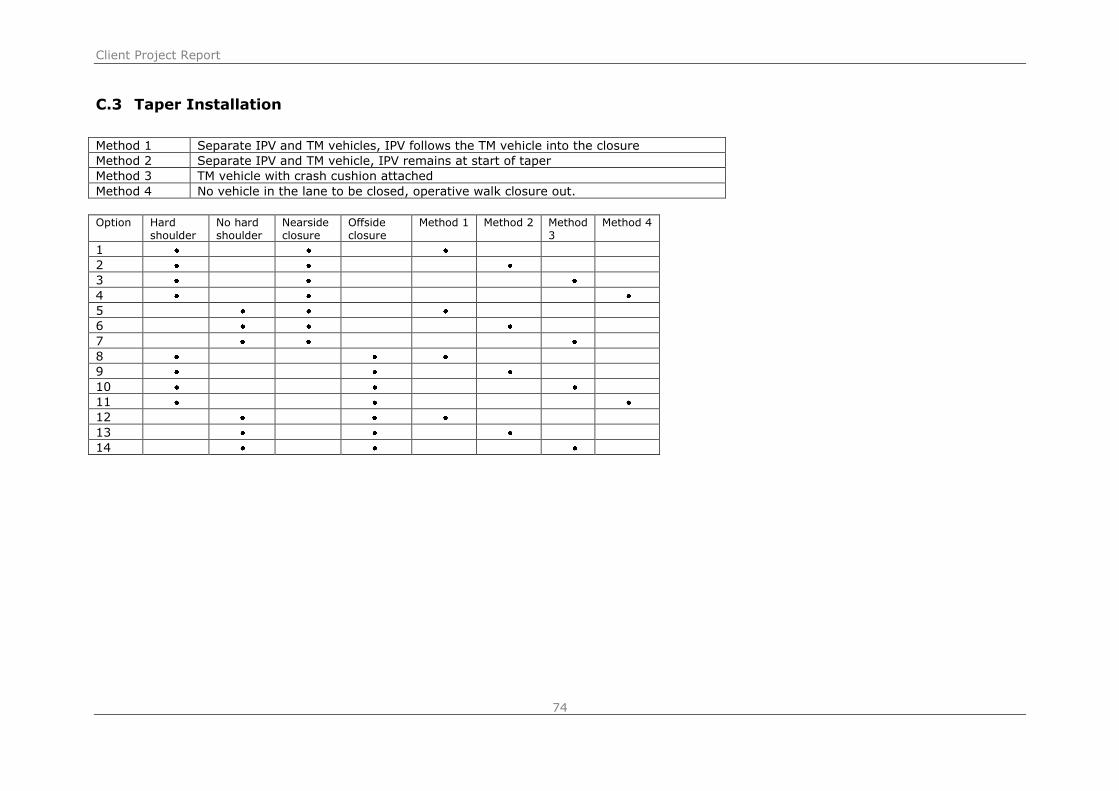
Client Project Report
74
C.3 Taper Installation
Method 1 Separate IPV and TM vehicles, IPV follows the TM vehicle into the closure
Method 2 Separate IPV and TM vehicle, IPV remains at start of taper
Method 3 TM vehicle with crash cushion attached
Method 4 No vehicle in the lane to be closed, operative walk closure out.
Option Hard
shoulder No hard shoulder
Nearside closure
Offside closure
Method 1 Method 2 Method 3
Method 4
1
2
3
4
5
6
7
8
9
10
11
12
13
14

Client Project Report
75
C.4 Taper Removal
Method 1 Separate IPV and TM vehicles
Method 2 Combined TM vehicle and crash cushion
Method 3 No vehicle in lane, operatives walk in closure
Option Hard
shoulder
No hard
shoulder
Nearside
closure
Offside
closure
Method 1 Method 2 Method 3
1
2
3
4
5
6
7
8
9
10

Client Project Report
76
C.5 Advanced Sign Removal
Option TM
Vehicle TM vehicle with crash cushion
TMV and separate IPV
No hard shoulder
Hard shoulder
2 lanes
3 lanes
Nearside closure
Offside closure
Sandbags Ratchet straps
Laying signs flat
Smart Signs
Barrier Mounted Signs
1. n/a n/a
2. n/a n/a
3. n/a n/a
4. n/a n/a
5. n/a n/a
6. n/a n/a
7. n/a n/a
8. n/a n/a
9. n/a n/a
10. n/a n/a
11. n/a n/a
12. n/a n/a
13. n/a n/a
14. n/a n/a
15. n/a n/a
16. n/a n/a
17. n/a n/a
18. n/a n/a
19. n/a n/a
20. n/a n/a
21.
22.
23.
24.
25.
26.
27.
28.
29.
30.
31.
32.

Client Project Report
77
Option TM Vehicle
TM vehicle with crash cushion
TMV and separate IPV
No hard shoulder
Hard shoulder
2 lanes
3 lanes
Nearside closure
Offside closure
Sandbags Ratchet straps
Laying signs flat
Smart Signs
Barrier Mounted Signs
33.
34.
35.
36.
37.
38.
39.
40.
41. n/a n/a
42. n/a n/a
43. n/a n/a
44. n/a n/a
45. n/a n/a
46. n/a n/a
47. n/a n/a
48. n/a n/a
49. n/a n/a
50. n/a n/a
51.
52.
53.
54.
55.
56.
57.
58.
59.
60.
61.
62.
63.
64.
65.
66.
67.

Client Project Report
78
Option TM Vehicle
TM vehicle with crash cushion
TMV and separate IPV
No hard shoulder
Hard shoulder
2 lanes
3 lanes
Nearside closure
Offside closure
Sandbags Ratchet straps
Laying signs flat
Smart Signs
Barrier Mounted Signs
68.
69.
70.

Client Project Report
79
Appendix D Subtasks
Probability of being struck Exposure (seconds) Consequence
Stage Option Task
Number
Task Description Driver
of TMV
Driver
of
IPV
Operative
1
Operative
2
Driver
of TMV
Driver
of
IPV
Operative
1
Operative
2
Driver
of TMV
Driver
of
IPV
Operative
1
Operative
2
3 1 1 TMV and IPV stop on
hard shoulder at start of
taper. 35 35 35 35 220 220 10 10 V IV V V
2 Unload 610 arrow, stand
and sandbags. n/a n/a 35 35 n/a n/a 60 60 V n/a V V
3 Install sign at start of
taper. n/a n/a 100 100 n/a n/a 150 150 V n/a V V
4 TMV and IPV travel along
hard shoulder dropping
cones from non-trafficked
side of the vehicle at
appropriate spacings. 35 35 35 35 360 360 360 360 V IV V V
5 TMV and IPV stop on
hard shoulder at end of
the lane closure. 35 35 n/a n/a 150 810 n/a n/a V IV V V
6 Operatives walk back
along hard shoulder to
start of taper. 35 n/a 35 35 360 n/a 360 360 V n/a V V
7 Walk cones and lights out
from hard shoulder to
form the taper. 90 n/a 90 90 300 n/a 300 300 V n/a V V
8 Install 610 arrow sign at
end of taper. n/a n/a 60 60 n/a n/a 150 150 V n/a V V
3 2 1 TMV stops on hard
shoulder at start of taper. 35 n/a 35 35 220 n/a 10 10 V n/a V V
2 IPV stops on hard
shoulder 50m before the
start of the taper. n/a 35 n/a n/a n/a 1390 n/a n/a n/a IV n/a n/a

Client Project Report
80
Probability of being struck Exposure (seconds) Consequence
Stage Option Task
Number
Task Description Driver
of TMV
Driver
of
IPV
Operative
1
Operative
2
Driver
of TMV
Driver
of
IPV
Operative
1
Operative
2
Driver
of TMV
Driver
of
IPV
Operative
1
Operative
2
3 Unload 610 arrow, stand
and sandbags. n/a n/a 35 35 n/a n/a 60 60 n/a n/a V V
4 Install sign at start of
taper. n/a n/a 100 100 n/a n/a 150 150 n/a n/a V V
5 TMV travel along hard
shoulder dropping cones
from non-trafficked side
of the vehicle at
appropriate spacings. 35 n/a 35 35 360 n/a 360 360 V n/a V V
6 TMV stop on hard
shoulder at end of the
lane closure. 35 n/a n/a n/a 150 n/a n/a n/a V n/a n/a n/a
7 Operatives walk back
along hard shoulder to
start of taper. 35 n/a 35 35 360 n/a 360 360 V n/a V V
8 Walk cones and lights out
from hard shoulder to
form the taper. 90 n/a 90 90 300 n/a 300 300 V n/a V V
9 Install 610 arrow sign at
end of taper. n/a n/a 60 60 n/a n/a 150 150 V n/a V V
3 3 1 TMIPV stop on hard
shoulder at start of taper. 35 35 35 35 220 n/a 10 10 IV n/a IV IV
2 Unload 610 arrow, stand
and sandbags. n/a n/a 35 35 n/a n/a 60 60 V n/a V V
3 Install sign at start of
taper. n/a n/a 100 100 n/a n/a 150 150 V n/a V V
4 TMIPV travel along hard
shoulder dropping cones
from non-trafficked side
of the vehicle at
appropriate spacings. 35 35 35 35 360 n/a 360 360 IV n/a IV IV

Client Project Report
81
Probability of being struck Exposure (seconds) Consequence
Stage Option Task
Number
Task Description Driver
of TMV
Driver
of
IPV
Operative
1
Operative
2
Driver
of TMV
Driver
of
IPV
Operative
1
Operative
2
Driver
of TMV
Driver
of
IPV
Operative
1
Operative
2
5 TMVIPV stop on hard
shoulder at end of the
lane closure. 35 35 n/a n/a 150 n/a n/a n/a IV n/a n/a n/a
6 Operatives walk back
along hard shoulder to
start of taper. 35 n/a 35 35 360 n/a 360 360 V n/a V V
7 Walk cones and lights out
from hard shoulder to
form the taper. 90 n/a 90 90 300 n/a 300 300 V n/a V V
8 Install 610 arrow sign at
end of taper. n/a n/a 60 60 n/a n/a 150 150 V n/a V V
3 4 1 TMV stop on hard
shoulder at start of taper. 35 35 35 35 220 n/a 10 10 V n/a V V
2 Unload 610 arrow, stand
and sandbags. n/a n/a 35 35 n/a n/a 60 60 V n/a V V
3 Install sign at start of
taper. n/a n/a 100 100 n/a n/a 150 150 V n/a V V
4 TMV travel along hard
shoulder dropping cones
from non-trafficked side
of the vehicle at
appropriate spacings. 35 35 35 35 360 n/a 360 360 V n/a V V
5 TMV stop on hard
shoulder at end of the
lane closure. 35 35 n/a n/a 150 n/a n/a n/a V n/a n/a n/a
6 Operatives walk back
along hard shoulder to
start of taper. 35 n/a 35 35 360 n/a 360 360 V n/a V V
7 Walk cones and lights out
from hard shoulder to
form the taper. 90 n/a 90 90 300 n/a 300 300 V n/a V V

Client Project Report
82
Probability of being struck Exposure (seconds) Consequence
Stage Option Task
Number
Task Description Driver
of TMV
Driver
of
IPV
Operative
1
Operative
2
Driver
of TMV
Driver
of
IPV
Operative
1
Operative
2
Driver
of TMV
Driver
of
IPV
Operative
1
Operative
2
8 Install 610 arrow sign at
end of taper. n/a n/a 60 60 n/a n/a 150 150 V n/a V V
3 5 1 TMV and IPV stop on lane
1 at start of taper. 35 100 35 35 220 220 10 10 V IV V V
2 Unload 610 arrow, stand
and sandbags. n/a n/a 35 35 n/a n/a 60 60 V n/a V V
3 Install sign at start of
taper. n/a n/a 35 35 n/a n/a 150 150 V n/a V V
4 TMV and IPV travel along
lane 1 dropping cones
from non-trafficked side
of the vehicle at
appropriate spacings. 35 100 35 35 360 360 360 360 V IV V V

Client Project Report
83
Appendix E Scope and Assumptions
Only „relaxation‟ traffic management schemes, as defined in Chapter 8, have been
considered. (Relaxation TM schemes are installed where there is good visibility;
low traffic flows and are in situ for less than 24 hours.)
Only planned traffic management will be considered as opposed to operations
conducted in response to an accident/ incident.
Only temporary traffic management on the carriageway will be considered (not
hard shoulder, exit or entry slip roads as these have different methodologies and
considerations).
The carriageway is considered to be unlit, so that none of the temporary signs
require lighting
The installation and removal of advanced signs, Detail A and the taper has been
included in the scope but the longitudinal run has not.
There are numerous hazards that road workers are exposed to including noise,
slips and trips, and manual handling. All of these can cause injury and present
risks to road workers. However, for the basic MIRi index the only hazard that is
considered is the primary hazard of being struck by a road user vehicle.
Therefore, the risks calculated will be the risk of a worker or vehicle being struck
by a vehicle as opposed to being injured by other means.
Barrier type, varying restraint systems within vehicles, remotely operated sign
reliability, traffic flows, carriageway topography and equipment reliability have
not been considered at this stage.
Exposure Assumptions:
It takes an average of 3 seconds for one operative to cross one lane
It takes an average of150 seconds for an operative to put up a sign and stand.
It takes an operative 160 seconds to put up sign with ratchet strap
It takes an operative 150 seconds to reassemble a sign when it has been laid flat
with sandbags.
It takes 100 seconds for an operative to mount a sign on a barrier. 2 people for
barrier mounted sign – one as look out.
2 operatives are required to cross the carriageway for 1 sign and 1 stand
2 operatives are required to cross carriageway with sufficient sand bags
It takes an average of 60 seconds to drive between sign locations (this time
includes getting in and out of vehicle.)
It takes an average of 60 seconds to unload the signs from the traffic
management vehicle.
The drivers of traffic management vehicles (with or without combined crash
cushion) exit the vehicle and assist with sign installation.
The driver of an IPV remains in the vehicle for the entire temporary traffic
management installation.
The traffic management vehicle driver puts up signs on the verge/ hard shoulder
whilst the remaining 2 operatives assemble signs on the central reserve.
The total of all the waiting in vehicles, for example whilst moving signs, securing
load, lowering truck sides etc is detailed under one subtask for each task entitled
„wait in vehicle‟.
30 seconds stopping time is required for operatives to raise remotely operated
sign from within the traffic management vehicle
Waiting time in a live lane is the same as waiting time on the hard shoulder
It takes an operative longer to off load Detail A as cones as well as signs
The driver is out of the traffic management vehicle when installing Detail A but is
not actually involved with the installation
For the Detail A installation using method DA2 the sign, stand and sand bags are
crossed over the carriageway separately. This equates to 8 crossings (4 for each

Client Project Report
84
operative) = 24 seconds for each operative for 2 lane and 36 seconds for each
operative for 3 lanes.
Traffic management vehicles travel at 5 km/h when dropping cones which
equates to 360 seconds for a 500 m taper
It is assumed that for method DA2, operatives are required to cross a three lane
carriageway
25 crossings are required for 51 cones to be walked out to the central reserve.
This assumes that operatives carry 2 cones each for each crossing.
Consequence Assumptions
If a vehicle is struck in lane 3, it is more likely to be struck by a car than any
other vehicle due to the vehicle composition in lane 3.
If a vehicle is struck on hard shoulder, it is most likely to be struck by an HGV
If a vehicle is struck in lane 1, it is likely to be struck by an HGV. This assumes a
worst case scenario but also considers that at off peak times when TTM is being
deployed there are likely to be more HGVs than cars in lane 1.
If an IPV is struck by a car travelling at 70mph, it is not likely to be shunted
beyond the 50m clearance zone
If an IPV is struck by an HGV travelling at 56mph it is likely to be shunted beyond
the 50m clearance zone
Passengers of a TMIPV have same protection as the driver when sitting in vehicle
cab using the appropriate vehicle restraints.
If a crash cushion is struck by an HGV, the driver and passengers are likely to
have very serious injuries (IV)
If a crash cushion is struck by a car, the driver and passengers are likely to have
minor injuries (II)
If an operative is on the back of a TMIPV and it is struck by an HGV the
consequences are likely to be very serious (IV)
If an operative is on the back of a TMIPV and it is struck by a car the
consequences are likely to be major (III)
If an operative is struck by any vehicle the consequence is likely to be fatal (V).
If a TM vehicle is struck by a vehicle on the hard shoulder the consequences are
likely to be fatal (V)
If a TM vehicle is struck in lane 3 (cars) then the consequences are likely to be
very serious (IV)
If any vehicle is struck whilst operatives are on the back of the vehicle, the
consequences are likely to be fatal. (V).
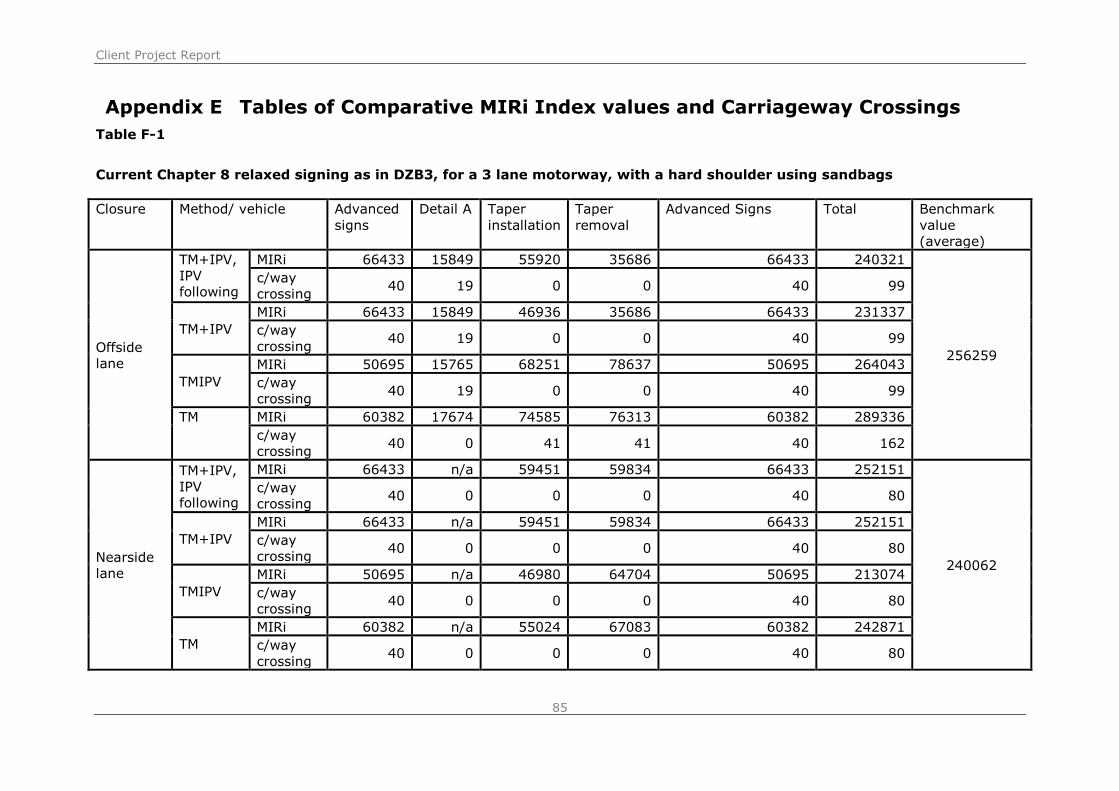
Client Project Report
85
Appendix E Tables of Comparative MIRi Index values and Carriageway Crossings
Table F-1
Current Chapter 8 relaxed signing as in DZB3, for a 3 lane motorway, with a hard shoulder using sandbags
Closure Method/ vehicle Advanced
signs
Detail A Taper
installation
Taper
removal
Advanced Signs Total Benchmark
value
(average)
Offside
lane
TM+IPV,
IPV
following
MIRi 66433 15849 55920 35686 66433 240321
256259
c/way
crossing 40 19 0 0 40 99
TM+IPV
MIRi 66433 15849 46936 35686 66433 231337
c/way
crossing 40 19 0 0 40 99
TMIPV
MIRi 50695 15765 68251 78637 50695 264043
c/way
crossing 40 19 0 0 40 99
TM MIRi 60382 17674 74585 76313 60382 289336
c/way
crossing 40 0 41 41 40 162
Nearside
lane
TM+IPV,
IPV
following
MIRi 66433 n/a 59451 59834 66433 252151
240062
c/way
crossing 40 0 0 0 40 80
TM+IPV
MIRi 66433 n/a 59451 59834 66433 252151
c/way
crossing 40 0 0 0 40 80
TMIPV
MIRi 50695 n/a 46980 64704 50695 213074
c/way
crossing 40 0 0 0 40 80
TM
MIRi 60382 n/a 55024 67083 60382 242871
c/way
crossing 40 0 0 0 40 80

Client Project Report
86
Table F-2 Removal of 600yd and 200yd wicket and Detail A (3 lane motorway with hard shoulder, offside closure)
Closure Method/ vehicle Advanced
signs
Detail
A
Taper
installation
Taper
removal
Advanced Signs Total Benchmark
value
(average)
Offside
TM+IPV, IPV
following
Carriageway
crossings
MIRi 49033 0 55920 35686 49033 189672
205175
c/way
crossing 24 0 0 0 24 48
TM+IPV
MIRi 49033 0 46936 35686 49033 180688
c/way
crossing 24 0 0 0 24 48
TMIPV
MIRi 33295 0 68251 78637 33295 213478
c/way
crossing 24 0 0 0 24 48
TM
MIRi 42982 0 74585 76313 42982 236862
c/way
crossing 24 0 41 41 24 130
Removal of 600yd and 200yd wicket (3 lane motorway with hard shoulder, nearside closure)
Closure Method/ vehicle Advanced
signs
Detail
A
Taper
installation
Taper
removal
Advanced Signs Total Benchmark
value
(average)
Nearside
TM+IPV, IPV
following
MIRi 49033 n/a 59451 59834 49033 217351
205262
c/way
crossing 24 0 0 0 24 48
TM+IPV
MIRi 49033 n/a 59451 59834 49033 217351
c/way
crossing 24 0 0 0 24 48
TMIPV
MIRi 33295 n/a 46980 64704 33295 178274
c/way
crossing 24 00 0 0 24 48
TM
MIRi 42982 n/a 55024 67083 42982 208071
c/way
crossing 24 0 0 24 48

Client Project Report
87
Table F-3 Comparison of MIRi Index values and carriageway crossings for Offside Signs Relaxation
Three lane motorway with hard
shoulder
Nearside closure, with sandbags
Closure Method/ vehicle Advanced
signs
Detail A Taper
installation
Taper
removal
Advanced
Signs
Total Benchmark value
(average)
Nearside
TM+IPV,
IPV
following
MIRi 66433 n/a 59451 59834 66433 252151
240062
c/way crossing
40 0 0 0 40 80
TM+IPV MIRi 66433 n/a 59451 59834 66433 252151
c/way crossing
40 0 0 0 40 80
TMIPV MIRi 50695 n/a 46980 64704 50695 213074
c/way
crossing 40
0 0 0 40 80
TM MIRi 60382 n/a 55024 67083 60382 242871
c/way crossing
40 0 0 0 40 80
Offside signs relaxation, remove , 1 mile board,800, 600, 400, 200 yd wickets from centre reserve
Closure Method/ vehicle Advanced
signs
Detail A Taper
installation
Taper
removal
Advanced
Signs
Total Benchmark value
(average)
Nearside
TM+IPV,
IPV
following
MIRi 36738 n/a 59451 59834 36738 192761
180672
c/way crossing
0 0 0
TM+IPV MIRi 36738 n/a 59451 59834 36738 192761
c/way crossing
0 0 0
TMIPV MIRi 21000 n/a 46980 64704 21000 153684
c/way
crossing 0 0 0
TM MIRi 30687 n/a 55024 67083 30687 183481
c/way crossing
0 0 0
0

Client Project Report
88
Table F-4: Percentage reductions for Sign Simplification, offside closure
Method/vehicle Carriageway crossing
reduction Percentage reduction MIRI reduction Percentage reduction
TM+IPV, IPV following
51 (99 to 48) = 52%
50649 21%
TM+IPV 51 (99 to 48) = 52%
50649 22%
TMIPV 51 (99 to 48) = 52%
50565 19%
TM 32 (162 to 130) = 20%
52474 18%
Table F-5: Percentage reductions for Sign Simplification, nearside closure
Method/vehicle Carriageway crossing
reduction Percentage reduction MIRI reduction Percentage reduction
TM+IPV, IPV following
32 (80 to 48) = 40%
34800 13.8
TM+IPV 32 (80 to 48) = 40%
34800 13.8
TMIPV 32 (80 to 48) = 40%
34800 16.3
TM 32 (80 to 48) = 40%
34800 14.3

Client Project Report
89
Table F7: Percentage reductions for offside sign removal, nearside closure
Method/vehicle Carriageway
crossing reduction Percentage reduction
MIRI reduction Percentage reduction
TM+IPV, IPV
following
80 (80 to 0)
= 100%
59390 24%
TM+IPV 80 (80 to 0) = 100%
59390 24%
TMIPV 80 (80 to 0) = 100%
59390 28%
TM 80 (80 to 0) = 100%
59390 24%