development of subcortical speech representation in human … · 2015-07-13 · development of...
TRANSCRIPT
Development of subcortical speech representationin human infants
Samira Andersona)
Department of Hearing and Speech Sciences, University of Maryland, College Park, Maryland 20742, USA
Alexandra Parbery-ClarkCenter for Hearing and Skull Base Surgery, Swedish Neuroscience Specialists, Seattle, Washington 98122,USA
Travis White-Schwoch and Nina KrausDepartment of Communication Sciences, Northwestern University, Evanston, Illinois 60208, USA
(Received 2 November 2014; revised 19 April 2015; accepted 22 April 2015)
Previous studies have evaluated representation of the fundamental frequency (F0) in the frequency
following response (FFR) of infants, but the development of other aspects of the FFR, such as
timing and harmonics, has not yet been examined. Here, FFRs were recorded to a speech syllable
in 28 infants, ages three to ten months. The F0 amplitude of the response was variable among
individuals but was strongly represented in some infants as young as three months of age. The
harmonics, however, showed a systematic increase in amplitude with age. In the time domain,
onset, offset, and inter-peak latencies decreased with age. These results are consistent with
neurophysiological studies indicating that (1) phase locking to lower frequency sounds emerges
earlier in life than phase locking to higher frequency sounds and (2) myelination continues
to increase in the first year of life. Early representation of low frequencies may reflect greater
exposure to low frequency stimulation in utero. The improvement in temporal precision likely
parallels an increase in the efficiency of neural transmission accompanied by exposure to speech
during the first year of life. VC 2015 Acoustical Society of America.
[http://dx.doi.org/10.1121/1.4921032]
[ICB] Pages: 3346–3355
I. INTRODUCTION
Cochlear mechanics are presumed to be mature at birth
on the basis of models that account for immaturities in outer
and middle ear transmission in infants (Abdala and Keefe,
2006). These findings are supported by morphological evi-
dence that the organ of Corti develops prior to birth
(Lavigne-Rebillard and Pujol, 1987). Evidence from evoked
potentials, however, indicates that the central auditory sys-
tem continues to mature into school-age years and adoles-
cence in human (Ceponiene et al., 2002; Kushnerenko et al.,2002; Johnson et al., 2008; Sussman et al., 2008; Choudhury
and Benasich, 2011; Marcoux, 2011; Mahajan and
McArthur, 2012; Skoe et al., 2013) and in animal models
(Venkataraman and Bartlett, 2013a), with the prominence of
specific cortical peaks changing with age (Ponton et al.,2000). Observed changes include earlier latencies, decreased
response variability, and increased response magnitude of
subcortical and cortical components. However, little is
known about early development of midbrain responses to
speech stimuli. Thus, the goal of this study is to investigate
changes in midbrain responses to a speech syllable, which
are discussed in the context of the literature on auditory
neurodevelopment.
Four factors may account for the protracted maturation
of auditory evoked potentials: myelination, synaptic
transmission, phase locking, and tonotopicity. First, although
structures along the human auditory brainstem and midbrain
are myelinated by the 29th gestational week, the density of
myelination continues to increase until at least 1 year post-
natally (Moore et al., 1995; Sano et al., 2007). This increase
in myelination likely results in reductions in neural conduc-
tion time as measured by inter-wave peak latencies in the
auditory brainstem response (ABR) (Salamy, 1984; Gorga
et al., 1989; Moore et al., 1996; Hurley et al., 2005).
Reductions in neural conduction time may also be attributed
to changes in synaptic function—animal models have
demonstrated rapid developmental changes in brainstem and
midbrain synaptic function in infancy (Sanes, 1993;
Venkataraman and Bartlett, 2013b). Developmental changes
in phase locking properties of neurons may affect encoding
of the frequency components of the acoustic signal. Phase
locking for low-frequency signals (i.e., below 600 Hz) in the
kitten’s auditory nerve and brainstem emerges rapidly
(within 7 to 10 postnatal days) but adult-like phase locking
for higher frequencies is not achieved until the end of the
third postnatal week (Brugge et al., 1978; Kettner et al.,1985). Later development of midbrain responses to high fre-
quencies has also been demonstrated in animal models:
lower frequency response domains of the rat and mouse infe-
rior colliculus (IC) develop earlier than those sensitive to
high frequencies (Romand and Ehret, 1990; Pierson and
Snyder-Keller, 1994). This postnatal maturation of the
subcortical auditory system may have implications for thea)Electronic mail: [email protected]
3346 J. Acoust. Soc. Am. 137 (6), June 2015 0001-4966/2015/137(6)/3346/10/$30.00 VC 2015 Acoustical Society of America

development of both temporal and spectral processing during
infancy.
Temporal processing studies in human infants and
young children have shown that while the ABR to clicks is
adult-like in morphology at 3 months of age (Salamy, 1984),
development is associated with faster neural conduction time
and earlier ABR peak latencies (Salamy, 1984; Gorga et al.,1989; Hurley et al., 2005; Skoe et al., 2013). The increase in
neural conduction time and improved processing may con-
tribute to the development of temporal resolution, which has
been evaluated in both perceptual and electrophysiological
studies of forward masking and gap detection. For example,
the effects of forward masking are greater in infants com-
pared to young adults, as measured by ABR latency prolon-
gations (Lasky, 1993) and higher perceptual detection
thresholds (Werner, 1999). In contrast, Werner et al. (2001)
found no differences in ABR gap detection thresholds
between infants and young adults. Cortically, Trainor et al.(2001) also found that gap detection thresholds are equiva-
lent in six-month infants and young adults. These studies
used clicks, tones, and broadband noise, but early develop-
ment of temporal encoding using speech-like stimuli has not
yet been evaluated.
The encoding of spectral cues is another aspect of audi-
tory development that is important for speech perception and
language development, and behavioral and electrophysiolog-
ical studies suggest that frequency encoding is immature at
birth. For example, the mismatch negativity response
(MMN) has been used to objectively evaluate pitch discrimi-
nation in infants. Several studies have demonstrated a MMN
response in newborn and young infants to stimuli that differ
in frequency (e.g., 1000 Hz, frequent stimulus; 1100 Hz,
deviant stimulus) (Alho et al., 1990; Lepp€anen et al., 1997;�Ceponiene et al., 2002), but changes in the direction of the
mismatch response (negative vs positive) or latency of the
response may occur as the infant develops (Morr et al.,2002; He et al., 2007), indicating that frequency encoding
changes with development. These studies are consistent with
behavioral evidence that infants can detect frequency
changes as small as 2% to 3%, with smaller frequency differ-
ence limens in 6-month compared to 3-month old infants
(Olsho et al., 1987). Behavioral and electrophysiological
studies of frequency tuning also suggest that spectral resolu-
tion is immature at birth and improves significantly by 6
months of age (Benson Spetner and Werner, 1990; Abdala
and Folsom, 1995).
Less is known about the neural transcription of speech-
like sounds during infancy. The current study employs the
frequency following response (FFR), a non-invasive electro-
physiologic recording that reflects the summed neural activ-
ity that phase locks to the frequency content of the stimulus.
In contrast to the ABR which requires a brief, transient stim-
ulus to generate a robust response, the FFR can be recorded
to longer stimuli, such as tones, speech syllables, musical
chords, or even words and, therefore, can be used to evaluate
encoding of temporal and spectral information at early levels
of the auditory system (Galbraith et al., 1995; Skoe and
Kraus, 2010). The first study to record the FFR in newborn
infants found adult-like amplitudes in response to a 500-Hz
toneburst; however, peak latencies in response to low-
frequency stimuli were delayed compared to those of adults
(Gardi et al., 1979). A more recent study using vowels found
robust representation of the fundamental frequency (F0) in
neonates (Jeng et al., 2011). At this time, limited information
is available regarding the representation of other speech fea-
tures in the infant FFR (i.e., timing and spectral compo-
nents). Here, subcortical speech representation is evaluated
in infants ranging from ages 3 to 10 months. It is hypothe-
sized that physiological changes associated with develop-
ment are reflected in the FFR. Specifically, neural
conduction times reflected in peak latencies will decrease in
the first year of life, both for click and speech stimuli. On the
basis of previous behavioral and electrophysiological studies
(Olsho et al., 1987; He et al., 2007; Jeng et al., 2010; Alho
et al., 2012), it is predicted that while F0 representation may
reflect language-specific input (i.e., tonal vs nontonal lan-
guages) (Jeng et al., 2010), its emerges early in development,
and the amplitude of mid- and high-frequency components
continues to change during the first year of life. Knowledge
of the time course of subcortical representation of speech
components may provide the building blocks for insight into
the neural mechanisms of early language development.
II. METHODS
A. Participants
Participants comprised 28 healthy babies, ranging in age
from 3 to 10 months, who had no history of ear infections,
hearing loss, or neurological impairment and were raised in
an English-speaking environment. They were recruited by
word-of-mouth and through the Early Learning Laboratory
in the Department of Communication Sciences and
Disorders at Northwestern University. The procedures were
approved by the Northwestern Institutional Review Board.
All participants passed a distortion-product otoacoustic
emissions screening (þ6 SNR at 4/5 frequencies from 2 to 8
kHz; Biologic Scout Sport, Natus Medical, Inc., Mundelein,
IL) and had normal click Wave V latencies for gestational
age (Hall and Mueller, 1997; Jiang et al., 2012), measured
by a click stimulus presented at 80 dB sound pressure level
(SPL) (peak equivalent) at a rate of 31.4 Hz. Participants
were compensated $10 per hour and received a baby book.
B. Electrophysiology
1. Stimuli
Brainstem responses were recorded to a 100-ls click
and a 40-ms syllable [da]. The click stimulus was a 100-ls
square wave with a broad spectrum and the 40-ms [da] was
created with a Klatt-based synthesizer (Praat; Boersma and
Weenink, 2009). While the FFR is typically elicited with
low-frequency steady-state stimuli, the [da] syllable was
chosen to assess the response to the onset and transition
regions of the response. The initial 5-ms onset burst was fol-
lowed by a consonant-to-vowel (CV) transition. After the
initial 5-ms onset burst, the F0 of the stimulus rose linearly
from 103 to 125 Hz while the first formant (F1) shifted from
220 to 720 Hz, the second formant (F2) shifted from 1700 to
J. Acoust. Soc. Am., Vol. 137, No. 6, June 2015 Anderson et al.: Infant frequency following response 3347
1240, and the third formant (F3) shifted from 2580 to
2500 Hz. The fourth (3600 Hz) and fifth (4500 Hz) formants
remained constant for the duration of the stimulus.
Both click and speech stimuli were presented monaur-
ally to the right ear using the Navigator Pro AEP System
(Natus Medical, Inc., Mundelein, IL) through electromag-
netically shielded earphones (ER-3A, Etymotic Research,
Elk Grove Village, IL) at 80 dB SPL. The click was pre-
sented with rarefaction polarity at a rate of 31 Hz, and the
[da] was presented with alternating polarities at a rate of
10.9 Hz. Prior to each recording, the levels of the [da] and
click stimuli were calibrated (peak amplitude A-weighted)
using a Br€uel & Kjær 2238 Mediator sound level meter
coupled to an insert earphone adaptor.
2. Recording
A vertical montage was used with Cz active, A2 refer-
ence, and Fpz ground. All contact impedances were <5 kXand inter-electrode impedance differences were �2 kX.
Online artifact rejection employed a criterion of 6 23 lV.
Two blocks of 1000 artifact-free sweeps were collected for
the click and two blocks of 3000 artifact-free sweeps were
collected for the [da] for each infant. The responses to the
click were sampled at 24 kHz, bandpass filtered from 100 to
1500 Hz, and averaged using a recording window of �8 to
9.8 ms. The responses to the [da] were sampled at 12 kHz,
bandpass filtered from 100 to 2000 Hz, and averaged using a
recording window of �15.8 to 58 ms. An additional block of
3000 artifact-free sweeps of the [da] was collected when the
artifact rejection rate exceeded 20% or when the waveform
peaks did not replicate, and the best 2/3 blocks with the few-
est rejected sweeps were averaged. The collection protocol
lasted approximately 20 min with the infants sitting in an
infant carrier or on their mothers’ laps while a second tester
engaged the infants with colorful toys.
3. Data analysis
a. Frequency domain. Spectral amplitudes were com-
puted on the averaged responses using fast Fourier trans-
forms (FFTs) from 22 to 42 ms of the response, a time
window that encompasses the FFR (peaks D–F; see Fig. 1).
Spectral energy was calculated over three frequency ranges:
F0: 103–125 Hz; mid harmonics corresponding to the first
formant (F1): 220–720 Hz; and high harmonics (HH):
720–1120 (the maximum frequency at which responses were
observed above the noise floor). To ensure that the ampli-
tudes of these frequency ranges exceeded the noise floor,
spectral energy for these three frequency ranges was calcu-
lated for the pre-stimulus period (�15 to 0 ms). Spectral
energy was also calculated for the F0 and its multiple har-
monics through the tenth harmonic in 60 Hz bins, and noise
levels were calculated for the same frequency regions. Zero
padding was applied prior to the transform, and the FFTs
were run with a Hanning window and a 4 ms ramp.
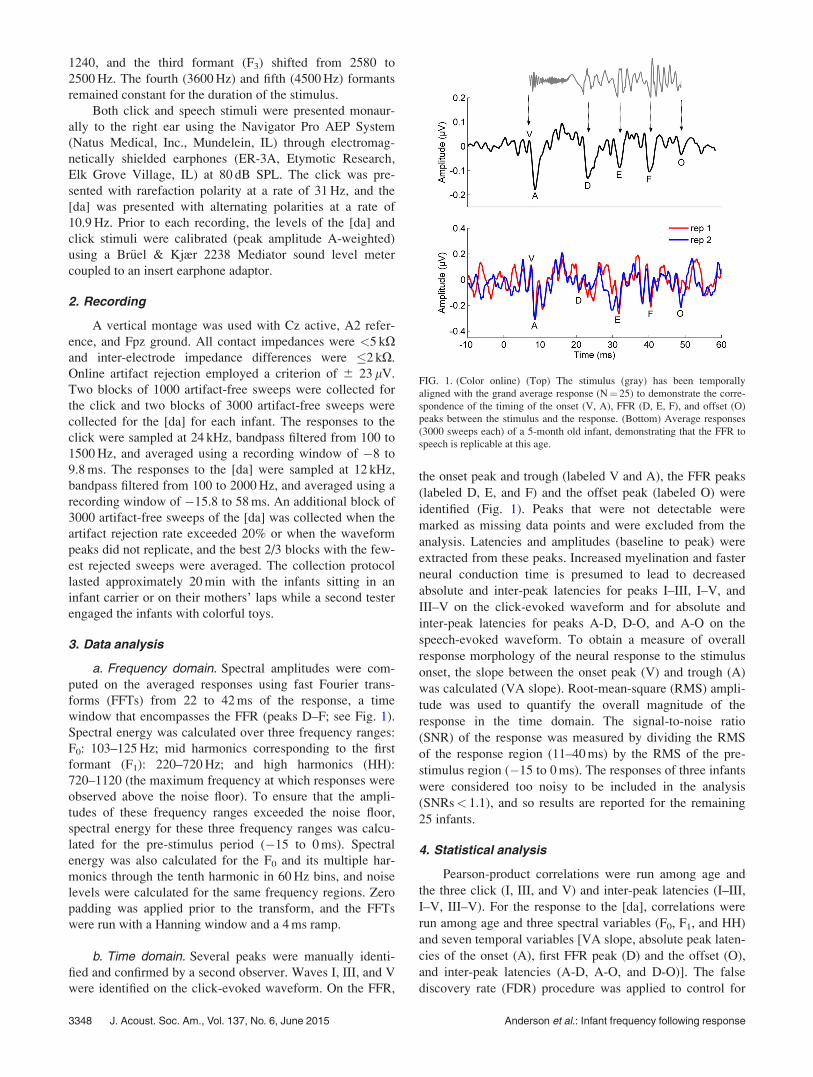
b. Time domain. Several peaks were manually identi-
fied and confirmed by a second observer. Waves I, III, and V
were identified on the click-evoked waveform. On the FFR,
the onset peak and trough (labeled V and A), the FFR peaks
(labeled D, E, and F) and the offset peak (labeled O) were
identified (Fig. 1). Peaks that were not detectable were
marked as missing data points and were excluded from the
analysis. Latencies and amplitudes (baseline to peak) were
extracted from these peaks. Increased myelination and faster
neural conduction time is presumed to lead to decreased
absolute and inter-peak latencies for peaks I–III, I–V, and
III–V on the click-evoked waveform and for absolute and
inter-peak latencies for peaks A-D, D-O, and A-O on the
speech-evoked waveform. To obtain a measure of overall
response morphology of the neural response to the stimulus
onset, the slope between the onset peak (V) and trough (A)
was calculated (VA slope). Root-mean-square (RMS) ampli-
tude was used to quantify the overall magnitude of the
response in the time domain. The signal-to-noise ratio
(SNR) of the response was measured by dividing the RMS
of the response region (11–40 ms) by the RMS of the pre-
stimulus region (�15 to 0 ms). The responses of three infants
were considered too noisy to be included in the analysis
(SNRs< 1.1), and so results are reported for the remaining
25 infants.
4. Statistical analysis
Pearson-product correlations were run among age and
the three click (I, III, and V) and inter-peak latencies (I–III,
I–V, III–V). For the response to the [da], correlations were
run among age and three spectral variables (F0, F1, and HH)
and seven temporal variables [VA slope, absolute peak laten-
cies of the onset (A), first FFR peak (D) and the offset (O),
and inter-peak latencies (A-D, A-O, and D-O)]. The false
discovery rate (FDR) procedure was applied to control for
FIG. 1. (Color online) (Top) The stimulus (gray) has been temporally
aligned with the grand average response (N¼ 25) to demonstrate the corre-
spondence of the timing of the onset (V, A), FFR (D, E, F), and offset (O)
peaks between the stimulus and the response. (Bottom) Average responses
(3000 sweeps each) of a 5-month old infant, demonstrating that the FFR to
speech is replicable at this age.
3348 J. Acoust. Soc. Am., Vol. 137, No. 6, June 2015 Anderson et al.: Infant frequency following response
the 16 multiple comparisons (Benjamini and Hochberg,
1995), with a resulting a level of 0.0125. On the basis of evi-
dence of improvement in spectral and temporal resolution
(frequency tuning curves and gap detection) by the age of 6
months (Benson Spetner and Werner, 1990; Werner, 1999),
a group analysis was conducted as a follow-up to the correla-
tions. The infants were divided into a younger group (ages 3
to 5 months; n¼ 12) and an older group (ages 6 to 10
months; n¼ 13). Independent samples t tests were run
between younger and older infants on the latency variables.
Univariate analyses of covariance (ANCOVA) were run
between younger and older infants on the spectral variables,
using noise amplitude in the corresponding frequency bin as
a covariate. The Shapiro-Wilk test for normality confirmed
that all variables were multivariate normal. See Table I for
mean spectral and noise amplitudes, standard deviations
(SDs) and percentage of participants in each group whose
signal-to-noise ratios (SNRs) exceeded 1; see Table II for
mean peak latencies and amplitudes, inter-peak latencies,
SDs, and percent detectability for the click responses in the
two age groups; and see Table III for mean peak latencies
and amplitudes, inter-peak latencies, SDs, and percent peak
detectability for responses to the [da] stimulus for the two
age groups.
III. RESULTS
A. Frequency domain
F1 (220–720 Hz) and HH (720–1120 Hz) amplitudes
increased with age (F1: r¼ 0.424, p¼ 0.035; HH: r¼ 0.575,
p¼ 0.003), but there were no correlations between age and the
F0 amplitude (r¼ 0.222, p¼ 0.286). Only the correlation
between age and HH is significant after applying the FDR cor-
rection. When covarying for noise magnitude in the same fre-
quency ranges, only the correlation between age and HH
remained significant (r¼ 0.470, p¼ 0.020). When covarying
for noise, the older group had larger spectral amplitudes in the
F1 [F(1,22)¼ 4.605, p¼ 0.043] and HH [F(1,22)¼ 6.986,
p¼ 0.015] regions but not for the F0 [F(1,22)¼ 0.947,
p¼ 0.341]. As can be seen in Fig. 2, there is considerable vari-
ability in F0 amplitude, with some of the younger babies hav-
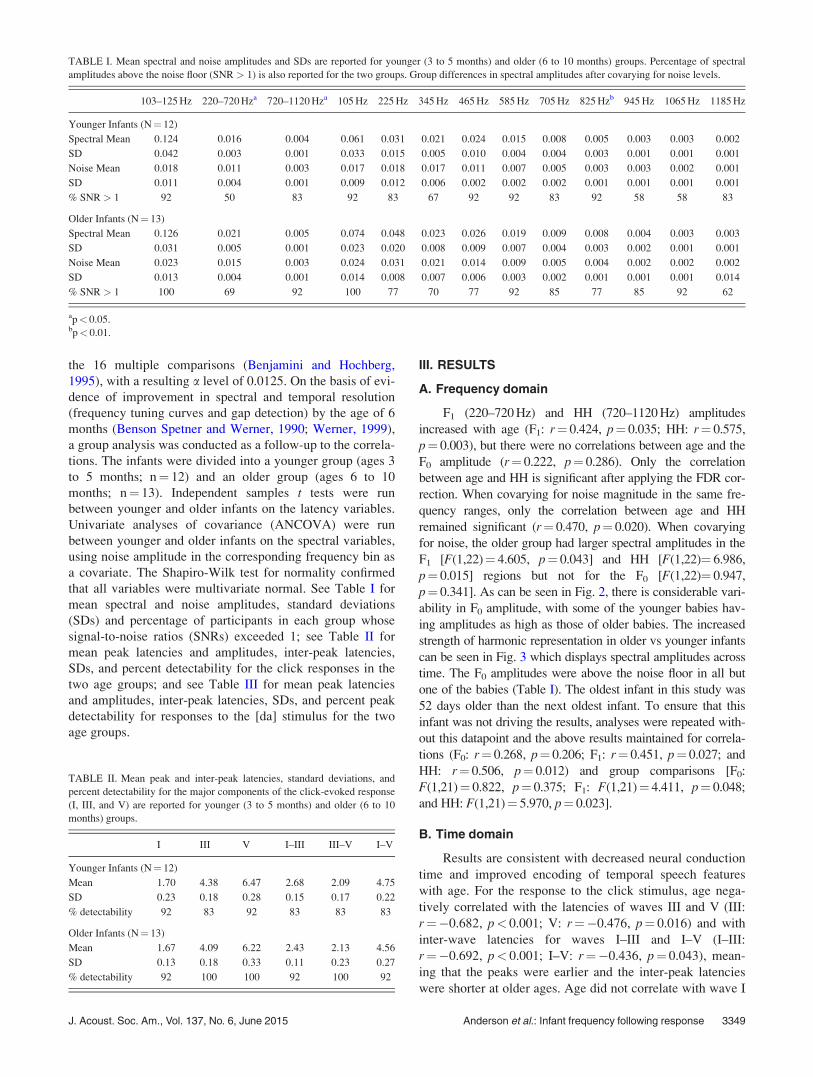
ing amplitudes as high as those of older babies. The increased
strength of harmonic representation in older vs younger infants
can be seen in Fig. 3 which displays spectral amplitudes across
time. The F0 amplitudes were above the noise floor in all but
one of the babies (Table I). The oldest infant in this study was
52 days older than the next oldest infant. To ensure that this
infant was not driving the results, analyses were repeated with-
out this datapoint and the above results maintained for correla-
tions (F0: r¼ 0.268, p¼ 0.206; F1: r¼ 0.451, p¼ 0.027; and
HH: r¼ 0.506, p¼ 0.012) and group comparisons [F0:
F(1,21)¼ 0.822, p¼ 0.375; F1: F(1,21)¼ 4.411, p¼ 0.048;
and HH: F(1,21)¼ 5.970, p¼ 0.023].
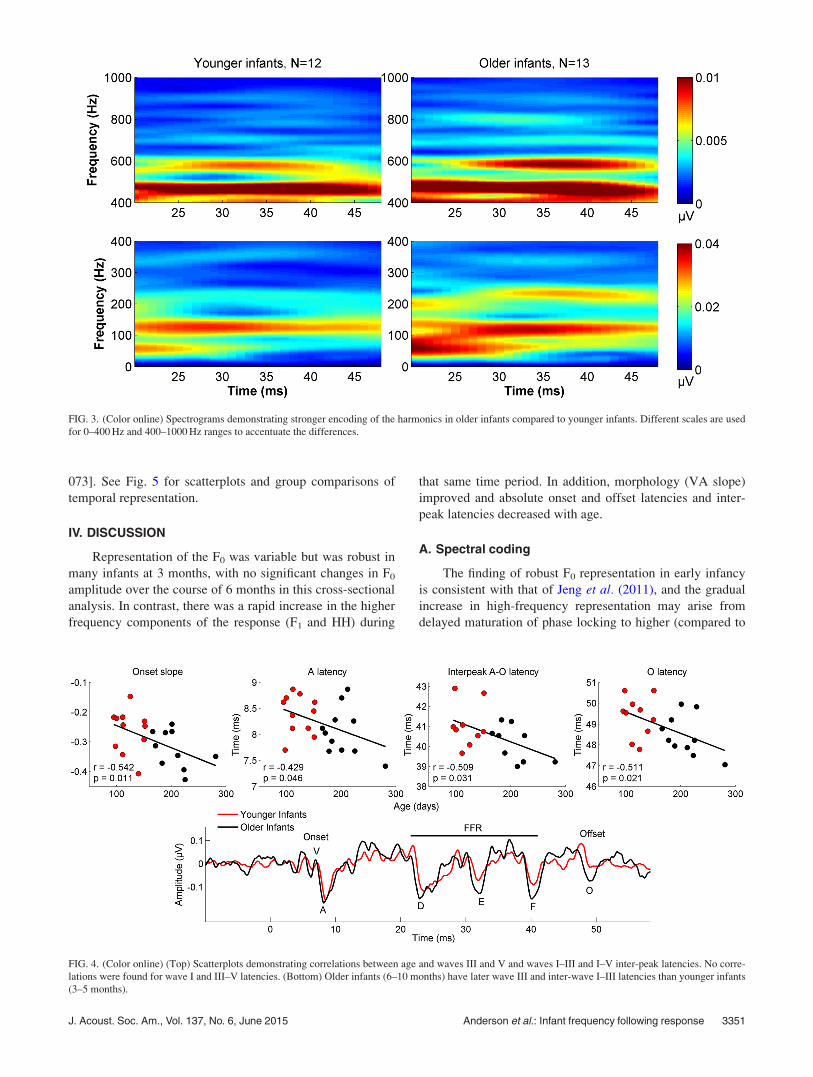
B. Time domain
Results are consistent with decreased neural conduction
time and improved encoding of temporal speech features
with age. For the response to the click stimulus, age nega-
tively correlated with the latencies of waves III and V (III:
r¼�0.682, p< 0.001; V: r¼�0.476, p¼ 0.016) and with
inter-wave latencies for waves I–III and I–V (I–III:
r¼�0.692, p< 0.001; I–V: r¼�0.436, p¼ 0.043), mean-
ing that the peaks were earlier and the inter-peak latencies
were shorter at older ages. Age did not correlate with wave I
TABLE I. Mean spectral and noise amplitudes and SDs are reported for younger (3 to 5 months) and older (6 to 10 months) groups. Percentage of spectral
amplitudes above the noise floor (SNR > 1) is also reported for the two groups. Group differences in spectral amplitudes after covarying for noise levels.
103–125 Hz 220–720 Hza 720–1120 Hza 105 Hz 225 Hz 345 Hz 465 Hz 585 Hz 705 Hz 825 Hzb 945 Hz 1065 Hz 1185 Hz
Younger Infants (N¼ 12)
Spectral Mean 0.124 0.016 0.004 0.061 0.031 0.021 0.024 0.015 0.008 0.005 0.003 0.003 0.002
SD 0.042 0.003 0.001 0.033 0.015 0.005 0.010 0.004 0.004 0.003 0.001 0.001 0.001
Noise Mean 0.018 0.011 0.003 0.017 0.018 0.017 0.011 0.007 0.005 0.003 0.003 0.002 0.001
SD 0.011 0.004 0.001 0.009 0.012 0.006 0.002 0.002 0.002 0.001 0.001 0.001 0.001
% SNR > 1 92 50 83 92 83 67 92 92 83 92 58 58 83
Older Infants (N¼ 13)
Spectral Mean 0.126 0.021 0.005 0.074 0.048 0.023 0.026 0.019 0.009 0.008 0.004 0.003 0.003
SD 0.031 0.005 0.001 0.023 0.020 0.008 0.009 0.007 0.004 0.003 0.002 0.001 0.001
Noise Mean 0.023 0.015 0.003 0.024 0.031 0.021 0.014 0.009 0.005 0.004 0.002 0.002 0.002
SD 0.013 0.004 0.001 0.014 0.008 0.007 0.006 0.003 0.002 0.001 0.001 0.001 0.014
% SNR > 1 100 69 92 100 77 70 77 92 85 77 85 92 62
ap< 0.05.bp< 0.01.
TABLE II. Mean peak and inter-peak latencies, standard deviations, and
percent detectability for the major components of the click-evoked response
(I, III, and V) are reported for younger (3 to 5 months) and older (6 to 10
months) groups.
I III V I–III III–V I–V
Younger Infants (N¼ 12)
Mean 1.70 4.38 6.47 2.68 2.09 4.75
SD 0.23 0.18 0.28 0.15 0.17 0.22
% detectability 92 83 92 83 83 83
Older Infants (N¼ 13)
Mean 1.67 4.09 6.22 2.43 2.13 4.56
SD 0.13 0.18 0.33 0.11 0.23 0.27
% detectability 92 100 100 92 100 92
J. Acoust. Soc. Am., Vol. 137, No. 6, June 2015 Anderson et al.: Infant frequency following response 3349

latency (r¼�0.150, p¼ 0.494) or with wave III–V inter-
peak latency (r¼�0.023, p¼ 0.919), suggesting that the
prolonged conduction times arise primarily from delayed
latencies in the auditory nerve and lower brainstem, as sup-
ported by Fig. 4. This is further supported by the observation
that only the correlations among age and wave III and inter-
wave I–III latencies are significant after applying the FDR
correction. Group differences were significant for wave III
and inter-peak I–III latencies [III: t(21)¼ 3.836, p¼ 0.001,
I–III: t(21)¼ 4.561, p< 0.001]. No group differences were
found for other wave peak and inter-peak latencies.
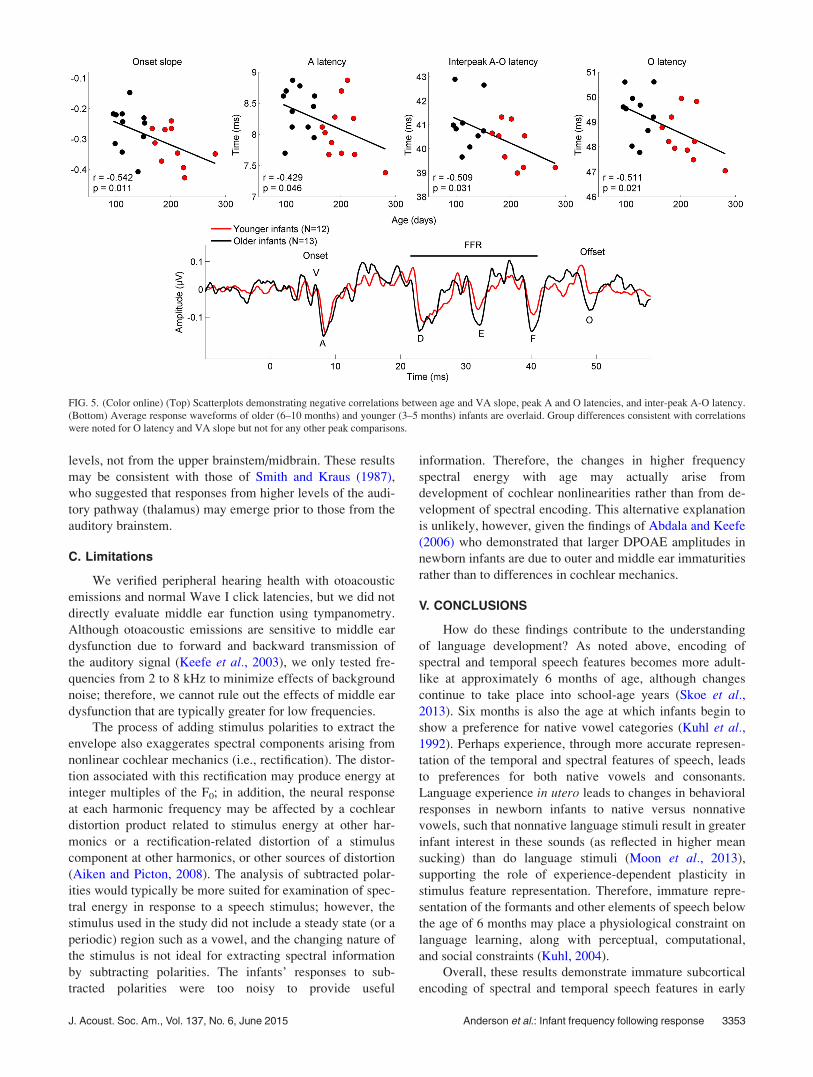
For the [da] stimulus, age negatively correlated with A
and O latencies, meaning that response peaks were later at
earlier ages (A, onset trough: r¼�0.429, p¼ 0.046, O, off-
set: r¼�0.511, p¼ 0.021) but not with D latency (first FFR
peak; r¼ 0.084, p¼ 0.711). The inter-peak A-O latency cor-
related negatively with age (r¼�0.509, p¼ 0.031). The
correlation between the inter-peak D-O latency and age was
close to significant (r¼�0.460, p¼ 0.055), but there was
no correlation between inter-peak A-D latency and age
(r¼ 0.292, p¼ 0.224). VA slope and age negatively corre-
lated (r¼�0.542, p¼ 0.011), suggesting that more precise
and robust onset responses emerge with increasing age. It
should be noted that only the correlation between age and
VA slope meets the FDR-corrected a criterion. Given that
the FFR arises primarily from the midbrain, these results are
consistent with those of click latencies noted above, for
which only the earlier latencies showed significant age
changes after FDR correction. Group differences consistent
with correlations were noted for O latency [t(18)¼ 2.105,
p¼ 0.050] and VA slope [t(19)¼ 2.097, p¼ 0.050] but not
for A or D latencies [A: t(20)¼ 1.906, p¼ 0.071, D:
t(20)¼ 0.264, p¼ 0.794] or inter-peak D-O or A-O latencies
[D-O: t(16)¼ 1.755, p¼ 0.098, A-O: t(16)¼ 1.916, p¼ 0.
TABLE III. Mean peak latencies and amplitudes and onset duration and slope are reported for younger (3 to 5 months) and older (6 to 10 months) groups.
Percent detectability of each peak is also reported for the two groups.
V A D E F O VA A-D A-O D-O
Lat Amp Lat Amp Lat Amp Lat Amp Lat Amp Lat Amp Slope Amp Lat Lat Lat
Younger Infants (N¼ 12)
Mean 7.40 0.05 8.39 0.20 23.20 0.18 31.74 0.11 40.07 0.16 49.55 0.12 0.26 0.25 14.83 41.06 26.04
SD 0.37 0.06 0.37 0.07 0.58 0.04 0.49 0.04 0.45 0.05 0.95 0.10 0.07 0.05 0.69 1.08 0.91
% Detectability 92 92 70 83 75 83 67 75 67
Older Infants (N¼ 13)
Mean 7.13 0.08 8.05 0.21 23.30 0.25 31.47 0.16 39.75 0.19 49.30 0.20 0.32 0.31 15.20 40.16 25.04
SD 0.40 0.07 0.45 0.09 1.04 0.08 0.54 0.07 0.32 0.08 0.95 0.10 0.06 0.07 0.78 0.90 1.38
% Detectability 92 77 100 92 92 77 85 69 77
FIG. 2. (Color online) (Top) Scatterplots demonstrating no correlation between age and F0 amplitude but positive correlations between age and F1 and HH
amplitudes. (Bottom) Older infants (6–10 months) have higher F1 and HH amplitudes than younger infants (3–5 months). Solid lines¼ group mean ampli-
tudes, dotted lines¼ 1 standard error. *p< 0.05.
3350 J. Acoust. Soc. Am., Vol. 137, No. 6, June 2015 Anderson et al.: Infant frequency following response
073]. See Fig. 5 for scatterplots and group comparisons of
temporal representation.
IV. DISCUSSION
Representation of the F0 was variable but was robust in
many infants at 3 months, with no significant changes in F0
amplitude over the course of 6 months in this cross-sectional
analysis. In contrast, there was a rapid increase in the higher
frequency components of the response (F1 and HH) during
that same time period. In addition, morphology (VA slope)
improved and absolute onset and offset latencies and inter-
peak latencies decreased with age.
A. Spectral coding
The finding of robust F0 representation in early infancy
is consistent with that of Jeng et al. (2011), and the gradual
increase in high-frequency representation may arise from
delayed maturation of phase locking to higher (compared to
FIG. 3. (Color online) Spectrograms demonstrating stronger encoding of the harmonics in older infants compared to younger infants. Different scales are used
for 0–400 Hz and 400–1000 Hz ranges to accentuate the differences.
FIG. 4. (Color online) (Top) Scatterplots demonstrating correlations between age and waves III and V and waves I–III and I–V inter-peak latencies. No corre-
lations were found for wave I and III–V latencies. (Bottom) Older infants (6–10 months) have later wave III and inter-wave I–III latencies than younger infants
(3–5 months).
J. Acoust. Soc. Am., Vol. 137, No. 6, June 2015 Anderson et al.: Infant frequency following response 3351

lower) frequency sounds, as was noted in auditory develop-
ment studies in kittens (Brugge et al., 1978; Kettner et al.,1985). Although cochlear mechanics are presumed to be
mature at birth (Abdala and Keefe, 2006), structures central
to the cochlea may have a protracted course of development,
and the time course of maturation of these structures may
not be sequential. For example, the middle latency response,
which is generated predominantly by the thalamocortical
pathway, appears to emerge prior to the ABR, suggesting
that auditory structures develop at different rates (Smith and
Kraus, 1987). Yet, even if the midbrain and cortex are mor-
phologically and functionally mature, delayed onset of phase
locking in the auditory nerve (Kettner et al., 1985) and coch-
lear nucleus (Brugge et al., 1978) in the higher frequencies
would limit frequency coding in higher structures.
Reduced phase-locking for high frequency stimuli may
limit spectral tuning as measured via the ABR. Abdala and
Folsom (1995) found that tuning curve widths in 3- and
6-month infants were equivalent to those of adults for lower
frequencies; however, in the high frequencies (8000 Hz),
3-month old infants had significantly wider tuning curves
than either the 6-month olds or the adults. Behavioral studies
concur with these findings. For example, Benson Spetner
and Werner (1990) found that psychometric tuning curve
widths in infants ages 3 and 6 months were equivalent
to those of adults at 500 and 1000 Hz, but at 4000 Hz, the
3-month old infants had broader tuning curves than either
the 6-month old infants or the adults. These findings suggests
that there is a specific maturational effect on spectral resolu-
tion for higher frequency sounds.
Animal studies have demonstrated earlier development
of lower frequency responses than higher frequencies in
brainstem nuclei (Rubel and Ryals, 1983; Lippe and Rubel,
1985; Romand and Ehret, 1990; Pierson and Snyder-Keller,
1994). However, these studies indicate that delayed tono-
topic representation of the high frequencies in the brainstem
arises from a shift in spatial coding of frequency in the coch-
lea. In the current study, high frequency representation was
present in the younger infants, with 83% of them having
high frequency spectral amplitudes above the noise floor.
This evidence and the fact that the cochlea is mature at birth
in humans (Abdala and Keefe, 2006) suggests that another
mechanism may be responsible for the gradual increase in
spectral encoding in our findings.
Which factors may have led to preferential or more
robust responses to low frequency stimuli? The enhanced
low frequency representation may be the product of prenatal
experience-dependent plasticity. The uterus is essentially a
low-pass filter, meaning the fetus is predominantly exposed
to low frequency sounds. Gerhardt et al. (1992) reported that
frequencies in the range of 125 Hz are attenuated as little as
5 dB SPL, while there is nearly a 60 dB SPL attenuation of a
2000 Hz signal in the ewe’s uterus. Furthermore, the low-
frequency male voice is more intelligible in utero than the
higher-frequency female voice (Griffiths et al., 1994), indi-
cating greater transmission of the low frequency content of
speech. Perhaps this biased exposure to low-frequency
sounds induces earlier development of low-frequency repre-
sentation. In fact, training studies have demonstrated in utero
plasticity. Fetal exposure to pitch increments and decrements
in pseudowords results in larger amplitude mismatch nega-
tivity responses to these stimuli after birth than is found in
infants who have not had this exposure, and the amount of
prenatal exposure is positively correlated with neural activity
(Partanen et al., 2013).
Animal models would support the role of exposure in
the development of spectral encoding in the inferior
colliculus (IC), the putative generator of the FFR
(Chandrasekaran and Kraus, 2010). Mice that are reared in
the presence of repetitive clicks do not develop adult-like
spectral tuning of IC neurons compared to mice who are
reared in normal acoustic environments (Sanes and
Constantine-Paton, 1985). Modulation of FFR responses has
been demonstrated in humans with training (Carcagno and
Plack, 2011) and with enhanced access to the signal through
the use of an assistive listening device (Hornickel et al.,2012). Therefore, the early representation of low frequencies
may arise from greater fetal exposure to sound in this fre-
quency range.
B. Temporal coding
Increased myelination and changes in synaptic function
may lead to decreased neural conduction time as infants
develop. Magnetic resonance imaging (MRI) has been used
to document the time course of myelination in brainstem and
midbrain nuclei. The intensity of myelination in MRI studies
increases through 13 postnatal weeks in the cochlear
nucleus, superior olivary complex, and lateral lemniscus and
continues to increase through 39 postnatal weeks in the IC
(Sano et al., 2007). In the current study, significant latency
prolongations and inter-wave conduction times were noted
for the responses to the click and [da] stimuli. These changes
are consistent with previous studies showing reductions in
click and inter-peak latencies within the first year of life
(Eggermont and Salamy, 1988; Gorga et al., 1989). The
changes in the Gorga et al. (1989) study were independent of
stimulus level, suggesting that developmental changes arise
from neural rather than peripheral factors.
The findings regarding the offset peak (decreased abso-
lute and inter-peak latencies and increased amplitude with
age) may reflect changes in duration processing with age.
Offset neurons are found in the IC and other auditory nuclei
and depend on a balance of excitatory and inhibitory neuro-
transmission (Kasai et al., 2012). In developing rats, age-
related changes occur in the properties of IC inhibition and
in GABAergic projections to the medial geniculate body
(MGB) of the thalamus (Venkataraman and Bartlett, 2013b).
The time course of these changes is similar to that of the
development of temporal coding, as assessed by evoked
potentials, in developing young rats (Venkataraman and
Bartlett, 2013a). Given the results from the Venkataraman
and Bartlett studies, the changes in offset peak properties may
arise from changes in inhibitory neurotransmission affecting
the ability to precisely encode duration of auditory stimuli.
Finally, we note that after applying the FDR correction,
the correlations among age and the latency variables were
only significant for peaks arising from lower brainstem
3352 J. Acoust. Soc. Am., Vol. 137, No. 6, June 2015 Anderson et al.: Infant frequency following response
levels, not from the upper brainstem/midbrain. These results
may be consistent with those of Smith and Kraus (1987),
who suggested that responses from higher levels of the audi-
tory pathway (thalamus) may emerge prior to those from the
auditory brainstem.
C. Limitations
We verified peripheral hearing health with otoacoustic
emissions and normal Wave I click latencies, but we did not
directly evaluate middle ear function using tympanometry.
Although otoacoustic emissions are sensitive to middle ear
dysfunction due to forward and backward transmission of
the auditory signal (Keefe et al., 2003), we only tested fre-
quencies from 2 to 8 kHz to minimize effects of background
noise; therefore, we cannot rule out the effects of middle ear
dysfunction that are typically greater for low frequencies.
The process of adding stimulus polarities to extract the
envelope also exaggerates spectral components arising from
nonlinear cochlear mechanics (i.e., rectification). The distor-
tion associated with this rectification may produce energy at
integer multiples of the F0; in addition, the neural response
at each harmonic frequency may be affected by a cochlear
distortion product related to stimulus energy at other har-
monics or a rectification-related distortion of a stimulus
component at other harmonics, or other sources of distortion
(Aiken and Picton, 2008). The analysis of subtracted polar-
ities would typically be more suited for examination of spec-
tral energy in response to a speech stimulus; however, the
stimulus used in the study did not include a steady state (or a
periodic) region such as a vowel, and the changing nature of
the stimulus is not ideal for extracting spectral information
by subtracting polarities. The infants’ responses to sub-
tracted polarities were too noisy to provide useful
information. Therefore, the changes in higher frequency
spectral energy with age may actually arise from
development of cochlear nonlinearities rather than from de-
velopment of spectral encoding. This alternative explanation
is unlikely, however, given the findings of Abdala and Keefe
(2006) who demonstrated that larger DPOAE amplitudes in
newborn infants are due to outer and middle ear immaturities
rather than to differences in cochlear mechanics.
V. CONCLUSIONS
How do these findings contribute to the understanding
of language development? As noted above, encoding of
spectral and temporal speech features becomes more adult-
like at approximately 6 months of age, although changes
continue to take place into school-age years (Skoe et al.,2013). Six months is also the age at which infants begin to
show a preference for native vowel categories (Kuhl et al.,1992). Perhaps experience, through more accurate represen-
tation of the temporal and spectral features of speech, leads
to preferences for both native vowels and consonants.
Language experience in utero leads to changes in behavioral
responses in newborn infants to native versus nonnative
vowels, such that nonnative language stimuli result in greater
infant interest in these sounds (as reflected in higher mean
sucking) than do language stimuli (Moon et al., 2013),
supporting the role of experience-dependent plasticity in
stimulus feature representation. Therefore, immature repre-
sentation of the formants and other elements of speech below
the age of 6 months may place a physiological constraint on
language learning, along with perceptual, computational,
and social constraints (Kuhl, 2004).
Overall, these results demonstrate immature subcortical
encoding of spectral and temporal speech features in early
FIG. 5. (Color online) (Top) Scatterplots demonstrating negative correlations between age and VA slope, peak A and O latencies, and inter-peak A-O latency.
(Bottom) Average response waveforms of older (6–10 months) and younger (3–5 months) infants are overlaid. Group differences consistent with correlations
were noted for O latency and VA slope but not for any other peak comparisons.
J. Acoust. Soc. Am., Vol. 137, No. 6, June 2015 Anderson et al.: Infant frequency following response 3353

infancy, consistent with previous perceptual studies. This
study also demonstrates the feasibility of obtaining speech-
evoked responses in awake infants, with replicable peaks for
both the onset, offset, and FFR regions.
ACKNOWLEDGMENTS
We thank the Early Language Laboratory of the
Department of Communication Sciences at Northwestern
University for their assistance recruiting and scheduling the
infants who participated in this study. We would especially
like to thank the infants and their families who participated
in the study. This work was funded by the National Institutes
of Health (RO1DC01510) and the Hugh Knowles Center of
Northwestern University.
Abdala, C., and Folsom, R. C. (1995). “The development of frequency reso-
lution in humans as revealed by the auditory brain-stem response recorded
with notched-noise masking,” J. Acoust. Soc. Am. 98, 921–930.
Abdala, C., and Keefe, D. H. (2006). “Effects of middle-ear immaturity on
distortion product otoacoustic emission suppression tuning in infant ears,”
J. Acoust. Soc. Am. 120, 3832–3842.
Aiken, S. J., and Picton, T. W. (2008). “Envelope and spectral frequency-
following responses to vowel sounds,” Hear. Res. 245, 35–47.
Alho, K., Grimm, S., Mateo-Le�on, S., Costa-Faidella, J., and Escera, C.
(2012). “Early processing of pitch in the human auditory system,” Eur. J.
Neurosci. 36, 2972–2978.
Alho, K., Sainio, K., Sajaniemi, N., Reinikainen, K., and N€a€at€anen, R.
(1990). “Event-related brain potential of human newborns to pitch change
of an acoustic stimulus,” Electroencephalogr. Clin. Neurophysiol. 77,
151–155.
Benjamini, Y., and Hochberg, Y. (1995). “Controlling the false discovery
rate: A practical and powerful approach to multiple testing,” J. R. Stat.
Soc. Ser. B 57, 289–300.
Benson Spetner, N., and Werner, L. (1990). “Auditory frequency resolution
in human infancy,” Child Dev. 61, 632–652.
Boersma, P., and Weenink, D. (2009). “Praat: Doing phonetics by computer
(version 5.1.05) [computer program],” http://www.praat.org (Last viewed
May 1, 2009).
Brugge, J. F., Javel, E., and Kitzes, L. M. (1978). “Signs of functional
maturation of peripheral auditory system in discharge patterns of neurons
in anteroventral cochlear nucleus of kitten,” J. Neurophysiol. 41,
1557–1559.
Carcagno, S., and Plack, C. (2011). “Subcortical plasticity following percep-
tual learning in a pitch discrimination task,” J. Assoc. Res. Otolaryngol.
12, 89–100.�Ceponiene, R., Kushnerenko, E., Fellman, V., Renlund, M., Suominen,
K., and N€a€at€anen, R. (2002). “Event-related potential features indexing
central auditory discrimination by newborns,” Cog. Brain Res. 13,
101–113.
Ceponiene, R., Rinne, T., and N€a€at€anen, R. (2002). “Maturation of cortical
sound processing as indexed by event-related potentials,” Clin.
Neurophysiol. 113, 870–882.
Chandrasekaran, B., and Kraus, N. (2010). “The scalp-recorded brainstem
response to speech: Neural origins and plasticity,” Pyschophysiol. 47,
236–246.
Choudhury, N., and Benasich, A. A. (2011). “Maturation of auditory evoked
potentials from 6 to 48 months: Prediction to 3 and 4 year language and
cognitive abilities,” Clin. Neurophysiol. 122, 320–338.
Eggermont, J. J., and Salamy, A. (1988). “Development of ABR parameters
in a preterm and a term born population,” Ear Hear. 9, 283–289.
Galbraith, G. C., Arbagey, P. W., Branski, R., Comerci, N., and Rector, P.
M. (1995). “Intelligible speech encoded in the human brain stem
frequency-following response,” Neuroreport 6, 2363–2367.
Gardi, J., Salamy, A., and Mendelson, T. (1979). “Scalp-recorded
frequency-following responses in neonates,” Int. J. Audiol. 18, 494–506.
Gerhardt, K. J., Otto, R., Abrams, R. M., Colle, J. J., Burchfield, D. J., and
Peters, A. J. (1992). “Cochlear microphonics recorded from fetal and new-
born sheep,” Am. J. Otolaryngol. 13, 226–233.
Gorga, M. P., Kaminski, J. R., Beauchaine, K. L., Jesteadt, W., and Neely,
S. T. (1989). “Auditory brainstem responses from children three months to
three years of age: Normal patterns of response II,” J. Speech Lang. Hear.
Res. 32, 281–288.
Griffiths, S. K., Brown, W., Jr., Gerhardt, K. J., Abrams, R. M., and Morris,
R. J. (1994). “The perception of speech sounds recorded within the uterus
of a pregnant sheep,” J. Acoust. Soc. Am. 96, 2055–2063.
Hall, J. W., and Mueller, H. G. (1997). Audiologists’ Desk Reference(Cengage Learning, San Diego, CA).
He, C., Hotson, L., and Trainor, L. J. (2007). “Mismatch responses to pitch
changes in early infancy,” J. Cognit. Neurosci. 19, 878–892.
Hornickel, J., Zecker, S. G., Bradlow, A. R., and Kraus, N. (2012).
“Assistive listening devices drive neuroplasticity in children with dys-
lexia,” Proc. Natl. Acad. Sci. 109, 16731–16736.
Hurley, R. M., Hurley, A., and Berlin, C. I. (2005). “Development of low-
frequency tone burst versus the click auditory brainstem response,” J. Am.
Acad. Audiol. 16, 114–121.
Jeng, F.-C., Hu, J., Dickman, B., Montgomery-Reagan, K., Tong, M., Wu,
G., and Lin, C. D. (2011). “Cross-linguistic comparison of frequency-
following responses to voice pitch in American and Chinese neonates and
adults,” Ear Hear. 32, 699–707.
Jeng, F.-C., Schnabel, E. A., Dickman, B. M., Hu, J., Li, X., Lin, C.-D., and
Chung, H.-K. (2010). “Early maturation of frequency-following responses
to voice pitch in infants with normal hearing,” Percept. Mot. Skills 111,
765–784.
Jiang, Z. D., Chen, C., and Wilkinson, A. R. (2012). “Brainstem auditory
response findings in term neonates in intensive care unit,” J. Matern. Fetal
Neonatal. Med. 25, 2746–2749.
Johnson, K. L., Nicol, T., Zecker, S. G., and Kraus, N. (2008).
“Developmental plasticity in the human auditory brainstem,” J. Neurosci.
28, 4000–4007.
Kasai, M., Ono, M., and Ohmori, H. (2012). “Distinct neural firing mecha-
nisms to tonal stimuli offset in the inferior colliculus of mice in vivo,”
Neurosci. Res. 73, 224–237.
Keefe, D. H., Gorga, M. P., Neely, S. T., Zhao, F., and Vohr, B. R. (2003).
“Ear-canal acoustic admittance and reflectance measurements in human
neonates. II. Predictions of middle-ear dysfunction and sensorineural hear-
ing loss,” J. Acoust. Soc. Am. 113, 407–422.
Kettner, R., Feng, J., and Brugge, J. (1985). “Postnatal development of the
phase-locked response to low frequency tones of auditory nerve fibers in
the cat,” J. Neurosci. 5, 275–283.
Kuhl, P. K. (2004). “Early language acquisition: Cracking the speech code,”
Nat. Rev. Neurosci. 5, 831–843.
Kuhl, P. K., Williams, K. A., Lacerda, F., Stevens, K. N., and Lindblom, B.
(1992). “Linguistic experience alters phonetic perception in infants by 6
months of age,” Science 255, 606–608.
Kushnerenko, E., Ceponiene, R., Balan, P., Fellman, V., and N€a€at€anen, R.
(2002). “Maturation of the auditory change detection response in infants:
A longitudinal ERP study,” Neuroreport 13, 1843–1848.
Lasky, R. E. (1993). “The effect of forward masker duration, rise/fall time,
and integrated pressure on auditory brain stem evoked responses in human
newborns and adults,” Ear Hear. 14, 95–103.
Lavigne-Rebillard, M., and Pujol, R. (1987). “Surface aspects of the devel-
oping human organ of corti,” Acta Otolaryngol. 104, 43–50.
Lepp€anen, P. H., Eklund, K. M., and Lyytinen, H. (1997). “Event-related
brain potentials to change in rapidly presented acoustic stimuli in new-
borns,” Dev. Neuropsychol. 13, 175–204.
Lippe, W., and Rubel, E. W. (1985). “Ontogeny of tonotopic organization of
brain stem auditory nuclei in the chicken: Implications for development of
the place principle,” J. Comp. Neurol. 237, 273–289.
Mahajan, Y., and McArthur, G. (2012). “Maturation of auditory event-
related potentials across adolescence,” Hear. Res. 294, 82–94.
Marcoux, A. M. (2011). “Maturation of auditory function related to hearing
threshold estimations using the auditory brainstem response during
infancy,” Int. J. Pediatr. Otorhinolaryngol. 75, 163–170.
Moon, C., Lagercrantz, H., and Kuhl, P. K. (2013). “Language experienced
in utero affects vowel perception after birth: A two-country study,” Acta
Paediatrica 102, 156–160.
Moore, J. K., Perazzo, L. M., and Braun, A. (1995). “Time course of axonal
myelination in the human brainstem auditory pathway,” Hear. Res. 91,
208–209.
Moore, J. K., Ponton, C., Eggermont, J., Wu, B.-C., and Huang, J. (1996).
“Perinatal maturation of the auditory brain stem response: Changes in path
length and conduction velocity,” Ear Hear. 17, 411–418.
3354 J. Acoust. Soc. Am., Vol. 137, No. 6, June 2015 Anderson et al.: Infant frequency following response
Morr, M. L., Shafer, V. L., Kreuzer, J. A., and Kurtzberg, D. (2002).
“Maturation of mismatch negativity in typically developing infants and
preschool children,” Ear Hear. 23, 118–136.
Olsho, L. W., Koch, E. G., and Halpin, C. F. (1987). “Level and age
effects in infant frequency discrimination,” J. Acoust. Soc. Am. 82,
454–464.
Partanen, E., Kujala, T., N€a€at€anen, R., Liitola, A., Sambeth, A., and
Huotilainen, M. (2013). “Learning-induced neural plasticity of speech
processing before birth,” Proc. Natl. Acad. Sci. 110, 15145–15150.
Pierson, M., and Snyder-Keller, A. (1994). “Development of frequency-
selective domains in inferior colliculus of normal and neonatally noise-
exposed rats,” Brain Res. 636, 55–67.
Ponton, C. W., Eggermont, J. J., Kwong, B., and Don, M. (2000).
“Maturation of human central auditory system activity: Evidence
from multi-channel evoked potentials,” Clin. Neurophysiol. 111,
220–236.
Romand, R., and Ehret, G. (1990). “Development of tonotopy in the inferior
colliculus. I. Electrophysiological mapping in house mice,” Dev. Brain
Res. 54, 221–234.
Rubel, E. W., and Ryals, B. M. (1983). “Development of the place principle:
Acoustic trauma,” Science 219, 512–514.
Salamy, A. (1984). “Maturation of the auditory brainstem response from
birth through early childhood,” J. Clin. Neurophysiol. 1, 293–329.
Sanes, D. H. (1993). “The development of synaptic function and integration
in the central auditory system,” J. Neurosci. 13, 2627–2637.
Sanes, D. H., and Constantine-Paton, M. (1985). “The sharpening of fre-
quency tuning curves requires patterned activity during development in
the mouse, Mus musculus,” J. Neurosci. 5, 1152–1166.
Sano, M., Kaga, K., Kuan, C.-C., Ino, K., and Mima, K. (2007). “Early mye-
lination patterns in the brainstem auditory nuclei and pathway: MRI evalu-
ation study,” Int. J. Pediatr. Otorhinolaryngol. 71, 1105–1115.
Skoe, E., and Kraus, N. (2010). “Auditory brain stem response to complex
sounds: A tutorial,” Ear Hear. 31, 302–324.
Skoe, E., Krizman, J., Anderson, S., and Kraus, N. (2013). “Stability and
plasticity of auditory brainstem function across the lifespan,” Cerebral
Cortex, doi:10.1093/cercor/bht311.
Smith, D., and Kraus, N. (1987). “Postnatal development of the auditory
brainstem response (ABR) in the unanesthetized gerbil,” Hear. Res. 27,
157–164.
Sussman, E., Steinschneider, M., Gumenyuk, V., Grushko, J., and Lawson,
K. (2008). “The maturation of human evoked brain potentials to sounds
presented at different stimulus rates,” Hear. Res. 236, 61–79.
Trainor, L. J., Samuel, S. S., Desjardins, R. N., and Sonnadara, R. R. (2001).
“Measuring temporal resolution in infants using mismatch negativity,”
NeuroReport 12, 2443–2448.
Venkataraman, Y., and Bartlett, E. L. (2013a). “Postnatal development of
auditory central evoked responses and thalamic cellular properties,” Dev.
Neurobiol. 7, 541–555.
Venkataraman, Y., and Bartlett, E. L. (2013b). “Postnatal development of
synaptic properties of the GABAergic projection from the inferior collicu-
lus to the auditory thalamus,” J. Neurophysiol. 109, 2866–2882.
Werner, L. A. (1999). “Forward masking among infant and adult listeners,”
J. Acoust. Soc. Am. 105, 2445–2453.
Werner, L. A., Folsom, R. C., Mancl, L. R., and Syapin, C. L. (2001).
“Human auditory brainstem response to temporal gaps in noise,” J. Speech
Lang. Hear. Res. 44, 737–750.
J. Acoust. Soc. Am., Vol. 137, No. 6, June 2015 Anderson et al.: Infant frequency following response 3355