development of steam distribution network simulation
TRANSCRIPT
Petroleum Science and Engineering 2018; 2(1): 25-32
http://www.sciencepublishinggroup.com/j/pse
doi: 10.11648/j.pse.20180201.14
Development of Steam Distribution Network Simulation Program for Enhanced Oil Recovery
Ahmed Mahrous Norelden, Ahmed Safwat Nafey
Department of Engineering Sciences, Faculty of Petroleum and Mining Engineering, Suez University, Suez, Egypt
Email address:
To cite this article: Ahmed Mahrous Norelden, Ahmed Safwat Nafey. Development of Steam Distribution Network Simulation Program for Enhanced Oil
Recovery. Petroleum Science and Engineering. Vol. 2, No. 1, 2018, pp. 25-32. doi: 10.11648/j.pse.20180201.14
Received: March 23, 2018; Accepted: April 12, 2018; Published: May 14, 2018
Abstract: Steam injection networks are widely used in processes of Thermal Enhanced Oil Recovery (TEOR). It is desirable
to maintain both the quality and flow rate of steam injected into the formation at certain specified values for optimum
operation of the steam flood. This requires a surface distribution network designed to deliver uniform-quality steam to all
wells. Unfortunately, unequal splitting of the liquid and vapor phases may occur at (tee junction) distribution network therefore
Individual wells thus receive non-uniform and unknown distribution of the steam liquid and vapor. Unknown liquid and vapor
phase distributions leads to inefficient project management, increased operating expenses and thereby detriment of the wells
production. Simulation programs are important tools to monitor and evaluate steam distribution network. The main objective
of this thesis is to develop a computer program to evaluate steam quality at well head of oil fields. Based on the Seeger model,
a computer program for simulating the behavior of a large steam injection network was developed based on Mat Lab Graphical
User Interface (GUI). Using this program a complete picture for the steam distribution network variables such as pressure,
temperature and steam quality can be determined.
Keywords: Steam Distribution Network, T-junction, Two-Phase Flow, EOR
1. Introduction
Steam injection is the thermal method that add heat to the
reservoir to expand the oil in-place, reduce oil viscosity,
provide drive energy and thereby improve the displacement
efficiency of injected fluid [1]. Crude-oil viscosity is
inversely proportional to temperature. When the temperature
increases, viscosity decreases. Less viscous oil results in
greater mobility. Prats [2] indicated that the effect of steam
injection on recovery is significantly greater as compared to
hot-water injection. It is because steam carries more enthalpy
per unit mass. The displacement of fluids by steam is self-
stabilizing movement of the crude oil to the production well.
Lake [3] emphasized that thermal methods, especially steam
injection and steam soak, are easily the most successful
enhanced oil recovery processes. Steam injection is widely
applied to increase production. For the steam injection,
several steam generators are located throughout the oil field
to produce the steam that is fed into a distribution network.
As the distribution network becomes more complex and
larger. The steam flow becomes more complicated and the
steam properties along the pipes vary greatly [4]. Thus, In
order to predict steam properties in the distribution network
with highly accuracy, it is necessary to understand the
behavior of two-phase flow and splitting two-phase flow in
the tee-junction to maintain optimum steam quality entering
the reservoir.
Unfortunately, unequal splitting of the liquid and vapor
phases can occur at (tee junction) distribution network
therefore Individual wells thus receive non-uniform and
unpredictable distribution of the steam liquid and vapor.
Uneven liquid and vapor phase distribution results in poor
displacement efficiency and volumetric sweep of the
reservoir while unknown liquid and vapor phase distributions
leads to inefficient project management and increased
operating expenses. Therefore, it is important to develop a
stimulating models, and methods to predict or control the
qualities of the split streams.
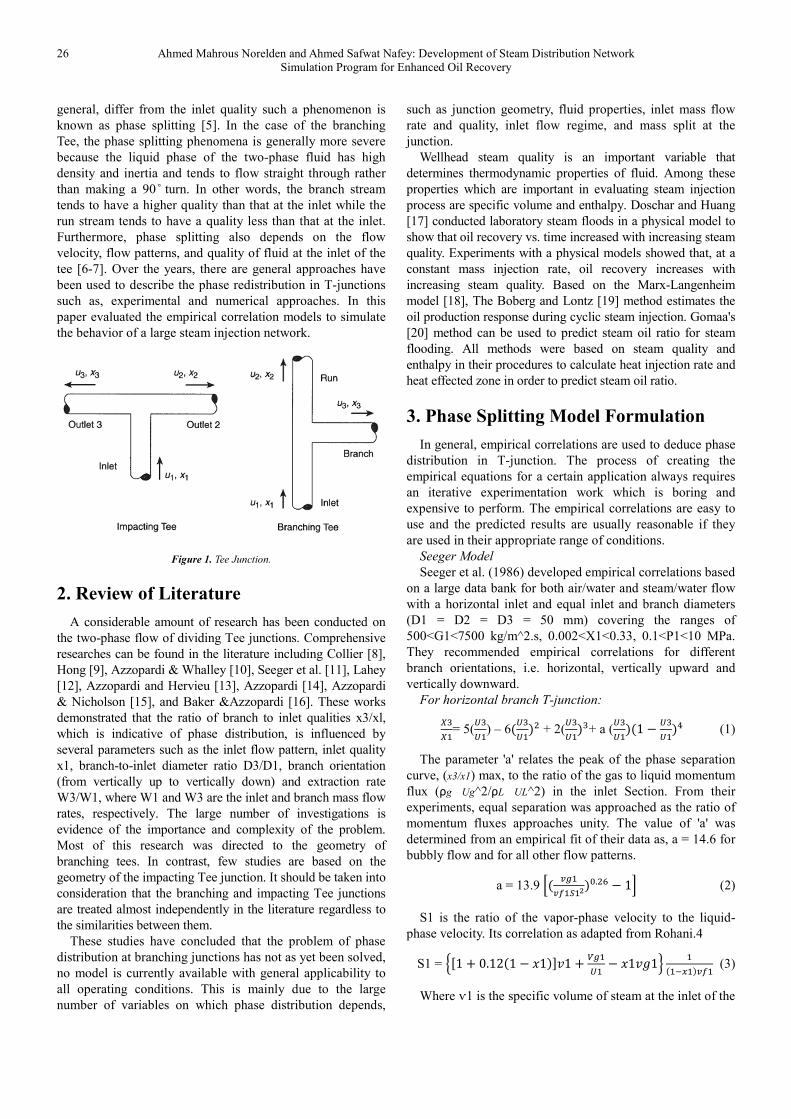
In fact, T-junctions are commonly used components in
piping systems as show in figure 1. The behavior of dividing
two-phase flow in a T-junction is critical in the design of the
two-phase flow piping systems. When a two-phase flow is
divided in a T-junctions, the branch and run qualities will, in
26 Ahmed Mahrous Norelden and Ahmed Safwat Nafey: Development of Steam Distribution Network
Simulation Program for Enhanced Oil Recovery
general, differ from the inlet quality such a phenomenon is
known as phase splitting [5]. In the case of the branching
Tee, the phase splitting phenomena is generally more severe
because the liquid phase of the two-phase fluid has high
density and inertia and tends to flow straight through rather
than making a 90 ̊ turn. In other words, the branch stream
tends to have a higher quality than that at the inlet while the
run stream tends to have a quality less than that at the inlet.
Furthermore, phase splitting also depends on the flow
velocity, flow patterns, and quality of fluid at the inlet of the
tee [6-7]. Over the years, there are general approaches have
been used to describe the phase redistribution in T-junctions
such as, experimental and numerical approaches. In this
paper evaluated the empirical correlation models to simulate
the behavior of a large steam injection network.
Figure 1. Tee Junction.
2. Review of Literature
A considerable amount of research has been conducted on
the two-phase flow of dividing Tee junctions. Comprehensive
researches can be found in the literature including Collier [8],
Hong [9], Azzopardi & Whalley [10], Seeger et al. [11], Lahey
[12], Azzopardi and Hervieu [13], Azzopardi [14], Azzopardi
& Nicholson [15], and Baker &Azzopardi [16]. These works
demonstrated that the ratio of branch to inlet qualities x3/xl,
which is indicative of phase distribution, is influenced by
several parameters such as the inlet flow pattern, inlet quality
x1, branch-to-inlet diameter ratio D3/D1, branch orientation
(from vertically up to vertically down) and extraction rate
W3/W1, where W1 and W3 are the inlet and branch mass flow
rates, respectively. The large number of investigations is
evidence of the importance and complexity of the problem.
Most of this research was directed to the geometry of
branching tees. In contrast, few studies are based on the
geometry of the impacting Tee junction. It should be taken into
consideration that the branching and impacting Tee junctions
are treated almost independently in the literature regardless to
the similarities between them.
These studies have concluded that the problem of phase
distribution at branching junctions has not as yet been solved,
no model is currently available with general applicability to
all operating conditions. This is mainly due to the large
number of variables on which phase distribution depends,
such as junction geometry, fluid properties, inlet mass flow
rate and quality, inlet flow regime, and mass split at the
junction.
Wellhead steam quality is an important variable that
determines thermodynamic properties of fluid. Among these
properties which are important in evaluating steam injection
process are specific volume and enthalpy. Doschar and Huang
[17] conducted laboratory steam floods in a physical model to
show that oil recovery vs. time increased with increasing steam
quality. Experiments with a physical models showed that, at a
constant mass injection rate, oil recovery increases with
increasing steam quality. Based on the Marx-Langenheim
model [18], The Boberg and Lontz [19] method estimates the
oil production response during cyclic steam injection. Gomaa's
[20] method can be used to predict steam oil ratio for steam
flooding. All methods were based on steam quality and
enthalpy in their procedures to calculate heat injection rate and
heat effected zone in order to predict steam oil ratio.
3. Phase Splitting Model Formulation
In general, empirical correlations are used to deduce phase
distribution in T-junction. The process of creating the
empirical equations for a certain application always requires
an iterative experimentation work which is boring and
expensive to perform. The empirical correlations are easy to
use and the predicted results are usually reasonable if they
are used in their appropriate range of conditions.
Seeger Model
Seeger et al. (1986) developed empirical correlations based
on a large data bank for both air/water and steam/water flow
with a horizontal inlet and equal inlet and branch diameters
(D1 = D2 = D3 = 50 mm) covering the ranges of
500<G1<7500 kg/m^2.s, 0.002<X1<0.33, 0.1<P1<10 MPa.
They recommended empirical correlations for different
branch orientations, i.e. horizontal, vertically upward and
vertically downward.
For horizontal branch T-junction:
����= 5(
����) – 6���
���� + 2(������+ a (
������1 ��
��� (1)
The parameter 'a' relates the peak of the phase separation
curve, (x3/x1) max, to the ratio of the gas to liquid momentum
flux (ρg Ug^2/ρL UL^2) in the inlet Section. From their
experiments, equal separation was approached as the ratio of
momentum fluxes approaches unity. The value of 'a' was
determined from an empirical fit of their data as, a = 14.6 for
bubbly flow and for all other flow patterns.
a = 13.9 �� � ���������.�� 1� (2)
S1 is the ratio of the vapor-phase velocity to the liquid-
phase velocity. Its correlation as adapted from Rohani.4
S1 = ��1 � 0.12�1 �1���1 � �̄ ��� �1��1 �
��!"����� (3)
Where ѵ1 is the specific volume of steam at the inlet of the

Petroleum Science and Engineering 2018; 2(1): 25-32 27
tee and Ѵg1 is the weighted mean drift velocity of the vapor
phase at the inlet of the tee,
V̄g1 = 1.18 �#1�.$ %��&� ���� �
� ��(�.�$
(4)
Seeger et al. presented, as shown in Figure 2, that the
quality of the fluid existing the branch stream in a horizontal
tee is generally higher than that entering the inlet. Based on
the branching tee data obtained by Texaco, Rubel et al.
evaluated the accuracy of several phase-splitting models for
flow through branching tees. These included models
proposed by Seeger et al., 3 Azzopardi and Whalley, Shoham
et al., Hwang et al., and Hart et al. Seeger et al.'s model
predicted closest to the experimental data, to within +- 30%
for about 90% of Texaco's data.
The results of the horizontal branch showed preferential
gas removal. Total separation was approached for high values
of branch flow split. The branch quality generally peaked at
flow splits (u3/u1 of approximately 0.3). Also it showed that
an increase in inlet quality resulted in reducing the peak and
the degree of the phase separation, x3/x1, and increasing the
flow split ratio u3/u1.
Figure 2. Seeger et al flow through a horizontal branching tee.
4. Simulation Program for Network
Quality Prediction
To face a steam quality measure problem in the two-phase
steam network. It became necessary to have a program
installation able to record steam quality, temperature and
pressure data across a whole steam network. Simple program
have been designed based on MATLAB able to it. The
program provides a dedicated user interface for operators to
build the distribution network model easily and to visualize
the simulation results. The program takes into account T-
junction effect on phase separation. Then the operators can
build the distribution network model by major factors such as
actual distance of pipes, individual well injection rate, pipes
diameter, and number of wells etc. are defined by the
operator inputs. The results can be visualized as a numeric
form or a graphical form. The program adopted on Seeger
model to descript phase separation in T-junction in steam
distribution network.
4.1. Graphical User Interface GUI of the Main Program
The GUI is demonstrated with snapshot of the program.
The first snapshot gives the background for the program. The
second snapshot is about calculations for any steam network
with take into account T-junction effects with input
parameters. The third snapshot is the output parameters for
specified Steam network. The fourth and fifth snapshot is the
output tables with ability to repeat calculations for selected
branch. The sixth snapshot is about the post-processing for
viewing the results in figures for steam quality, steam
pressure, and steam temperature along the steam network.
First snapshot of the program is shown Figure 3, it is seen
that there are several Input parameters for specially steamer
outputs parameters for steam network. User can choose
numbers of branches expressed by the number of T-
junctions. Figure 4 shows the diagram for main line of the
network and the number of T-junction that existing in the
steam distribution network. Figure 5 and Table 1 are shown
results after the calculation done and user able to save those
data to excel sheet. The user is able to restore the calculation
at any branch containing more than T-junction. Therefore
could evaluate and design any steam distribution network
through GUI that was explained.

28 Ahmed Mahrous Norelden and Ahmed Safwat Nafey: Development of Steam Distribution Network
Simulation Program for Enhanced Oil Recovery
Figure 3. Graphical User interface input parameters.
Figure 4. Graphical User interface for layout of main line and branches.
Figure 5. Graphical User interface after calculation with ability of restart calculation

Petroleum Science and Engineering 2018; 2(1): 25-32 29
Table 1. Results shown as excel sheet.
Length (m) Flow (bbl) flow branch (bbl) pressure (psi) T1 X1 Quality X3 Quality
600 600 600 941 284 0.6 0.64
800 600 600 888 280 0.58 0.69
1000 600 600 850 276 0.55 0.71
1200 600 600 832 273 0.47 0.64
1400 600 600 828 272 0.3 0.3
4.2. Validation of Steam Distribution Network Program
From the previous, illustrated that it possible develop a
computer Program able to design or evaluate any steam
distribution network based on Seeger model. To validate
multiphase, looped network cases, comparisons are made to
existing software with actual network (ISSRAN Oil Field).
4.3. Experimental Setup
Due to the scarcity of published results in multiphase fluid
flow in networks, it is also important to consider the validity
of the solutions obtained from the program developed here
with the actual data network. To illustrate the steam
distribution network program, the layout system installed on
the steam network for Issran oil field is shown in Figure 6.
4.4. Example
Steam at 800 psi with 520 F and 0.8 quality is flowed
through 4'' in main stream pipes line at steam flow rate of
6000 B/D. Thus main stream pipes will divided to branches
3'' to complete network. Results parameters were listed for
program solver and Issran actual data in Tables 2 and 3
respectively. Figure 7 and Figure 8 present steam pressure
well head and the steam quality at well head found by the
program solver and field reading.
Figure 6. Issran steam injection field schematic steam distribution line.
Table 2. Case study, Results adopted on Simulation Program.
Wells Diameter inch Length M Run Flow BWPD Branch Flow BWPD pressure psi X1 % X3 %
1 6 500 3800 1500 987 0.8 0.93
2 6 800 2300 800 978 0.7 0.78
3 6 1000 1500 400 973 0.66 0.6
4 6 1500 1100 400 969 0.69 0.69
5 6 1800 700 700 940 0.68 0.68
C-23 3 200 1500 400 940 0.93 0.73
C-28 3 400 1100 400 890 1 1
C-037 3 600 700 400 850 1 1
C-041 3 800 300 300 840 1 1
C-169 3 300 800 500 956 0.78 1
C-003 3 400 300 300 948 0.43 0.43
C-002 3 300 400 400 973 0.64 0.64
C-132 3 400 400 400 969 0.69 0.69
Zs-006 3 300 700 300 918 0.68 0.85
C-355 3 400 400 400 900 0.55 0.55

30 Ahmed Mahrous Norelden and Ahmed Safwat Nafey: Development of Steam Distribution Network
Simulation Program for Enhanced Oil Recovery
Table 3. Case study, results adopted on real reading.
Wells Diameter inch Length M Run Flow BWPD Branch Flow BWPD pressure psi X1 % X3 %
1 6 500 3800 1500 987 0.8 0.75
2 6 800 2300 800 978 0.8 0.75
3 6 1000 1500 400 973 0.8 0.75
4 6 1500 1100 400 969 0.8 0.75
5 6 1800 700 700 940 0.8 0.75
C-23 3 200 1500 400 960 0.8 0.75
C-28 3 400 1100 400 900 0.8 0.75
C-37 3 600 700 400 890 0.8 0.75
C-41 3 800 300 300 880 0.8 0.75
C-169 3 300 800 500 960 0.8 0.75
C-37 3 400 300 300 950 0.8 0.75
C-2 3 300 400 400 960 0.8 0.75
C-132 3 400 400 400 940 0.8 0.75
Zs-006 3 300 700 300 930 0.8 0.75
C-355 3 400 400 400 925 0.8 0.75
Figure 7. Well head pressure comparison between program solver results and actual data results.
Figure 8. Comparison between program solver results of steam quality at well head and default data results.
Petroleum Science and Engineering 2018; 2(1): 25-32 31
5. Conclusion
Controlling and monitoring of steam quality and steam
flowrate in steam distribution network is very difficult.
Simulation program have considered easy way to predict
the steam quality at wellheads. Performed simulation
program by MATLAB while took into account Tee-Junction
effect depending on Seeger correlations. The program
provides a dedicated graphical user interface (GUI) for
operators to build the distribution network model easily and
to visualize the simulation results. Thus, a computer
program for simulating the behavior of a large steam
injection network was developed. Required major factors to
properly design a steam distribution system are Steam
quality needed at wellhead, steam pressure in the reservoir,
forecast of individual well injection rate, location and
number of wells, timetable for injection rate or quality
reduction, and future expansion requirements. Finally need
more experimental investigation for Tee-junction to collect
huge data bank.
6. Nomenclature
a = coefficient in Seeger et al.'s quality ratio equation
g=gravitational acceleration, ft/sec2
p1= steam pressure of the inlet stream, psig
S1= velocity ratio in Seeger et al.'s correlation,
dimensionless
u1= mass flux of steam in the inlet stream, Ibm/(#)�-s)
u2= mass flux of steam in the run stream, Ibm/(#)�-s)
u3= mass flux of steam in the branch stream, Ibm/(#)�-s)
ug1= mass flux of vapor phase in the inlet stream,
Ibm/(#)�-s)
ug2= mass flux of vapor phase in the run stream,
Ibm/(#)�-s)
ug3= mass flux of the vapor phase in the branch stream,
Ibm/(#)�-s)
u2/u1= mass-flux ratio of the run stream, dimensionless
u3/u1= mass-flux ratio of the branch stream,
dimensionless �# 1= specific volume of saturated liquid at the inlet
pressure,#)�/Ibm �� 1= specific volume of saturated vapor at the inlet
pressure, #)�/Ib
ѵ1= specific volume of steam at the inlet pressure, #)�/Ibm Ѵ∗�1= critical velocity of saturated vapor at the inlet
pressure, ft/sec
Ѵ̄g1= superficial vapor velocity at the inlet, ft/sec
�1= steam quality of the inlet stream, fraction
�2= steam quality of the run stream, fraction
�3= steam quality of the branch stream, fraction
�2/�1= quality ratio of the run stream, dimensionless
�3/�1= quality ratio of the branch stream, dimensionless
σ= interfacial tension, Ibm/sec
References
[1] P. S. Sarathi and D. K. Olsen. ''Petroleum Reservoir Simulation''. Applied Science Publishers, 1992.
[2] Michael. Prats.: ''A Current Appraisal of Thermal Recovery''. Society of Petroleum Engineers, 1986.
[3] L.W. Lake. ''Enhanced Oil Recovery''. Society of Petroleum Engineers, 1989.
[4] Tatsuro, Y. and Yukinori, K.:''Development of a Steam Distribution Network Simulator for Enhanced Oil Recovery Systems,''APCOM & ISCM Singapore (2013).
[5] Ballyk, J.D., Shoukri, M., and Chan, A.M.C., “Steam-Water Annular Flow in a Horizontal Dividing T-Junction”, International Journal of Multiphase Flow, Vol. 14, pp. 265-285, 1988.
[6] Sze-Foo Chien.'' Phase Splitting of Wet Steam in Annular Flow Through a Horizontal Branching Tee'', SPE May 1996.
[7] Chien, S.F. and Rubel, M.T.:"Phase Splitting of Wet Steam in Annular Flow Through a Horizontal Impacting Tee, "SPEPE (Nov. 1992) 368-374.
[8] Collier, J.G.:"Single Phase and Two Phase Flow Behavior in Primary Circuit Components," Two-Phase Flow and Heat Transfer, Hemi-sphere Publishing, Washington, DC/1977) 1, 313-365.
[9] Hong, K.C., “Two-Phase Flow Splitting at a Pipe Tee”, Journal of Petroleum Technology, Vol. 2, pp. 290-296, 1978.
[10] Azzopardi, B.J., and Whalle, PB.: 'The Effect of Flow Patterns on Tow-Phase Flow in a T-Junction," Intl.J.of multiphase Flow (1982) 8, 491-507.
[11] Seeger, W., Reimann, J., and Muller, U,:"Two-Phase Flow in T-Jnction With A Horizontal Inlet-Part I: Phase Separation,"Intl.J. of Multiphase Flow (1986) 12, 575-585.
[12] Lahey, R.T., “Current Understanding of Phase Separation Mechanisms in Branching Conduits”, Nuclear Engineering and Design, Vol. 55, pp. 145-161, 1986.
[13] Azzopardi, B.J. and Hervieu, E., “Phase Separation at Junctions”, Multiphase Science and Technology, Vol. 8, pp. 645-714, 1994.
[14] Azzopardi, B.J., “Phase Separation at T Junctions”, Multiphase Science and Technology, Vol. 11, pp. 223-329, 1999.
[15] Azzopardi, B.J., Colman, D.A., and Nicholson, D., “Plant Application of a T-Junction as a Partial Phase Separator” Chemical Engineering Research & Design, Vol. 80, pp. 87-96, 2002.
[16] Baker, G., Azzopardi, B.J., Clark, W.W., and Wilson, J.A., “Controlling the Phase Separation of Gas–Liquid Flows at Horizontal T-Junctions”, AIChE Journal, Vol. 53, pp. 1908-1915, 2007.
[17] Doscher, T.M. and Huang, W.: "Steam Drive Performance Judged Quickly from Use of Physical Models," Oil & Gas J. (Oct. 1979) 52.

32 Ahmed Mahrous Norelden and Ahmed Safwat Nafey: Development of Steam Distribution Network
Simulation Program for Enhanced Oil Recovery
[18] J.W. Marx, R. H. Langenheim, '' Reservoir Heating by Fluid Injection'' Society of Petroleum Engineers. 1959
[19] T.C. Boberg, ''Calculation of the Production Rate of a Thermally Stimulated Well''. Society of petroleum Engineers. 1966.
[20] Gomaa, E.E.: "Correlations for Predicting Oil Recovery by Steam flood, JPT (Feb. 1980) 325.