development of small molecule probes for …
TRANSCRIPT

DEVELOPMENT OF SMALL MOLECULE PROBES FOR FLUORESCENCE AND
PHOTOACOUSTIC MOLECULAR IMAGING
BY
HAO LI
THESIS
Submitted in partial fulfillment of the requirements
for the degree of Master of Science in Chemistry
in the Graduate College of the
University of Illinois at Urbana-Champaign, 2017
Urbana, Illinois
Adviser:
Assistant Professor Jefferson Chan
ii
ABSTRACT
Molecular imaging enables the visualization, characterization and
quantification of biochemical processes taking place at the molecular levels within
intact living subjects. As such, it has become an indispensable tool for both basic
research and biomedical applications. In particular, fluorescence imaging allows us to
study molecular processes at the cellular level in real time because of its excellent
sensitivity, high resolution and non-invasive nature. The use of reaction-based small-
molecule fluorescent probes, a class of probes that exhibit differential fluorescence
signals upon reacting with their intended target, has further rendered fluorescence
imaging with good selectivity and higher sensitivity. Such reaction-based small-
molecule fluorescent probes is often comprised of at least two components: a dye
capable of generating a large fluorescence signal upon excitation and a target-specific
reactive handle. The selection of both components are important as the dye often
determines the spacial resolution as well as biocompatibility, whereas the reactive
handle dictates selectivity and sensitivity. As such, finding new dye platforms as well
as new reactive handles are essential to expanding the repertoire of reaction-based
probes for non-invasive real-time fluorescence imaging. In Chapter 1, I will describe
the development of a formaldehyde (FA)-responsive small-molecule fluorescent probe,
formaldehyde probe 1 (FP1). Specifically, we utilized a FA-specific biorthogonal
chemical transformation to render FP1 FA-specific. Moreover, we also developed a
neutral, red-shifted fluorophore platform with exceptional photostability to enable the

iii
real-time tracking of FA and in the hope of studying the long-term effect of FA in living
systems.
While fluorescence imaging excels at studying cellular systems, its usage in
vivo is challenging due to the limited imaging depth up to 1 mm as a result of light
scatting. In other word, if the imaging target resides deeper than 1 mm, the outcoming
fluorescence will scatter and hence erodes the resolution. As the thickness of the
human skin varies from 0.5 to 4 mm depending on different parts of the human body,
most optical methods including fluorescence imaging can only be applied ex-vivo or
to study superficial subjects such as skin. On the other hand, photoacoustic imaging
(PAI), an imaging technique based on the detection of ultrasonic waves generated by
light absorption, circumvents this problem because it detects ultrasonic waves which
scatters 3000 times less than light. As a result, PAI can reach several centimeters of
depth penetration while retaining high special resolution. When coupled with small-
molecule stimuli-responsive photoacoustic probes that yield a different PA signal upon
activation by the molecular target, PAI becomes a versatile molecular imaging
technique that holds great promise for both animal models studies and human
diagnostics. In Chapter 2, I will describe the development of two copper(II)-responsive
small-molecule photoacoustic probes APC-1 and APC-2. Specifically, we equipped
both APCs with a 2-picolinic ester sensing module that is readily hydrolysed in the
presence of Cu(II) but not by other divalent metal ions. Additionally, APC-1 and APC-
2 were explicitly designed for ratiometric photoacoustic imaging by using an aza-

iv
BODIPY dye scaffold exhibiting two spectrally resolved near-infrared absorbance
bands, one below 700 nm and the other above, that are associated with the 2-picolinic
ester capped and uncapped phenoxide forms, respectively. The ratiometric
photoacoustic turn-on responses for APC-1 and APC-2 were verified using tissue-
mimicking phantoms.

v
ACKNOWLEDGEMENTS
First I would like to thank my advisor Prof. Jefferson Chan whom I have
learned much from. He is a knowledgeable and fearless scientist who guided me
throughout my thesis process. Additionally, I want to thank Dr. Junlong Geng, Aaron
Roth, Chelsea Anorma and Lukas Smaga for working with me on varies projects and
offering me help as well as constructive insights. The same goes to the rest of the
team who have been insightful colleges and great friends.
Next, I want to thank my girlfriend Jianing Li for her unconditional supports
and help on both professional and personal levels. I appreciate her spending countless
nights in the lab with me and coming to visit for most the weekends knowing that I was
too busy to do the same. I thank her for the sacrifice she had to make so that I can
pursue my dream and passion. The same goes to my families especially my parents
and my grandparents. Without them this thesis would not have been possible,
I would also like to thank Dr. Keith Hoffman for helping me to get through the
darkest time during my stay at UIUC. He is a great chemist and more importantly a
great friend. He showed me through example how one could do such an amazing job
at balancing the intrinsically conflicting roles of being a hardworking chemist and a
father of four children. The content of what I learned from him is much beyond a thesis
or any degree that is available.
Last but not least, I appreciate the professional insights I received from my
former committee members, Prof. Wilfred van der donk, Prof. Yi Lu and Prof. Ralph
Nuzzo. I also want to thank Dr. Dean Olson, Dr. Lingyang Zhu for their technical

vi
assistant on using NMR, Dr. Furong Sun and Dr. Haijun Yao for their technical
assistant on using MS. Finally, I want to thank our chemical biology staff members,
Kara Metcalf, Lori Johnson, Jamison Lowe and Gayle Adkisson for their generous help
at various occasions.

vii
TABLE OF CONTENTS
CHAPTER 1: A REACTION-BASED FLUORESCENT PROBE FOR IMAGING
OF FORMALDEHYDE IN LIVING CELLS ............................................................... 1
CHAPTER 2: PHOTOACOUSTIC PROBES FOR RATIOMETRIC IMAGING
OF COPPER(II) ................................................................................................... 10
FIGURES, TABLES AND SCHEMES ................................................................... 18
REFERENCES .................................................................................................... 31
APPENDIX A-MATERIAL AND METHODS FOR CHAPTER 1 .............................. 35
APPENDIX B-SYNTHESES FOR CHAPTER 1 ..................................................... 39
APPENDIX C-SUPPLEMENTARY FIGURES FOR CHAPTER 1 ........................... 53
APPENDIX D-MATERIAL AND METHODS FOR CHAPTER 2 .............................. 80
APPENDIX E-SYNTHESES FOR CHAPTER 2 ..................................................... 84
APPENDIX F-SUPPLEMENTARY FIGURES FOR CHAPTER 2.......................... 102

1
The material in Chapter 1 includes previously published work: Roth, A.; Li, H.; Anorma, C.; Chan, J. J
Am Chem Soc 2015, 137, 10890. Figures and tables are adapted with permission from the authors.
CHAPTER 1: A REACTION-BASED FLUORESCENT PROBE FOR
IMAGING OF FORMALDEHYDE IN LIVING CELLS
1.1 BACKGROUND
Formaldehyde (FA) is a highly reactive carbonyl species that has potent
capacity to crosslink DNA and proteins through the formation of stable methylene
bridges and is often used as a tissue fixative and embalming agent. Exposure to
exogenous FA via inhalation or ingestion poses a significant threat to human health.
For instance, FA overload can damage the central nervous system leading to reduced
performance in memory and cognitive abilities.1 On the other hand, the endogenous
production of FA is a normal physiological process mediated by enzymatic systems
such as semicarbazide-sensitive amine oxidase (SSAO) that generate FA as well as
opposing molecular mechanisms that remove it.2,3 In the brains of healthy individuals,
FA concentration is in the 0.2-0.4 mM range4 and has been proposed to play a role in
the storage, preservation, and retrieval of long-term memory through DNA
demethylation cycles.5 On the other hand, FA levels are known to be elevated in
patients afflicted with neurodegenerative diseases such as Alzheimer’s disease due to
the overexpression of SSAO.6 In this context, FA is neurotoxic and has been shown to
degrade neuronal networks through the induction of hyperphosphorylation and
polymerization of the tau protein.7 Additionally, FA was proposed to induce β-amyloid
misfolding and aggregation via crosslinking lysine residues (LyC6 and LyF8) present
in β-amyloid.8

2
To date, an assortment of methods including HPLC and radiometric assays
have been developed to analyze levels of endogenous FA, albeit only from body fluids
such as blood and urine.9,10 Optical imaging is a powerful alternative because it can
be used to image living systems noninvasively with excellent spatial resolution. Small-
molecule probes that make use of biorthogonal chemical transformations have been
employed to detect a variety of bioanalytes11 ranging from gasotransmitters such as
carbon monoxide12,13 and hydrogen sulfide14 to metal ions including iron15 and zinc,16
as well as carbonyl metabolites like methylglyoxal.17 Such imaging agents exhibit high
sensitivity, excellent selectivity, rapid response, good stability and negligible
cytotoxicity; hence, they greatly facilitate the detection and tracking of the target
analyte in living systems with minimal perturbation. However, prior to this work, no
such imaging agents were available for live cell imaging of FA due to a lack of FA-
specific biorthogonal chemical transformation.18 For this reason, developing such
chemical reaction was a crucial first step towards the development of a FA-responsive
fluorescent probe. Moreover, we also aimed to develop a neutral, red-shifted
fluorophore platform with exceptional photostability to enable the real-time tracking of
FA and to study the long-term effect of FA in living systems.
1.2 RESULTS AND DISCUSSION
To this end, we present a new approach for the detection of FA in live cells
through the development of Formaldehyde Probe 1 (FP1), a FA-responsive

3
fluorescent probe comprised of a fluorescent core (Figure 1.1, in black) and a FA
reactive moiety (Figure 1.1, in blue).19
My main contribution towards this chapter was the development of a new
julolidine-based silicon rhodol fluorescent scaffold for the construction of FP1. Rhodol
dyes are privileged dye platforms because of their large extinction coefficient, high
quantum yield, pH-insensitive emission and most importantly excellent photostability.20
Rhodols that have absorption maxima at the 488- and 514-nm lines of the argon ion
laser as well as the 546-nm line of the mercury arc lamp have been reported and used
to develop reaction-based fluorescence probes.21 However, a more red-shifted rhodol
that absorbs at the 633-nm lines of the helium-neon laser was unavailable. The use of
far-red excitation light is desirable for bioimaging because of the high penetration
depth, minimal phototoxicity, and low autofluorescence.
The synthesis began with the choloromethylation of 1 in the presence of
formaldehyde and hydrochloride gas, affording benzyl chloride 2 in 66% yield. m-
Bromojulolidine 4 was synthesized by double alkylation of 3 with 1-bromo-3-
chloropropane followed by cyclization. After screening varying amounts of different
Lewis acids as well as optimizing reaction temperature, we found that 5 could be
obtained in satisfactory yield via Friedel-Crafts alkylation of compound 4 with 2 in the
presence of one equivalent of aluminum trichloride at low temperature. Finally, lithium-
halogen exchange reaction afforded the double lithium adduct, which was then reacted
with dimethyldichlorosilane and subsequently oxidized in air to give the desired silicon-
xanthone 6 (Scheme 1.1).

4
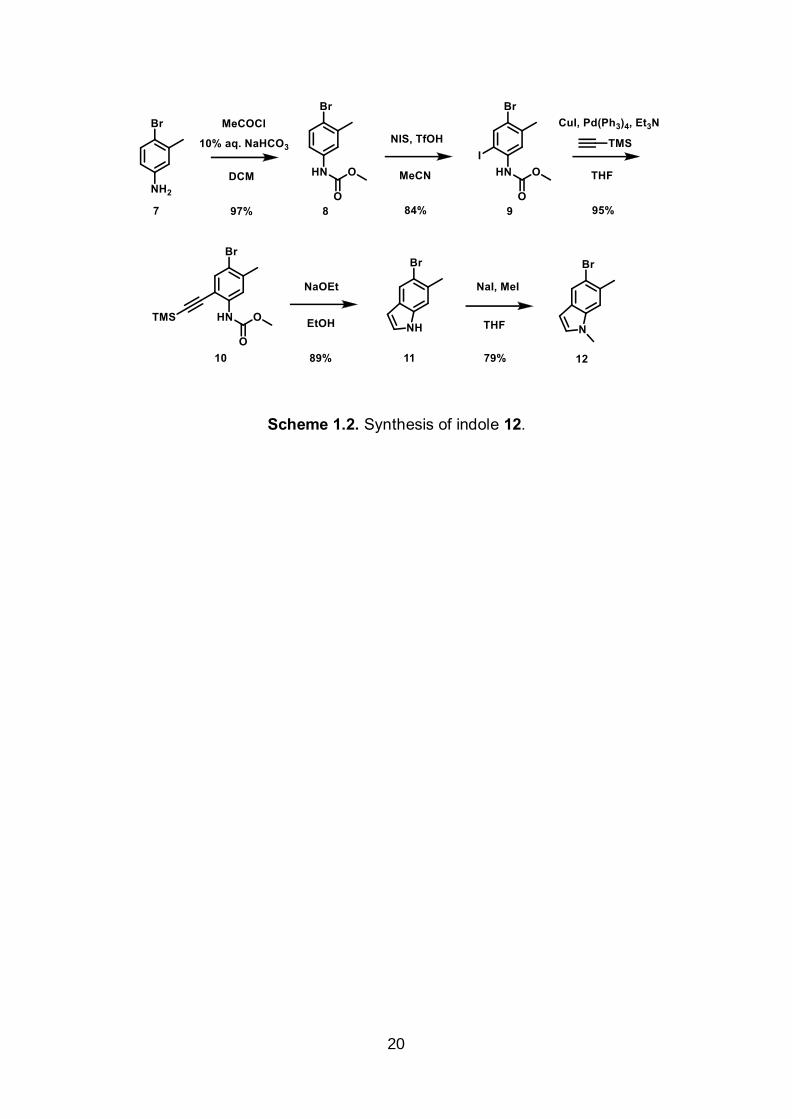
The construction of the bottom indole moiety 12 began with the methyl
carbamate formation from 7 in the presence of methyl choloroformate. Iodination of 8
with N-iodosuccinimide afforded 9, which was then coupled to trimethylsilylacetylene
via Sonogashira coupling. In the presence of sodium ethoxide, 10 was cyclized to give
indole 11 which was methylated with methyl iodide to afford 12 (Scheme 1.2).
With both building blocks in hand, FP1 was synthesized beginning with the
reaction between indole 12 and tert-butyllithium to afford a lithium adduct which was
subsequently reacted with silicon xanthone 6. Silicon rhodol 13 was obtained after
sequential acid-mediated dehydration and BBr3 demethylation reactions. The indole
moiety was subjected to Vilsmeier-Haack formylation conditions to furnish
carboxaldehyde 14 which was transformed to the homoallylic amine 15 with potassium
allyltrifluoroborate in methanolic ammonia. Lastly, reductive amination with 4-
nitrobenzaldehyde and triacetoxyborohydride yielded FP1 (Scheme 1.3). The
photophysical properties of FP1 and the FA-turned-over product 14 were summarized
in table 1.1. As expected, 14 absorbs right at the 633-nm line of the helium-neon laser
with a large extinction coefficient and relatively high quantum yield. We further
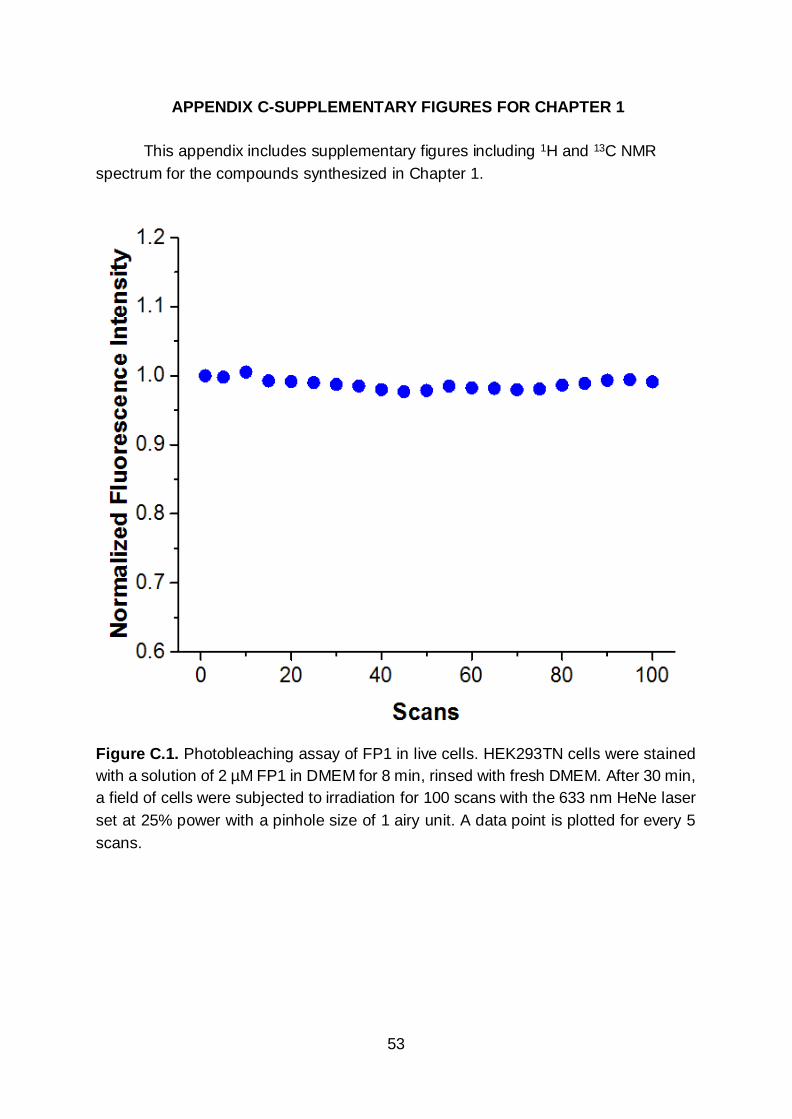
examined the photostability of FP1 towards repeated irradiation cycles and no
decrease in fluorescence was observed after 100 scans at 25% laser power with a
pinhole size of 1 airy unit (Figure C.1). Of note, imaging experiments described in this
study were done using 3% laser power and thus, FP-1 exhibited negligible
photobleaching under these conditions.

5
We then evaluated the fluorescence response of FP1 to FA. Prior to FA
treatment, a 1 µM solution of FP1 is almost non-fluorescent, presumably due to the
donor-excited photoinduced electron transfer (d-PeT) quenching effect of the 4-
nitrobenzyl moiety; however, upon addition of FA, a dose-dependent fluorescence
increase was observed (Figure C.2).22 For example, upon treatment with 0.1 mM FA,
a concentration below reported physiological levels in the brain, FP1 showed ca. 3.9-
fold fluorescence increase after 3 hrs at 37 °C (Figure C.2), whereas 5 mM FA
triggered a ca. 33.5-fold enhancement (Figure C.2a). To show the high selectivity of
FP-1 towards formaldehyde over other biologically relevant aldehyde-containing
species such as acetaldehyde, glucose, methylglyoxal, and pyridoxal, we incubated 1
µM FP1 with 1 mM of the various carbonyl species and observed only minimal cross-
reactivity. Interestingly, FP1 exhibited a mere 1.9-fold fluorescence increase upon
incubation with 1mM acetaldehyde after 3 hrs (Figure 1.2b), while 12.8-fold signal
enhancement was observed when FP1 was treated with FA under the same
conditions. Moreover, the stability of FP-1 in the presence of various cellular
reductants and reactive oxygen species was examined and minimal fluorescence
change was observed.
After demonstrating the excellent response to FA and exceptional selectivity in
vitro, we tested the ability of FP1 to visualize FA in live cells. To this end, HEK293TN
cells were incubated with 2 µM FP1 at 37 °C for 8 min and then treated with buffer
alone or buffer containing FA at 1, 2.5, or 5 mM for 3 hrs. Prior to imaging, cells were
allowed to recover in FA-free buffer for 30 min. As shown in Figure 1.3a-d and
6
quantified in Figure 1.3e, treatment of HEK293TN cells with FA resulted in a dose-
dependent increase in fluorescence. At 5 mM FA, a nearly 3-fold fluorescence increase
was observed. Likewise, a time-dependent turn-on response at each FA concentration
was observed (Figures C.3 & C.4). Having established the utility of FP1 in live
HEK293TN cells, we turned our attention to Neuroscreen-1 (NC) cells, a subclone of
the PC12 cell line recognized as a standard neuronal model system.23 As was the case
with HEK293TN cells, incubation of NC cells with 1, 2.5, or 5 mM FA at 37 °C for 3 hrs
gave rise to a robust dose-dependent signal enhancement of up to 2.3-fold (Figure
1.4a-d), as well as a time-dependent turn-on response at each concentration (Figures
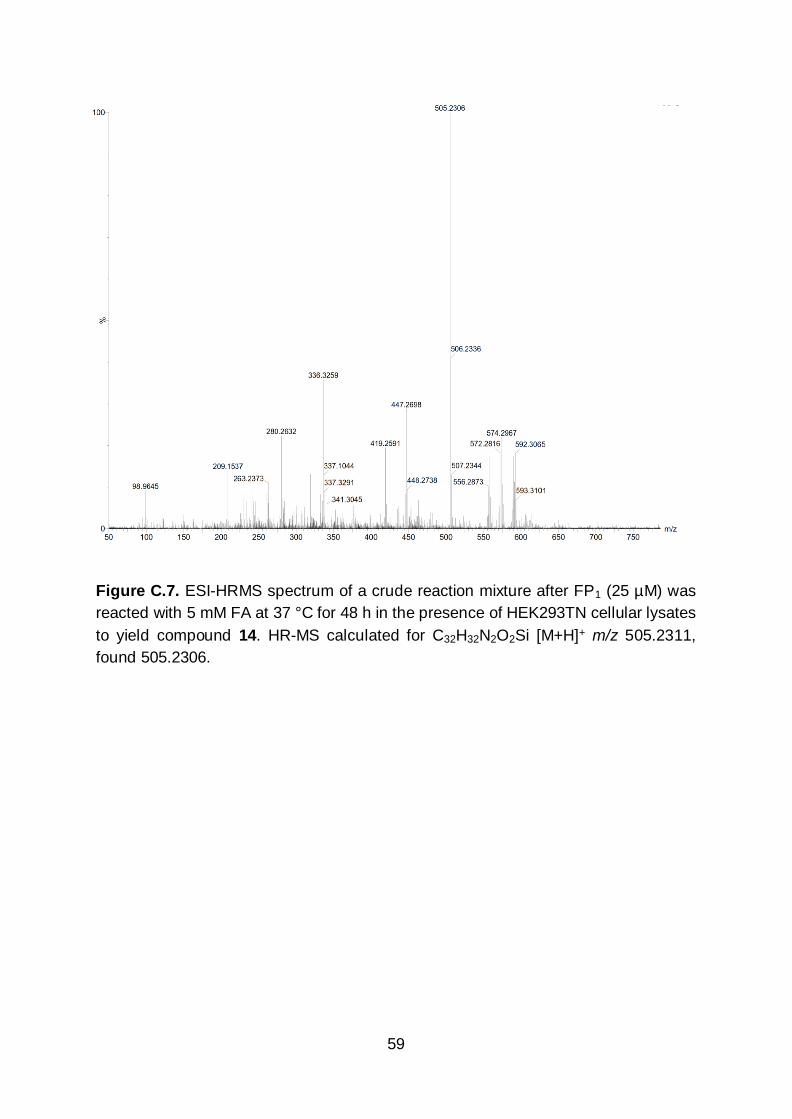
C.5 & C.6). We confirmed via HR-MS that the fluorescence increase resulted from
conversion of FP1 to carboxyaldehyde 4 by reacting FP1 with 5 mM FA in the presence
of cellular lysates (Figure C.7). Because FA is a powerful fixative, we performed cell
viability assays to determine the cytotoxicity of FA under our experimental conditions.
We employed a dye exclusion protocol utilizing trypan blue to selectively stain and
distinguish dead cells from those that were viable. At 1 mM FA, only 5% of the
HEK293TN cells were dead after 3 hrs, whereas nearly 35% of cells were no longer
viable at 5 mM FA (Figure C.8a). NC cells on the other hand, were remarkably resilient
when incubated with FA up to 2.5 mM. Specifically, at this concentration there was only
ca. 12% loss in viability after 3 hrs. However, incubation with 5 mM FA resulted in
considerable cell death (Figure C.8b). To further verify that the cell populations under
investigation were indeed alive, DAPI, a cell permeable nuclear and chromosome
counterstain, was employed to identify intact nuclei (Figure C.9). Owning to the

7
positive imaging results, we were motivated to perform a real-time imaging experiment
in live NC cells. For this experiment, NC cells were stained with 1 µM FP1 as previously
described followed by on-stage addition of 1 mM FA at 25 °C. Images were then
acquired every min for 2 hrs. Under these conditions we observed a 1.3-fold
fluorescence increase; however, we also noted a FA-induced cell rounding effect
which could be reversed during a 30 min recovery period. It is essential to determine
the cellular distribution of FP1 because enzymes that produce endogenous FA exhibit
unique subcellular localization patterns. For example, SSAO is primarily localized to
the plasma membrane.24 Thus, we co-stained both HEK293TN and NC cells with ER-
Tracker Green, LysoTracker Green DND-26, and MitoTracker Green FM, fluorescent
indicators that are known to selectively stain the endoplasmic reticulum, lysosome,
and mitochondria, respectively (Figures C.10 & C.11). From these imaging
experiments, it was evident that FP1 stained the cytoplasm and the endoplasmic
reticulum in both cell lines as shown by excellent fluorescence overlay with ER-Tracker
Green. In contrast, FP1 did not co-localize with the lysosomal or mitochondrial stains.
Additionally, we performed an assay to determine dye efflux properties. HEK293TN
and NC cells were stained with 1 µM FP1 for 8 min and then washed with fresh dye-
free buffer. Images were acquired after a 30 min recovery period and then again after
8 hrs. We found that there was no statistically significant decrease in fluorescence
suggesting that FP1 is chemically stable and does not efflux into the cell media (data
not shown).

8
To corroborate our confocal imaging data, we turned to flow cytometry because
this high-throughput technique allows for the rapid quantification of large cell
populations. As such, HEK293TN and NC cells were stained with FP1 as previously
described and then incubated with 1, 2.5, and 5 mM FA for up to 3 hrs. As with confocal
imaging, we observed a concentration- and time-dependent fluorescence signal
enhancement (Figures C.12 & C.13). Indeed, there was a clear shift in the live cell
population when FA was applied. Based on the median APC-A fluorescence intensity
values (an APC-A filter set was used), treatment of HEK293TN cells with 5 mM FA at
37 °C for 3 hrs resulted in nearly a 2.5-fold turn-on, which is in agreement with the 2.9-
fold turn-on from confocal imaging assays (Figure 1.3e). In contrast, NC cells
incubated with 5 mM FA afforded a 4.2-fold increase by flow cytometry, whereas, only
a 2.3-fold turn-on was noted using confocal microscopy (Figure 1.3e). This
discrepancy can be attributed to the cytotoxicity of FA at this concentration which
reduces the fluorescence of dead cells due to dye leakage. Thus, a lower apparent
turn-on was recorded because it is difficult to image only viable cells in the presence
of those that are dead.
1.3 CONCLUSIONS AND PERSPECTIVES
In summary, we have developed a new fluorescent probe, FP1, for imaging FA
using the 2-aza-Cope sigmatropic rearrangement. FP1 is highly sensitive and
selective towards FA wand was used to detect FA in vitro at concentrations below
physiologically relevant concentrations. Additionally, FP1 is based on a new julolidine-

9
based silicon rhodol fluorescent scaffold which features an absorption maxima
centered at 633 nm. This property enabled us to excite FP1 with the 633 nm helium-
neon laser in both confocal microscopy and flow cytometry experiments. Because FP1
exhibits excellent photostability, metabolic stability and slow efflux, we were able to
monitor intracellular FA concentration in real time. We envision that with the
improvement on the relatively slow reaction kinetics of FP-1, our strategy will be able
to elucidate the physiological roles of FA in live cells. Moreover, since our work was
published, other groups have developed two-photon FA probes and positron emission
tomography probes that have shown satisfactory results for the in vivo imaging of
FA.25,26 Ongoing efforts in our group are working towards the development of FA
photoacoustic probes which will be reported in subsequent works.

10
The material in Chapter 2 includes published work: Li, H.; Zhang. P.; Smaga, L.; Hoffman. R.; Chan, J.
J Am Chem Soc 2015, 137, 15628. Figures are adapted with permission from the authors.
CHAPTER 2: PHOTOACOUSTIC PROBES FOR RATIOMETRIC IMAGING OF
COPPER(II)
2.1 BACKGROUND
The photoacoustic (PA) effect is a “light in, sound out” phenomenon where light
absorption by an optical absorber thermoelastically generates pressure waves
(sound). Based on the PA effect, photoacoustic tomography (PAT) was developed to
construct high-resolution tomographic images by detecting the pressure wave
resulting from light absorption event.27,28 PAT holds great promise for medical
diagnostic applications because it synergistically combines the excellent contrast of
optical imaging with the deep-tissue penetration of ultrasonic imaging. In contrast to
most of the purely optical methods such as fluorescence microscopy where the
imaging depth is limited to 1 mm as defined by optical diffusion limit, PAT can reach
several centimeter of depth penetration while retaining high special resolution. The
increased penetration depth is achievable with PAT because sound scatters much less
than light in biological tissues. Compared to ultrasonic imaging that rel ies on the
relatively small difference in acoustic impedance which often leads to weak contrast
in soft tissue, PAT offers much higher sensitivity of detection due to the high variance
in the optical properties in different soft tissues. Moreover, because PAT does not
involve ionizing radiation, it is less invasive compared to x-ray computed tomography
(CT) or positron emission tomography (PET), for medical diagnostic applications.

11
Indeed, PAT has been applied non-invasively to visualize and study various types of
cancer,29 cardiovascular diseases,30 and abnormalities of microcirculation.31
Initially, endogenous contrasts such as hemoglobin, melanin and lipids were
used in PAT to identify diseases such as cancer and to study physiological processes
in vivo.32,33 However, many diseases and processes have little or insufficient intrinsic
PA contrast. As the demand for greater sensitivity and selectivity grew, exogenous
contrasts based on small-molecule dyes, metal-based nanoparticles and carbon
nanotubes have been developed.34 These contrast agents enhance the PA signal of
the target by specific localization via passive diffusion or receptor-mediated uptake
pathways. While these contrast agents are able to provide structural and functional
information, they can rarely reveal information at the molecular level. Indeed, there
have only been several reports of PA probes that can be activated by a molecular
target to elicit a change in the signal intensity.35-37 We termed this versatile class of PA
agents “acoustogenic probes” (APs), defined as small-molecule-based activatable
imaging agents that respond selectively to stimuli (e.g., tumor biomarkers) to afford a
PA signal enhancement. The molecular information obtained by these APs are
invaluable for both basic research and personalized biomedicine such as tailoring
treatment to a specific individual. As such, our goal was to develop new APs that will
offer the unique opportunity to interrogate the complex biological role of a given
molecular target in its native environment with minimal perturbation.
12
2.2 RESULTS AND DISCUSSION
To this end, we have developed two APs, APC-1 and APC-2 (Acoustogenic
Probe for Copper(II)-1 and -2), for the ratiometric photoacoustic imaging of Cu(II).38
For this project, we chose to detect Cu(II) because dysregulation of this important
transition metal ion has been implicated in numerous diseases including Alzheimer’s
disease, an area studied by our group. 39 APC-1 comprised of a Cu(II)-responsive 2-
picolinic ester moiety that can selectively chelates Cu(II) and activates the ester bond
for hydrolysis (Figure 2.1a, in blue),40,41 as well as a near-infrared (NIR) absorbing
aza-BODIPY dye platform to generate the PA signal (Figure 2.1a, in black); while APC-
2 has three extra sulfated ethylene glycol functional groups compared to APC-1 to
enhance water solubility (Figure 2.1a, in red). We chose aza-BODIPY as the dye
platform because it has maximum absorption in the NIR range (650-900 nm), a large
extinction coefficient (> 104 M-1cm-1) and high photostability which are all desirable
properties for bioimaging.
Additionally, we tuned the acidity of the aza-BODIPY phenol moiety by installing
two ortho-chloro substituents. The resulting compound has an apparent pKa value of
4.35 which ensures full deprotonation of the phenol after APCs react with Cu(II) at
physiological pH (Figure 2.1b). Compared to the phenol capped with 2-picolinic ester,
the uncapped phenoxide product 6 has a much stronger electron donating capability
and can red-shift the absorption maximum of the aza-BODIPY via internal charge
transfer. Indeed, our aza-BODIPY dye exhibits dual-wavelength absorbance bands,
one below 700 nm and the other above, which correspond to the capped 2-picolinic

13
ester probe (Figure 2.2, dotted line) and the uncapped phenoxide product 21,
respectively (Figure 2.2, solid line), thereby enabling ratiometric imaging of Cu(II).42,43
This is very valuable because ratiometric response can account for artifacts such as
undesirable variability in the signal intensity due to non-uniform dye accumulation or
photobleaching. Our strategy involves irradiating APC-1 at both the blue-shifted (680
nm) and red-shifted (755 nm) absorbance maxima to generate two corresponding PA
signals from which a ratio can be determined (Figure 2.1b). In the absence of Cu(II),
the 2-picolinic ester moiety remains intact and thus, the absorbance at 680 nm will be
larger than the signal at 755 nm resulting in a small 775/680 PA ratio. In contrast, when
APC-1 is treated with Cu(II), the hydrolyzed product 6 will exhibit a decrease in the
680 nm band and a concomitant increase in the 755 nm absorbance maximum leading
to a large 775/680 PA ratio. Normalization of the two PA ratios will result in the
ratiometric turn-on response.
First, we synthesized APC-1 via an EDC-mediated coupling reaction between
2-picolinic acid and the dichlorophenol precursor 21 in 53% yield (Scheme E.1).
However, because APC-1 is extremely hydrophobic, organic co-solvents or
surfactants were required to achieve sufficient solubility to avoid dye aggregation in
aqueous buffers since aggregation abolishes the dual-wavelength character requisite
for ratiometric imaging. As such, we sought to develop a water soluble analog, first by
employing previously reported strategies for enhancing the hydrophilicity of aza-
BODIPY dyes such as PEGylation and incorporation of amino sulfonic acid
moieties.44,45 Unfortunately, these approaches were insufficient. Instead, we found
14
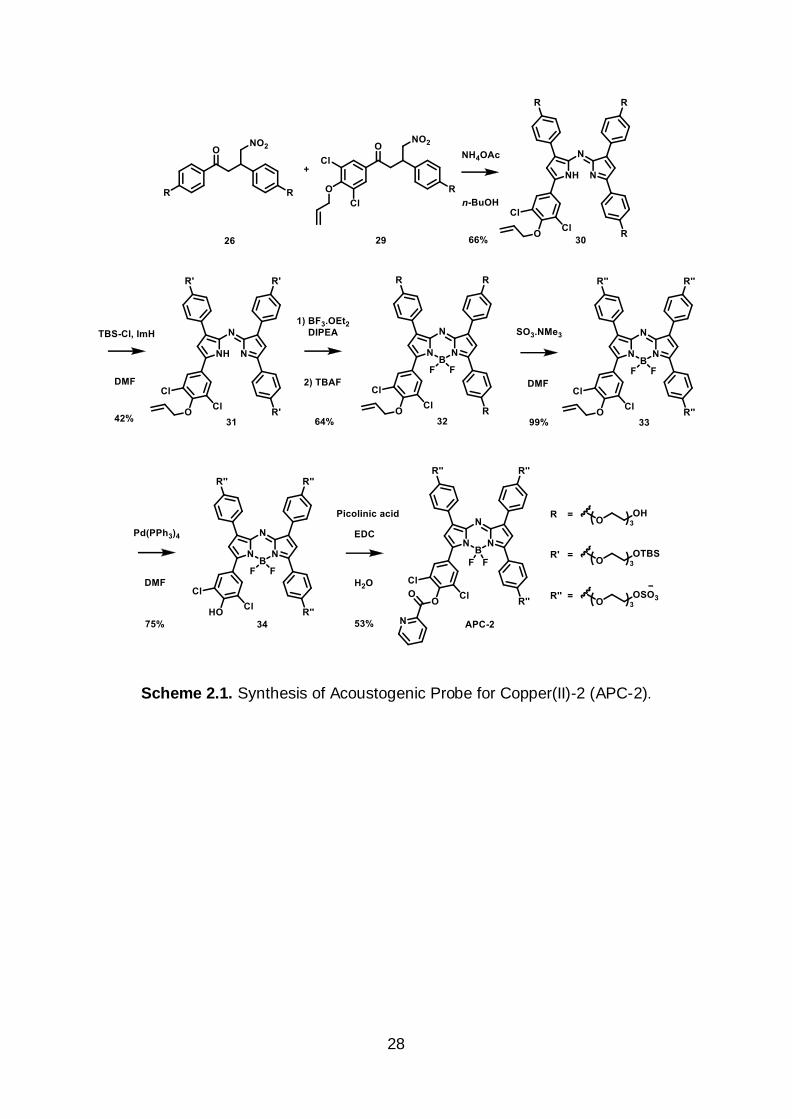
that three PEG-3 sulfate groups endowed excellent water solubility. As such, APC-2,
was synthesized beginning from the dimerization of 4-nitro-1,3-diphenylbutan-1-one
precursors 26 and 29 to afford the tetraarylazadipyrromethene intermediate 30. To
facilitate purification of 30 from homodimers of 26 and 29, it was necessary to convert
the primary alcohols to the corresponding tert-butyldimethylsilyl ether groups using
TBS-Cl. The fully TBS-protected tetraarylazadipyrromethene 31 underwent facile
boron chelation which was followed by desilylation using TBAF to afford aza-BODIPY
32 in 64% yield. Sulfation of 18 with SO3-NMe3 complex in DMF gave the PEG-3
sulfate intermediate 33 which was subjected to standard Tsuji-Trost deallylation
conditions to give 34 in 74% yield over two steps. Lastly, the 2-picolinic ester was
installed using EDC in water to afford APC-2 in 53% yield (Scheme 2.1).
We subsequently characterized the photophysical properties of APCs as
summarized in table 2.1. Unless noted otherwise, all subsequent assays were done in
PBS with 0.1% CrEL, a potent surfactant used as a vehicle to solubilize poorly-water
soluble drugs. The absorbance maximum of APC-2 was centered at 697 nm (ε = 3.6
× 104 M-1cm-1), whereas the corresponding maximum of the phenoxide product 34 was
at 767 nm (3.7 × 10⁴ M-1cm-1) (Table 2.1). Because both compounds were non-
fluorescent in PBS, there would be a greater extent of non-radiative decay which
correlates to an overall stronger PA signal.46 APC-2 was exceptionally photostable and
only photobleached ~15% after continuous irradiation with 90% light intensity for 1 hr
(Figure F.1).

15
We then turned our attention to evaluating the response of APC-2 to Cu(II)
supplementation using UV-Vis spectroscopy. The absorbance of APC-2 and its
phenoxide product 34 differ dramatically owing to the extended π-conjugation of the
product. Specifically, APC-2 exhibits a large bathochromic shift (70 nm) of the λmax
from 697 nm to 767 nm (Figure 2.3a). As a consequence, the extinction coefficient at
767 nm increased from 0.2 × 10⁴ M−1cm−1 to 3.7 × 10⁴ M−1cm−1. This bathochromic
shift enabled ratiometric imaging via irradiating APC-2 and its phenoxide product 34
at 697 nm and 767 nm. Indeed, APC-2 exhibited a normalized ratiometric turn-on
response of 91.3- and 100.5-fold when treated with 1 and 10 equivalents of Cu(II),
respectively (Figure 2.3b). Specifically, upon addition of Cu(II), we observed a slight
decrease in the PA output at 697 nm and a large increase in the PA signal at 767 nm
as a result if the Cu(II)-mediated hydrolysis of the 2-picolinic ester moiety (Figure 2.3c).
Having established excellent responsiveness to Cu(II), we then evaluated the metal
ion selectivity by treating solutions of APC-2 with various biologically relevant metal
ions. The PA response of APC-2 was not affected by the presence of physiologically
relevant concentrations of alkaline earth metals such as Mg(II) and Ca(II). Moreover,
divalent transition metal ions like Mn(II), Fe(II), Co(II), Ni(II), and Zn(II) also did not
induce a change in the PA signal. Finally, APC-2 was selective for Cu(II) over Cu(I),
verifying its excellent metal and redox specificity (Figure 2.3d).
Lastly, we compared the PA and fluorescence emission properties of APC-2 as
a function of imaging depth for potential deep-tissue imaging experiments. To this end,
we developed a tissue-mimicking phantom made from milk, water and agarose. We

16
varied the ratio of milk to water to obtain a phantom where the scattering and
absorption properties were at least 2x greater than that of an authentic biological
tissue. Solutions of APC-2 in fluorinated ethylene propylene tubes were inserted into
phantoms that cut to 1 cm thickness above and below the sample, and were then
imaged with PA tomographer. In comparison to samples analyzed without the phantom
overlay, the PA signal intensity only decreased by ~15% at this imaging depth (data
not shown). In contrast, when a solution of APC-2 in 2:3 v/v EtOH:PBS (conditions that
favor fluorescence emission) was imaged using an epi-fluorescence microscope, a 1
cm thick phantom overlay completely abolished the fluorescence signal (Figure F.10).
2.3 CONCLUSIONS AND PERSPECTIVES
In closing, we have developed the first small-molecule-based probe exclusively
designed for ratiometric photoacoustic imaging. APC-2 displays an absorbance
maximum in the NIR window, a large extinction coefficient (> 104 M-1cm-1), and is highly
photostable. The unique dual-wavelength absorbance profile and low apparent pKa of
the dichlorophenol moiety produces a large normalized turn-on response of 100.5-fold
upon Cu(II) treatment, but not to other biologically relevant metal ions. We also
highlight the strength of PA imaging by performing imaging experiments in the
centimeter range using a highly scattering and absorbing tissue-mimicking phantom.
APC-2 has the potential to enable deep-tissue molecular imaging with high resolution
which is difficult to achieve with other imaging modalities. Additionally, the highly
modular aza-BOPIDY platform used in the current study can be easily adapted to

17
sense other biologically important analytes beyond Cu(II) by simply installing
alternative reactive triggers in the last step of the synthesis. Ongoing efforts in our
group focused on developing other strategies to solubilize aza-BODIPY platform
without adding charged residues, as well as expanding our platform to image other
biologically important analytes that are also involved in the progression of Alzheimer’s
disease.

18
FIGURES, TABLES AND SCHEMES
Figure 1.1. A new formaldehyde detection strategy based on the 2-aza-Cope
sigmatropic rearrangement. The R group designates the 4-nitrobenzyl quencher
moiety. Labels a, b, and c represent condensation, rearrangement, and hydrolysis
steps, respectively.

19
Scheme 1.1. Synthesis of julolidine-based silicon xanthone 6.
20
Scheme 1.2. Synthesis of indole 12.

21
Scheme 1.3. Synthesis of FP1.

22
Table 1.1. Photophysical properties of compound 13, 14, 15 and FP1. a) ND = not
determinable.
Compound Φ ε (M-1·cm-1) λabs (nm) λem (nm)
13 NDa 8.6 × 10⁴ 633 649
14 0.13 10.6 × 10⁴ 633 649
15 0.02 10.0 × 10⁴ 633 649
FP1 NDa 2.9 × 10⁴ 620 649

23
Figure 1.2. a) Fluorescence response of 1 µM FP1 to 5 mM FA in PBS buffer (pH 7.4)
at 37 °C. FP1 was excited at 633 nm and the emission was collected between 640
and 750 nm. Time points on graph are 0, 30, 60, 90, 120, 150, and 180 min. b)
Fluorescence response of 1 µM FP1 to biologically relevant aldehydes, reactive sulfur
species, and hydrogen peroxide. Bars represent normalized fold-changes in response
to treatment with each analyte listed at 1 mM for 3 hrs.

24
Figure 1.3. Confocal microscopy images acquired by irradiation of HEK293TN cells
(top) and NC cells (bottom) treated with a) a DMEM vehicle control, b) 1 mM, c) 2.5
mM, and d) 5 mM FA for 3 hrs at 37 °C with the 633 nm HeNe laser. Scale bar
represents 20 µm. e) Quantification of imaging data.

25
Figure 1.4. Flow cytometry analysis of a) HEK293TN and b) NC cells stained with 1
µM FP1 and incubated with 5 mM FA at 37 °C for 3 hrs. Excitation was provided by
the 633 nm HeNe laser and a APC-A filter set was applied. Only live cells were
counted.

26
Figure 2.1. a) Chemical structure of APC-1 and APC-2. b) Proposed mechanism for
ratiometric PA imaging of Cu(II). APC-1 (left) is excited at 680 nm (blue) and 755 nm
(red) to afford two PA signals. In the presence of Cu(II), the 2-picolinic ester moiety is
removed to yield 21, resulting in a weaker PA signal at 680 nm and stronger PA signal
755 nm.

27
Figure 2.2. Normalized absorbance spectra of 2 µM APC-1 (dashed line) and 2 µM
21 (solid line) in PBS + 0.1% CrEL (pH 7.4).
600 650 700 750 800 850
0.0
0.2
0.4
0.6
0.8
1.0
No
rmalized
Ab
so
rban
ce
Wavelength (nm)
APC-1
21
28
Scheme 2.1. Synthesis of Acoustogenic Probe for Copper(II)-2 (APC-2).

29
Compound ε (M-1·cm-1) λabs (nm) Φ
21 3.9 × 10⁴ 755 5.0% a
APC-1 1.9 × 10⁴ 675 2.8% a
34 3.7 × 10⁴ 767 1.2 b
APC-2 3.6 × 10⁴ 697 5.4% b
Table 2.1. Photophysical properties of compound 21, APC-1, 34 and APC-2
measured in PBS (pH 7.4) + 0.1% CrEL. a) Quantum efficiencies determined in THF.
b) Quantum efficiencies determined in 2:3 v/v EtOH:PBS.

30
Figure 2.3. (a) Normalized absorbance spectra of APC-2 and the phenoxide 34 at 2
µM. (b) Normalized PA turn-on responses of APC-2 in the presence of 1 and 10
equivalents of Cu(II). (c) PA images (λ = 697 nm, left; λ = 767 nm, right) of APC-2
treated with 0 and 10 equivalents of Cu(II) in a phantom. (d) PA responses of APC-2
to various metal ions (2 mM for Ca(II) and Mg(II), 50 μM for all other cations).

31
REFERENCES
(1) Bahar, I.; Wallqvist, A.; Covell, D. G.; Jernigan, R. L. Biochemistry 1998, 37,
1067.
(2) Yu, P. H.; Cauglin, C.; Wempe, K. L.; Gubisne-Haberle, D. Anal Biochem 2003,
318, 285.
(3) Iborra, F. J.; Renaupiqueras, J.; Portoles, M.; Boleda, M. D.; Guerri, C.; Pares, X.
J Histochem Cytochem 1992, 40, 1865.
(4) Tong, Z. Q.; Han, C. S.; Luo, W. H.; Wang, X. H.; Li, H.; Luo, H. J.; Zhou, J. N.;
Qi, J. S.; He, R. Q. Age 2013, 35, 583.
(5) Tong, Z. Q.; Han, C. S.; Luo, W. H.; Li, H.; Luo, H. J.; Qiang, M.; Su, T.; Wu, B.
B.; Liu, Y.; Yang, X.; Wan, Y.; Cui, D. H.; He, R. Q. Sci Rep-Uk 2013, 3.
(6) Unzeta, M.; Sole, M.; Boada, M.; Hernandez, M. J Neural Transm 2007, 114,
857.
(7) Lu, J.; Miao, J. Y.; Su, T.; Liu, Y.; He, R. Q. Bba-Gen Subjects 2013, 1830, 4102.
(8) Chen, K.; Maley, J.; Yu, P. H. J Neurochem 2006, 99, 1413.
(9) Su, T.; Wei, Y.; He, R. Q. Prog Biochem Biophys 2011, 38, 1171.
(10) Szarvas, T.; Szatloczky, E.; Volford, J.; Trezl, L.; Tyihak, E.; Rusznak, I. J
Radioan Nucl Ch Le 1986, 106, 357.
(11) Chan, J.; Dodani, S. C.; Chang, C. J. Nat Chem 2012, 4, 973.

32
(12) Wang, J.; Karpus, J.; Zhao, B. S.; Luo, Z.; Chen, P. R.; He, C. Angew Chem Int
Ed 2012, 51, 9652.
(13) Michel, B. W.; Lippert, A. R.; Chang, C. J. J Am Chem Soc 2012, 134, 15668.
(14) Lin, V. S.; Lippert, A. R.; Chang, C. J. P Natl Acad Sci USA 2013, 110, 7131.
(15) Hirayama, T.; Okuda, K.; Nagasawa, H. Chem Sci 2013, 4, 1250.
(16) Chyan, W.; Zhang, D. Y.; Lippard, S. J.; Radford, R. J. P Natl Acad Sci USA
2014, 111, 143.
(17) Wang, T. N.; Douglass, E. F.; Fitzgerald, K. J.; Spiegel, D. A. J Am Chem Soc
2013, 135, 12429.
(18) Song, H.; Rajendiran, S.; Kim, N.; Jeong, S. K.; Koo, E.; Park, G.; Thangadurai,
T. D.; Yoon, S. Tetrahedron Lett 2012, 53, 4913.
(19) Roth, A.; Li, H.; Anorma, C.; Chan, J. J Am Chem Soc 2015, 137, 10890.
(20) Whitaker, J. E., Haugland, R. P., and Prendergast, F. G. Anal Biochem 1991,
194, 330
(21) Peng, T.; Yang, D. Org Lett 2010, 12, 496.
(22) Ueno, T.; Urano, Y.; Kojima, H.; Nagano, T. J Am Chem Soc 2006, 128, 10640.
(23) Greene, L. A.; Tischler, A. S. P Natl Acad Sci USA 1976, 73, 2424.
(24) Andres, N.; Lizcano, J. M.; Rodriguez, M. J.; Romera, M.; Unzeta, M.; Mahy, N.
J Histochem Cytochem 2001, 49, 209.

33
(25) Tang, Y.; Kong, X.; Xu, A.; Dong, B.; Lin, W. Angew Chem Int Ed 2016, 55,
3356.
(26) Liu, W.; Truillet, C.; Flavell, R. R.; Brewer, T. F.; Evans, M. J.; Wilson, D. M.;
Chang, C. J. Chem Sci 2016, 7, 5503.
(27) Wang, L. H. V.; Hu, S. Science 2012, 335, 1458.
(28) Xia, J.; Yao, J. J.; Wang, L. V. Prog Electromagn Res 2014, 147, 1.
(29) Mallidi, S.; Luke, G. P.; Emelianov, S. Trends Biotechnol 2011, 29, 213.
(30) Zemp, R. J.; Song, L.; Bitton, R.; Shung, K. K.; Wang, L. V. Opt Express 2008,
16, 18551.
(31) Luke, G. P.; Yeager, D.; Emelianov, S. Y. Ann Biomed Eng 2012, 40, 422.
(32) H. F. Zhang, K. Maslov, G. Stoica, L. V. Wang, Nat Biotechnol 2006, 24, 848.
(33) S. Mallidi, G. P. Luke, S. Emelianov, Trends Biotechnol. 2011, 29, 213.
(34) Cash, K. J.; Li, C. Y.; Xia, J.; Wang, L. H. V.; Clark, H. A. Acs Nano 2015, 9,
1692.
(35) Dragulescu-Andrasi, A.; Kothapalli, S. R.; Tikhomirov, G. A.; Rao, J. H.;
Gambhir, S. S. J Am Chem Soc 2013, 135, 11015.
(36) Pu, K. Y.; Shuhendler, A. J.; Jokerst, J. V.; Mei, J. G.; Gambhir, S. S.; Bao, Z.
N.; Rao, J. H. Nat Nanotechnol 2014, 9, 233.

34
(37) Levi, J.; Kothapalli, S. R.; Ma, T. J.; Hartman, K.; Khuri-Yakub, B. T.; Gambhir,
S. S. J Am Chem Soc 2010, 132, 11264.
(38) Li, H.; Zhang. P.; Smaga, L.; Hoffman. R.; Chan, J. J Am Chem Soc 2015, 137,
15628.
(39) Manto, M. Toxics 2014, 2, 327.
(40) Fife, T. H.; Przystas, T. J. J Am Chem Soc 1985, 107, 1041.
(41) Kierat, R. M.; Kramer, R. Bioorg Med Chem Lett 2005, 15, 4824.
(42) Strobl, M.; Rappitsch, T.; Borisov, S. M.; Mayr, T.; Klimant, I. Analyst 2015, 140,
7150.
(43) Jokic, T.; Borisov, S. M.; Saf, R.; Nielsen, D. A.; Kuhl, M.; Klimant, I. Anal Chem
2012, 84, 6723.
(44) Collado, D.; Vida, Y.; Najera, F.; Perez-Inestrosa, E. Rsc Adv 2014, 4, 2306.
(45) Kamkaew, A.; Burgess, K. Chem Commun 2015, 51, 10664.
(46) Kim, C.; Favazza, C.; Wang, L. H. V. Chem Rev 2010, 110, 2756.

35
APPENDIX A-MATERIAL AND METHODS FOR CHAPTER 1
This appendix includes information about the source of materials, general,
spectroscopic methods as well as cell culture and imaging materials and methods
used for Chapter 1.
A.1 MATERIALS
Thin-layer chromatography (TLC) was performed on glass-backed TLC plates
pre-coated with silica gel containing an UV254 fluorescent indicator (Macherey-Nagel).
Compounds were visualized with a 254/365nm, handheld UV lamp (UVP). Flash
chromatography was performed using 230-400 mesh silica gel P60 (SiliCycle Inc).
Solvents used for anhydrous reactions were dried over 3 Å molecular sieves activated
via heating under vacuum at 300 °C. All glassware used in anhydrous reactions were
flame-dried or heated overnight in an oven at 160 °C and cooled immediately prior to
use. 3-Bromoaniline, 3-bromoanisole, 4-bromo-3-methylaniline, 4-nitrobenzaldehyde,
N-iodosuccinimide, potassium allyltrifluoroborate, sodium triacetoxyborohydride,
tetrakis(triphenylphosphine)palladium(0), trifluoromethanesulfonic acid, and
trimethylacetylene were purchased from Oakwood Products and used as received. 1-
Bromo-3-chloropropane, aluminum trichloride, boron tribromide, copper iodide,
dichlorodimethylsilane, formaldehyde solution, methyl chloroformate, phosphorous
oxychloride, sec-butyllithium solution, and tert-butyllithium solution were purchased
from Sigma-Aldrich and used without purification. Deuterated solvents were
purchased from Cambridge Isotope Laboratories. ER-Tracker™ Green, LysoTracker®
Green DND-26, MitoTracker® Green FM, DAPI, Trypan Blue solution were purchased
from Life Technologies.
36
All buffers used for pH titrations were prepared in deionized water and brought
to the appropriate pH with aqueous HCl or NaOH. The buffers used were 50 mM
glycine (pH range 2.00-3.50), 50 mM NaOAc (pH range 4.00-5.60), 50 mM MES (pH
range 5.60-6.80), 50 mM HEPES (pH range 6.80-8.20), 50 mM Tris (pH range 8.20-
9.50) and 50 mM glycine (pH range 9.50-10.40). A 10 mM stock solution of
formaldehyde for in vitro titration experiments was prepared by heating a suspension
of paraformaldehyde (>88% w/w, 17.6 mg, 0.50 mmol, TCI, lot #NXR2B) in phosphate
buffered saline (PBS) buffered to pH 7.4 (50mL) at 88 °C for 1 hr. The solution was
cooled to room temperature and filtered through a 0.22 µm syringe filter (Millex).
A.2 SPECTROSCOPIC METHODS
NMR spectra were recorded on Varian 400 or 500 MHz spectrometers at 25
°C. Chemical shifts are reported in ppm (δ) and are referenced to residual protic peaks.
The following abbreviations are used to describe coupling constants: singlet (s),
doublet (d), triplet (t), quartet (q), doublet doublet (dd), doublet triplet (dt), doublet
quartet (dq), doublet doublet triplet (ddt), multiplet (m), and broad singlet (bs). IR
spectra were recorded with a PerkinElmer Spectrum Two IR spectrometer. High-
resolution mass spectra were acquired with a Waters Q-TOF Ultima ESI mass
spectrometer and a Waters Synapt G2-Si ESI/LC-MS mass spectrometer. UV-visible
spectra were recorded on a Cary 60 spectrometer. Fluorescence spectra were
acquired on a QuantaMaster-400 scanning spectrofluorometer with micro

37
fluorescence quartz cuvettes (Science Outlet). Flow cytometry was performed on a
BD Biosciences LSR II (San Jose, CA, USA), and the data were analyzed as described
using FACSDiva software.
A.3 CELL CULTURE AND IMAGING MATERIALS AND METHODS
HEK293TN cells were obtained from Prof. Paul Hergenrother (UIUC,
Chemistry) and cultured in phenol-red free Dulbecco’s modified eagle medium
(DMEM, Corning) supplemented with 10% fetal bovine serum (FBS, Sigma Aldrich),
and 1% penicillin/streptomycin (Corning). Neuroscreen-1 cells were obtained from
Prof. Kai Zhang (UIUC, Biochemistry) and cultured in Ham’s F-12K medium (Sigma
Aldrich) supplemented with 15% horse serum (Hyclone), 2.5% fetal bovine serum
(FBS, Sigma Aldrich), and 1% penicillin/streptomycin (Corning). Cells were incubated
at 37°C and 5% CO2. One day before imaging, cells were passed and plated on 8-well
chambered coverglasses (Lab-Tek) at a density of 40,000 cells per mL (or 20,000 cells
per well). Cells would reach 70-80% confluency before imaging. Immediately before
the experiments, cells were washed with serum-free DMEM, incubated with FP1 in
serum-free DMEM, rinsed with fresh media and imaged. Samples of HEK293TN and
NC cells for flow cytometry were prepared by passaging and seeding each well of a
6-well cluster culture dish (Cyto-One) with 300,000 cells one day before experiments.
Cells had reached 70% confluency before staining with 2 µM FP1 for 8 mins. Stained
cells were aspirated and serum-free DMEM added. Subsequently, a 10x concentrated
FA solution was added to give a final concentration of 1.0 mM. 2.5 mM and 5 mM.

38
After incubation cells with FA, the media was removed and replaced with serum-free
DMEM. Finally, cells were trypsinized, pelleted via centrifugation, resuspended in
PBS for flow cytometric analysis.

39
APPENDIX B-SYNTHESES FOR CHAPTER 1
This appendix includes the detailed synthetic methods and spectroscopic
characterizations for compounds synthesized in Chapter 1.
Scheme B.1. Synthesis of Si-xanthone 6.
2-Bromo-4-methoxybenzyl chloride (2). A two-neck round-bottom flask was
charged with 3-bromoanisole (35.0 mL, 276.5 mmol, 1.0 eq.) and formaldehyde (37
wt % in H2O, 38.0 mL, 1.38 mol, 5.0 eq.). Hydrogen chloride gas, generated from conc.
hydrochloric acid and conc. sulfuric acid, was bubbled through the reaction mixture
which was stirred at 50 °C for 6 hrs. Upon cooling to room temperature, the reaction
was diluted with H2O (50 mL) and extracted with CH2Cl2 (3 × 50 mL). The combined
organic fractions were washed with brine (100 mL), dried (Na2SO4), filtered and
concentrated under reduced pressure. The crude residue was purified by fractional
distillation to afford the title compound as a colorless oil (43.1 g, 183.1 mmol, 66.3%
yield). 1H NMR (500 MHz, CDCl3) δ 7.36 (d, J = 8.5 Hz, 1H), 7.13 (d, J = 2.6 Hz, 1H),

40
6.85 (dd, J = 8.5, 2.6 Hz, 1H), 4.68 (s, 2H), 3.79 (s, 3H). 13C NMR (125 MHz, CDCl3)
δ 160.5, 132.0, 129.0, 125.0, 118.6, 114.0, 55.8, 46.5. IR (neat): 3008, 2966, 2937,
1602, 1492, 1263, 1242, 1028, 865, 843, 729, 661 cm -1. HR-MS calculated for
C8H8BrClO [M-HCl]+ m/z 198.9753, found 198.9759.
8-Bromo-1,2,3,5,6,7-hexahydropyrido[3,2,1-ij]quinoline (4). A round-bottom flask
was charged with 3-bromoaniline (8.0 mL, 73.1 mmol, 1.0 eq.), 1-bromo-3-
chloropropane (58.5 mL, 584.6 mmol, 8.0 eq.), and Na2CO3 (31.0 g, 292.3 mmol, 4.0
eq.). After stirring at 140 °C for 48 hrs, the reaction cooled to room temperature,
transferred to a separatory funnel, and extracted with CH2Cl2 (3 × 100 mL). The
combined organic fractions were dried (Na2SO4), filtered, and concentrated under
reduced pressure. Residual 1-bromo-3chloropropane was removed at 60 °C, 1 Torr.
The crude dialkylated intermediate was dissolved in DMF (15.0 mL) and stirred at 160
°C for 24 hrs. After cooling to room temperature, the solution was concentrated under
reduced pressure, washed with H2O (200 mL), and extracted with CH2Cl2 (3 × 100
mL). The combined organic fractions were dried (Na2SO4), filtered, and concentrated
under reduced pressure. The crude residue was purified via flash chromatography on
a silica column (1:99 v/v EtOAc:Hexanes) to afford the title compound as a light yellow
oil (12.0 g, 47.6 mmol, 65.1% yield). 1H NMR (400 MHz, CDCl3) δ 6.78 (d, J = 8.0 Hz,
1H), 6.66 (d, J = 8.0 Hz, 1H), 3.14 (dt, J = 12.5, 5.7 Hz, 4H), 2.80 (t, J = 6.7 Hz, 2H),
2.72 (t, J = 6.5 Hz, 2H), 2.07–1.87 (m, 4H). 13C NMR (100 MHz, CDCl3) δ 144.8, 128.0,
123.2, 120.9, 120.8, 119.6, 50.2, 49.9, 28.8, 27.8, 22.2, 22.1. IR (neat): 3009, 2935,

41
1583, 1488, 1456, 1440, 1388, 1327, 1207, 1186, 1067, 1038, 792, 755, 578, 463 cm-
1. HR-MS calculated for C12H14BrN [M+H]+ m/z 252.0388, found 252.0393.
8-Bromo-9-(2-bromo-4-methoxybenzyl)-2,3,6,7-tetrahydro-1H,5H-pyrido[3,2,1-
ij]quinoline (5). A flame-dried round-bottom flask was charged with compound 8 (5.0
g, 19.8 mmol, 1.0 eq.) and anhydrous CH2Cl2 (200 mL). AlCl3 (3.17 g, 23.8 mmol, 1.2
eq.) was added to the reaction in one portion. The resultant mixture was sonicated
under a nitrogen atmosphere for 30 min. A solution of compound 8 (6.07 g, 25.8 mmol,
1.4 eq.) in anhydrous CH2Cl2 (7.0 mL) was transferred to the reaction via dropwise
syringe addition. After overnight stirring at room temperature, the reaction was
quenched by slow addition of sat. NaHCO3 (~200 mL) and filtered through a bed of
celite which was washed with CH2Cl2 (100 mL). The aqueous phase was separated
and extracted with CH2Cl2 (3 × 100 mL). The combined organic fractions were washed
with brine (100 mL), dried (Na2SO4), filtered, and concentrated under reduced
pressure. The crude product was purified via flash chromatography on a silica column
(4:96 v/v EtOAc:Hexanes) to afford the title compound as a brown oil. (2.71 g, 6.0
mmol, 30.0% yield). Unreacted compound 8 was recovered via flash chromatography
on a silica column. 1H NMR (500 MHz, CDCl3) δ 7.18 (d, J = 2.6 Hz, 1H), 6.93 (d, J =
8.5 Hz, 1H), 6.79 (dd, J = 8.5, 2.6 Hz, 1H), 6.51 (s, 1H), 4.04 (s, 2H), 3.80 (s, 3H),
3.22–3.13 (m, 2H), 3.13–3.08 (m, 2H), 2.86 (t, J = 6.7 Hz, 2H), 2.67 (t, J = 6.6 Hz, 2H),
2.07–2.00 (m, 2H), 2.00–1.94 (m, 2H). 13C NMR (125 MHz, CDCl3) δ 158.6, 143.4,
132.3, 131.1, 128.9, 126.5, 125.9, 125.2, 121.6, 121.0, 118.0, 113.7, 55.7, 50.3, 49.8,
42
41.4, 29.7, 27.8, 22.5, 22.2. IR (neat): 3006, 2938, 2834, 1488, 1458, 1441, 1331,
1305, 1283, 1233, 1205, 1183, 1037, 858, 751, 725, 667, 547, 463 cm-1. HR-MS
calculated for C20H21Br2NO [M+H]+ m/z 450.0068, found 450.0055.
12-methoxy-14,14-dimethyl-2,3,6,7,9,14-hexahydro-1H,5H-benzo[5,6]silino[2,3-
f]pyrido[3,2,1-ij]quinolone (5.5). A flame-dried round-bottom flask was charged with
compound 9 (2.71 g, 6.0 mmol, 1.0 eq.) and anhydrous THF (100 mL). An oven-dried
addition funnel was attached to the flask and the system was flushed with nitrogen.
The reaction was cooled to -78 °C and treated with 1.4 M sec-butyllithium in
cyclohexane (12.9 mL, 18.0 mmol, 3.0 eq.) via funnel addition over 30 min. After
stirring at the same temperature for 10 min, a solution of SiMe2Cl2 (1.36 mL, 11.5
mmol, 1.9 eq.) in anhydrous THF (11.5 mL) was added dropwise over 20 min. The
reaction was warmed to room temperature and stirred overnight. The volatiles were
removed under reduced pressure to obtain the crude product which was washed with
sat. NaHCO3 (100 mL) and extracted with CH2Cl2 (3 × 50 mL). The combined organic
fractions were washed with brine (100 mL), dried (Na2SO4), filtered, and concentrated
under reduced pressure to afford the title compound as a brown oil which was
sufficiently pure to use without further purification. 1H NMR (400 MHz, CDCl3) δ 7.23
(d, J = 8.3 Hz, 1H), 7.17 (d, J = 2.7 Hz, 1H), 6.88 (dd, J = 8.3, 2.7 Hz, 1H), 6.85 (s,
1H), 4.00 (s, 2H), 3.86 (s, 3H), 3.16 (s, 2H), 2.99 (s, 1H), 2.81 (s, 1H), 2.20 – 1.96 (m,
4H), 0.56 (d, J = 1.3 Hz, 4H). 13C NMR (100 MHz, CDCl3) δ 157.5, 141.4, 138.6, 137.4,
134.2, 131.3, 128.6, 127.9, 127.7, 123.9, 118.6, 114.3, 55.5, 50.8, 50.2, 40.3, 29.9,

43
28.2, 22.9, 22.4, -0.4. IR (neat): 2933, 2833, 1682, 1596, 1548, 1304, 1246, 1039,
820, 768, 649, 453 cm-1. HR-MS calculated for C22H27NOSi [M+H]+ m/z 350.1940,
found 350.1940.
12-Methoxy-14,14-dimethyl-2,3,5,6,7,14-hexahydro-1H,9H-benzo[5,6]silino[2,3-
f]pyrido[3,2,1-ij]quinolin-9-one (6). A round-bottom flask was charged with
compound 10 (2.1 g, 6.0 mmol, 1.0 eq.), CFCO3 (5.9 g, 18.0 mmol, 3.0 eq.), and
DMSO (20 mL). The reaction mixture was heated at 90 °C with the flask open to the
atmosphere for 3 days. After cooling to room temperature, the reaction was diluted
with CH2Cl2 (50 mL) and filtered through a bed of celite. The filtrate was diluted with
brine (150 mL) and extracted with CH2Cl2 (3 × 100 mL). The combined organic
fractions were washed with brine (100 mL), dried (Na2SO4), filtered, and concentrated
under reduced pressure. The crude product was purified via flash chromatography on
a silica column to afford the title compound as a yellow powder (412 mg, 1.1 mmol,
18.3% yield over two-steps beginning from compound 3). 1H NMR (400 MHz, CDCl3)
δ 8.43 (d, J = 8.9 Hz, 1H), 8.09 (s, 1H), 7.08 (d, J = 2.8 Hz, 1H), 7.02 (dd, J = 8.9, 2.8
Hz, 1H), 3.90 (s, 3H), 3.30 (m, 4H), 2.93 (t, J = 6.3 Hz, 2H), 2.83 (t, J = 6.4 Hz, 2H),
2.13–1.88 (m, 4H), 0.53 (s, 6H). 13C NMR (100 MHz, CDCl3) δ 185.7, 170.6, 161.8,
145.7, 142.2, 135.4, 134.2, 131.9, 130.6, 128.6, 124.8, 123.1, 117.6, 115.1, 55.5, 50.6,
50.1, 29.1, 28.4, 22.0, 21.7, -0.1. m.p. = 130 °C (decomp). IR (neat): 3012, 2972, 1739,
1585, 1366, 1231, 834, 765 cm-1. HR-MS calculated for C22H25NO2Si [M+H]+ m/z
364.1733, found 364.1740.

44
Scheme B.2. Synthesis of 5-Bromo-1,6-dimethyl-1H-indole 12.
Methyl (4-bromo-3-methylphenyl)carbamate (8). A solution of 4-bromo-3-
methylaniline (5.25 g, 28.2 mmol, 1.0 eq.), CH2Cl2 (50 mL), and 10% aq. NaHCO3 (40
mL) was cooled in an ice-bath. Methyl chloroformate (4.0 mL, 51.8 mmol, 1.8 eq.) was
added dropwise to the rapidly stirred solution. The reaction was subsequently warmed
to room temperature and stirred for 2 hrs. The reaction was then diluted with CH2Cl2
(50 mL) and sequentially washed with sat. NH4Cl (50 mL), sat. NaHCO3 (50 mL) and
brine (50 mL). The organic fraction was dried (Na2SO4), filtered and concentrated to
afford the crude residue as a brown solid which was purified via flash chromatography
on a silica column (1:1 v/v EtOAc:Hexanes) to afford the title compound as a white
solid (6.65 g, 27.3 mmol, 96.6% yield). 1H NMR (500 MHz, CDCl3) δ 7.39 (d, J = 8.6
Hz, 1H), 7.28 (s, 1H), 7.18 (s, 1H), 7.12 (d, J = 8.6 Hz, 1H), 3.75 (s, 3H), 2.31 (s, 3H).
13C NMR (125 MHz, CDCl3) δ 154.5, 138.7, 137.4, 132.8, 121.3, 118.8, 118.1, 77.7,

45
77.4, 77.2, 52.7, 23.2. m.p. = 71-72 °C. IR (neat): 3328, 1705, 1584, 1275, 1233, 1071,
1023, 826, 765, 679, 653 cm-1. HR-MS calculated for C9H10BrNO2 [M+H]+ m/z
243.9973, found 243.9977.
Methyl (4-bromo-2-iodo-5-methylphenyl)carbamate (9). A solution of compound 8
(32.0 g, 131.1 mmol, 1.0 eq.) in MeCN (150 mL) was cooled to 0°C in an ice-bath. N-
iodosuccinimide (30.1 g, 137.6 mmol, 1.05 eq.) was added in one portion to the stirred
solution. Trifluoromethanesulfonic acid (1.2 mL, 13.1 mmol, 0.1 eq.) was then added
dropwise. The reaction was subsequently warmed to room temperature and stirred
overnight. After overnight stirring, the resulting white solid was filtered, washed with
cold MeCN, and dried under reduced pressure (42.2 g, 110.1 mmol, 84.0% yield). The
compound was used in the next step without further purification. 1H NMR (500 MHz,
CDCl3) δ 7.94 (s, 1H), 7.85 (s, 1H), 6.87 (s, 1H), 3.80 (s, 3H), 2.35 (s, 3H). 13C NMR
(125 MHz, CDCl3) δ 153.9, 141.0, 139.5, 137.8, 121.9, 119.5, 85.5, 52.9, 23.3. m.p.
130-131 °C. IR (neat): 3276, 2939, 1690, 1603, 1491, 1275, 1241, 1042, 873, 863,
772, 606 cm-1. HR-MS calculated for C9H10BrINO2 [M+H]+ m/z 369.8940, found
369.8945.
Methyl (4-bromo-5-methyl-2-((trimethylsilyl)ethynyl)phenyl)carbamate (10). A
flame-dried round-bottom flask was charged with compound 9 (5.38 g, 14.5 mmol, 1.0
eq.), CuI (0.28 g, 1.5 mmol, 0.1 eq.), and Pd(PPh3)4 (0.84 g, 0.7 mmol, 0.05 eq.) and
then dried under vacuum for 30 min. The solids were then dissolved in anhydrous THF

46
(35 mL) and treated sequentially with trimethylsilylacetylene (2.3 mL, 16.0 mmol, 1.1
eq.) and anhydrous triethylamine (8.1 mL, 58.2 mmol, 4.0 eq.). The reaction was
stirred at room temperature for 1 hr. All volatiles were removed under reduced
pressure and the resultant residue was dissolved in EtOAc (50 mL) and washed with
brine (3 × 50 mL). The organic fraction was dried (Na2SO4), filtered and concentrated
to afford the crude product as a dark brown solid which was purified via flash
chromatography on a silica column (3:97 v/v EtOAc:Hexanes) to afford the title
compound as an orange solid (4.72g, 13.9 mmol, 95.4% yield). 1H NMR (500 MHz,
CDCl3) δ 7.94 (s, 1H), 7.39 (s, 1H), 7.24 (s, 1H), 3.71 (s, 3H), 2.28 (s, 3H), 0.24 (s,
9H). 13C NMR (125 MHz, CDCl3) δ 153.4, 140.0, 138.7, 134.6, 119.4, 117.0, 110.6,
102.6, 99.0, 52.5, 23.6, 0.1. m.p. = 73-74 °C. IR (neat): 3394, 2959, 2150, 1740, 1509,
1220, 1070, 863, 839, 762, 574 cm-1. HR-MS calculated for C14H18BrNO2Si [M+Na]+
m/z 362.0182, found 362.0193.
5-Bromo-6-methyl-1H-indole (11). To a freshly prepared, 0.7 M sodium ethoxide
solution (150 mL, 8.0 eq.) was added compound 10 (4.5 g, 13.3 mmol, 1.0 eq.) The
reaction was stirred at 80°C until all starting material was consumed and then the
solvent was removed under reduced pressure. The residue was dissolved in CH2Cl2
(50 mL) and washed with brine (3 × 50 mL). The organic fraction was dried (Na2SO4),
filtered and concentrated to afford the crude residue as a dark brown solid which was
purified via flash chromatography on a silica column (3:17 v/v EtOAc:Hexanes) to
afford the title compound as a yellow solid (2.48 g, 11.8 mmol, 88.8% yield). 1H NMR

47
(500 MHz, CDCl3) δ 8.03 (bs, NH), 7.88 (s, 1H), 7.26 (s, 1H), 7.16 (t, 1H), 6.52-6.48
(m, 1H), 2.54 (s, 3H). 13C NMR (125 MHz, CDCl3) δ 135.5, 131.0, 128.0, 125.0, 124.0,
116.7, 112.7, 102.1, 23.8. m.p. = 85-86 °C. IR (neat): 2916, 1738, 1614, 1577, 1506,
1467, 1415, 1315, 1270, 1241, 1202, 964, 881, 842, 761, 730, 692 cm-1. HR-MS
calculated for C9H8BrN [M+H]+ m/z 209.9918, found 209.9915.
5-Bromo-1,6-dimethyl-1H-indole (12). A flame-dried round-bottom flask was
charged with compound 11 (5.41 g, 25.8 mmol, 1.0 eq.) and anhydrous THF (50 mL).
The solution was cooled in an ice-bath and treated with NaH as a 60% dispersion in
mineral oil (1.24 g, 30.9 mmol, 1.2 eq.) and methyl iodide (3.2 mL, 51.5 mmol, 2.0 eq.).
After stirring at 0 °C for 2 hrs, the volatiles were removed under reduced pressure. The
residue was dissolved with CH2Cl2 (100 mL) and washed with brine (50 mL). The
organic fraction was (Na2SO4), filtered and concentrated to afford the crude product
which was purified via flash chromatography on a silica column (7:193 v/v
EtOAc:Hexanes) to afford the title compound as a yellow solid (4.56 g, 20.3 mmol,
79.1% yield). 1H NMR (500 MHz, Acetone-d6) δ 10.27 (bs, NH), 7.82 (s, 1H), 7.41 (s,
1H), 7.31 (dd, J = 3.2, 2.4 Hz, 1H), 6.45 (td, J = 2.1, 1.0 Hz, 1H), 2.48 (d, J = 0.8 Hz,
3H). 13C NMR (125 MHz, Acetone-d6) δ 136.1, 129.7, 128.5, 126.0, 123.5, 115.6,
113.2, 101.1, 23.1. m.p. = 90-91 °C. IR (neat): 33143118, 3095, 1467, 1338 1753,
1705, 1614, 1507, 1468, 1270, 993, 881, 842, 730, 693, 606 cm-1. HR-MS calculated
for C10H10BrN [M+H]+ m/z 224.0075, found 224.0079.

48
Scheme B.3. Synthesis of FP1.
9-(1,6-dimethyl-1H-indol-5-yl)-14,14-dimethyl-2,3,5,6,7,14-hexahydro-1H,12H-
benzo[5,6]silino[2,3-f]pyrido[3,2,1-ij]quinolin-12-one (13). A solution of compound
12 (2.77 g, 12.4 mmol, 8.0 eq.) in 25 mL anhydrous THF was cooled to -78 °C and
treated with a solution of tert-butyllithium in pentane (7.27 mL, 12.4 mmol, 8.0 eq.)
which was added dropwise. The reaction was stirred at the same temperature for 8
min and then treated with a solution of compound 6 (556 mg, 1.5 mmol, 1.0 eq.) in
anhydrous THF (15 mL). The reaction was warmed to room temperature and stirred
for 3 hrs. The reaction was quenched by the addition of 10% aq. HCl (10 mL) and
stirred at room temperature for 1 hr. The reaction was poured into sat. NaHCO3 (25
mL) and extracted with CH2Cl2 (3 × 50 mL). The combined organic fractions were dried
(Na2SO4), filtered, and concentrated under reduced pressure. The crude residue was
eluted through a silica plug and concentrated to afford a blue film which was used
without further purification. A solution of this intermediate in 20 mL anhydrous CH2Cl2

49
was cooled to 0 °C and treated with a solution of 1 M BBr3 in CH2Cl2 (2.6 mL, 2.6
mmol, 6.0 eq.) which was added dropwise. The reaction was warmed to room
temperature, stirred for 2 hrs, and then quenched by addition of sat. NaHCO3 (100
mL) and extracted with CH2Cl2 (3 × 50 mL). The combined organic fractions were dried
(Na2SO4), filtered, and concentrated under reduced pressure. The crude residue was
purified by flash chromatography on a silica column (8:92 v/v MeOH/CH2Cl2) to afford
the title compound as a blue film (45 mg, 0.1 mmol, 10% yield over two-steps
beginning from compound 6). 1H NMR (500 MHz, CDCl3) δ 7.30 (s, 1H), 7.23 (s, 1H),
7.08 (d, J = 3.1 Hz, 1H), 6.88 (d, J = 2.3 Hz, 1H), 6.84 (d, J = 9.9 Hz, 1H), 6.57 (s, 1H),
6.44 (d, J = 3.1 Hz, 1H), 6.20 (dd, J = 9.9, 2.3 Hz, 1H), 3.85 (s, 3H), 3.35 (t, J = 5.9
Hz, 2H), 3.30 (dt, J = 5.7, 2.9 Hz, 2H), 2.94 (t, J = 6.3 Hz, 2H), 2.41 (t, J = 6.2 Hz, 2H),
2.18 (s, 3H), 2.05 (q, J = 5.5 Hz, 2H), 1.84 (q, J = 6.1 Hz, 2H), 0.56 (d, J = 5.7 Hz, 6H).
13C NMR (125 MHz, CDCl3) δ 183.4, 162.3, 148.1, 145.5, 142.2, 136.9, 136.7, 136.1,
133.9, 132.3, 130.1, 129.2, 129.2, 128.7, 127.3, 126.2, 125.6, 122.0, 121.6, 109.9,
109.9, 100.8, 50.9, 50.3, 33.1, 29.9, 29.2, 28.1, 21.7, 21.2, 20.4, 0.0. IR (neat): 2924,
1612, 1578, 1509, 1228, 1210, 833, 765, 677, 556, 469 cm-1. HR-MS calculated for
C31H33N2OSi [M+H]+ m/z 477.2362, found 477.2365
5-(14,14-dimethyl-12-oxo-2,3,6,7,12,14-hexahydro-1H,5H-benzo[5,6]silino[2,3-
f]pyrido[3,2,1-ij]quinolin-9-yl)-1,6-dimethyl-1H-indole-3-carbaldehyde (14).
Anhydrous DMF (3.0 mL) was cooled in an ice-bath and treated with dropwise addition
of POCl3 (10 uL, 0.11 mmol, 1.5 eq.). After 30 min, a solution of compound 13 (32 mg,

50
0.07 mmol, 1.0 eq.) in anhydrous DMF (2.0 mL) was added. The reaction was stirred
0 °C for 1 hr. The reaction was then syringed into a second reaction vessel where
anhydrous DMF (3.0 mL) was cooled in an ice-bath and treated with dropwise addition
of POCl3 (10 uL, 0.11 mmol, 1.5 eq.). After 30 min, reaction was treated with additional
POCl3 (10 uL, 0.11 mmol, 1.5 eq.) and stirred for 3 hrs. The reaction was poured in
NaHCO3 (50 mL) and extracted wit EtOAc (4 × 30 mL). The combined organic fractions
were dried (Na2SO4), filtered and concentrated under reduced pressure. The crude
residue was purified by flash chromatography on a silica column (1:33 v/v
MeOH/CH2Cl2) to afford the title compound as a dark blue film (30 mg, 0.06 mmol,
89.0 % yield). 1H NMR (500 MHz, CDCl3) δ 9.96 (s, 1H), 7.99 (s, 1H), 7.73 (s, 1H),
7.28 (s, 1H), 6.86 (d, J = 2.3 Hz, 1H), 6.72 (dd, J = 9.9, 0.8 Hz, 1H), 6.43 (s, 1H), 6.17
(dd, J = 10.0, 2.3 Hz, 1H), 3.94 (s, 3H), 3.31 (dt, J = 27.4, 5.9 Hz, 4H), 2.93 (dd, J =
7.4, 5.1 Hz, 2H), 2.39 (dd, J = 7.3, 5.2 Hz, 2H), 2.21 (s, 3H), 2.10–2.01 (m, 2H), 1.83
(p, J = 6.2 Hz, 2H), 0.55 (s, 6H). 13C NMR (125 MHz, CDCl3) δ 184.5, 183.8, 183.3,
147.9, 145.3, 141.6, 139.6, 138.0, 136.2, 135.6, 134.4, 132.9, 128.6, 128.2, 126.9,
126.0, 123.2, 122.6, 121.9, 118.2, 110.7, 50.8, 50.2, 34.0, 29.9, 29.2, 28.1, 21.7, 21.2,
20.5, 0.1, -0.1. IR (neat): 2927, 1737, 1574, 1353, 1301, 1203 cm-1. HR-MS calculated
for C32H32N2O2Si [M+H]+ m/z 505.2311, found 505.2319.
9-(3-(1-aminobut-3-en-1-yl)-1,6-dimethyl-1H-indol-5-yl)-14,14-dimethyl-
2,3,5,6,7,14-hexahydro-1H,12H-benzo[5,6]silino[2,3-f]pyrido[3,2,1-ij]quinolin-12-
one (15). Potassium allyltrifluoroborate (17.6 mg, 0.12 mmol, 2.0 eq.) was dissolved

51
in a 7N solution of NH3 in MeOH (3.0 mL) and stirred at room temperature for 15 min.
A solution of compound 14 (9 mg, 0.016 mmol, 1 eq.) in 7N solution of NH3 in MeOH
(2.0 mL) and H2O (10 µL) were added sequentially to the reaction which was stirred
for 16 hrs. The reaction was poured into sat. NaHCO3 (50 mL) and extracted with
EtOAc (4 × 30 mL). The combined organic fractions were dried (Na2SO4), filtered, and
concentrated under reduced pressure. The crude residue was purified by flash
chromatography on a silica column (1:19 v/v MeOH/CH2Cl2) to afford the title
compound as a dark blue film (24 mg, 0.014 mmol, 74.5% yield). 1H NMR (500 MHz,
MeOD/CDCl3) δ 7.24 (dd, J = 11.3, 8.6 Hz, 2H), 7.19 (s, 1H), 6.85–6.80 (m, 2H), 6.55
(d, J = 3.6 Hz, 1H), 6.15 (ddd, J = 10.1, 8.0, 2.4 Hz, 1H), 5.75–5.63 (m, 1H), 5.17–4.99
(m, 2H), 4.38 (td, J = 7.0, 4.7 Hz, 1H), 3.83 (s, 3H), 3.40 (t, J = 5.9 Hz, 2H), 3.35 (t, J
= 6.1 Hz, 2H), 2.94 (t, J = 6.2 Hz, 2H), 2.74–2.66 (m, 1H), 2.61 (dd, J = 14.2, 7.2 Hz,
1H), 2.43–2.31 (m, 2H), 2.14 (s, 3H), 2.09–1.98 (m, 2H), 1.88–1.78 (m, 2H), 0.55 (s,
6H). 13C NMR (125 MHz, CDCl3) δ 184.4, 147.9, 144.8, 142.0, 137.4, 136.1, 136.0,
135.5, 134.7, 132.0, 131.1, 130.4, 129.0, 128.4, 127.2, 126.2, 125.7, 121.9, 119.9,
117.7, 110.0, 50.7, 50.2, 48.0, 43.7, 43.5, 33.0, 29.9, 29.2, 28.2, 21.8, 21.3, 20.4, 0.2,
0.0. IR (neat): 3012, 2972, 1739, 1585, 1366, 1231, 834, 765 cm-1. HR-MS calculated
for C35H39N3OSi [M+H]+ m/z 546.2941, found 546.2947.
FP1. A solution of compound 15 (120.0 mg, 0.22 mmol, 1.0 eq.) in anhydrous THF
(10.0 mL) was cooled in an ice-bath. To the solution, 4-nitrobenzaldehyde (100 mg,
0.66 mmol, 3.0 eq.), glacial AcOH (100 µL, 1.6 mmol, 10 eq.), and sodium

52
triacetoxyborohydride (186 mg, 0.88 mmol, 4.0 eq.) were added sequentially. The
reaction was warmed to room temperature and stirred for 16 hrs. Upon completion,
the reaction was poured into sat. NaHCO3 (50 mL) and extracted with EtOAc (4 × 30
mL). The combined organic fractions were dried (Na2SO4), filtered, and concentrated
under reduced pressure. The crude residue was purified by flash chromatography on
a silica column (1:33 MeOH/CH2Cl2) to afford the title compound as a dark blue film.
(32.0 mg, 0.057 mmol, 26.0 % yield). 1H NMR (500 MHz, CDCl3) δ 8.40 (d, J = 7.8 Hz,
1H), 8.20 (d, J = 8.7 Hz, 2H), 7.87 (dd, J = 8.6, 6.1 Hz, 2H), 7.38 (d, J = 51.2 Hz, 1H),
7.22 (s, 1H), 7.14 (d, J = 23.1 Hz, 1H), 6.88 (dd, J = 4.7, 2.3 Hz, 1H), 6.83 (dd, J =
22.0, 10.0 Hz, 1H), 6.53 (d, J = 50.1 Hz, 1H), 6.18 (ddd, J = 26.9, 9.9, 2.3 Hz, 1H),
5.79 (ddtd, J = 17.3, 10.1, 7.1, 4.5 Hz, 1H), 5.11–4.96 (m, 2H), 4.77 (td, J = 8.3, 5.5
Hz, 1H), 3.84 (d, J = 5.3 Hz, 3H), 3.43–3.33 (m, 2H), 3.3–3.21 (m, 2H), 2.96 (dt, J =
12.4, 5.9 Hz, 2H), 2.90–2.77 (m, 2H), 2.47–2.30 (m, 2H), 2.18 (d, J = 4.6 Hz, 3H),
2.14–2.02 (m, 2H), 1.91–1.71 (m, 2H), 0.59 (d, J = 7.1 Hz, 3H), 0.56 (d, J = 1.8 Hz,
3H).13C NMR (125 MHz, CDCl3) δ 183.9, 157.8, 157.7, 149.0, 148.0, 145.1, 142.1,
142.0, 137.3, 136.3, 135.8, 135.74, 135.70, 135.6, 134.4, 132.3, 132.2, 130.6, 129.1,
128.6, 128.5, 127.2, 126.6, 126.5, 126.0, 125.9, 124.5, 124.2, 123.97, 123.93, 121.9,
121.8, 120.5, 120.1, 117.7, 117.5, 116.6, 116.1, 110.25, 110.21, 68.1, 67.7, 50.8, 50.7,
50.29, 50.25, 42.2, 41.6, 33.16, 33.13, 29.9, 29.2, 29.2, 28.18, 28.10, 21.7, 21.28,
21.21, 20.5, 20.4, 0.15, 0.13, 0.06, 0.04. IR: 2925, 1737, 1571, 1347, 1301, 1204 cm-
1. HR-MS calculated for C42H44N4O3Si [M+H]+ m/z 681.3261, found 681.3272.
53
APPENDIX C-SUPPLEMENTARY FIGURES FOR CHAPTER 1
This appendix includes supplementary figures including 1H and 13C NMR
spectrum for the compounds synthesized in Chapter 1.
Figure C.1. Photobleaching assay of FP1 in live cells. HEK293TN cells were stained
with a solution of 2 µM FP1 in DMEM for 8 min, rinsed with fresh DMEM. After 30 min,
a field of cells were subjected to irradiation for 100 scans with the 633 nm HeNe laser
set at 25% power with a pinhole size of 1 airy unit. A data point is plotted for every 5
scans.

54
Figure C.2. Normalized fluorescence emission of 1 µM FP1 in PBS (pH 7.4) reacted
with a) 0.1 mM, b) 0.25 mM, c) 0.5 mM, d) 1 mM, and e) 5 mM FA. FP1 was excited
at 633 nm and the emission was collect between 640 and 750 nm. All experiments
were performed at 37 °C for 3 h. Time points on graphs a-c are recorded every 15
min. The time points for graphs d-e represent every 30 min. A concentration
dependent increase in fluorescence intensity was observed with a fold increase of 3.9,
7.0, 8.5, 11.6, and 33.5 for 0.1 mM, 0.25 mM, 0.5 mM, 1 mM, and 5 mM FA,
respectively.

55
Figure C.3. Live-cell imaging of HEK293TN cells. Cells were stained with a solution
of 2 µM FP1 in serum-free DMEM for 8 min, washed with fresh DMEM to remove
excess dye and then incubated with 1, 2.5, or 5 mM FA at 37 °C for 1, 2, and 3 h. Cells
were irradiated with the 633 nm HeNe laser set at 3% power with a pinhole size of 1
airy unit. The emission was collected between 645 and 800 nm. Scale bar represents
20 µm.

56
Figure C.4. Quantification of observed fluorescence intensity by confocal imaging in
HEK293TN cells after incubation with 1 mM, 2.5 mM or 5 mM FA for 1 (light grey bars),
2 (red bars) and 3 hrs (blue bars). A DMEM vehicle was added to control cells which
was normalized to 1 (white bars). Cells incubated with 1 mM FA for 1, 2 and 3 hrs
exhibited a 1.2-, 1.3-, and 1.6-fold increase in fluorescence intensity, respectively.
Cells incubated with 2.5 mM FA for 1, 2 and 3 hrs resulted in a 1.2-, 1.7-, and 2.2-fold
increase in fluorescence intensity, respectively. Cells incubated with 5 mM FA for 1, 2
and 3 hrs resulted in a 2.1-, 2.6-, and 2.8-fold increase in fluorescence intensity,
respectively. For each condition, a minimum of 5 images were averaged (n > 5). Errors
represent standard deviation.

57
Figure C.5. Live-cell imaging of NC cells. Cells were stained with a solution of 2 µM
FP1 in Ham’s F-12K serum-free media for 8 min, washed with fresh media to remove
excess dye and then incubated with 1, 2.5, or 5 mM FA at 37 °C for 1, 2, and 3 hrs.
Cells were irradiated with the 633 nm HeNe laser set at 3% power with a pinhole size
of 1 airy unit. The emission was collected between 645 and 800 nm. Scale bar
represents 20 µm.

58
Figure C.6. Quantification of observed fluorescence intensity by confocal imaging in
NC cells after incubation with 1 mM, 2.5 mM or 5 mM FA for 1 (light grey bars), 2 (red
bars) and 3 h (blue bars). A Ham’s F-12K vehicle was added to control cells which
was normalized to 1 (white bars). Cells incubated with 1 mM FA for 1, 2 and 3 hrs
exhibited a 0-, 1.1-, and 1.6-fold increase in fluorescence intensity, respectively. Cells
incubated with 2.5 mM FA for 1, 2 and 3 hrs resulted in a 1.3-, 1.5-, and 2.0-fold
increase in fluorescence intensity, respectively. Cells incubated with 5 mM FA for 1, 2
and 3 hrs resulted in a 1.8-, 2.0-, and 2.3-fold increase in fluorescence intensity,
respectively. For each condition, a minimum of 5 images were averaged (n > 5). Errors
represent standard deviation.
59
Figure C.7. ESI-HRMS spectrum of a crude reaction mixture after FP1 (25 µM) was
reacted with 5 mM FA at 37 °C for 48 h in the presence of HEK293TN cellular lysates
to yield compound 14. HR-MS calculated for C32H32N2O2Si [M+H]+ m/z 505.2311,
found 505.2306.

60
Figure C.8. Trypan blue dye exclusion assay to determine cell viability of a)
HEK293TN cells and b) NS-1 cells treated with FA. Both cell lines were treated 1 mM,
2.5 mM and 5 mM FA for 1, 2 and 3 hrs. For each condition, a 10 µL sample of cells
was mixed with 10 µL of a 2× trypan blue solution. Live and dead cells were counted
at each of the four 4×4 quadrants of a hemocytometer using a light microscope
equipped with a 10× objective. Control samples treated with a vehicle control were
normalized to 100% viability.

61
Figure C.9. Nuclear staining of HEK293TN cells with DAPI demonstrates cell viability
by showing intact nuclei after FP1 stained cells were treatment with 5 mM FA for 3
hrs. DAPI was applied as a 300 nM solution in serum-free DMEM for 5 min. Left:
Fluorescent signal from FP1 obtained by irradiation with the 633 nm HeNe laser.
Middle: Fluorescent signal from DAPI obtained by irradiation with the 405 nm laser
line. Right: Merged image of both signals. Scale bar represents 20 µm.

62
Figure C.10. Confocal microscopy images of co-localization experiments using
HEK293TN cells. Cells were co-incubated for 5 min with 2 µM FPI and 1 µM of each
tracker in serum-free DMEM, then washed with dye-free DMEM and imaged. Top row
of images show fluorescent signal from FP1 obtained by irradiation with the 633 nm
HeNe laser. Bottom row of images show fluorescent signal from ER-Tracker Green,
LysoTracker, and MitoTracker Green FM obtained by irradiation with the 488 nm laser.
Scale bar represents 20 um.

63
Figure C.11. Confocal microscopy images of co-localization experiments using NC
cells. Cells were co-incubated for 5 min with 2 µM FPI and 1 µM of each tracker in
serum-free DMEM, then washed with dye-free DMEM and imaged. Top row of images
show fluorescent signal from FP1 obtained by irradiation with the 633 nm HeNe laser.
Bottom row of images show fluorescent signal from ER-Tracker Green, LysoTracker,
and MitoTracker Green FM obtained by irradiation with the 488 nm laser. Scale bar
represents 20 um.

64
Figure C.12. Flow cytometry analysis of HEK293TN cells. Cells were stained with a
solution of 2 µM FP1 in DMEM for 8 min, rinsed with fresh DMEM and then treated
with a) a DMEM vehicle control; b) 1 mM FA, 1 hr incubation; c) 1 mM FA, 2 hrs
incubation; d) 1 mM FA, 3 hrs incubation; e) a DMEM vehicle control; f) 2.5 mM FA, 1
hr incubation; g) 2.5 mM FA, 2 hrs incubation; h) 2.5 mM FA, 3 hrs incubation; i) a
DMEM vehicle control; j) 5 mM FA, 1 hr incubation; k) 5 mM FA, 2 hrs incubation; and
l) 5 mM FA, 3 hrs incubation.
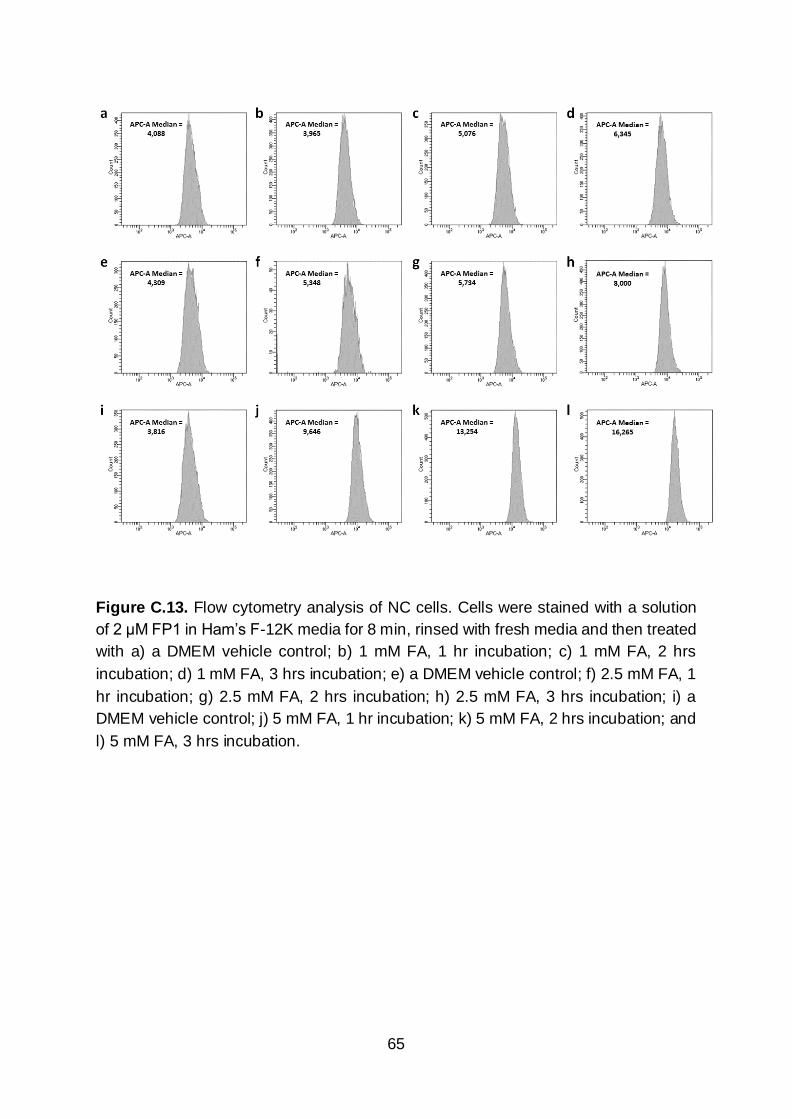
65
Figure C.13. Flow cytometry analysis of NC cells. Cells were stained with a solution
of 2 µM FP1 in Ham’s F-12K media for 8 min, rinsed with fresh media and then treated
with a) a DMEM vehicle control; b) 1 mM FA, 1 hr incubation; c) 1 mM FA, 2 hrs
incubation; d) 1 mM FA, 3 hrs incubation; e) a DMEM vehicle control; f) 2.5 mM FA, 1
hr incubation; g) 2.5 mM FA, 2 hrs incubation; h) 2.5 mM FA, 3 hrs incubation; i) a
DMEM vehicle control; j) 5 mM FA, 1 hr incubation; k) 5 mM FA, 2 hrs incubation; and
l) 5 mM FA, 3 hrs incubation.

66
Figure C.14. 1H NMR (500 MHz, CDCl3) and 13C NMR (125 MHz, CDCl3) NMR
spectra of 2.

67
Figure C.15. 1H NMR (500 MHz, CDCl3) and 13C NMR (125 MHz, CDCl3) NMR
spectra of 4.
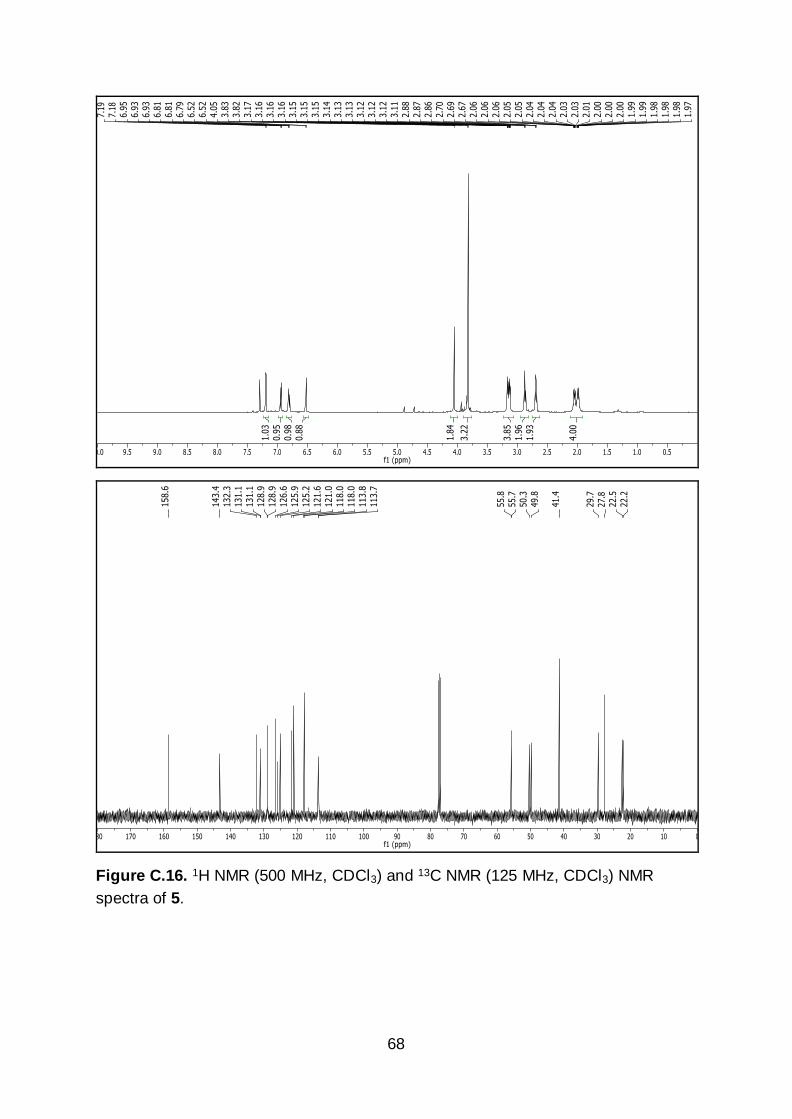
68
Figure C.16. 1H NMR (500 MHz, CDCl3) and 13C NMR (125 MHz, CDCl3) NMR
spectra of 5.

69
Figure C.17. 1H NMR (500 MHz, CDCl3) and 13C NMR (125 MHz, CDCl3) NMR
spectra of 5.5.

70
Figure C.18. 1H NMR (500 MHz, CDCl3) and 13C NMR (125 MHz, CDCl3) NMR
spectra of 6.
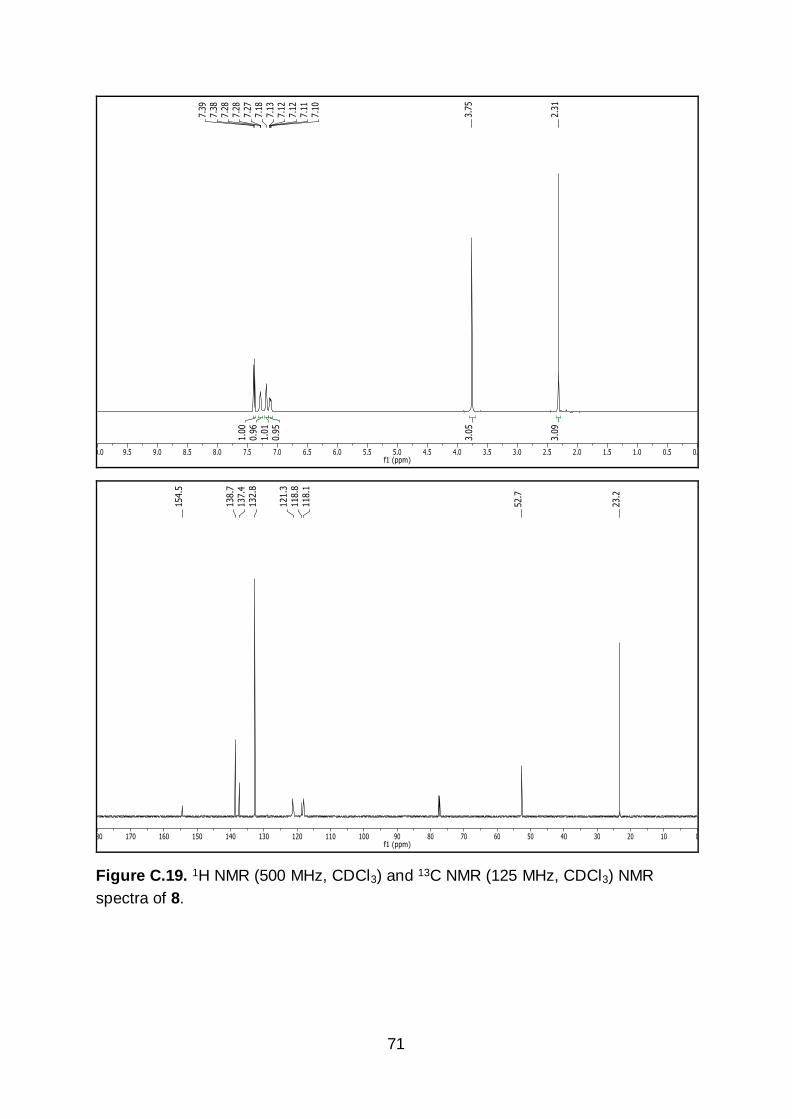
71
Figure C.19. 1H NMR (500 MHz, CDCl3) and 13C NMR (125 MHz, CDCl3) NMR
spectra of 8.
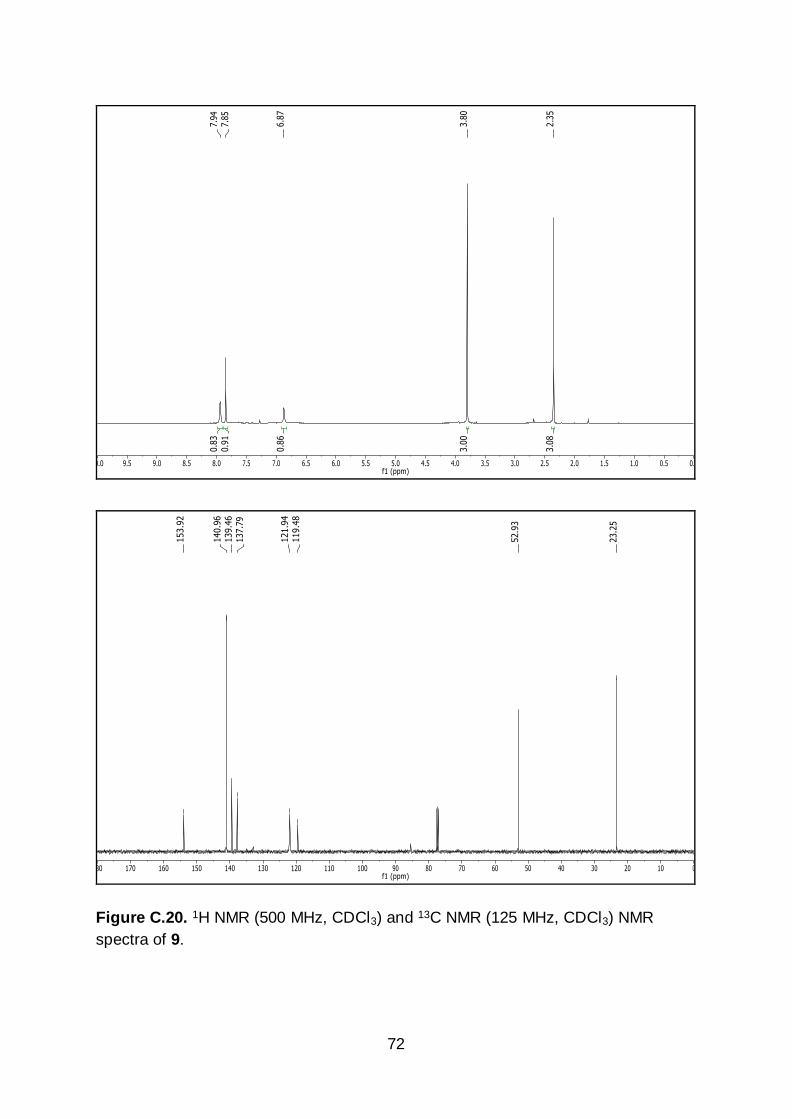
72
Figure C.20. 1H NMR (500 MHz, CDCl3) and 13C NMR (125 MHz, CDCl3) NMR
spectra of 9.

73
Figure C.21. 1H NMR (500 MHz, CDCl3) and 13C NMR (125 MHz, CDCl3) NMR spectra
of 10.

74
Figure C.22. 1H NMR (500 MHz, CDCl3) and 13C NMR (125 MHz, CDCl3) NMR spectra
of 11.

75
Figure C.23. 1H NMR (500 MHz, Acetone-d6) and 13C NMR (125 MHz, Acetone-d6)
NMR spectra of 12.
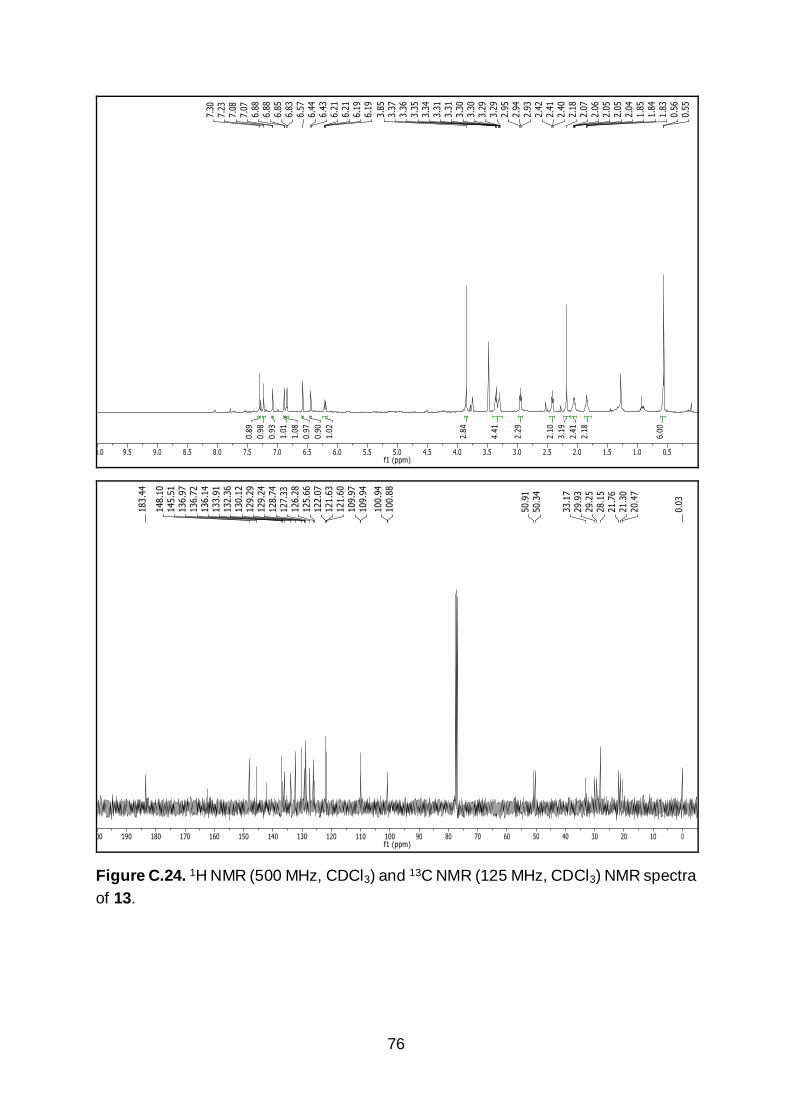
76
Figure C.24. 1H NMR (500 MHz, CDCl3) and 13C NMR (125 MHz, CDCl3) NMR spectra
of 13.

77
Figure C.25. 1H NMR (500 MHz, CDCl3) and 13C NMR (125 MHz, CDCl3) NMR
spectra of 14.

78
Figure C.26. 1H NMR (500 MHz, CDCl3/MeOD) and 13C NMR (125 MHz, CDCl3) NMR
spectra of 15.

79
Figure C.27. 1H NMR (500 MHz, CDCl3) and 13C NMR (125 MHz, CDCl3) NMR spectra
of FP1.

80
APPENDIX D-MATERIAL AND METHODS FOR CHAPTER 2
This appendix includes information about the source of materials as well as
spectroscopic methods used for Chapter 2.
D.1 Materials
Thin-layer chromatography (TLC) was performed on glass-backed TLC plates
pre-coated with silica gel containing an UV254 fluorescent indicator (Macherey-Nagel).
Compounds were visualized with a 254/365nm, handheld UV lamp (UVP). Flash
chromatography was performed using 230-400 mesh silica gel P60 (SiliCycle Inc).
Preparative TLC purification was performed on 1.00 mm thick TLC plates pre-coated
with silica gel containing an UV254 fluorescent indicator (Macherey-Nagel). Reversed-
phased purification was performed on 20 cc Sep-Pak cartridges preloaded with 5g
C18 sorbent (H2Os). Solvents used for anhydrous reactions were dried over 3 Å
molecular sieves activated via heating under vacuum at 300 °C. All glassware used in
anhydrous reactions were flame-dried or heated overnight in an oven at 160 °C and
cooled immediately prior to use. Melting point determination was performed on a Büchi
B-545 melting point apparatus.
Copper(II) chloride was purchased from Acros. 4-Hydroxyacetophenone, 4-
hydroxybenzaldehyde, picolinic acid were purchased from AK Scientific.
Magnesium(II) chloride hexahydrate was purchased from Amresco. Kolliphor EL was
purchased from Fluka. Nirtomethane was purchased from Macron. Cobalt(II) chloride
hexahydrate was purchased from Mallinckrodt. Acetic acid, acetyl chloride,
ammonium acetate, calcium chloride, cesium carbonate, citric acid, 2,6-

81
dichlorophenol, N,N-diisopropylethylamine, 4-dimethylaminopyridine, 1-ethyl-3-(3-
dimethylaminopropyl)carbodiimide, imidazole, potassium carbonate, manganese(II)
chloride hexahydrate, potassium hydroxide, sulfur trioxide trimethylamine complex,
tert-butyldimethylsilyl chloride, tetrakis(triphenylphosphine)palladium(0), and
trimethylamine, and triflic acid were purchased from Oakwood Products. Allyl bromide,
benzaldehyde, boron trifluoride diethyl etherate, 1,3-dimethylbarbituric acid, iron(II)
chloride tetrahydrate, nickel(II) chloride hexahydrate, sodium bicarbonate, sodium
phosphate dibasic, tetrabutylammonium fluoride solution,
tetrakis(acetonitrile)copper(I) hexafluorophosphate, tosyl chloride, and zinc chloride
were purchased from Sigma-Aldrich. Triethylene glycol was purchased from TCI
America. Deuterated solvents were purchased from Cambridge Isotope Laboratories.
Agarose LE was purchased from Gold Biotechnology. Fluorinated ethylene propylene
(FEP) tubing with a wall thickness of 0.01” and inner diameters measuring 0.06” or
0.08” were purchased from McMaster-Carr.
All buffers used for pH titrations were prepared by mixing 0.1 M citric acid in
deionized H2O and 0.2 M dibasic sodium phosphate in deionized H2O at different
ratios. The solutions were diluted by ½ with deionized H2O. Fine adjustments to the pH
were made by addition of aqueous 0.1 M HCl or 0.1 M NaOH. The pH values were
determined using a Mettler Toledo SevenCompact pH meter calibrated using 4.0, 7.0
10.0 standard buffers at 25°C. The pH range of the buffers was 3.0 to 8.2. Kolliphor
EL was added to each buffer to make a 0.1% by weight solution.
82
Tissue phantoms were prepared by dissolving agarose (4.0 g) in a solution of
2% milk (8.0 mL) and deionized H2O (72.0 mL). The suspension was heated in a
microwave oven for 1 min to afford a viscous gel which was poured into a mold made
from a 50 mL centrifuge tube. The gel was cooled in a refrigerator for a minimum of 5
hrs. Immediately prior to use, the phantom was removed from the mold and cut with a
razor such that there was 1.0 cm of gel above and below where the FEP tubes were
inserted.
D.2 SPECTROSCOPIC METHODS
NMR spectra were recorded on Varian 400 or 500 MHz spectrometers at 25
°C. Chemical shifts are reported in ppm (δ) and are referenced to residual protic peaks.
The following abbreviations are used to describe coupling constants: singlet (s),
doublet (d), triplet (t), quartet (q), doublet doublet (dd), doublet triplet (dt), doublet
quartet (dq), doublet doublet triplet (ddt), multiplet (m), and broad singlet (bs). IR
spectra were recorded with a PerkinElmer Spectrum Two IR spectrometer. High-
resolution mass spectra were acquired with a H2Os Q-TOF Ultima ESI mass
spectrometer and a H2Os Synapt G2-Si ESI/LC-MS mass spectrometer. UV-visible
spectra were recorded on a Cary 60 spectrometer. Fluorescence spectra were
acquired on a QuantaMaster-400 scanning spectrofluorometer with micro
fluorescence quartz cuvettes (Science Outlet). Fluorescence images were acquired
on an EVOS FL epifluorescence microscope equipped with a Cy5 light cube.
Photoacoustic images were recorded with an Endra Nexus 128 photoacoustic

83
tomography system (Ann Arbor, MI, USA), and the data were analyzed as described
using MicroView v2.5.0-2703 (Parallax Innovations Inc).

84
APPENDIX E-SYNTHESES FOR CHAPTER 2
This appendix includes the detailed synthetic methods and spectroscopic
characterizations for compounds synthesized in Chapter 2.
Scheme E.1. Synthesis of APC-1.
2,6-Dichlorophenyl acetate (16). A solution of 2,6-dichlorophenol (9.1 g, 55.8 mmol,
1.0 equiv) and triethylamine (19.4 mL, 139.0 mmol, 2.5 equiv) in CH2Cl2 (100 mL) was
cooled to 0°C in an ice-bath. After acetyl chloride (4.8 mL, 67.0 mmol, 1.2 equiv) was
added dropwise, the solution was warmed to room temperature and stirred for 2.5 hrs.
The reaction was treated with sat. Na2CO3 (75 mL) and extracted with CH2Cl2 (3 × 25
mL). The combined organic fractions were dried (Na2SO4), filtered and concentrated

85
to afford the crude residue which was purified via flash chromatography on a silica
column (1:9 v/v EtOAc:Hexanes) to afford the title compound as a colorless oil (10.7
g, 52.5 mmol, 94.1% yield). 1H NMR (500 MHz, CDCl3) δ 7.35 (dd, J = 8.1, 1.4 Hz),
7.13 (ddd, J = 10.5, 7.3, 1.9 Hz, 1H), 2.39 (s, 3H). 13C NMR (125 MHz, CDCl3) δ 167.5,
144.3, 129.2, 128.9, 127.4, 20.5.
3,5-Dichloro-4-hydroxyacetophenone (17). A solution of 16 (10.7 g, 52.2 mmol, 1.0
equiv) and trifluoromethanesulfonic acid (20 mL) was stirred at 40°C for 16 hrs. The
reaction was cooled to 0°C in an ice-bath, treated with sat. Na2CO3 until the reaction
became neutral, and extracted with EtOAc (4 × 75 mL). The combined organic
fractions were dried (Na2SO4), filtered and concentrated to afford the crude residue
which was purified via flash chromatography on a silica column (1:3 v/v
EtOAc:Hexanes) to afford the title compound as a white solid (7.5 g, 36.6 mmol, 70.1%
yield). 1H NMR (500 MHz, DMSO-d6) δ 7.91 (s, 2H), 2.52 (s, 3H). 13C NMR (125 MHz,
DMSO-d6) δ 195.5, 154, 130.3, 129.5, 122.8, 27.1. m.p. = 162.5°C. HR-MS calculated
for C8H6Cl2O2 [M-H]+ m/z 204.9823, found 204.9819.
3',5'-Dichloro-4'-hydroxychalcone (18). A solution of 17 (6.35 g, 31.0 mmol, 1.0
equiv), benzaldehyde (3.8 mL, 37.2 mmol, 1.2 equiv) in MeOH (75 mL) was treated
with KOH (20% w/w in H2O, 17.4 mL) and stirred at room temperature for 24 hrs.
MeOH was removed under reduced pressure and the remaining aqueous solution was
acidified with AcOH. The reaction was extracted with EtOAc (4 × 25 mL). The
combined organic fractions were dried (Na2SO4), filtered and concentrated to afford
the crude residue which was purified via flash chromatography on a silica column (3:17

86
v/v EtOAc:Hexanes) to afford the title compound as an off-white solid (8.63 g, 29.4
mmol, 95.0% yield). 1H NMR (500 MHz, Acetone-d6) δ 8.17 (s, 2H), 7.93 (d, J = 15.6
Hz, 1H), 7.88–7.83 (m, 2H), 7.81 (d, J = 15.6 Hz, 1H), 7.49–7.43 (m, 3H). 13C NMR
(125 MHz, Acetone-d6) δ 205.6, 185.7, 153.2, 144.8, 135.2, 131.4, 130.8, 129.3,
129.1, 129.1, 129.1, 122.3, 121.2. m.p. = 163°C. HR-MS calculated for C15H10Cl2O2
[M-H]+ m/z 293.0136, found 293.0142.
1-(3,5-Dichloro-4-hydroxyphenyl)-4-nitro-3-phenylbutan-1-one (19). A solution of
18 (8.6 g, 29.4 mmol, 1.0 equiv) in EtOH (50 mL) was treated with MeNO2 (16.0 mL,
298.8 mmol, 10.2 equiv) and KOH (20% w/w in H2O, 10.0 mL). The reaction was
refluxed for 12 hrs. EtOH was removed with reduced pressure and the resultant
aqueous solution was diluted with brine (100 mL) and extracted with EtOAc (4 × 25
mL). The combined organic fractions were dried (Na2SO4), filtered and concentrated
to afford the crude residue which was purified via flash chromatography on a silica
column (3:17 v/v EtOAc:Hexanes) to afford the title compound as a tan oil (5.1 g, 14.2
mmol, 50.5% yield). 1H NMR (500 MHz, CDCl3) δ 7.84 (s, 2H), 7.36–7.28 (m, 5H),
4.82 (dd, J = 12.6, 6.8Hz, 1 H), 4.70 (dd, J = 12.5, 7.8 Hz, 1H) 4.21 (p, J = 7.1 Hz, 1H),
3.44-3.34 (m, 2H). 13C NMR (125 MHz, CDCl3) δ 193.9, 152.5, 139.0, 130.1, 129.4,
128.8, 128.3, 127.7, 121.9, 79.7, 41.4, 39.5. HR-MS calculated for C16H13Cl2NO4 [M-
H]+ m/z 354.0300, found 354.0302.
(Z)-2,6-dichloro-4-(5-((3,5-diphenyl-2H-pyrrol-2-ylidene)amino)-4-phenyl-1H-
pyrrol-2-yl)phenol (20). A solution of 19 (600 mg, 1.7 mmol, 1.0 equiv) and chalcone
(1.4 g, 5.1 mmol, 3.0 equiv) was dissolved in n-butanol (15 mL). Ammonium acetate

87
(2.0 g, 25.4 mmol, 15.0 equiv) was added and the reaction was stirred at 115°C for 3
hrs. Volatiles were removed under reduced pressure. The crude residue suspended
in brine (100 mL) and extracted with EtOAc (3 × 15 mL). The combined organic
fractions were dried (Na2SO4), filtered and concentrated to afford the crude residue
which was purified via flash chromatography on a silica column (3:7 v/v
CH2Cl2:Hexanes to 100% CH2Cl2) to afford the title compound as a dark blue film (320
mg, 0.6 mmol, 35.3% yield). 1H NMR (500 MHz, DMSO-d6) δ 8.18 (s, 2H), 8.06–8.05
(m, 4H), 7.96 (d, J = 7.7 Hz, 1H), 7.54 (t, J = 7.6 Hz, 1H), 7.50-7.33 (m, 6H). 13C NMR
(125 MHz, DMSO-d6) δ 133.4, 130.2, 129.0, 128.9, 128.9, 128.8, 128.8, 128.6, 128.5,
128.4, 128.2, 128.0, 127.8, 127.8, 127.7, 126.7, 125.1, 110.0.
3,5-Dichloro-4-hydroxy-aza-BODIPY (21). A solution of 20 (128 mg, 0.24 mmol, 1.0
equiv) in anhydrous CH2Cl2 (15 mL) was treated with anhydrous DIPEA (0.6 mL, 2.4
mmol, 10.0 equiv) and boron trifluoride etherate (0.45 mL, 3.6 mmol, 15 equiv). The
solution was stirred at room temperature for 3 hrs and concentrated under reduced
pressure. The crude residue was purified via flash chromatography on a silica column
(1:1 v/v CH2Cl2:Hexanes) to afford the title compound as a dark green film (118.6 mg,
0.2 mmol, 85.1%). 1H NMR (500 MHz, DMSO-d6) δ 8.19 (s, 2H), 8.13–8.07 (m, 6H),
7.68 (s, 1H), 7.55–7.42 (m, 10H). 13C NMR (125 MHz, acetone-d6) δ 158.8, 156.6,
153.2, 145.8, 145.3, 143.8, 143.3, 132.4, 132.2, 131.8, 131.7, 130.8, 130.5, 130.4,
130.2, 129.9, 129.9, 129.4, 123.3, 123.2, 121.1, 120.7. HR-MS calculated for
C32H20BCl2F2N3O [M-H]+ m/z 582.1123, found 582.1129.
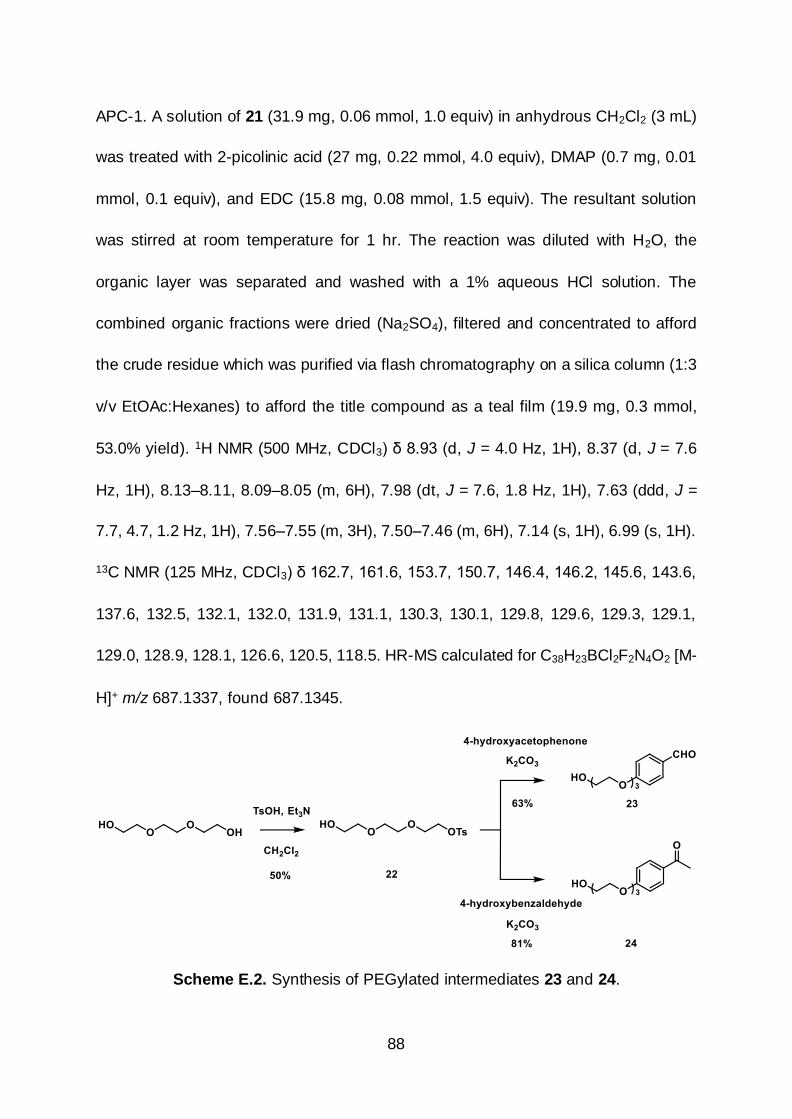
88
APC-1. A solution of 21 (31.9 mg, 0.06 mmol, 1.0 equiv) in anhydrous CH2Cl2 (3 mL)
was treated with 2-picolinic acid (27 mg, 0.22 mmol, 4.0 equiv), DMAP (0.7 mg, 0.01
mmol, 0.1 equiv), and EDC (15.8 mg, 0.08 mmol, 1.5 equiv). The resultant solution
was stirred at room temperature for 1 hr. The reaction was diluted with H2O, the
organic layer was separated and washed with a 1% aqueous HCl solution. The
combined organic fractions were dried (Na2SO4), filtered and concentrated to afford
the crude residue which was purified via flash chromatography on a silica column (1:3
v/v EtOAc:Hexanes) to afford the title compound as a teal film (19.9 mg, 0.3 mmol,
53.0% yield). 1H NMR (500 MHz, CDCl3) δ 8.93 (d, J = 4.0 Hz, 1H), 8.37 (d, J = 7.6
Hz, 1H), 8.13–8.11, 8.09–8.05 (m, 6H), 7.98 (dt, J = 7.6, 1.8 Hz, 1H), 7.63 (ddd, J =
7.7, 4.7, 1.2 Hz, 1H), 7.56–7.55 (m, 3H), 7.50–7.46 (m, 6H), 7.14 (s, 1H), 6.99 (s, 1H).
13C NMR (125 MHz, CDCl3) δ 162.7, 161.6, 153.7, 150.7, 146.4, 146.2, 145.6, 143.6,
137.6, 132.5, 132.1, 132.0, 131.9, 131.1, 130.3, 130.1, 129.8, 129.6, 129.3, 129.1,
129.0, 128.9, 128.1, 126.6, 120.5, 118.5. HR-MS calculated for C38H23BCl2F2N4O2 [M-
H]+ m/z 687.1337, found 687.1345.
Scheme E.2. Synthesis of PEGylated intermediates 23 and 24.
89
2-(2-(2-Hydroxyethoxy)ethoxy)ethyl 4-methylbenzenesulfonate (22). A solution of
triethylene glycol (11 g, 73.3 mmol, 4.1 equiv), triethylamine (2.6 mL, 19.1 mmol, 1.1
equiv), DMAP (45 mg, 0.37 mmol, 0.02 equiv), and CH2Cl2 (95 mL) was cooled to 0°C
in an ice-bath and treated with tosyl chloride (3.5 g, 18.1 mmol, 1.0 equiv). After 4.5
hrs, 1 N HCl aqueous solution (100 mL) was added, the organic layer was separated
and washed sequentially with H2O (100 mL) and brine (100 mL). The combined
organic fractions were dried (Na2SO4), filtered and concentrated to afford the crude
residue which was purified via flash chromatography on a silica column (3:1 v/v
EtOAc:Hexanes) to afford the title compound as a colorless oil (2.74 g, 9.0 mmol,
49.7% yield). 1H NMR (500 MHz, CDCl3) δ 7.82 (d, J = 8.2 Hz, 2H), 7.36 (d, J = 8.4
Hz, 2H), 4.20–4.18 (m, 2 H), 3.83–3.73 (m, 4H), 3.63 (s, 4H), 3.60–3.58 (m, 2H), 2.47
(s, 3H). 13C NMR (125 MHz, CDCl3) δ 145.1, 133.2, 130.1, 128.2, 72.7, 71.0, 70.6,
69.4, 69.0, 62.0, 21.9.
4-(2-(2-(2-Hydroxyethoxy)ethoxy)ethoxy)benzaldehyde (23). A round-bottom flask
was charged with 22 (24.4 g, 80.0 mmol, 1.0 equiv), 4-hydroxybenzaldehyde (12.7 g,
104.0 mmol, 1.3 equiv), K2CO3 (22.1 g, 160.0 mmol, 2.0 equiv) and anhydrous DMF
(50.0 mL). After stirring at 80°C overnight, the reaction was cooled to room
temperature and the volatiles were removed under reduced pressure. The resulting
mixture was washed with brine (100 mL), H2O (100 mL) and extracted with 1:2 v/v
isopropanol:CH2Cl2 (3 × 100 mL). The combined organic fractions were dried
(Na2SO4), filtered, and concentrated under reduced pressure to afford the crude
compound as a red oil which was purified via flash chromatography on a silica column

90
(3:1 v/v EtOAc:Hexanes) to afford the title compound as a colorless oil (13.3 g, 52.2
mmol, 65.3% yield). 1H NMR (400 MHz, CDCl3) δ 9.83 (s, 1H), 7.80–7.76 (m, 2H),
7.00–6.96 (m, 2H), 4.21–4.15 (m, 2H), 3.89–3.81 (m, 2H), 3.74–3.63 (m, 6H), 3.60–
3.54 (m, 2H). 13C NMR (100 MHz, CDCl3) δ 191.1, 163.9, 132.2, 130.2, 115.1, 72.7,
71.0, 70.5, 69.6, 67.9, 61.9.
1-(4-(2-(2-(2-hydroxyethoxy)ethoxy)ethoxy)phenyl)ethan-1-one (24). A round-
bottom flask was charged with 22 (12.2 g, 40.0 mmol, 1.0 equiv), 4-
hydroxyacetophenone (7.08 g, 52.0 mmol, 1.3 equiv), K2CO3 (11.1 g, 80.0 mmol, 2.0
equiv) and anhydrous DMF (50.0 mL). After stirring at 80°C overnight, the reaction
cooled to room temperature and the volatiles were removed under reduced pressure.
The resulting mixture was washed with brine (100 mL), H2O (100 mL) and extracted
with 1:2 v/v isopropanol:CH2Cl2 (3 × 100 mL). The combined organic fractions were
dried (Na2SO4), filtered, and concentrated under reduced pressure to afford the crude
compound which was purified via flash chromatography on a silica column (3:1 v/v
EtOAc:Hexanes) to afford the title compound as a colorless oil (8.7 g, 32.2 mmol,
80.5% yield). 1H NMR (400 MHz, CDCl3) δ 9.83 (s, 1H), 7.80–7.76 (m, 2H), 7.00–6.96
(m, 2H), 4.21–4.15 (m, 2H), 3.89–3.81 (m, 2H), 3.74–3.63 (m, 6H), 3.60–3.54 (m, 2H).
13C NMR (100 MHz, CDCl3) δ 191.1, 163.9, 132.2, 130.2, 115.1, 72.7, 71.0, 70.5, 69.6,
67.9, 61.9. HR-MS calculated for C14H20NaO5 [M+Na]+ m/z 291.1130, found 291.1221.

91
Scheme E.3. Synthesis of compound 26.
(E)-1,3-Bis(4-(2-(2-(2-hydroxyethoxy)ethoxy)ethoxy)phenyl)prop-2-en-1-one
(25): A pressure tube was charged with 23 (6.4 g, 25.0 mmol, 1.0 equiv), 24 (6.7 g,
25.0 mmol, 1.0 equiv), boron trifluoride etherate (3.7 mL, 25.0 mmol, 1.2 equiv) and
MeOH (50 mL). The pressure tube was sealed and heated at 100°C for 48 hrs. The
volatiles were removed under reduced pressure and the crude residue was purified
via flash chromatography on a silica column (100% EtOAc to 7:93 v/v MeOH/CH2Cl2)
to afford the title compound as a light yellow oil (6.4 g, 12.7 mmol, 50.6% yield). 1H
NMR (400 MHz, CD3OD) δ 8.06 (d, J = 8.8 Hz, 2H), 7.72 (d, J = 15.6 Hz, 1H), 7.68 (d,
J = 8.8 Hz, 2H), 7.62 (d, J = 15.5 Hz, 1H), 7.05 (d, J = 8.9 Hz, 2H), 6.99 (d, J = 8.7 Hz,
2H), 4.25–4.11 (m, 5H), 3.90–3.82 (m, 5H), 3.73–3.67 (m, 4H), 3.67–3.60 (m, 10H),
3.57–3.50 (m, 5H). 13C NMR (100 MHz, CD3OD) δ 189.6, 163.2, 161.3, 144.3, 131.2,
130.8, 130.4, 128.0, 119.2, 114.9, 114.4, 72.5, 70.6, 70.2, 69.5, 67.7, 67.5, 61.0. HR-
MS calculated for C27H37O9 [M+H]+ m/z 505.2438, found 505.2450.
1,3-Bis(4-(2-(2-(2-hydroxyethoxy)ethoxy)ethoxy)phenyl)-4-nitrobutan-1-one
(26): A round-bottom flask was charged with 25 (6.4 g, 12.7 mmol, 1.0 equiv), MeNO2
(10.2 mL, 190.5 mmol, 15.0 equiv), KOH (20% w/w in H2O, 7.2 mL, 25.4 mmol, 2.0
equiv), and EtOH (15 mL). The reaction mixture was heated to reflux for 3 hrs and

92
then concentrated under reduced pressure. The crude residue was purified via flash
chromatography on a silica column (7:93 v/v MeOH/CH2Cl2) to afford the title
compound as a brown oil (5.3 g, 9.4 mmol, 74.3% yield). 1H NMR (400 MHz, CD3OD)
δ 7.85 (d, J = 8.9 Hz, 2H), 7.18 (d, J = 8.7 Hz, 2H), 6.92 (d, J = 8.9 Hz, 2H), 6.80 (d, J
= 8.7 Hz, 2H), 4.79 (dd, J = 12.5, 9.2 Hz, 1H), 4.66 (dd, J = 12.5, 9.2 Hz, 1H), 4.14–
4.10 (m, 2H), 4.08–4.02 (m, 1H), 4.02–3.99 (m, 2H), 3.87–3.47 (m, 22H), 3.38 (dd, J
= 17.4, 7.2 Hz, 1H), 3.32–3.24 (dd, J = 17.4, 7.2 Hz, 1H). 13C NMR (100 MHz, CD3OD)
δ 196.7, 163.3, 158.3, 132.1, 130.4, 129.9, 128.8, 114.6, 114.3, 79.8, 72.5, 70.6, 70.5,
70.2, 69.6, 69.4, 67.7, 67.3, 41.1, 39.3. HR-MS calculated for C28H40NO11 [M+H]+ m/z
566.2601, found 566.2611.

93
Scheme E.4. Synthesis of APC-2.
1-(4-(Allyloxy)-3,5-dichlorophenyl)ethan-1-one (27). A round-bottom flask was
charged with 17 (47.7 g, 233.0 mmol, 1.0 equiv), allyl bromide (32.1 mL, 373.0 mmol,
1.6 equiv), K2CO3 (64.4 g, 466.0 mmol, 2.0 equiv) and CH3CN (200 mL). The reaction
was refluxed for 2 hrs, cooled to room temperature, filtered through a bed of celite and

94
washed with MeCN (100 mL). The filtrate was concentrated under reduced pressure
and the crude residue was purified via flash chromatography on a silica column (1:19
v/v EtOAc:Hexanes) to afford the title compound as a light yellow oil. (37.3 g, 182.0
mmol, 78.1% yield). 1H NMR (500 MHz, CDCl3) δ 7.90 (s, 2H), 6.31–5.98 (m, 1H), 5.45
(dq, J = 17.2, 1.4 Hz, 1H), 5.32 (dp, J = 10.3, 1.0 Hz, 1H), 4.65 (dt, J = 6.0, 1.3 Hz,
2H), 2.58 (s, 3H). 13C NMR (125 MHz, CDCl3) δ 195.0, 155.3, 134.2, 132.7, 130.4,
129.3, 119.7, 109.9, 74.9, 26.7. HR-MS calculated for C11H11Cl2O2 [M+H]+ m/z
245.0136, found 245.0140.
(E)-1-(4-(Allyloxy)-3,5-dichlorophenyl)-3-(4-(2-(2-(2-
hydroxyethoxy)ethoxy)ethoxy)phenyl) prop-2-en-1-one (28): A pressure tube was
charged with 23 (3.8 g, 15.0 mmol, 1.0 equiv), 27 (4.4 g, 18.0 mmol, 1.2 equiv), boron
trifluoride etherate (1.9 mL, 15.0 mmol, 1.0 equiv) and MeOH (30 mL). The pressure
tube was sealed and heated at 100 °C for 48 hrs. The volatiles were removed under
reduced pressure and the crude residue was purified via flash chromatography on a
silica column (4:1 v/v EtOAc:Hexanes to 100% EtOAc ) to afford the title compound
as a light yellow solid (3.8 g, 8.0 mmol, 53.2% yield). 1H NMR (400 MHz, CD3OD) δ
8.04 (s, 2H), 7.74 (d, J = 15.4 Hz, 1H), 7.68 (d, J = 8.8 Hz, 2H), 7.53 (d, J = 15.5 Hz,
1H), 6.96 (d, J = 8.8 Hz, 2H), 6.12 (ddt, J = 17.3, 10.4, 5.9 Hz, 1H), 5.40 (dd, J = 17.2,
1.6 Hz, 1H), 5.26 (dd, J = 10.4, 1.4 Hz, 1H), 4.61 (dt, J = 5.9, 1.3 Hz, 2H), 4.27–4.05
(m, 2H), 3.94–3.77 (m, 2H), 3.76–3.48 (m, 8H). 13C NMR (100 MHz, CD3OD) δ 187.1,
161.6, 154.7, 146.0, 135.5, 132.9, 130.8, 130.0, 129.1, 127.6, 118.1, 114.9, 74.5, 72.5,

95
70.6, 70.2, 69.5, 67.5, 61.0. m.p. = 70°C. HR-MS calculated for C24H27O6Cl2 [M+H]+
m/z 481.1185, found 481.1194.
1-(4-(Allyloxy)-3,5-dichlorophenyl)-3-(4-(2-(2-(2-
hydroxyethoxy)ethoxy)ethoxy)phenyl)-4-nitrobutan-1-one (29): A round-bottom
flask was charged with 28 (3.84 g, 8.0 mmol, 1.0 equiv), MeNO2 (6.4 mL, 120.0 mmol,
15.0 equiv), KOH (20% w/w in H2O, 4.5 mL, 16.0 mmol, 2.0 eq.), and EtOH (10 mL).
The reaction mixture was refluxed for 3 hrs, cooled to room temperature, and
concentrated under reduced pressure. The crude residue was purified via flash
chromatography on a silica column (4:1 v/v EtOAc:Hexanes) to afford the title
compound as a brown oil (2.7 g, 5.0 mmol, 61.5% yield). 1H NMR (400 MHz, CD3OD)
δ 7.85 (s, 1H), 7.19 (d, J = 8.7 Hz, 1H), 6.81 (d, J = 8.7 Hz, 1H), 6.08 (ddt, J = 17.3,
10.4, 6.0 Hz, 1H), 5.37 (dq, J = 17.2, 1.5 Hz, 1H), 5.23 (dq, J = 10.5, 1.3 Hz, 1H), 4.81
(dd, J = 12.7, 6.1 Hz, 1H), 4.66 (dd, J = 12.6, 9.2 Hz, 1H), 4.56 (dt, J = 6.0, 1.3 Hz,
2H), 4.08–3.93 (m, 3H), 3.83–3.73 (m, 2H), 3.71–3.48 (m, 9H), 3.42 (dd, J = 17.8, 7.1
Hz, 1H), 3.34 (dd, J = 17.8, 6.8 Hz, 1H). 13C NMR (100 MHz, CD3OD) δ 195.0, 158.4,
155.0, 133.9, 132.8, 131.8, 129.9, 128.8, 128.8, 118.2, 114.6, 79.6, 74.5, 72.5, 70.5,
70.2, 69.6, 67.3, 61.0, 41.4, 39.0. HR-MS calculated for C27H28NO8Cl2 [M+H]+ m/z
564.1192, found 564.1187.
(Z)-2,2'-(((((((2-((5-(4-(Allyloxy)-3,5-dichlorophenyl)-3-(4-(2-(2-(2-
hydroxyethoxy)ethoxy) ethoxy)phenyl)-1H-pyrrol-2-yl)imino)-2H-pyrrole-3,5-
diyl)bis(4,1-phenylene))bis(oxy))bis (ethane-2,1-diyl))bis(oxy))bis(ethane-2,1-
diyl))bis(oxy))bis(ethan-1-ol) (30). A solution of 26 (5.3 g, 9.4 mmol, 1.9 equiv), 29

96
(2.7 g, 5.0 mmol, 1.0 equiv), in n-butanol (30 mL) was treated with NH4OAc (11.4g,
148.0 mmol, 30.0 equiv). The reaction mixture was refluxed for 5 hrs, cooled to room
temperature, diluted with brine (200 mL), and extracted with CH2Cl2 (3 × 200 mL). The
combined organic fractions were dried (Na2SO4), filtered and concentrated under
reduced pressure. The crude residue was purified by flash chromatography on a silica
column (3:47 v/v MeOH/CH2Cl2) to afford the title compound as a dark blue solid (1.66
g, 1.6 mmol, 66.3 % yield). 1H NMR (500 MHz, CDCl3) δ 7.91 (d, J = 8.7 Hz, 2H), 7.88
(d, J = 8.6 Hz 1H), 7.79 (d, J = 8.6 Hz, 2H), 7.62 (s, 2H), 7.29 (s, 1H), 7.01–6.92 (m,
3H), 6.89 (m, 3H), 6.80 (s, 1H), 6.20 (ddt, J = 16.5, 10.3, 6.0 Hz, 1H), 5.50 (dd, J =
17.2, 1.5 Hz, 1H), 5.36 (dd, J = 10.3, 1.5 Hz, 1H), 4.61 (d, J = 6.0 Hz, 2H), 4.20 (m,
6H), 3.98–3.65 (m, 30H). 13C NMR (125 MHz, CDCl3) δ 161.2, 159.3, 159.2, 158.7,
153.1, 151.4, 146.9, 146.2, 144.5, 139.4, 133.2, 130.6, 130.3, 130.3, 129.8, 128.9,
127.2, 126.7, 126.1, 125.0, 119.2, 115.3, 114.5, 74.9, 72.9, 71.2, 70.7, 70.0, 69.9,
67.7, 67.7, 62.0. m.p. = 158°C. HR-MS calculated for C53H62N3O13Cl2 [M+H]+ m/z
1018.3660, found 1018.3654.
(Z)-N-(5-(4-(allyloxy)-3,5-dichlorophenyl)-3-(4-((2,2,3,3-tetramethyl-4,7,10-trioxa-
3-siladodecan-12-yl)oxy)phenyl)-1H-pyrrol-2-yl)-3,5-bis(4-((2,2,3,3-tetramethyl-
4,7,10-trioxa-3-siladodecan-12-yl)oxy)phenyl)-2H-pyrrol-2-imine (31). To a
solution of compound 30 (1.7 g, 1.6 mmol, 1.0 equiv) in anhydrous CH2Cl2 (30 mL)
was added imidazole (1.1g, 16.3 mmol, 10 eq.) and TBS-Cl (1.8 g, 12.2 mmol, 7.5
equiv). The reaction mixture was stirred overnight room temperature, poured in brine
(150 mL) and extracted with CH2Cl2 (3 × 60 mL). The combined organic fractions were

97
dried (Na2SO4), filtered and concentrated under reduced pressure. The crude residue
was purified by flash chromatography on a silica column (3:7 v/v EtOAc:Hexanes) to
afford the title compound as a dark blue film (929 mg, 0.7 mmol, 41.8 % yield) 1H NMR
(500 MHz, CDCl3) δ 7.99 (d, J = 8.7 Hz, 2H), 7.95 (d, J = 8.7 Hz, 2H), 7.89 (d, J = 8.7
Hz, 2H), 7.71 (s, 2H), 7.05 (s, 1H), 7.02 (d, J = 8.7 Hz, 2H), 6.96 (d, J = 3.7 Hz, 2H),
6.94 (d, J = 3.7 Hz, 2H), 6.87 (s, 1H), 6.20 (ddt, J = 16.3, 10.3, 5.9 Hz, 1H), 5.49 (dd,
J = 16.3, 1.5 Hz, 1H), 5.35 (dd, J = 10.4, 1.3 Hz, 1H), 4.63 (dt, J = 6.1, 1.3 Hz, 2H),
4.22 (m, 6H), 3.98–3.58 (m, 30H), 0.92 (s, 27H), 0.09 (s, 18H). 13C NMR (125 MHz,
CDCl3) δ 161.4, 159.7, 159.4, 158.9, 153.3, 151.5, 146.8, 146.1, 144.8, 139.5, 133.1,
130.6, 130.4, 130.2, 129.9, 129.0, 127.1, 126.6, 126.1, 125.0, 119.3, 115.4, 115.3,
114.6, 111.2, 74.9, 73.0, 72.9, 71.2, 71.2, 71.1, 70.1, 70.0, 69.9, 67.8, 67.7, 63.0, 26.2,
18.6, -5.0. m.p. = 153°C. HR-MS calculated for C71H104N3O13Si3Cl2 [M+H]+ m/z
1360.6254, found 1360.6211.
2,2',2''-(((((((7-(4-(Allyloxy)-3,5-dichlorophenyl)-5,5-difluoro-5H-4l4,5l4-
dipyrrolo[1,2-c:2',1'-f][1,3,5,2]triazaborinine-1,3,9-triyl)tris(benzene-4,1-
diyl))tris(oxy))tris(ethane-2,1-diyl))tris(oxy))tris(ethane-2,1-
diyl))tris(oxy))tris(ethan-1-ol) (32). To a solution of 31 (929 mg, 0.7 mmol, 1.0 equiv)
in anhydrous CH2Cl2 (30 mL) was treated with DIPEA (1.2 mL, 6.8 mmol, 10.0 equiv)
and boron trifluoride etherate (1.7 mL, 13.7 mmol, 20.0 equiv). The reaction mixture
was stirred at room temperature for 2 hrs, poured into H2O (100 mL) and extracted
with CH2Cl2 (3 × 50 mL). The combined organic fractions were dried (Na2SO4), filtered,
concentrated under reduced pressure and transferred to a flame-dried round-bottom
98
flask. The intermediate was dissolved in THF (40 mL) and treated with TBAF (1M in
THF, 6.1 mL, 6.1 mmol, 9.0 equiv) dropwise under a nitrogen atmosphere. After 10
min, the reaction was diluted with sat. NaHCO3 (100 mL) and extracted with CH2Cl2 (3
× 50 mL). The combined organic fractions were dried (Na2SO4), filtered and
concentrated to afford the crude residue which was purified via flash chromatography
on a silica column (7:93 v/v MeOH/CH2Cl2) to afford the title compound as a dark blue
solid (464 mg, 0.4 mmol, 63.6% yield over two-steps). 1H NMR (500 MHz, CDCl3) δ
8.06 (d, J = 8.5 Hz, 2H), 7.97 (d, J = 9.3 Hz, 2H), 7.94 (d, J = 9.3 Hz, 2H), 7.93 (s,
2fH), 6.99–6.89 (m, 8H), 6.76 (s, 1H), 6.17 (ddt, J = 16.4, 10.8, 5.8 Hz, 1H), 5.47 (d, J
= 16.9 Hz, 1H), 5.32 (d, J = 10.3 Hz, 1H), 4.60 (d, J = 6.0 Hz, 2H), 4.15 (dq, J = 5.6,
3.2 Hz, 6H), 3.92–3.55 (m, 30H), 3.09–2.99 (b, 2H), 2.85 (b, 1H). 13C NMR (125 MHz,
CDCl3) δ 162.0, 161.4, 160.6, 159.9, 152.4, 151.8, 146.9, 144.9, 144.1, 141.2, 133.2,
132.4, 132.4, 132.3, 131.2, 130.8, 130.0, 129.9, 129.8, 129.8, 129.7, 125.9, 125.1,
123.7, 119.1, 118.5, 116.5, 115.1, 114.9, 77.6, 77.6, 74.8, 72.8, 72.8, 71.1, 71.1, 70.6,
69.9, 69.8, 69.8, 69.7, 67.7, 67.7, 67.7, 67.6, 61.9, 61.9. m.p. = 168°C. HR-MS
calculated for C53H60BCl2F2N3O13 [M+Na]+ m/z 1088.3384, found 1088.3448.
Sodium 2-(2-(2-(4-(7-(4-(allyloxy)-3,5-dichlorophenyl)-5,5-difluoro-3,9-bis(4-(2-
(2-(2-(sulfonatooxy)ethoxy)ethoxy)ethoxy)phenyl)-5H-4l4,5l4-dipyrrolo[1,2-
c:2',1'-f][1,3,5,2] triazaborinin-1-yl)phenoxy)ethoxy)ethoxy)ethyl sulfate (33). A
flame-dried round-bottom flask was charged with 32 (386 mg, 0.36 mmol, 1.0 equiv),
SO3-NMe3 (454 mg, 3.3 mmol, 9.0 equiv) and anhydrous DMF (20 mL). The reaction
was stirred at room temperature overnight. Volatiles were removed under reduced
99
pressure, the crude residue was dissolved in H2O (10 ml), and loaded onto a 20 cc
Sep-Pak cartridge preloaded with 5g C18 sorbent for reversed-phased purification (0-
50% v/v MeCN/H2O gradient) to afford the title compound as a blue solid (490 mg,
0.36 mmol, 99.0%). 1H NMR (500 MHz, CD3OD) δ 8.05 (d, J = 8.6 Hz, 2H), 7.92 (s,
2H), 7.87 (d, J = 8.6 Hz, 2H), 7.83 (d, J = 8.6 Hz, 2H), 7.02–6.97 (s, 1H), 6.94 (d, J =
8.5 Hz, 2H), 6.77 (m, 4H), 6.15 (ddt, J = 16.3, 10.8, 5.6 Hz, 1H), 5.46 (dd, J = 17.2,
1.6 Hz, 1H), 5.30 (dd, J = 10.6, 1.5 Hz, 1H), 4.54 (d, J = 5.8 Hz, 2H), 4.22–4.12 (m,
8H), 4.04 (m, 4H), 3.89–3.83 (m, 6H), 3.78–3.71 (m, 18H). 13C NMR (125 MHz,
DMSO-d6) δ 162.8, 161.7, 161.3, 160.5, 160.5, 157.1, 156.1, 152.2, 151.4, 150.8,
146.9, 143.7, 140.8, 133.7, 133.7, 133.1, 131.7, 131.2, 130.2, 130.1, 129.4, 126.8,
125.5, 124.6, 123.3, 119.7, 115.8, 115.6, 115.3, 115.2, 115.2, 115.2, 75.1, 70.6, 70.4,
70.0, 69.6, 68.4, 60.9, 52.4, 44.8. HR-MS calculated for C53H57BCl2F2N3Na4O22S3
[M+Na]+ m/z 1394.1625, found 1394.1606.
Sodium 2-(2-(2-(4-(7-(3,5-dichloro-4-hydroxyphenyl)-5,5-difluoro-3,9-bis(4-(2-(2-
(2-(sulfonatooxy)ethoxy)ethoxy)ethoxy)phenyl)-5H-4l4,5l4-dipyrrolo[1,2-c:2',1'-
f][1,3,5,2] triazaborinin-1-yl)phenoxy)ethoxy)ethoxy)ethyl sulfate (34). A flame-
dried round-bottom flask was charged with 33 (490 mg, 0.36 mmol, 1.0 equiv), 1,3-
dimethylbarbituric acid (70.8 mg, 0.45 mmol, 1.25 equiv), Pd(PPh3)4 (84.0 mg, 0.73
mmol, 0.2 equiv) and anhydrous DMF (40 mL). The reaction was stirred at room
temperature overnight. All volatiles were removed under reduced pressure. The crude
residue was treated with EtOAc and extracted with H2O (3 × 50 mL). The combined
aqueous fractions were washed with Et2O (3 × 100 mL), concentrated to 5 mL, and

100
loaded onto a 20 cc Sep-Pak cartridge preloaded with 5g C18 sorbent for reversed-
phased purification (0-35% v/v MeCN/H2O gradient) to yield the title compound as a
dark pink solid (360 mg, 0.27 mmol, 74.4%. 1H NMR (500 MHz, DMSO-d6) δ 8.44 (s,
2H), 8.25 (d, J = 8.3 Hz, 2H), 8.04–7.93 (m, 3H), 7.87 (d, J = 8.3 Hz, 2H), 7.10 (d, J =
8.4 Hz, 2H), 7.04 (d, J = 8.5 Hz, 2H), 6.99 (d, J = 8.5 Hz, 2H), 6.90 (s, 1H), 3.77 (dt, J
= 24.1, 4.8 Hz, 18H), 3.58–3.51 (m, 18H). 13C NMR (125 MHz, DMSO-d6) δ 168.2,
164.3, 164.3, 160.4, 160.4, 159.1, 159.1, 158.6, 158.6, 158.0, 153.8, 153.8, 148.4,
148.4, 144.6, 141.6, 140.3, 140.2, 133.0, 131.1, 130.6, 129.8, 127.4, 127.1, 126.9,
124.9, 122.1, 115.3, 114.9, 113.9, 113.9, 110.0, 72.9, 70.6, 70.4, 70.0, 69.6, 68.1, 67.9,
65.7. m.p. = 237°C. HR-MS calculated for C50H53BCl2F2N3Na4O22S3 [M+H]+ m/z
1354.1312, found 1354.1329.
APC-2. A round-bottom flask was charged with 34 (100 mg, 0.075 mmol, 1.0 equiv) in
H2O (3 mL). EDC (21.6 mg, 0.113 mmol, 1.5 equiv), picolinic acid (27.7 mg, 0.225
mmol, 3.0 equiv), and 4-dimethylaminopyridine (1.38 mg, 0.011 mmol, 0.15 equiv)
were added. The reaction was stirred at room temperature for 2 hrs and then washed
with 1:2 v/v CH2Cl2:EtOAc (6 × 200 mL). The reaction was loaded onto a 1.0 mm thick
preparative TLC plate for purification (9:11 v/v MeOH/CH2Cl2) to yield APC-2 (57.5 mg,
0.40 mmol, 53.0 %) as a blue solid. 1H NMR (500 MHz, DMSO-d6) δ 8.89 (d, J = 4.7
Hz, 1H), 8.45 (s, 2H), 8.36 (d, J = 7.9 Hz, 1H), 8.25 (d, J = 8.5 Hz, 2H), 8.15 (t, J =
8.1Hz, 1H), 8.06 – 7.97 (m, 3H), 7.88 (d, J = 8.4 Hz, 2H), 7.83 (dd, J = 7.8, 4.7 Hz,
1H), 7.12 (d, J = 8.8 Hz, 2H), 7.05 (d, J = 8.5 Hz, 2H), 7.01 (d, J = 8.4 Hz, 2H), 6.89

101
(s, 1H), 3.84–3.75 (m, 30H), 3.60 (s, 17H), 3.54 (s, 35H). HR-MS calculated for
C56H56BCl2F2N4Na4O23S3 [M+H]+ m/z 1459.1526, found 1459.1532.
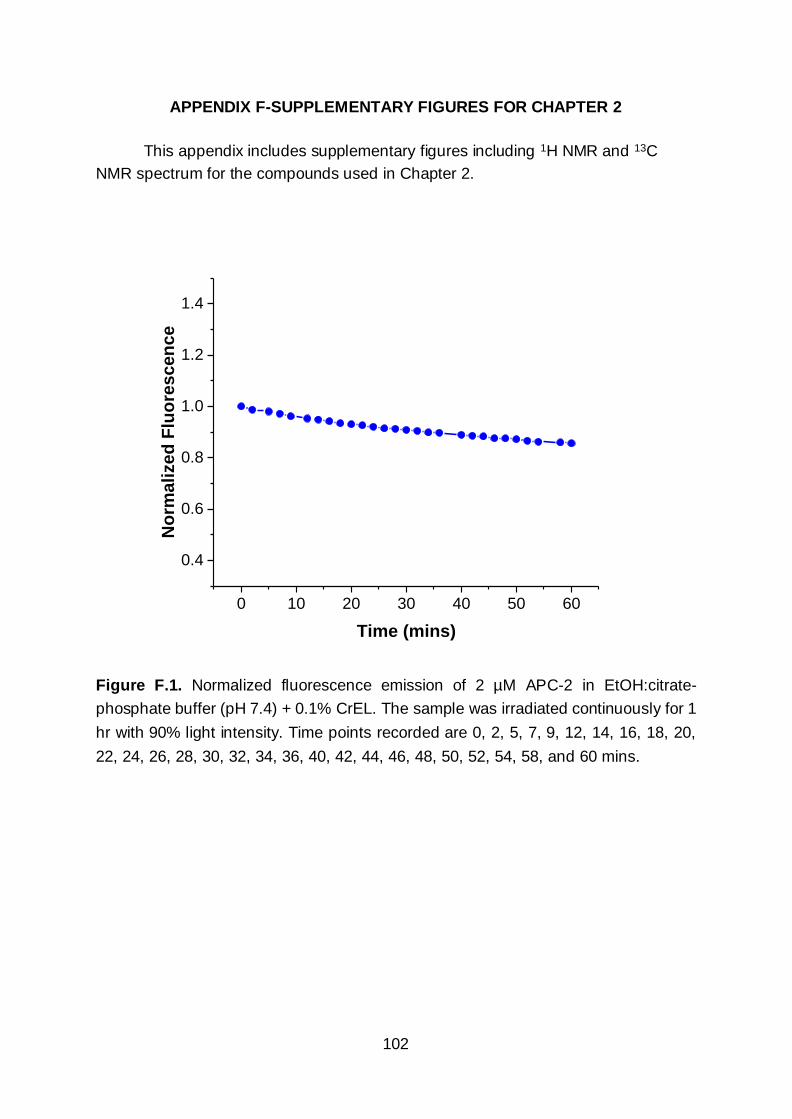
102
APPENDIX F-SUPPLEMENTARY FIGURES FOR CHAPTER 2
This appendix includes supplementary figures including 1H NMR and 13C
NMR spectrum for the compounds used in Chapter 2.
0 10 20 30 40 50 60
0.4
0.6
0.8
1.0
1.2
1.4
No
rma
lize
d F
luo
res
ce
nc
e
Time (mins)
Figure F.1. Normalized fluorescence emission of 2 µM APC-2 in EtOH:citrate-
phosphate buffer (pH 7.4) + 0.1% CrEL. The sample was irradiated continuously for 1
hr with 90% light intensity. Time points recorded are 0, 2, 5, 7, 9, 12, 14, 16, 18, 20,
22, 24, 26, 28, 30, 32, 34, 36, 40, 42, 44, 46, 48, 50, 52, 54, 58, and 60 mins.

103
600 650 700 750 800
0.0
0.2
0.4
0.6
0.8
1.0N
orm
ali
ze
d A
bs
orb
an
ce
Wavelength (nm)
3
3.4
3.8
4.2
4.6
5
5.4
5.8
6.2
6.6
7
7.4
7.8
8.2
Figure F.2. Normalized absorbance spectra of 2 µM 21 in 2:3 v/v EtOH:citrate-
phosphate buffer at various pHs. pH values examined were 3.0, 3.4, 3.8, 4.2, 4.6, 5.0,
5.4, 5.8, 6.2, 6.6, 7.0, 7.4, 7.8, and 8.2.

104
500 550 600 650 700 750 800
0.0
0.2
0.4
0.6
0.8
1.0
1.2N
orm
ali
ze
d A
bs
orb
an
ce
Wavelength (nm)
3
3.4
3.8
4.2
4.6
5
5.4
5.8
6.2
6.6
7
7.4
7.8
8.2
Figure F.3. Normalized absorbance spectra of 2 µM APC-1 in 2:3 v/v EtOH:citrate-
phosphate buffer at various pHs. pH values examined were 3.0, 3.4, 3.8, 4.2, 4.6, 5.0,
5.4, 5.8, 6.2, 6.6, 7.0, 7.4, 7.8, and 8.2.

105
600 650 700 750 800 850
0.0
0.2
0.4
0.6
0.8
1.0
1.2N
orm
ali
ze
d A
bs
orb
an
ce
Wavelength (nm)
3
3.4
3.8
4.2
4.6
5
5.4
5.8
6.2
6.6
7
7.4
7.8
8.2
Figure F.4. Normalized absorbance spectra of 2 µM 34 in citrate-phosphate buffer +
0.1% CrEL at various pHs. pH values examined were 3.0, 3.4, 3.8, 4.2, 4.6, 5.0, 5.4,
5.8, 6.2, 6.6, 7.0, 7.4, 7.8, and 8.2.

106
500 550 600 650 700 750 800
0.0
0.2
0.4
0.6
0.8
1.0N
orm
ali
ze
d A
bs
orb
an
ce
Wavelength (nm)
3
3.4
3.8
4.2
4.6
5
5.4
5.8
6.2
6.6
7
7.4
7.8
8.2
Figure F.5. Normalized absorbance spectra of 2 µM APC-2 in citrate-phosphate buffer
+ 0.1% CrEL at various pHs. pH values examined were 3.0, 3.4, 3.8, 4.2, 4.6, 5.0, 5.4,
5.8, 6.2, 6.6, 7.0, 7.4, 7.8, and 8.2.

107
Figure F.6. Normalized absorbance spectra of 2 µM APC-1 (dashed line) and 2 µM
21 (solid line) in PBS + 0.1% CrEL (pH 7.4).
600 650 700 750 800 850
0.0
0.2
0.4
0.6
0.8
1.0
No
rmalized
Ab
so
rban
ce
Wavelength (nm)
APC-1
21

108
Figure F.7. Normalized absorbance spectra of 2 µM APC-2 (dashed line) and 2 µM
34 (solid line) in PBS + 0.1% CrEL (pH 7.4).
600 650 700 750 800
0.0
0.2
0.4
0.6
0.8
1.0
No
rmalized
Ab
so
rban
ce
Wavelength (nm)
APC-2
34

109
Figure F.8. Normalized absorbance spectrum of 2 µM APC-2 being partly converted
to 34 with the addition of 10 µM Cu(II) in PBS + 0.1% CrEL.

110
Figure F.9. Fluorescence imaging of APC-1. a) A 10 µM solution of APC-1 in 2:3 v/v
EtOH:PBS buffer at pH 7.4 was loaded into a 0.08” FEP tube and imaged using an
EVOS FL microscope equipped with a 4× objective and a Cy5 light cube filter. b) The
lower region of the FEP tube was overlaid with a 1 cm thick agarose tissue phantom.
Scale bar represents 1000 µm.
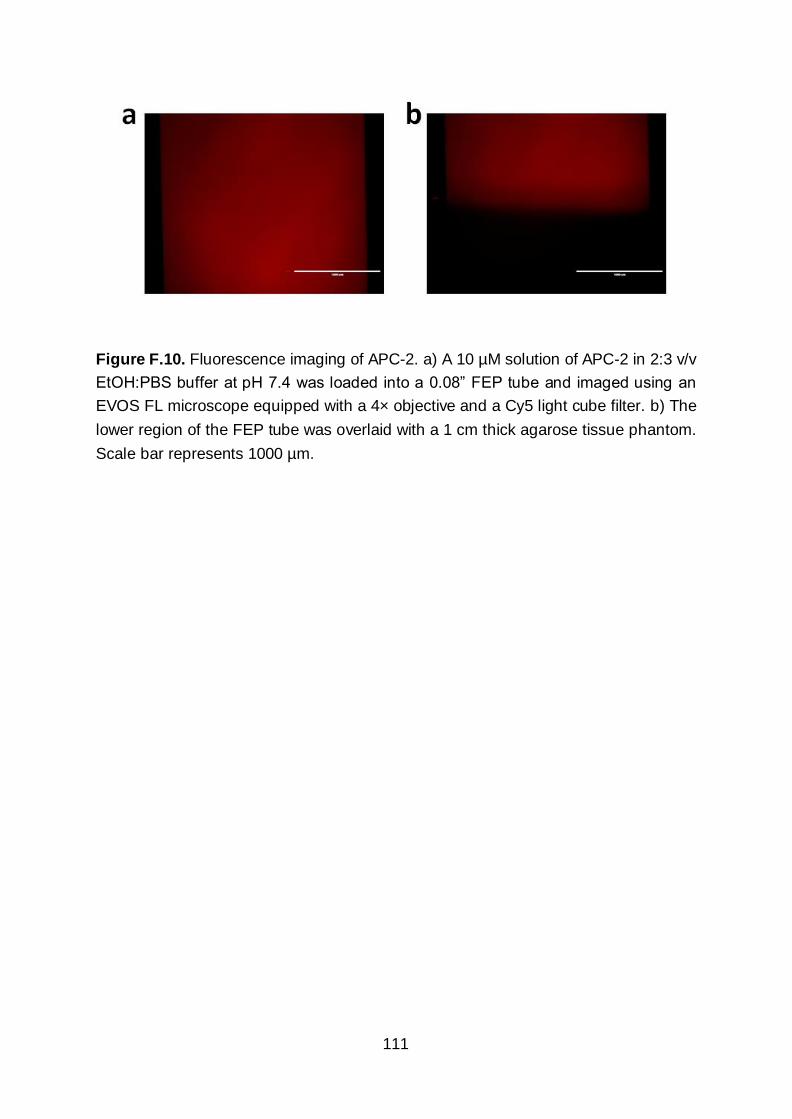
111
Figure F.10. Fluorescence imaging of APC-2. a) A 10 µM solution of APC-2 in 2:3 v/v
EtOH:PBS buffer at pH 7.4 was loaded into a 0.08” FEP tube and imaged using an
EVOS FL microscope equipped with a 4× objective and a Cy5 light cube filter. b) The
lower region of the FEP tube was overlaid with a 1 cm thick agarose tissue phantom.
Scale bar represents 1000 µm.

112
Figure F.11. Photoacoustic imaging of compound 21 at pH 3.0 and 8.2 with excitation
provided at a) 680 nm and b) 755 nm. Pseudo-coloring represents intensity distribution
from highest intensity indicated by white to the lowest intensity designated by black.

113
Figure F.12. 1H NMR (500 MHz, CDCl3) and 13C NMR (125 MHz, CDCl3) spectra of
16.

114
Figure F.13. 1H NMR (500 MHz, DMSO-d6) and 13C NMR (125 MHz, DMSO-d6)
spectra of 17.

115
Figure F.14. 1H NMR (500 MHz, Acetone-d6) and 13C NMR (125 MHz, Acetone-d6)
spectra of 18.

116
Figure F.15. 1H NMR (500 MHz, CDCl3) and 13C NMR (125 MHz, CDCl3) spectra of
19.

117
Figure F.16. 1H NMR (500 MHz, DMSO-d6) and 13C NMR (125 MHz, DMSO-d6)
spectra of 20.

118
Figure F.17. 1H NMR (500 MHz, DMSO-d6) and 13C NMR (125 MHz, Acetone-d6)
spectra of 21.

119
Figure F.18. 1H NMR (500 MHz, CDCl3) and 13C NMR (125 MHz, CDCl3) spectra of
APC-1.

120
Figure F.19. 1H NMR (500 MHz, CDCl3) and 13C NMR (125 MHz, CDCl3) spectra of
22.

121
Figure F.20. 1H NMR (400 MHz, CDCl3) and 13C NMR (100 MHz, CDCl3) spectra of
23.

122
Figure F.21. 1H NMR (400 MHz, CDCl3) and 13C NMR (100 MHz, CDCl3) spectra of
24.
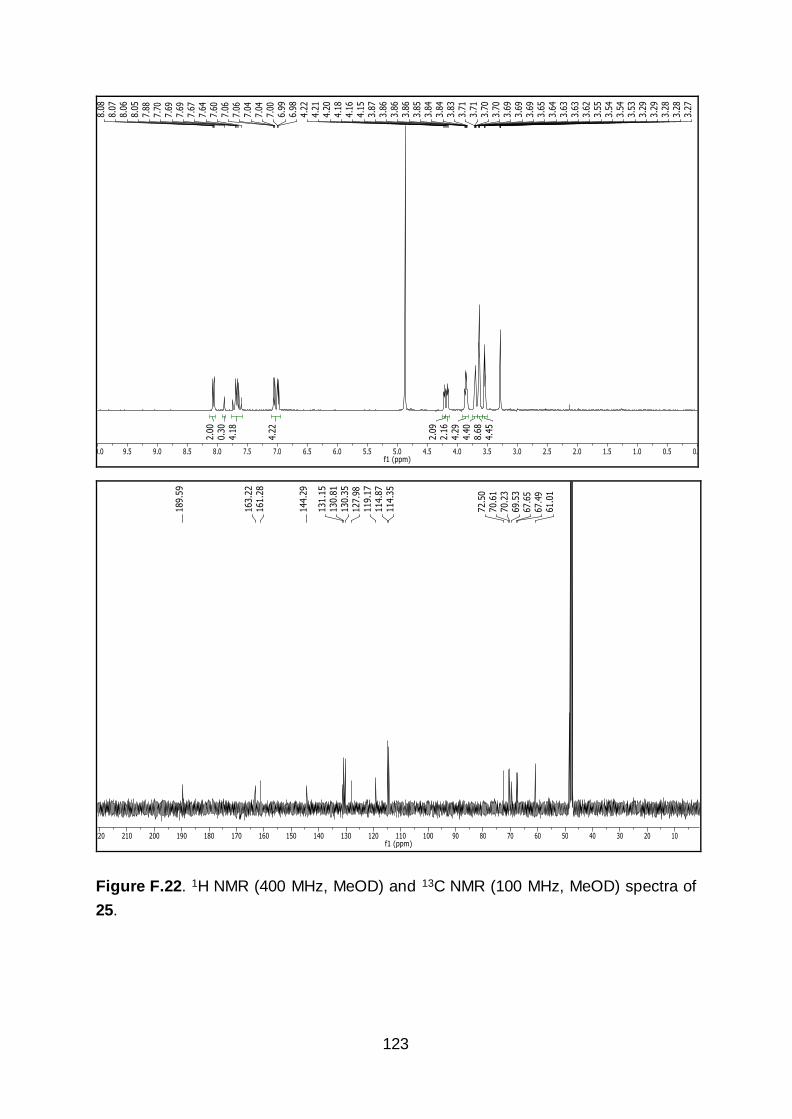
123
Figure F.22. 1H NMR (400 MHz, MeOD) and 13C NMR (100 MHz, MeOD) spectra of
25.
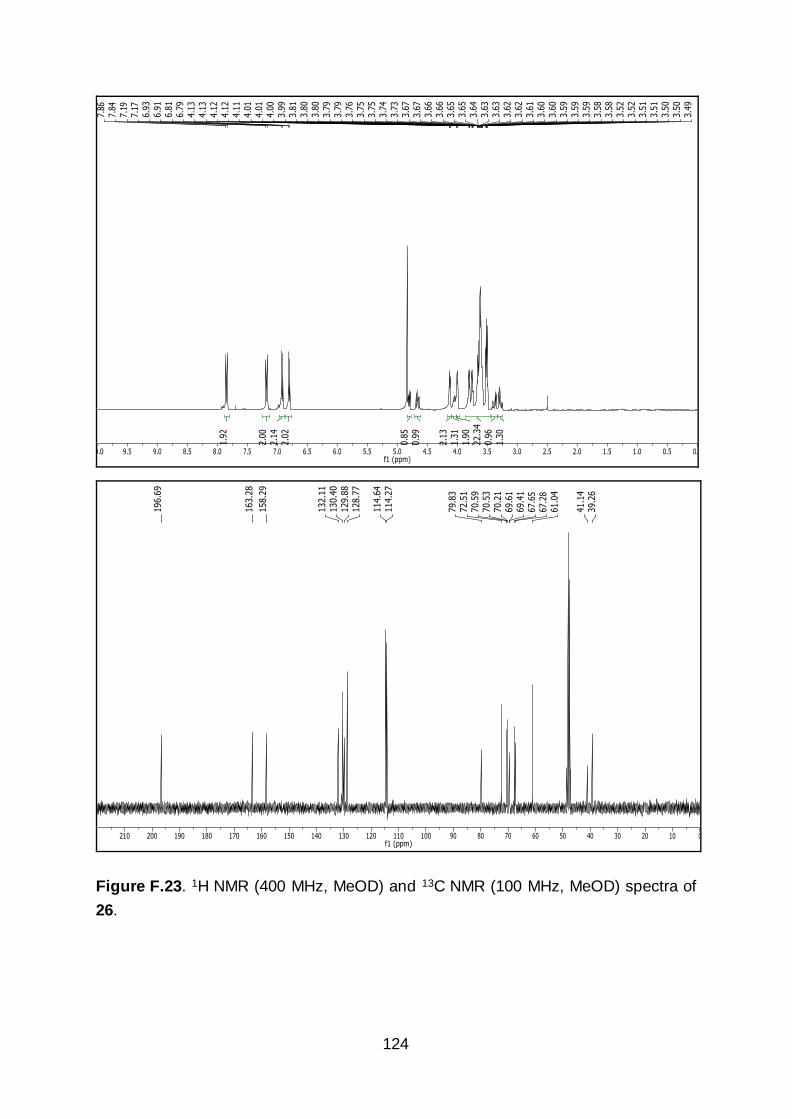
124
Figure F.23. 1H NMR (400 MHz, MeOD) and 13C NMR (100 MHz, MeOD) spectra of
26.
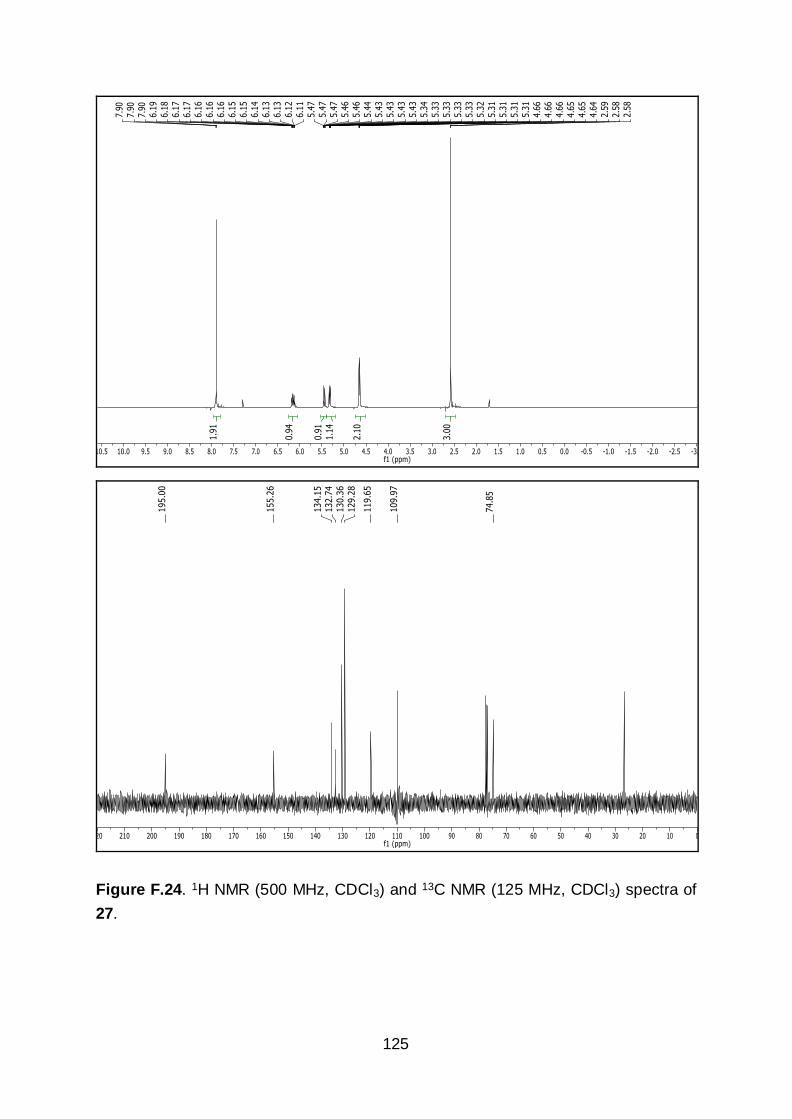
125
Figure F.24. 1H NMR (500 MHz, CDCl3) and 13C NMR (125 MHz, CDCl3) spectra of
27.

126
Figure F.25. 1H NMR (400 MHz, MeOD) and 13C NMR (100 MHz, MeOD) spectra of
28.

127
Figure F.26. 1H NMR (400 MHz, MeOD) and 13C NMR (100 MHz, MeOD) spectra of
29.

128
Figure F.27. 1H NMR (500 MHz, CDCl3) and 13C NMR (125 MHz, CDCl3) spectra of
30.
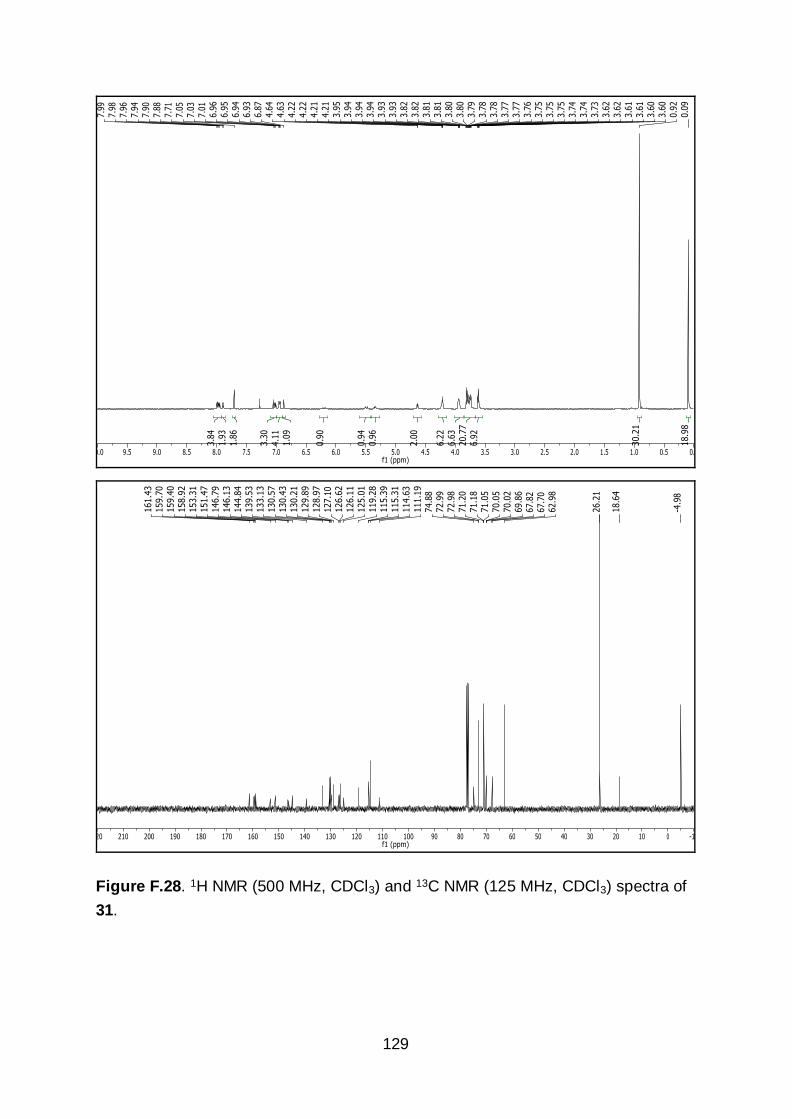
129
Figure F.28. 1H NMR (500 MHz, CDCl3) and 13C NMR (125 MHz, CDCl3) spectra of
31.
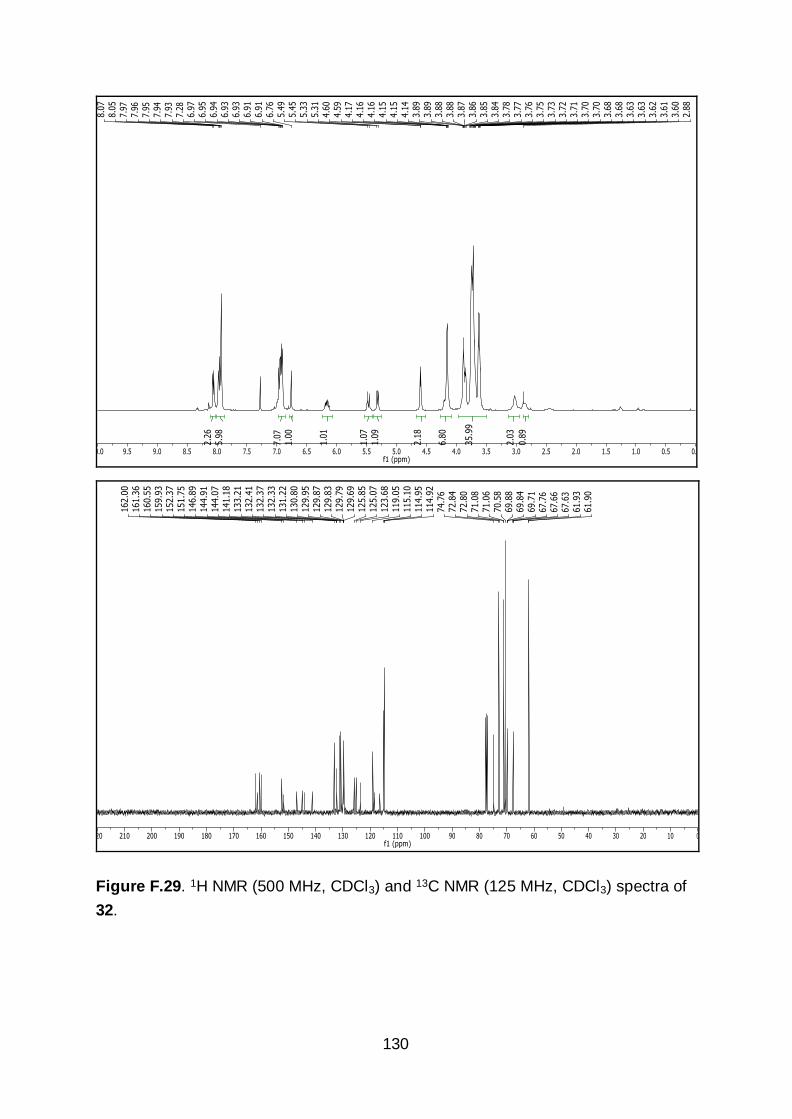
130
Figure F.29. 1H NMR (500 MHz, CDCl3) and 13C NMR (125 MHz, CDCl3) spectra of
32.

131
Figure F.30. 1H NMR (500 MHz, CDCl3) and 13C NMR (125 MHz, CDCl3) spectra of
33.

132
Figure F.31. 1H NMR (500 MHz, DMSO-d6) and 13C NMR (125 MHz, DMSO-d6)
spectra of 34.
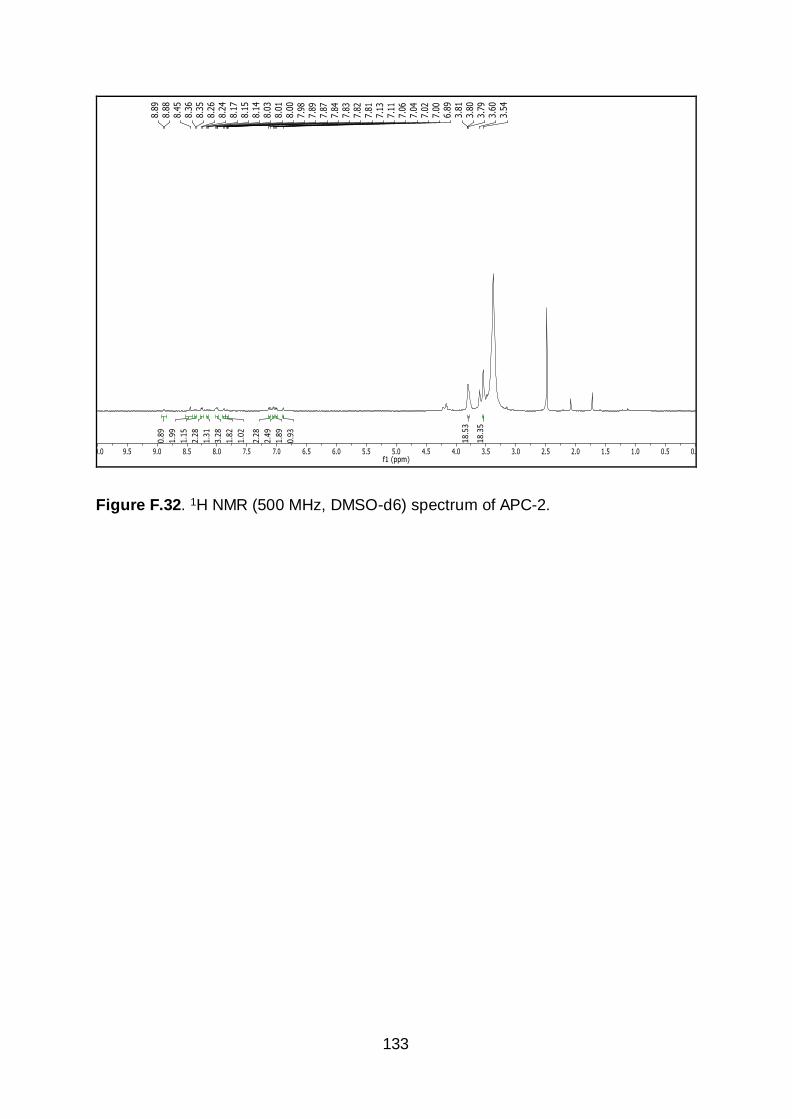
133
Figure F.32. 1H NMR (500 MHz, DMSO-d6) spectrum of APC-2.