development of procedure to create building inventory for ... · “ikonos” is a commercial high...
TRANSCRIPT
13th World Conference on Earthquake Engineering Vancouver, B.C., Canada
August 1-6, 2004 Paper No. 1071
DEVELOPMENT OF PROCEDURE TO CREATE BUILDING INVENTORY FOR SEISMIC RISK ASSESSMENT IN DEVELOPING COUNTRIES USING
IKONOS SATELLITE IMAGE
Haruo HAYASHI1, Manabu WATANABE2, Masasuke TAKASHIMA3, and Kouichi HASEGAWA4
SUMMARY The purpose of this study is to develop a method to estimate the quantity of buildings with different seismic vulnerability by using the digital numbers obtained IKONOS. In developing countries, it is difficult to get the building inventory data for seismic risk assessment. In this paper, IKONOS image was chosen for analysis because of its resolution with 1 m and the availability of such data for the major cities in earthquake prone developing countries. IKONOS image of Metro Manila in Philippine was separated into grid cells with 50 m. The pattern of frequency distribution of the digital number for each of four bands were subjected to cluster analysis to yield a set of land cover grids with different natural and built environments. We could successfully identify the following different land covers: river, riverbank, grass, and grounds, in addition to four kinds of building structures: factory, large-scale houses, medium-sized houses, and , shanty-houses. Using GIS data provided by NAMRIA, the number of buildings for each land cover classification was successfully estimated in a test site.
INTRODUCTION A tragic earthquake disaster occurred in Iran in December 2003 clearly and repeatedly demonstrated the existence of a great gap between earthquake engineering studies done in advanced countries and its practice done in developing countries. Seismic vulnerability reduction in developing countries is an urgent business for their safety and sustainable development. It would be extremely difficult and would take long time for developing countries to reduce their vulnerability because of the lack of their resources. Thus the support from international donor communities would be indispensable element for the seismic vulnerability reduction in developing countries. Risk Assessment as a Basis for Seismic Vulnerability Reduction in Developing Countries A report by World Bank pointed out that the success of the Official Development Aid was not dependent upon how much money the international donor community could provide to the community at risk, but it is dependent on how much the capacity of local people would be built by the help from the international donor community in the forms of new ideas and human resources provided. Many UN sponsored community-based capacity building projects such as RADIUS and GESI 1) projects proved that the key of their successful projects was participatory
1 Disaster Prevention Research Institute, Kyoto University 2 Graduate School of Informatics, Kyoto University 3 Institute of Industrial Science, University of Tokyo 4 Earthquake Disaster Mitigation Research Center, National Research Institute for Earth Science and Disaster Prevention, Kobe, Japan
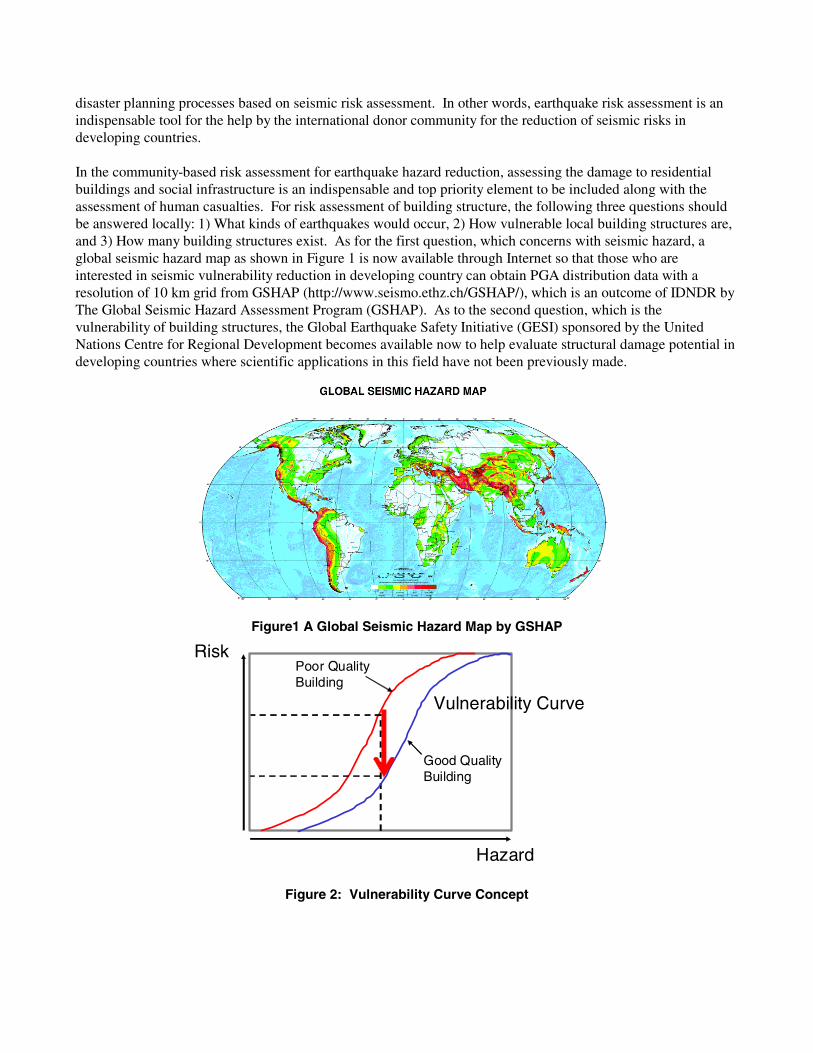
disaster planning processes based on seismic risk assessment. In other words, earthquake risk assessment is an indispensable tool for the help by the international donor community for the reduction of seismic risks in developing countries. In the community-based risk assessment for earthquake hazard reduction, assessing the damage to residential buildings and social infrastructure is an indispensable and top priority element to be included along with the assessment of human casualties. For risk assessment of building structure, the following three questions should be answered locally: 1) What kinds of earthquakes would occur, 2) How vulnerable local building structures are, and 3) How many building structures exist. As for the first question, which concerns with seismic hazard, a global seismic hazard map as shown in Figure 1 is now available through Internet so that those who are interested in seismic vulnerability reduction in developing country can obtain PGA distribution data with a resolution of 10 km grid from GSHAP (http://www.seismo.ethz.ch/GSHAP/), which is an outcome of IDNDR by The Global Seismic Hazard Assessment Program (GSHAP). As to the second question, which is the vulnerability of building structures, the Global Earthquake Safety Initiative (GESI) sponsored by the United Nations Centre for Regional Development becomes available now to help evaluate structural damage potential in developing countries where scientific applications in this field have not been previously made.
Figure1 A Global Seismic Hazard Map by GSHAP
Figure 2: Vulnerability Curve Concept
Hazard
Risk
Vulnerability Curve
Poor QualityBuilding
Good QualityBuilding

The GESI method for the Vulnerability Assessment of Building Structure The GESI1) method uses vulnerability curves showing relative damage factors for various construction types in relation to increasing values of peak ground acceleration (PGA). Applicability of the GESI method has been tested in 21 cities, most of which are located in developing countries. Based on the vulnerability curves and hazard PGA value obtained, the risk of damage to each critical facility structure was calculated. The vulnerability curves and rating scheme in the GESI method are simple to apply in developing countries where earthquake damage occurs but where few systematic damage assessments have been previously conducted. On a vulnerability curve the y axis shows level of risk of damage, while the x axis shows the strength of PGA or horizontal shaking, representing the hazard
Figure 3 GESI Vulnerability Curves
Figure 3 shows GESI vulnerability curves. Curves, from A to I, are determined on the basis of construction type and quality of design, construction, and materials. For example Curve A reflects strongest buildings susceptible mostly to slight to moderate damage below a PGA value of 1, whereas Curve D reflects standard buildings susceptible to complete collapse at a PGA value of 1, and Curve I shows the weakest buildings which are susceptible to complete collapse at a much lower PGA value of 0.4.
Table 1 GESI Scheme for Determining Vulnerability Curves
0
0.1
0.2
0.3
0.4
0.5
0.6
0.7
0.8
0.9
1
0 0.2 0.4 0.6 0.8 1 1.2 1.4
PGA
Dam
age
Stat
e
A
C
B
DEFGHI
4
3
2
1
Building Types 0 1 2 3 4 5 6 7
Wood A A B B C C C D
Steel A B C C D D E F
R/C B C D E E F G H
R/C, steel w ith masonryinfill walls
C D D E E F G H
Reinforc ed m as onry C D D E E F F F
Unreinforced m as onry E E F F G G G H
Adobe N/A N/A G H H H H I
Stone rubble N/A N/A G H H H H I
Lightwe ight shac k N/A N/A N/A H H H H I

Table 1 describes a chart used to determine the type of vulnerability curves that should be applied based on construction type and damage rating value. Each row represents a building structure type, and each column a total damage rating value. The rating scheme consists of three categories: a) quality of design; b) quality of construction; and c) quality of materials. A smaller damage rating value shows higher performance during an earthquake in each category and vice versa. The numerical score is then applied to the table in Table 1 to determine the vulnerability curve rating by locating the overall score along the top row for a type of construction shown in the left hand column, and then determining the letter representing the vulnerability curve that should be applied. For example, a Reinforced Concrete building with steel in block infill walls and an overall rating of 5 would have a vulnerability curve of F. The vulnerability curves can be translated into damage states of either individual structures by applying the rating scheme procedure described in this appendix or to large geographic areas by applying assumed average conditions reflecting in an overall curve such as F reflecting poor quality or D which reflects standard quality. General damage states described by the GESI method, as shown in Table 2, use four broad categories of damage which include: 1) complete collapse, 2) partial collapse, 3) extensive damage and 4) none, slight or moderate. These damage states were used to classify the extent of general damage to structures estimated on the base of Curve F, current building quality which is highly vulnerable, and Curve D, standard building quality which could be better if building strengthening actions are taken.
Table 2 GESI Building Damage States
Estimation of Building Inventory by “IKONOS” Knowing how many building structures exist in the target area, which is building inventory, is the most expensive and time consuming questions to be answered. The accuracy of building inventory depends on the availability of the data set. If the all the attributes of building structures as well as their footprints are available as digital data, it will not be long before GIS system can produce a beautiful risk assessment map with a high resolution. In many cases in developing countries, however, building inventory data are inaccessible or non-existent. If they are available, they are often paper documents. In other words, In addition, it may not be an interesting research topic for the researchers in earthquake engineering, even though it is labor-intensive and indispensable information gathering step for seismic risk assessment in developing countries. In this study, it is our purpose to propose a way to obtain an estimate of building inventory with a reasonable reliability in a “quick and dirty” manner by making use of “IKONOS” imageries, a high resolution satellite imageries. “IKONOS” is a commercial high resolution earth imaging satellite that was launch in September 1999 by Space Imaging Inc. As indicated in Table 3, IKONOS produces 1-meter black-and-white (panchromatic) and 4-meter multi-spectral (red, blue, green, near infrared) imagery which provides a sufficient resolution for the analysis of building inventory because the most of individual houses fit the size of 10m x !0m. These houses can be depicted as bitmap with about 100 pixels.
D am age State D excription
4 C om plete CollapseB uilding is entirely destroyed, with significant portions of
the building collapsed.
3 Partial C ollapse
B uilding is entirely structurally com prom ised and on the
verge of collapse or sm all portions of the building have
collapsed.
2 ExtensiveExtensive structural and non-structural dam age.
Localized life-threatening situations are com m on.
1 N one, Slight or M oderateRanging from no dam age to non-structural dam age and
m inor structural dam age.

Table 3 A Comparison of Major Satellites for the Earth Observation
In this paper, we propose a method to estimate the building inventory based on the distribution pattern of four kinds of Digital Numbers obtained from IKONOS imergery with 50m grid as the basis for applying GESI method for any urban areas in developing countries with high seismic risk, There are two reasons for us to recommend this method. First, it is a common practice for any seismic risk assessment methods like GESI to make residential building damage estimation to uses 200 m or 250 m grid as the unit of a fine analysis. It is the grid size which determines the resolution of estimation. It is a mandate for IKONOS based building inventory to fit this requirement. In other words, there is no need to IKONOS imagery pixel by pixel. By establishing a proper grid size as the analysis unit would help reducing excess calculation. Second reason is the possibility of linking IKONOS based analysis wthose analyses done with LANSAT/TM. Before the introduction of IKONOS imagery, there have been developed many applications analyzing visual imageries obtained by LANDSAT/TM in the various of areas of earth observation such as vegetation and flooding. LANDSAT/TM gave us a set of three digital numbers (Red, Green, Blue) with resolution of 30 m grid. Taking these two reasons into account, it is our conclusion that 25 m grid or 50 m grid would be suitable as the basic unit for analysis. In this paper, we present the results obtained from the analysis using 50 m grid.
Figure 4 Conversion Of Bitmap Data With 50 M Grid Into Dn Distribution Pattern
Satellites Sensors Resolution OrbitIKONOS(America) R,G,B,NIR 1m 680km
HRV-XS 20mHRV-PMSS 80mTM 30mASTER 15-90mCERES
NOAA(America) AVHRR 1.1km 850km
EOS AM-1(America) 705km
LANDSAT(America) 700km
SPOT(France) 832km
50mGREEN
NEAR-INFRARED
50m
IKONOS
DN Distribution
BLUEBLUE
REDRED

DEVELOPMENT OF GRID-BASED BUILDING INVENTORY – A MARIKINA CASE STUDY Marikina City, Metro Manila, Philippines Marikina City is a bedroom community, located at the northeast of Metro Manila region in the Philippines. The city area is about 23 square kilometers, with a population of about 370,000. About 45 percent of the city is residential and about 13 percent is industrial; the remainder of the city is made up of public structures, commercial properties, open space, and streets. The Marikina River flows through the western part of the city, to the west of the river lies the West Valley Fault which may cause a 7.0 magnitude near-field earthquake. Damage risk assessments were preformed for this earthquake scenario. Seismic hazard information with horizontal peak ground acceleration was available as shown in Figure 5 because of the work done by Bartolome et al.2)3) , the Philippine Institute of Volcanology & Seismology (PHIVOLCS). The data consists of longitude, latitude, and PGA value.
Figure 5 Marikina City, Metro Manila, Philippines - A Case Study Site -
The building footprints data of Marikina City were also partially available from the National Mapping and Resource Information Authority (NAMRIA) of Philippines. NAMRIA created vector topographical map layers from aero-photo images taken in 1995. As one of these layers, a building shape polygon layer is included. This data were basically CAD data and no attribute data is attached, such as building story, structure, or households. Other GIS data such as road, barangay, river, and fault line were prepared as vector layers. However, as shown in Figure 5, building footprint data covers only a three quarter of Marikina city, there are no data available for a north-west side of the city.
Estimated PGA by PHIVOLCS
Learning FieldsLearning Fields

We estimated the building inventory of Marikina City using the following procedure: 1) The GIS-based 200-meter grid polygon layer was created for Peak Ground Acceleration; 2) Using the same grid unit, the number of building footprints was calculated for the area where
NAMRIA data are available. 3) Two learning fields were selected from the area where NAMRIA building footprint data are
available; the first learning field was located in the southest side of the city along with the Mrikina river with a size of 1600 m x 1600 m, and it was selected for reflecting the diversity of land cover in Marikina City. The second site was located in northwest side of the city with a size of 750 m x 750 m, and this was selected for reflecting the differences in housing density.
4) IKONOS DN distribution for each of four bands was calculated for each grid of learning fields, and then cluster analysis was performed to yield a classification schema of land use including residential area with different housing density as indicated in Figure 6. As a result, a total of 11 categories were identified.
Figure 6 Dengrograms for Land Cover Classification in Marikina City Grid-Based Land Cover Analysis and Building Density: Results from Learning Fields For each of 11 land cover categories obtained from two learning fields, the average of IKONOS DN distribution as well as the average number of buildings in each grid were obtained as summarized in Table 4 . Table 4 Grid-based Building Inventory Estimation Using IKONOS Parameters Obtained from Learning
Fields in Marikina City, Metro Manila, Philippines
Land Cover Categories Ground Images IKONOS DN Distributions
Number of Building
River River
0.08
RiverFactoryBareland
Greenland
Riverbank
Med2
Low3
High Med1
Low1
Low2

River bank
0.76
Bare land
0.97 Open Space
Green land
1.25
Factory
2.08
Low1
5.27
Low2
5.47
Low3
4.20
Residential/ Commercial
Med 1
10.86
Med 2
11.10
High
17.80
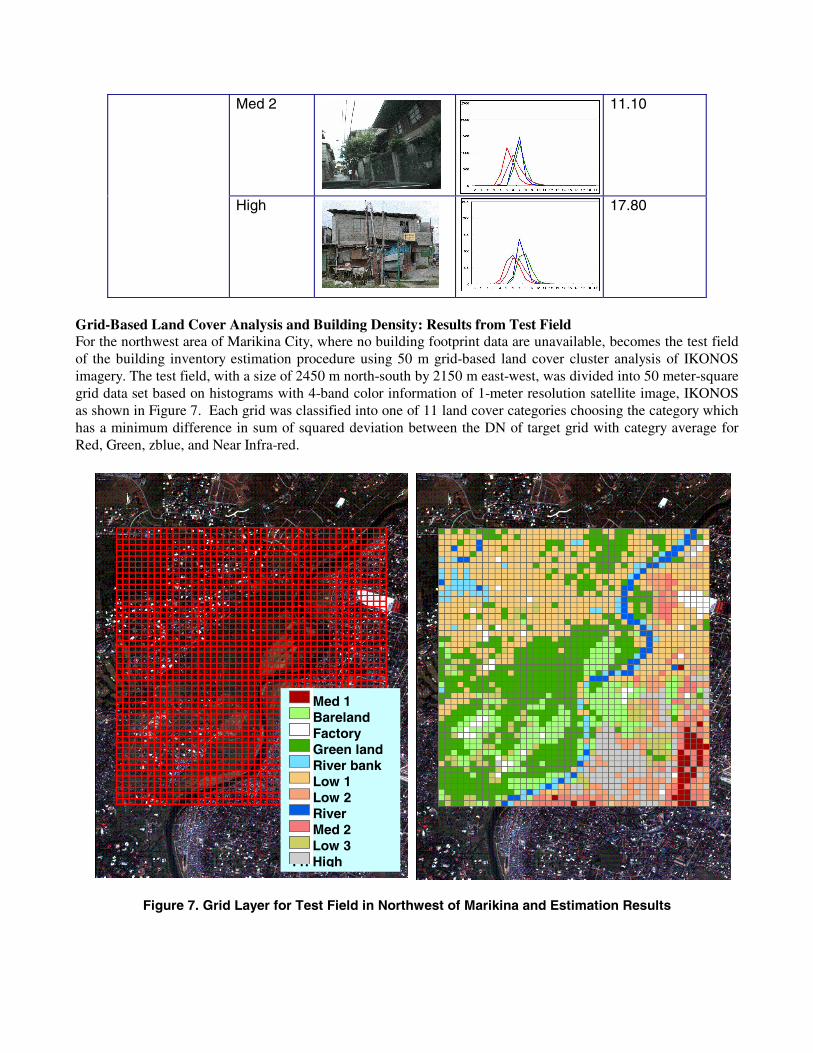
Grid-Based Land Cover Analysis and Building Density: Results from Test Field For the northwest area of Marikina City, where no building footprint data are unavailable, becomes the test field of the building inventory estimation procedure using 50 m grid-based land cover cluster analysis of IKONOS imagery. The test field, with a size of 2450 m north-south by 2150 m east-west, was divided into 50 meter-square grid data set based on histograms with 4-band color information of 1-meter resolution satellite image, IKONOS as shown in Figure 7. Each grid was classified into one of 11 land cover categories choosing the category which has a minimum difference in sum of squared deviation between the DN of target grid with categry average for Red, Green, zblue, and Near Infra-red.
Figure 7. Grid Layer for Test Field in Northwest of Marikina and Estimation Results
© Space Imaging LLC
1. Med 1 2. Bareland 3. Factory 4. Green land 5. River bank 6. Low 1 7. Low 2 8. River 9. Med 2 10. Low 3 11. High

As a final result, the number of buildings in the test field was estimated to be a total of 9215 as indicated in Table 5.
Table 5 Estimated Number of Buildings of Test Field
Land Cover Categories Number of Grid Identified
Land Cover % Estimated Number of Buildings
River 59 2.8 5 River Bank 559 26.5 699 Bare land 215 10.2 209 Green land 73 3.5 55 Factory 55 2.6 114 Low 1 643 30.5 3389 Low 2 143 6.8 782 Low 3 123 5.8 517 Med 1 39 1.9 424 Med 2 75 3.6 833 High 123 5.8 2189 Total 2107 100.0 9215
To assess the validity of estimation using test field, the number of estimated buildings using 11 categories system was compared the number of building footprints obtained from NAMRIA data set for those grids in the test field where NAMRIA data are available. As clearly shown in Figure 8, there is a high correlation between NAMRIA data and IKONOS estimation to inidicate a high validity of grid-based building inventory using IKONOS imagery4).
Figure 8 A High Correlation Indicating the validity of IKONOS Estimation

CONCLUSION IKONOS image was devided into 50 m grid to yield a distribution pattern of digital numbers obtained for Red, Green, Blue, and Near Infra-red. This data set was categorized into 11 land covers by cluster analysis. Using two learning fields, the the relationship between the each of land cover categories and the corresponding average number of building footprints were established. In an evaluation using a new test field revealed the validity of this procedure for the estimation of building inventory using IKONOS imagery. Applying this prcocedure with the GESI method developed by the UNRD can provide a seismic risk assessment about the residential damage in such seismically high risk area in developing countries where no building inventory data are available.
REFERENCES 1. GeoHazards International and UNCRD Disaster Management Planning Hyogo Office, Global Earthquake
Safety (GESI) Initiative Pilot Project. Final Report, 2001. 2. Bartolome C. Bautista, Ma. Leonila P. Bautista, Raymundo S. Punongbayan, Ishmael C. Narag and
Winchelle Ian G. Sevilla, “A Deterministic Ground Motion Hazard Assessment of Metro Manila, Philippines.” EDM Technical Report. Third Multi-lateral Workshop on Development of Earthquake and Tsunami Disaster Mitigation Technologies and their Integration for the Asia-Pacific region, 2001, No.11, pp. 323-342.
3. JICA, MMDA and PHIVOLCS. Earthquake Impact Reduction Study for Metropolitan Manila, Republic of the Philippines. Interim Report, 2003, Chapter 6.
4. Kouichi HASEGAWA, Haruo HAYASHI, Kenneth Topping, Norio MAKI, Shigeo TATSUKI, Michiko BANBA, Kei HORIE, Satoshi TANAKA, Keiko TAMURA and Manabu WATANABE. “DEVELOPMENT OF PARTICIPATORY SEISMIC RISK ASSESSMENT PROCEDURE THAT REFLECTS COMMUNITY NEEDS: A CASE REPORT FROM MARIKINA CITY, METRO MANILA, PHILIPPINES.” Proceedings of the 13th WCEE, Vancouver, Canada, 2004, Paper No. 2256.
ACKNOWLEDGEMENTS This project is the part of the Development of Earthquake and Tsunami Disaster Mitigation Technologies and Their Integration For the Asia-Pacific Region (EqTAP), Special Coordination Funds for Promoting Science and Technology sponsored by the Government of Japan. The authors deeply appreciate efforts made by Marikina City staff that supported us to carry out field survey to important structures and to offer GIS data.