development of novel electrode materials for li-ion ... · development of novel electrode materials...
TRANSCRIPT

FACULTY OF SCIENCE
Development of Novel Electrode Materials for Li-ion Batteries and Na-ion Batteries
This thesis is presented in fulfilment of the requirements for the degree of
DOCTOR OF PHILOSOPHY
of the
University of Technology, Sydney
By Dawei Su B. Eng., M. Eng.
2013

I
CERTIFICATE OF ORIGINAL AUTHORSHIP
I certify that the work in this thesis has not previously been submitted for a degree nor
has it been submitted as part of requirements for a degree except as fully acknowledged
within the text.
I also certify that the thesis has been written by me. Any help that I have received in my
research work and the preparation of the thesis itself has been acknowledged. In
addition, I certify that all information sources and literature used are indicated in the
thesis.
Dawei Su
II
ACKNOWLEDGEMENTS
I wish to express my deep appreciation for the encouragement, understanding,
invaluable advice and constant support of my supervsior, Prof. Guoxiu Wang, director
of Centre for Clean Energy Technology, during my study in University of Technology,
Sydney (UTS).
I also wish to thank A/Prof. Mike Ford, my co-supervisor, at the School of Physics and
Advanced Materials, A/Prof. Alison Ung, Dr. Ronald Shimmon and Dr. Linda Xiao,
Berry Liu from School of Chemistry and Forensic Science in UTS for their friendly
support and kind discussions during my study. I would like to give my thanks to Katie
McBean and Mark Berkahn from the Microstructural Analysis Unit in UTS for their
help on material characterization.
I am very grateful to Dr. David Wexler, Dr. Zhixin Chen from University of
Wollongong, and Prof. Paul Munroe from University of New South Wales, for
assistance with the TEM work, and A/Prof. Josip Horvat, in University of Wollongong
for spenting time with me on the magnetic measurements.
Special thanks go to Dr. Yueping (Jane) Yao for her support in many ways.
I wish to thank our group members: Dr. Hao Liu, Dr. Xiaodan Huang, Dr. Bing Sun, Mr.
Bei Wang, Ms. Ying Wang, Mr. Kefei Li, Mr. Jinqiang Zhang, Mr. Anjon Kumar
Mondal, Mr. Ali Reza Ranjbartoreh and Mr. Shuangqiang Chen.
I would like to thank the financial support provided by the Australian Research Council
(ARC) through the ARC linkage project.

III
Finally, I would like to thank my wife, Wenyuan Wu, my son, Siwen Su and my whole
family for their love, support, and encouragement during my PhD study. Their love is
the mental strength that supported me to fulfil my study abroad.
IV
LIST OF PUBLICATION
[1]. D. W. Su, M. Ford and G. X. Wang. Mesoporous NiO crystals with dominantly
exposed {110} reactive facets for ultrafast lithium storage. Scientific Reports
2:924 | DOI:10.1038/srep00924, (2012) (Nature Publishing Group: Impact factor
is not available until 2013.)
[2]. D. W. Su, H. J. Ahn and G. X. Wang. SnO2@graphene nanocomposites as anode
materials for Na-ion batteries with superior electrochemical performance.
Chemical Communications DOI: 10.1039/c3cc40448j. (Impact factor: 6.169)
[3]. D. W. Su, H. J. Ahn and G. X. Wang. Hydrothermal synthesis of α-MnO2 and β-
MnO2 nanorods as high capacity cathode materials for Na-ion batteries. Journal of
Materials Chemistry A DOI: 10.1039/c3ta00031a (Impact factor: 5.968)
[4]. D. W. Su, C. Y. Wang, H. J. Ahn and G. X. Wang. Single Crystalline Na0.7MnO2
Nanoplates as Cathode Materials for Sodium Ion Batteries with Enhanced
Performance. Chemistry-A European Journal Accepted (2013). (Impact factor:
5.925)
[5]. D. W. Su, J. Horvat, P. Munroe, H. Ahn, A. R. Ranjbartoreh and G. X. Wang.
Polyhedral Magnetite Nanocrystals with Multiple Facets: Facile Synthesis,
Structural Modelling, Magnetic Properties and Application for High Capacity
Lithium Storage. Chemistry-A European Journal 18, 488-497, (2012). (Impact
factor: 5.925)
[6]. D. W. Su, H. S. Kim, W. S. Kim and G. X. Wang. Mesoporous Nickel Oxide
Nanowires: Hydrothermal Synthesis, Characterisation and Applications for Li-ion
batteries and Supercapacitors with Superior Performance. Chemistry-A European
Journal 18, 8224-8229, (2012). (Impact factor: 5.925)
V
[7]. D. W. Su, H. S. Kim, W. S. Kim and G. X. Wang, A study of PtxCoy alloy
nanoparticles as cathode catalysts for lithium-air batteries with improved catalytic
activity. Journal of Power Sources, DOI:10.1016/j.jpowsour.2012.11.024 (2012)
(Impact factor: 4.951)
[8]. D. W. Su, H. J. Ahn and G. X. Wang, One-dimensional magnetite Fe3O4
nanowires as electrode material for Li-ion batteries with improved
electrochemical performance. Journal of Power Sources,
DOI:10.1016/j.jpowsour.2012.11.058 (2012) (Impact factor: 4.951)
[9]. D. W. Su, H. J. Ahn and G. X. Wang. Ab initio calculations on Li-ion migration
in Li2FeSiO4 cathode material with a P2(1) symmetry structure. Applied Physics
Letters, 99, 14909(1)-14909(3) (2011). (Impact factor: 3.844)
[10]. D. W. Su, H. S. Kim, W. S. Kim and G. X. Wang. Synthesis of tuneable porous
hematit (alpha-Fe2O3) for gas sensing and lithium storage in Li-ion batteries.
Microporous and Mesoporous Materials, 149, 36-45, (2012). (Impact factor:
3.285)
[11]. D. W. Su, H. J. Ahn and G. X. Wang. Octahedral Tin Dioxide Nanocrystals as
High Capacity Anode Materials for Na-ion Batteries. Physical Chemistry
Chemical Physics Accepted (2013). (Impact factor: 3.573)
[12]. D. W. Su, H. T. Fu, X. C. Jiang and G. X. Wang. ZnO nanocrystals with a high
percentage of exposed reactive facets for enhanced gas sensing
performance. Sensors & Actuators, B Chemical Accepted (2013). (Impact factor:
3.898)
[13]. D. W. Su, H. Liu, H. J. Ahn and G. X. Wang. Synthesis of Highly Ordered
Mesoporous Co3O4 for Gas Sensing. Journal of Nanoscience and Nanotechnology,
13, 3354-3359, (2013) (Impact factor: 1.563)
VI
[14]. D. W. Su, H. J. Ahn and G. X. Wang. β-MnO2 Nanorods with Exposed Tunnel
Structures as High Performance Cathode Materials for Sodium-ion Batteries. NPG
Asia Materials, Accepted, (2013) (Impact factor: 9.042)
[15]. H. Liu, D. W. Su, R. F. Zhou, B. Sun, G. X. Wang and S. Z. Qiao. Highly
Ordered Mesoporous MoS2 with Expanded Spacing of the (002) Crystal Plane for
Ultrafast Lithium Ion Storage. Advanced Energy Materials 2, 970-975, (2012).
[16]. H. Liu, D. W. Su, G. X. Wang and S. Z. Qiao. An ordered mesoporous WS2
anode material with superior electrochemical performance for Li-ion batteries.
Journal of Materials Chemistry 22, 17437-17440, (2012). (Impact factor: 5.968)
[17]. B. Wang, J. Park, D. W. Su, C. Y. Wang, H. J. Ahn and G. X. Wang.
Solvothermal synthesis of CoS2-graphene nanocomposite material for high-
performance supercapacitors. Journal of Materials Chemistry 22, 15750-15756,
(2012). (Impact factor: 5.968)
[18]. B. Sun, B. Wang, D. W. Su, L. D. Xiao, H. J. Ahn and G. X. Wang. Graphene
nanosheets as cathode catalysts for lithium-air batteries with an enhanced
electrochemical performance. Carbon 50, 727-733, (2012). (Impact factor: 5.378)
[19]. K. F. Li, B. Wang, D. W. Su, J. Park, H. J. Ahn and G. X. Wang. Enhance
electrochemical performance of lithium sulfur battery through a solution-based
processing technique. Journal of Power Sources 202, 389-393, (2012). (Impact
factor: 4.951)
[20]. Y. Wang, D. W. Su, C. Y. Wang and G. X. Wang. SnO2@ MWCNT
nanocomposite as a high capacity anode material for Na-ion batteries."
Electrochemistry Communications 29 (2013): 8-11. (Impact factor: 4.859)
[21]. B. Wang, K. F. Li, D. W. Su, H. J. Ahn and G. X. Wang. Superior
Electrochemical Performance of Sulfur/Graphene Nanocomposite Material for

VII
High-Capacity Lithium-Sulfur Batteries. Chemistry-an Asian Journal 7, 1637-
1643, (2012). (Impact factor : 4.5)
[22]. Y. Wang, D. W. Su, A. Ung, J. H. Ahn and G. X. Wang. Hollow CoFe2O4
nanospheres as a high capacity anode material for Li-ion batteries.
Nanotechnology 23, (2012). (Impact factor: 3.979)
[23]. B. Wang, D. W. Su, J. Park, H. J. Ahn and G.X. Wang, Graphene-supported SnO2
nanoparticles prepared by a solvothermal approach for an enhanced
electrochemical performance in Li-ion batteries, Nanoscale Reseach Letters 7:215
(2012). (Impact factor: 2.726)
[24]. H. T. Fu, X. C. Jiang, X. H. Yang, A. B. Yu, D. W. Su and G. X. Wang.
Glycothermal synthesis of assembled vanadium oxide nanostructures for gas
sensing. Journal of Nanoparticle Research 14, (2012). (Impact factor: 3.287)
[25]. Y. Wang, N. Sharma, D. W. Su, D. Bishop, H. J. Ahn and G. X. Wang. High
capacity spherical Li[Li0.24Mn0.55Co0.14Ni0.07]O2 cathode material for Li-ion
batteries. Solid State Ionics, Accepted on December 5, (2012) (Impact factor:
2.646)
[26]. A. R. Ranjbartoreh, D. W. Su and G. X. Wang,Consideration of Critical Axial
Properties of Pristine and Defected Carbon Nanotubes Under Compression.
Journal of Nanoscience and Nanotechnology 12, 5025-5029, (2012). (Impact
factor: 1.563)
[27]. A. K. Mondal, B. Wang, D. W. Su, Y. Wang, X. G. Zhang and G. X. Wang.
Preparation and Enhanced Electrochemical Performance of MnO2 Nanosheets for
Supercapacitors. Journal of the Chinese Chemical Society 59, 1275–1279, (2012)
(Impact factor: 0.678)
[28]. Y. Wang, D. W. Su and G. X. Wang. The effect of Carbon Coating on the

VIII
Electrochemical Performance of Nanosized Li2FeSiO4 Cathode Materials. the 2nd
International Advances in Applied Physics and Materials Science (APMAS 2012),
26th – 29th Apr. 2012, Antalya, Turkey.
[29]. A. K. Mondal, D. W. Su, Y. Wang, S. Q. Chen and G. X. Wang. Hydrothermal
synthesis of nickel oxide nanosheets for lithium-ion batteries and supercapacitors
with excellent performance. Chemistry - An Asian Journal DOI:
10.1002/asia.201300708, (2013) (Impact factor: 4.5)
[30]. A. K. Mondala, D. W. Su, Y. Wang, S. Q. Chen, Q. Liu and G. X. Wang.
Microwave hydrothermal synthesis of urchin-like NiO nanospheres as electrode
materials for lithium-ion batteries and supercapacitors with enhanced
electrochemical performances. Journal of Alloy and Compounds, DOI:
10.1016/j.jallcom.2013.08.085 (2013) (Impact factor: 2.39)

IX
RECEIVED AWARDS
[1]. 2012 Chinese Government Award for Outstanding Self-financed Students Abroad,
April 2013. ($ 6000 USD)
[2]. ARC Postgraduate Award (Industry) (APAI) April 2010
[3]. University of Wollongong International Postgraduate Tuition Fee Waiver Award
(UOW IPTA) April 2010
[4]. University of Technology, Sydney International Research Scholarship (UTS IRS)
June 2010
X
TABLE OF CONTENTS
CERTIFICATE OF ORIGINAL AUTHORSHIP ............................................................. I
ACKNOWLEDGEMENTS ............................................................................................. II
LIST OF PUBLICATION............................................................................................... IV
RECEIVED AWARDS ................................................................................................... IX
TABLE OF CONTENTS ................................................................................................. X
LIST OF FIGURES ..................................................................................................... XVI
LIST OF TABLES .................................................................................................... XXIX
ABSTRACT XXX
INTRODUCTION ................................................................................................. XXXIV
Background ........................................................................................................ XXXIV
Innovation of this doctoral study ........................................................................ XXXVI
Outline of this work ......................................................................................... XXXVIII
CHAPTER 1 LITERATURE REVIEW .......................................................................... 41
1.1 Electrolytes for Li-ion batteries ............................................................................. 42
1.1.1 Organic liquid electrolytes .............................................................................. 46
1.1.2 Ionic liquids .................................................................................................... 48
1.1.3 Inorganic liquid electrolytes ........................................................................... 49
1.1.4 Solid polymer electrolytes .............................................................................. 49
1.1.5 Inorganic solid electrolytes ............................................................................. 50
1.1.6 Hybrid electrolyte system ............................................................................... 50
1.2 Cathode materials for Li-ion batteries ................................................................... 51
1.2.1 Layered structure cathode materials ............................................................... 53
1.2.2 Polyanion-Based Positive Electrodes ............................................................. 67
1.2.3 Silicates ........................................................................................................... 80
1.3 Anode materials for Li-ion batteries ..................................................................... 85
1.3.1 Transition metal compounds based on the conversion reaction ..................... 85
1.3.2 Silicon and tin anode materials based on the alloying mechanism................. 99
1.4 Na-ion batteries ................................................................................................... 113
1.5 Cathode materials for Na-ion batteries ................................................................ 115
1.5.1 Layered oxides .............................................................................................. 115
1.5.2 Phosphates .................................................................................................... 122
XI
1.5.3 Olivine NaFePO4 .......................................................................................... 122
1.5.4 Sodium vanadium fluorophosphates ............................................................. 123
1.5.5 Sodium iron fluorophosphates ...................................................................... 125
1.5.6 NASICON-type materials ............................................................................. 127
1.6 Anodic materials for Na-ion batteries ................................................................. 128
1.6.1 Carbon materials ........................................................................................... 129
1.6.2 Low potential metal phosphates ................................................................... 131
1.6.3 Low potential sodium metal oxides .............................................................. 131
1.6.4 Alloys ............................................................................................................ 132
CHAPTER 2 EXPERIMENTAL METHODS .............................................................. 134
2.1 Overview ............................................................................................................. 134
2.2 Materials Preparation .......................................................................................... 135
2.2.1 Hydrothermal Method................................................................................... 136
2.2.2 Solid-state reaction ....................................................................................... 137
2.3 Structural and Physical Characterization Method ............................................... 138
2.3.1 X-ray Diffraction (XRD) .............................................................................. 139
2.3.2 Electron microscopy (EM)............................................................................ 140
2.4 Other physical characterization ........................................................................... 141
2.4.1 Optical property measurement ...................................................................... 141
2.4.2 Magnetic property measurement .................................................................. 142
2.4.3 Thermogravimetric Analysis (TGA) ............................................................ 143
2.4.4 N2 sorption measurement .............................................................................. 143
2.5 Electrode Preparation and Cell Assembly ........................................................... 144
2.6 Electrochemical measurement ............................................................................. 146
2.6.1 Cyclic Voltammetry ...................................................................................... 146
2.6.2 Galvanostatic Charge and Discharge ............................................................ 148
2.6.3 Electrochemical Impedance Spectroscopy (EIS) .......................................... 149
2.7 Computational methods ....................................................................................... 149
2.7.1 The choice of theory ..................................................................................... 150
2.7.2 Methods and models of calculation .............................................................. 152
CHAPTER 3 AB INITIO CALCULATIONS ON STRUCTURAL AND ELECTROCHEMICAL PROPERTIES OF Li2FeSiO4 FOR LI-ION BATTERIES ... 155
3.1 Abstract ............................................................................................................... 155
XII
3.2 Introduction ......................................................................................................... 155
3.3 Methods and models of calculation ..................................................................... 158
3.4 Results and discussion ......................................................................................... 161
3.4.1 Structural characteristics of Li2FeSiO4, LiFeSiO4 and FeSiO4..................... 162
3.4.2 Electrochemical properties ........................................................................... 170
3.5 Summary and conclusion .................................................................................... 185
CHAPTER 4 SYNTHESIS OF TUNEABLE POROUS HEMATITE ( -Fe2O3) FOR LITHIUM STORAGE IN LI-ION BATTERIES ......................................................... 187
4.1 Abstract ............................................................................................................... 187
4.2 Introduction ......................................................................................................... 187
4.3 Experimental Section .......................................................................................... 188
4.3.1 Synthesis of porous α-Fe2O3 ......................................................................... 189
4.3.2 Structural and physical characterisation ....................................................... 189
4.3.3 Electrochemical testing ................................................................................. 190
4.4 Results and discussion ......................................................................................... 191
4.4.1 Structural and morphological analysis .......................................................... 191
4.4.2 Electrochemical performance of porous α-Fe2O3 for lithium storage in Li-ion battery .................................................................................................................... 198
4.5 Conclusion ........................................................................................................... 204
CHAPTER 5 SYNTHESIS, STRUCTURE MODELLING, MAGNETIC PROPERTY AND ELECTROCHEMICAL APPLICATION OF POLYHEDRAL FACET MAGNETITE ............................................................................................................... 205
5.1 Abstract ............................................................................................................... 205
5.2 Introduction ......................................................................................................... 205
5.3 Experimental Section .......................................................................................... 207
5.4 Results and Discussion ........................................................................................ 210
5.4.1 Structure and morphological analysis ........................................................... 211
5.4.2 Optical and magnetic properties ................................................................... 219
5.4.3 Electrochemical performance of Fe3O4 nanocrystals for lithium storage in lithium ion cells ..................................................................................................... 225
5.5 Conclusion ........................................................................................................... 231
CHAPTER 6 PROPERTY OF 1-D Fe3O4 NANOWIRES AS ELECTRODE MATERIALS FOR LI-ION BATTERIES AND SUPERCAPACITORS ................... 232
6.1 Abstract ............................................................................................................... 232

XIII
6.2 Introduction ......................................................................................................... 232
6.3 Experimental ....................................................................................................... 234
6.3.1 Materials preparation .................................................................................... 234
6.3.2 Structural and magnetic characterization ...................................................... 235
6.3.3 Electrochemical testing ................................................................................. 235
6.4 Results and discussion ......................................................................................... 235
6.4.1 Structure and morphological analysis ........................................................... 235
6.4.2 Electrochemical performance ....................................................................... 239
6.5 Conclusions ......................................................................................................... 242
CHAPTER 7 NiO NANOWIRES AS ELECTRODE MATERIALS FOR LI-ION BATTERIES AND SUPERCAPACITORS ................................................................. 244
7.1 Abstract ............................................................................................................... 244
7.2 Introduction ......................................................................................................... 244
7.3 Experimental Section .......................................................................................... 246
7.3.1 Materials preparation .................................................................................... 246
7.3.2 Structural, optical and magnetic characterisation ......................................... 246
7.3.3 Electrochemical testing ................................................................................. 247
7.4 Results and Discussion ........................................................................................ 248
7.4.1 Structure and morphological analysis ........................................................... 248
7.4.2 Electrochemical performance of mesoporous NiO nanowires ..................... 256
7.5 Conclusion ........................................................................................................... 262
CHAPTER 8 MESOPOROUS NiO CRYSTALS AS ANODE MATERIALS FOR LITHIUM STORAGE .................................................................................................. 263
8.1 Abstract ............................................................................................................... 263
8.2 Introduction ......................................................................................................... 263
8.3 Methods ............................................................................................................... 265
8.3.1 Synthesis of facet Ni(OH)2 crystals and mesoporous faceted NiO crystals . 265
8.3.2 Structural and physical characterization ....................................................... 265
8.3.3 Electrochemical testing ................................................................................. 266
8.3.4 Computational methods ................................................................................ 267
8.4 Results ................................................................................................................. 268
8.4.1 Characterization of Ni(OH)2 crystals and mesoporous faceted NiO crystals ............................................................................................................................... 268

XIV
8.4.2 Crystal growth mechanism ........................................................................... 274
8.4.3 Electrochemical properties of mesoporous NiO crystals for lithium storage in Li-ion batteries ....................................................................................................... 276
8.5 Discussion ........................................................................................................... 278
8.6 Conclusion ........................................................................................................... 286
CHAPTER 9 HYDROTHERMALLY SYNTHESIZED α- AND β-MnO2 NANORODS AS CATHODE MATERIALS FOR NA-ION BATTERIES ....................................... 287
9.1 Abstract ............................................................................................................... 287
9.2 Introduction ......................................................................................................... 287
9.3 Experiment .......................................................................................................... 289
9.3.1 Materials Synthesis ....................................................................................... 289
9.3.2 Structural and physical characterization ....................................................... 290
9.3.3 Electrochemical testing ................................................................................. 290
9.4 Results and discussion ......................................................................................... 292
9.5 Conclusions ......................................................................................................... 306
CHAPTER 10 SnO2@GRAPHENE NANOCOMPOSITES AS ANODE MATERIALS FOR NA-ION BATTERY ............................................................................................ 308
10.1 Abstract ............................................................................................................. 308
10.2 Introduction ....................................................................................................... 308
10.3 Experiment details ............................................................................................. 310
10.3.1 Synthesis ..................................................................................................... 310
10.3.2 Structural and physical characterization ..................................................... 311
10.3.3 Electrochemical testing ............................................................................... 311
10.4 Results and discussion ....................................................................................... 312
10.5 Conclusion ......................................................................................................... 323
CHAPTER 11 CONCLUSION AND OUTLOOK ....................................................... 324
11.1 General Conclusion ........................................................................................... 324
11.1.1 Ab initio calculations on structural and electrochemical properties of Li2FeSiO4 cathode material for Li-ion batteries .................................................... 324
11.1.2 Nanostructure Iron oxide (hematite and magnetite) as Anode Materials for Li-ion batteries ....................................................................................................... 325
11.1.3 Nanostructure Nickel oxide as Anode Materials for Li-ion batteries ......... 327
11.1.4 Polymorphs MnO2 Nanorods as Cathode for Na-ion batteries ................... 328
11.1.5 SnO2@graphene Nanocomposites as Anode Materials for Na-ion Battery 328

XV
11.2 Outlook .............................................................................................................. 329
REFERENCES .............................................................................................................. 332
APPENDIX: LIST OF ABBREVIATIONS ................................................................. 399
XVI
LIST OF FIGURES
Figure 1-1 A schematic illustration of a Li-ion battery during discharge. ...................... 41
Figure 1-2 Schematic open-circuit energy diagram of electrolyte. Eg is the window of
electrolyte thermodynamic stability. A μA > LUMO and/or a μC < HOMO requires a the
formation of an SEI layer for kinetic stability.33 ............................................................. 43
Figure 1-3 Crystal structure of TiS2 and lithiated LiTiS2. .............................................. 53
Figure 1-4 Crystal structure of LiCoO2, (a) depicted along a axis and (b) see along c
axis. ................................................................................................................................. 55
Figure 1-5 Crystal structure of LiFePO4 (a) see along c axis and (b) see along b axis. .. 68
Figure 1-6 OCV curves measured for LixFePO4 with various mean particles sizes of 200,
80, and 40 nm, showing the particle size dependence of the room-temperature
miscibility gap.235 ............................................................................................................ 73
Figure 1-7 Crystal structure of Li3M2(XO4)3. ................................................................. 78
Figure 1-8 Crystal structure of pyrophosphate (Li2FeP2O7). .......................................... 79
Figure 1-9 Crystal structure of Li2FeSiO4 based on P21 symmetry with a monoclinic
super cell. ........................................................................................................................ 83
Figure 1-10 Crystal structure of the polymorph MnO2 (a) α-MnO2, (b) β-MnO2, and (c)
γ-MnO2. ........................................................................................................................... 89
Figure 1-11 Most important cathode and anode materials studied for their application in
Na-ion batteries, represented by their specific capacity and operating voltage vs. a
sodium metal anode....................................................................................................... 115
Figure 1-12 Galvanic cycling of Na0.7CoO2, showing phase transitions on
electrochemical cycling. Close up of the region between Na0.7CoO2 and Na0.85CoO2
shown in right inset. Structure of Na0.7CoO2 shown in left inset.610 ............................. 117
XVII
Figure 1-13 Structure of Na0.44MnO2 perpendicular to the ab plane.622 ....................... 120
Figure 1-14 Crystal structure of Na3(VO)2(PO4)2F.636 .................................................. 124
Figure 2-1 Flow chart of the research strategy in this thesis......................................... 134
Figure 2-2 Photograph of the equipment used in this thesis. ........................................ 135
Figure 2-3 Instruments for the characterization of the as-prepared materials used in this
thesis. a is XRD, b is SEM, c is EDS, d and e are the TEM, f is FT-IR, g is TGA, h is
UV-Vis, i is SQUID, and j is N2 adsorption/desorption instrument. ............................ 139
Figure 2-4 Schematic diagram of the CR2032 coin type cell configuration................. 144
Figure 2-5 Photographs of (a) glove box, (b) CHI instrument, (c) Neware battery test
system. ........................................................................................................................... 145
Figure 2-6 Schematic diagram of the Swagelog-type cell configuration. ..................... 146
Figure 3-1 The structure of P21 symmetry with a monoclinic super cell...................... 158
Figure 3-2 Corner-shared FeO4 and SiO4 in (a) the P21 structure model of Li2FeSiO4
and (b) the Pnma structure model. ................................................................................ 159
Figure 3-3 Optimized crystal structures of (a) P21 Li2FeSiO4, its derivative (b) LiFeSiO4
and (c) FeSiO4. .............................................................................................................. 165
Figure 3-4 Simulated powder diffraction pattern of P21 (upper red line) and Pnma
(bottom black line) structure Li2FeSiO4. ....................................................................... 169
Figure 3-5 Calculated average intercalation voltage in LixFeSiO4 for intervals 0 ≤ x ≤ 2.
....................................................................................................................................... 173
Figure 3-6 Density of states (DOS) for Li2FeSiO4 LiFeSiO4 and FeSiO. The Fermi level
is indicated by a vertical dot line................................................................................... 174
Figure 3-7 Partial density of states (PDOS) for (a) Li2FeSiO4, (b) LiFeSiO4 and (c)
FeSiO4. .......................................................................................................................... 175
XVIII
Figure 3-8 Li-vacancy migration pathways in the (a) Li2FeSiO4 and (b) LiFeSiO4
structure. Different Li ion marked by number and position.......................................... 177
Figure 3-9 Calculated migration energies for Li-vacancy migration in the lithiated
Li2FeSiO4 system along different pathways: (a) pathway A, (b) pathway B, (c) pathway
C1 and (d) pathway C2, the insets are corresponding local structures marked in the
curved trajectory between Li sites................................................................................. 179
Figure 3-10 Calculated migration energies for Li-vacancy migration in the delithiated
LiFeSiO4 system along different pathways: (a) pathway A’, (b) pathway B’ and (c)
pathway C’, the insets are corresponding local structures marked in the curved
trajectory between Li sites. ........................................................................................... 181
Figure 4-1 X-ray diffraction patterns of the as-prepared α-Fe2O3 powders before(Ι) and
after being etched for different time durations: 3.5 h (ΙΙ), 4.5 h (ΙΙΙ), 5.5 h (ΙV) and the
commercial Fe2O3 together with the standard pattern (JCPDS card no. 33-0664). ...... 190
Figure 4-2 FESEM images of the porous α-Fe2O3 particles before (a) and after being
etched for different time durations: (b) 3.5 h, (c) 4.5 h, and (d) 5.5 h. The insets are the
magnified images of the corresponding sample. ........................................................... 191
Figure 4-3 TEM and HRTEM images of the porous α-Fe2O3 particles before (a) and
after being etched for different time durations: (b) 3.5 h, (c) 4.5 h, (d) 5.5 h. The insets
in (a), (b), and (c) are the magnified images of the corresponding area marked by
rectangles. The right and left corner insets in (d) are corresponding selected area
diffraction pattern and the lattice resolved HRTEM image respectively. ..................... 194
Figure 4-4 N2 sorption isotherms of porous α-Fe2O3 after etched (a) 0h, (b) 3.5 h, (c) 4.5
h and (d) 5.5 h. The insets show the corresponding respective pore size distributions and
the BET surface area values are all listed in the figures. .............................................. 195

XIX
Figure 4-5 UV-visible absorption spectra of (a) as-prepared α-Fe2O3 nanoparticles and
(b) the porous α-Fe2O3 material etched for 5.5 h. The insets in the upper right and lower
left corners are the plot of transformed Kubelka-Munk function vs the energy of light
and digital photos of sample solutions (10-3 mol L-1), respectively. ............................. 196
Figure 4-6 Voltage-capacity profiles of (a) commercial α-Fe2O3, (b) pristine porous α-
Fe2O3, (c) 5.5 h etched porous α-Fe2O3 and its corresponding differential capacity vs.
voltage plot (d). ............................................................................................................. 198
Figure 4-7 Cycling performance at the 50 mA g-1 current density for (a) as prepared
pristine porous α-Fe2O3 and (b) 5.5 h etched porous α-Fe2O3. ..................................... 200
Figure 4-8 The second discharge voltage profiles of the electrode made of 5.5 h etched
porous α-Fe2O3 at different current densities. The insert is the discharge capacity at
different current densities. ............................................................................................. 201
Figure 4-9 Cycling stability of porous α-Fe2O3 (etched for 5.5 h) electrode at various
current densities. ........................................................................................................... 202
Figure 4-10 A.c impedance spectra of 5.5 h etched porous α-Fe2O3 in freshly assembled
test cell and after 5 cycles. All cells were discharged to 0.01 V and measured in
frequency range from 0.01 Hz to 100 kHz. ................................................................... 203
Figure 5-1 (a) X-ray diffraction pattern of the magnetite nanocrystals. The calculated
pattern and the fitting residual difference of the Rietveld refinement are also represented
(b) Crystal structure of the unit cell of Fe3O4, showing the tetrahedral iron
(corresponding Fe1), octahedral iron (corresponding Fe2) and oxygen (red) ions....... 211
Figure 5-2 Side and top views of the relaxed (a) (100), (b) (101), and (c) (111) surfaces
of Fe3O4 nanocrystals. The growth slices are demarcated by dotted-dashed lines. ...... 214
Figure 5-3 FESEM images of the as-prepared Fe3O4 nanocrystals: (a) low magnification
and (b) high magnification SEM images, showing multifacet morphology of the Fe3O4

XX
nanocrystals. (c) A SEM view of a single magnetite crystal, in which the visible facets
have been labelled. (d) Simulated polyhedral crystal with multiple facets. .................. 216
Figure 5-4 (a) – (c): TEM images of Fe3O4 nanocrystals at different magnifications. (d)
– (f): Lattice resolved high resolution TEM images of Fe3O4 nanocrystals. The inset in
(a) is a selected area electron diffraction ring pattern taken from many nanocrystals. The
insets in (b), (c) and (d) are SAED patterns taken on individual nanosryctals along
different zone axis. ........................................................................................................ 217
Figure 5-5 UV-Vis absorption spectrum of the as-prepared Fe3O4 nanocrystals. The
insets in the top right and left corners are the plots of transformed Kubelka-Munk
function vs. the energy of light and optical photo of sample solution (10-3 mol L-1),
respectively. .................................................................................................................. 218
Figure 5-6 Zero-field cooled (ZFC), field-cooled upon cooling (FCC) and field-cooled
upon warming (FCW) magnetic moment for nano-size Fe3O4 single crystals. Constant
magnetic field was 100 Oe (a) and 1 T (b). Inset of (a): FCC moment subtracted from
FCW moment for the two samples, showing that the difference between FCW and FCC
moments builds up almost entirely at the temperatures of spin freezing. ..................... 219
Figure 5-7 (a) Temperature dependence of the difference between the ZFC moment
measured after a pause of the initial cooling of the sample at Tstop for 7200 s and the
reference ZFC moment, measured without the pause in the initial cooling; and (b)
magnetic hysteresis loops measured at 10, 50 and 300 K. ............................................ 223
Figure 5-8 (a) Voltage-capacity profiles of as-prepared nano-size Fe3O4 nanocrystal
electrode cycled at the current density of 50 mA g-1. (b) The corresponding differential
capacity vs. voltage. ...................................................................................................... 225
Figure 5-9 Voltage-capacity profiles of the as-prepared Fe3O4 nanocrystals at different
current densities: (a) 100 mA g-1, (b) 200 mA g-1, (c) 400 mA g-1, (d) 1000 mA g-1. .. 227

XXI
Figure 5-10 Comparison of charge and discharge voltage profiles in the 1st cycle of at
different current densities. The inset is the specific capacity at different current densities.
....................................................................................................................................... 227
Figure 5-11 Cycling performance of the as-prepared Fe3O4 nanocrystals at different
current densities. ........................................................................................................... 229
Figure 5-12 Cycling stability of the as-prepared Fe3O4 nanocrystal electrode at varied
current densities. ........................................................................................................... 229
Figure 5-13 A. C. impedance spectra of as-prepared Fe3O4 in freshly assembled test cell
and after 5 cycles test cell. All cells were discharged to 0.01 V and measured in
frequency range from 0.01 Hz to 100 kHz. ................................................................... 230
Figure 6-1 Rietveld refinement pattern of X-ray diffraction data for the Fe3O4 nanowires;
the observed and calculated intensity are represented by purple solid circle markers and
blue solid lines respectively. The bottom black line shows the fitting residual difference.
Bragg positions for Fe3O4 are represented as light green tick marks. ........................... 236
Figure 6-2 FESEM images of the as-prepared Fe3O4: (a), (b) low magnification, (c) and
(b) high magnification. .................................................................................................. 237
Figure 6-3 TEM images of Fe3O4 nanowires at different magnifications. (a), (b) low
magnification, (c) high magnification and (d) Lattice resolved high resolution TEM
images of Fe3O4 nanowires. The inset in (c) is a selected area electron diffraction
patterns taken from marked area. .................................................................................. 238
Figure 6-4 (a) Voltage-capacity profiles of as-prepared nano-size Fe3O4 nanowires
electrode cycled at the current density of 50 mA g-1. (b) The corresponding differential
capacity vs. voltage. ...................................................................................................... 239
Figure 6-5 Cycling performance at the current density of 50, 100, and 500 mA g-1. ... 241

XXII
Figure 6-6 Cycling stability at various current density for as-prepared Fe3O4 nanowires.
....................................................................................................................................... 242
Figure 7-1 FESEM images of (a) the as-prepared NiC2O4·2H2O precursor nanowires,
and (b) NiO nanowires. ................................................................................................. 249
Figure 7-2 High magnification FESEM images of the as-prepared NiC2O4·2H2O
precursor nanowires. ..................................................................................................... 250
Figure 7-3 XRD patterns of (a) the NiC2O4·2H2O precursor nanowires, and (b) NiO
nanowires obtained by annealing treatment. ................................................................. 250
Figure 7-4 (a) Low magnification TEM image of NiC2O4·2H2O precursor nanowires. (b)
A NiO nanowire, (c) High magnification TEM image of a NiO nanowire, The inset is
the SAED pattern. and (d) Lattice resolved HRTEM image of NiO nanocrystals. ...... 251
Figure 7-5 Selected area electron diffraction patterns on the NiC2O4·2H2O nanowires
and (b) Lattice resolved HRTEM image on the individural NiC2O4·2H2O nanowire... 252
Figure 7-6 TG/DTA curves of the NiC2O4·2H2O precursor nanowires. ...................... 253
Figure 7-7 FTIR spectrums of the NiC2O4·2H2O and NiO nanowires. ........................ 254
Figure 7-8 N2 sorption isotherms of mesoporous NiO nanowires. The inset shows the
corresponding respective pore size distributions. ......................................................... 255
Figure 7-9 The CV curves of the as-prepared NiO nanowires as anode for lithium ion
cell. ................................................................................................................................ 256
Figure 7-10 (a) Discharge and charge profiles of NiO nanowire electrodes. (b) Cycling
performance and coulombic efficiency at 100 mA g-1 current density. ........................ 257
Figure 7-11 Rate performance of the NiO nanowire electrode at different current
densities. ........................................................................................................................ 258

XXIII
Figure 7-12 A.C. impedance spectra of the as-prepared mesoporous NiO nanowire
electrode before cycling and after 3 cycles. The a.c. impedance spectra were measured
at the discharged state of 0.01 V in frequency range from 0.01 Hz to 100 kHz. .......... 259
Figure 7-13 (a) Cyclic voltammetry of the as-prepared mesoporous NiO nanowires as
electrodes in supercapacitors at different scanning rates, (b) Specific capacitance of NiO
electrodes at different scanning rate. ............................................................................. 261
Figure 8-1 Ni(OH)2 crystals. (a) A low magnification FESEM image of Ni(OH)2 faceted
crystals. (b) A high magnification FESEM image of Ni(OH)2 faceted crystals, showing
hexagonal platelet shape. (c) The side view of a Ni(OH)2 crystal, from which the
thickness can be determined. (d) TEM image of faceted Ni(OH)2 crystal. The insets of
(b) and (c) are the corresponding simulated model of the faceted crystals. The inset in (d)
shows the SAED pattern along the [111] zone axis. ..................................................... 268
Figure 8-2 Rietveld refinement pattern of X-ray diffraction data for Ni(OH)2 crystals.
The observed and calculated intensity are represented by red solid circle and blue solid
line, respectively. The bottom purple line shows the fitting residual difference. Bragg
positions are represented as light green tick. ................................................................ 269
Figure 8-3 The simulated geometrical model of the facet Ni(OH)2 nanoplatelet indexed
with the different enclosed facets. ................................................................................. 270
Figure 8-4 Morphology and Phase analysis of NiO mesoporous crystals. (a) and (b)
FESEM images of NiO faceted crystals. (c) Rietveld refinement pattern of X-ray
diffraction data of NiO crystals, the observed and calculated intensity are represented by
red solid circle and blue solid line, respectively. The bottom purple line shows the
fitting residual difference. Bragg positions are represented as light green tick. (d) N2
sorption isotherms of mesoporous faceted NiO crystals. The inset shows the pore size
distributions. .................................................................................................................. 271

XXIV
Figure 8-5 Structure analysis of NiO mesoporous crystals. (a) and (b) are TEM images
of individual NiO faceted crystals. (c) Lattice resolved HRTEM image of NiO crystals.
(d) Schematic diagram of crystal structure of as-prepared NiO faceted crystals. Insets in
(a) and (b) are SAED along the [110] zone axis. .......................................................... 272
Figure 8-6 Schematic illustration of the formation mechanism of facet Ni(OH)2 single
crystal and mesoporous facet NiO crystals. .................................................................. 274
Figure 8-7 Schematics to introduce the mechanism through which the hexagonal
Ni(OH)2 nanoplatelets is converted into NiO nanoplatelets while maintaining the single
crystal feature. The crystal mismatch between Ni(OH)2 and NiO is small from the
calculation based on the crystal planes of (10 ), (0 1), and (1 0) in Ni(OH)2 and (1 1),
(1 ), and (002) in NiO. And the interfacial angles between each other of these crystal
planes of these two crystals are similar. Formation of mesopores in NiO nanoplatelets
can compensate the gas emission after Ni(OH)2 nanoplatelets is calcined at 500 °C, and
is favorable for maintaining single crystallinity throughout the chemical conversion
process. .......................................................................................................................... 274
Figure 8-8 The first ten cycles CV curves of the mesoporous NiO crystals as anode for
lithium ion cell. ............................................................................................................. 276
Figure 8-9 Electrochemical characterizations. (a) Discharge and charge profiles of
mesoporous NiO crystals at 1 C current rate. (b) Cycling performance of mesoporous
NiO crystals at 1 C current rate. The inset of (b) shows the Coulombic efficiency. (c)
Discharge capacity vs. cycle number of mesoporous NiO crystals at high current rates of
10 C, 20 C, and 40 C. The inset shows discharge capacity in the initial 10 cycles. (d)
The rate performance of mesoporous NiO crystals at varied current rates. .................. 277
XXV
Figure 8-10 (a) The unit cell of Ni(OH)2 crystal, and side views of relaxed (b) {100}, (c)
{111}, (d) {110}, (e) {112}, (f) {113}, (g) {101}, and (h) {121} crystal planes of
Ni(OH)2. ........................................................................................................................ 279
Figure 8-11 (a) The unit cell of NiO crystal, and side views of relaxed (b) {113}, (c)
{100}, (d) {110}, and (e) {101} crystal planes of NiO. ............................................... 280
Figure 8-12 structural and morphological changes of mesoporous NiO facet crystals
during the charge and discharge processes. TEM images and SAED patterns of NiO
electrodes taken from fully discharged states (a)-(c) and fully charged states (d)-(f) in
the first cycle, fully discharged (g)-(i) and fully charged (j)-(l) states after 100 cycles.
(a), (d), (g), and (j) show bright-field TEM images of individual NiO crystals at
different stages of the reduction and oxidation processes. (b), (e), (h), and (k) are the
corresponding SAED patterns. (c), (f), (i), and (l) are the lattice resolved TEM images at
various stages of the reduction and oxidation processes. The inset in (d) is the magnified
TEM image of a NiO facet crystal. The insets in (f) and (l) are the corresponding FFT
images. .......................................................................................................................... 282
Figure 8-13 SEM images of NiO electrodes taken from fully charged state at (a) 0.5 C
current rate after 100 cycles, (b) 10 C current rate after 1000 cycles, and (c) 40 C
current rate after 1000 cycles. ....................................................................................... 284
Figure 9-1 (a) X-ray diffraction patterns of α-MnO2 nanorods (wine in color), β-MnO2
nanorods (blue in color). The black and green solid lines are simulated diffraction
patterns based on the refined crystal structure of α-MnO2, (b) The crystal structure of α -
MnO2 along the [001] direction, (c) The crystal structure of β-MnO2 along the [001]
direction......................................................................................................................... 292

XXVI
Figure 9-2 N2 absorption isotherms of α-MnO2 nanorods (a) and β-MnO2 nanorods (b).
Insets are their corresponding pore size distributions derived from absorption hysteresis
of Brunauer-Emmett-Teller (BET) surface area measurement. .................................... 294
Figure 9-3 (a) and (c) are Low magnification FESEM images of α-MnO2 nanorods, and
β-MnO2 nanorods, respectively. (b) and (d) are high magnification FESEM images of α-
MnO2 nanorods and β-MnO2 nanorods, showing the cross section of nanorods. ......... 295
Figure 9-4 Low magnification TEM images of a free standing α-MnO2 nanorod (a1) and
β-MnO2 nanorod (b1). (a2) and (b2) are high magnification TEM images taken from
rectangular regions in (a1) and (b1) The inset images in (a2) and (b2) are their
corresponding selected area electron diffraction spot patterns (SAED). (a3) and (b3) are
geometrical models of α-MnO2 and β-MnO2 nanorods, in which different colours
present different crystal planes. Lattice resolved HRTEM images of α-MnO2 nanorod
(a4) and β-MnO3 nanorod (b4). Left bottom inset images in (a4) and (b4) are their
corresponding Fast-Fourier-Transform (FFT) patterns. The middle insets in (a4) and (b4)
simulate [111] projection of tetragonal α-MnO2 crystal structure and [110] projection of
tetragonal β-MnO2 crystal structure, respectively (Mn and O marked as purple and red
in colour). ...................................................................................................................... 296
Figure 9-5 Low (a) and medial (b) magnification TEM images of α-MnO2 nanorods. c.
A single α-MnO2 nanorod with the [021] projected direction, in which the (111) and
( 10) crystal planes are marked. And d is its corresponding SAED patterns which can
be indexed along the [021] zone axis of tetragonal α-MnO2. ....................................... 297
Figure 9-6 Low (a) and medial (b) magnification TEM images of β-MnO2 nanorods. c.
A single β-MnO2 nanorod with the [010] projected direction in which the (110) and
( 10) crystal planes are marked. And d is its corresponding SAED patterns which can
be indexed along the [010] zone axis of tetragonal β-MnO2. ....................................... 298
XXVII
Figure 9-7 The discharge and charge profiles of α-MnO2, and β-MnO2 nanorods in 1st
and 2nd cycles. Current density: 20 mA g-1. .................................................................. 300
Figure 9-8 The 1-5 cycles CV curves of the α-MnO2 nanorods and β-MnO2 nanorods
cathodes for sodium ion cells. ....................................................................................... 301
Figure 9-9 (a) Cycling performances of α-MnO2 and β-MnO2 nanorod electrodes at the
current density of 20 mA g-1. (b) Discharge capacity vs. cycle number of the β-MnO2
nanorod electrode at high current densities of 50, 100, 200, 400, and 800 mA g-1. ..... 302
Figure 9-10 Discharge capacity vs. cycle number of α-MnO2 nanorods at high current
densities of 50, 100, and 200 mA g-1. ........................................................................... 303
Figure 9-11 The Nyquist plots of α-MnO2 nanorods (a) and β-MnO2 nanorods (b) in
freshly assembled test cell and after 5 cycles test cell in the frequency range between
100k and 10m Hz at room temperature. ........................................................................ 304
Figure 9-12 TEM images of α-MnO2 (a) and β-MnO2 (b) nanorods electrodes after 100
cycles testing. ................................................................................................................ 305
Figure 9-13 Schematic illustration of the crystal structure of β-MnO2 nanorods (a) along
the [001] direction, (b) along the [110] direction, (c) along the [1 0] direction. (b) and
(c) illustrate Na ions insert and extract in the tunnels of β-MnO2 nanorods. The Mn, O,
and Na were colored in purple, red and blue respectively. ........................................... 306
Figure 10-1 (a). XRD patterns of bare graphene, bare SnO2, and SnO2@graphene
nanocomposite. (b). FESEM image of SnO2@graphene nanocomposite. .................... 312
Figure 10-2 a and b are low magnification FESEM images of SnO2@graphene
nanocomposites. c and d are high magnification FESEM images of SnO2@graphene
nanocomposites. ............................................................................................................ 313
Figure 10-3 (a). Low magnification TEM image of SnO2@graphene nanocomposites. (b)
and (c) are typical TEM images of single octahedral SnO2 nanocrystals projecting from

XXVIII
[110] and [001] directions, respectively. (d) is lattice resolved HRTEM image taken
from the rectangular area marked in (b). The inset in (a) is selected area electron
diffraction (SAED) pattern. Right bottom inset in (b) and right top inset in (c) are the
corresponding geometric models. The left top inset in (b) is the SAED pattern. The left
bottom inset in (c) is the Fast-Fourier-Transform (FFT) pattern. ................................. 314
Figure 10-4 TG/DTA curves of SnO2@graphene nanocomposites. ............................. 316
Figure 10-5 (a) 1st and 2nd cycles discharge and charge profiles of bare graphene, bare
SnO2, and SnO2@graphene nanocomposites at 20 mA g-1 current density. (b) Cycling
performance of bare graphene, bare SnO2, and SnO2@graphene nanocomposites at 20
mA g-1 current density. (c) Cycling performance of SnO2@graphene nanocomposites at
current densities of 40, 80, 160, 320, and 640 mA g-1. (d) The rate performance of
SnO2@graphene nanocomposites at varied current densities. (b-d) are recorded from the
2nd cycle. ........................................................................................................................ 317
Figure 10-6 The 1st, 2nd 5th, 20th, 50th, and 100th cycles discharge and charge profiles of
SnO2@graphene nanocomposites at 40 mA g-1. ........................................................... 319
Figure 10-7 Cycling performance of bare SnO2 (a) and graphene (b) at current densities
of 40, 80, 160, 320, and 640 mA g-1,which are recorded from the 2nd cycle. ............... 319
Figure 10-8 (a) Low magnification, (b) medium magnification, and (c) high
magnification SEM images of SnO2@graphene nanocomposites electrodes taken from
fully charged state at 20 mA g-1 current rate after 100 cycles. ..................................... 321
Figure 10-9 (a) Low magnification, (b) medium magnification, and (c) high
magnification SEM images of bare SnO2 nanoparticles electrodes taken from fully
charged state at 20 mA g-1 current rate after 100 cycles. .............................................. 322
XXIX
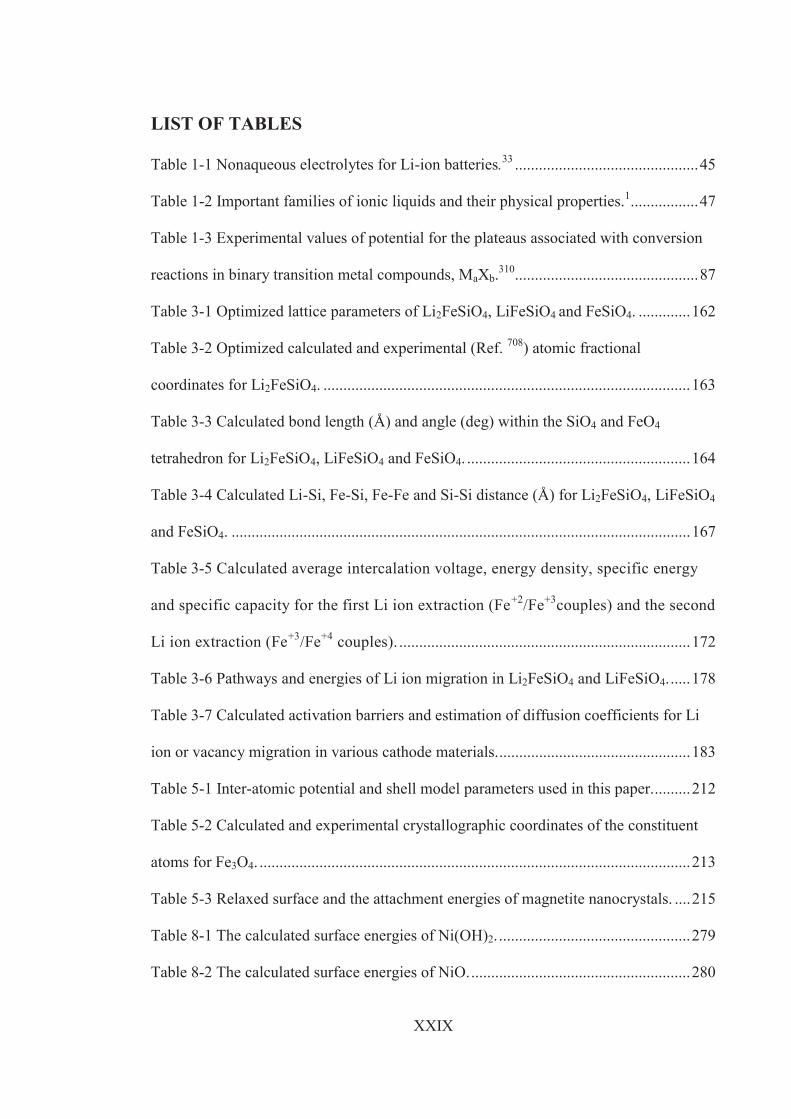
LIST OF TABLES
Table 1-1 Nonaqueous electrolytes for Li-ion batteries.33 .............................................. 45
Table 1-2 Important families of ionic liquids and their physical properties.1 ................. 47
Table 1-3 Experimental values of potential for the plateaus associated with conversion
reactions in binary transition metal compounds, MaXb.310 .............................................. 87
Table 3-1 Optimized lattice parameters of Li2FeSiO4, LiFeSiO4 and FeSiO4. ............. 162
Table 3-2 Optimized calculated and experimental (Ref. 708) atomic fractional
coordinates for Li2FeSiO4. ............................................................................................ 163
Table 3-3 Calculated bond length (Å) and angle (deg) within the SiO4 and FeO4
tetrahedron for Li2FeSiO4, LiFeSiO4 and FeSiO4. ........................................................ 164
Table 3-4 Calculated Li-Si, Fe-Si, Fe-Fe and Si-Si distance (Å) for Li2FeSiO4, LiFeSiO4
and FeSiO4. ................................................................................................................... 167
Table 3-5 Calculated average intercalation voltage, energy density, specific energy
and specific capacity for the first Li ion extraction (Fe+2/Fe+3couples) and the second
Li ion extraction (Fe+3/Fe+4 couples). ......................................................................... 172
Table 3-6 Pathways and energies of Li ion migration in Li2FeSiO4 and LiFeSiO4. ..... 178
Table 3-7 Calculated activation barriers and estimation of diffusion coefficients for Li
ion or vacancy migration in various cathode materials. ................................................ 183
Table 5-1 Inter-atomic potential and shell model parameters used in this paper. ......... 212
Table 5-2 Calculated and experimental crystallographic coordinates of the constituent
atoms for Fe3O4. ............................................................................................................ 213
Table 5-3 Relaxed surface and the attachment energies of magnetite nanocrystals. .... 215
Table 8-1 The calculated surface energies of Ni(OH)2. ................................................ 279
Table 8-2 The calculated surface energies of NiO. ....................................................... 280
XXX
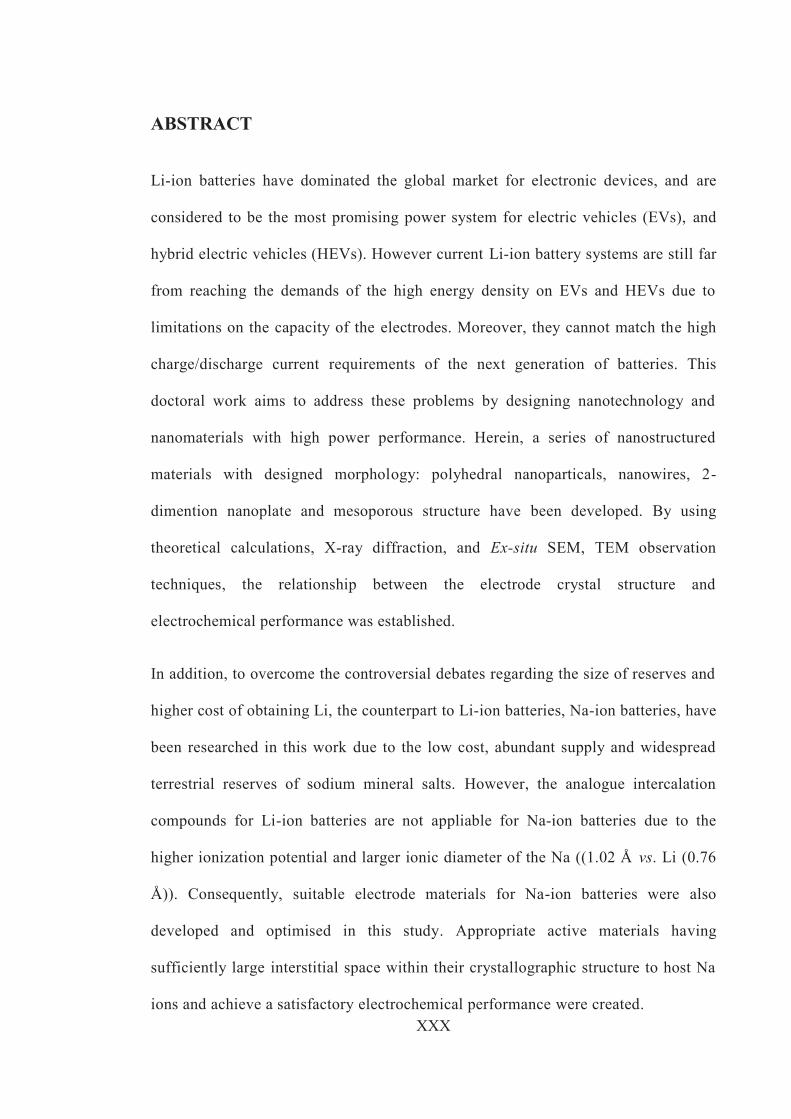
ABSTRACT
Li-ion batteries have dominated the global market for electronic devices, and are
considered to be the most promising power system for electric vehicles (EVs), and
hybrid electric vehicles (HEVs). However current Li-ion battery systems are still far
from reaching the demands of the high energy density on EVs and HEVs due to
limitations on the capacity of the electrodes. Moreover, they cannot match the high
charge/discharge current requirements of the next generation of batteries. This
doctoral work aims to address these problems by designing nanotechnology and
nanomaterials with high power performance. Herein, a series of nanostructured
materials with designed morphology: polyhedral nanoparticals, nanowires, 2-
dimention nanoplate and mesoporous structure have been developed. By using
theoretical calculations, X-ray diffraction, and Ex-situ SEM, TEM observation
techniques, the relationship between the electrode crystal structure and
electrochemical performance was established.
In addition, to overcome the controversial debates regarding the size of reserves and
higher cost of obtaining Li, the counterpart to Li-ion batteries, Na-ion batteries, have
been researched in this work due to the low cost, abundant supply and widespread
terrestrial reserves of sodium mineral salts. However, the analogue intercalation
compounds for Li-ion batteries are not appliable for Na-ion batteries due to the
higher ionization potential and larger ionic diameter of the Na ((1.02 Å vs. Li (0.76
Å)). Consequently, suitable electrode materials for Na-ion batteries were also
developed and optimised in this study. Appropriate active materials having
sufficiently large interstitial space within their crystallographic structure to host Na
ions and achieve a satisfactory electrochemical performance were created.

XXXI
Following are the corresponding brief introductions to each research task:
The crystal structure and electronic structure of Li2FeSiO4 and its delithiated
products, LiFeSiO4 and FeSiO4, were systematically investigated through the ab
initio calculation based on a monoclinic supercell with the P21 symmetry. The
expansion of the unit cell volume during the lithium extraction process, and the
two-step voltage profiles of Li2FeSiO4 corresponding to the Fe+2/+3 and Fe+3/+4
redox couples, respectively, have been studied. Furthermore, the diffusion
mechanism of Li ions in Li2FeSiO4 and its delithiated product LiFeSiO4 was
established base on the energy barriers calculation: the lithium will diffuse along
the [101] direction and Li ion layer in the ac plane.
Tuneable porous α-Fe2O3 materials were prepared using a novel selective etching
method. It was found that the pore size and pore volume can be controlled by adjusting
the etching time during the synthesis process. When the porous hematite was applied for
lithium storage in lithium ion cells, it demonstrated a reversible lithium storage capacity
of 1269 mA h g-1.
Atomistic simulation and calculations on surface attachment energy predicted the
polyhedral structure of magnetite nanocrystals with multiple facets. Through a low
temperature hydrothermal method, polyhedral magnetite nanocrystals with multiple
facets were successfully synthesised and identified by the X-ray diffraction (XRD), field
emission scanning electron microscopy (FESEM), and high resolution transmission
electron microscopy (HRTEM). When applied as an anode material in lithium ion cells,
magnetite nanocrystals demonstrated outstanding electrochemical performance with a
high lithium storage capacity, satisfactory cyclability, and excellent high rate capacity.
XXXII
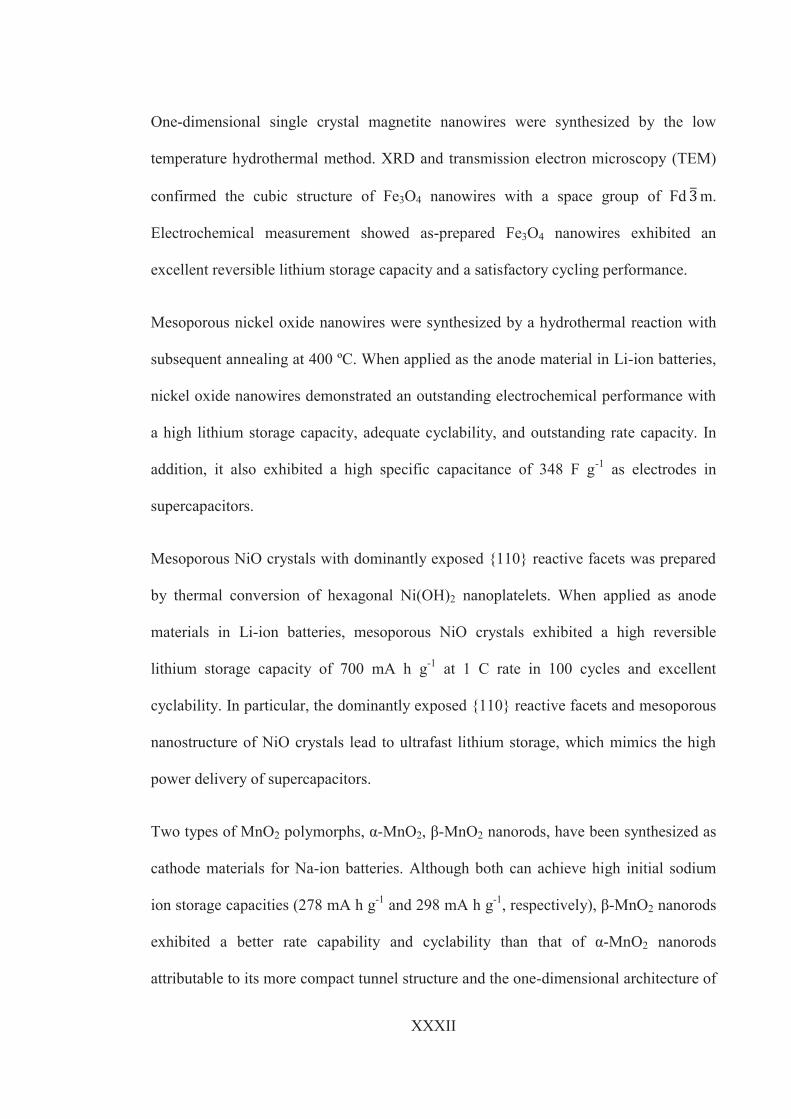
One-dimensional single crystal magnetite nanowires were synthesized by the low
temperature hydrothermal method. XRD and transmission electron microscopy (TEM)
confirmed the cubic structure of Fe3O4 nanowires with a space group of Fd m.
Electrochemical measurement showed as-prepared Fe3O4 nanowires exhibited an
excellent reversible lithium storage capacity and a satisfactory cycling performance.
Mesoporous nickel oxide nanowires were synthesized by a hydrothermal reaction with
subsequent annealing at 400 ºC. When applied as the anode material in Li-ion batteries,
nickel oxide nanowires demonstrated an outstanding electrochemical performance with
a high lithium storage capacity, adequate cyclability, and outstanding rate capacity. In
addition, it also exhibited a high specific capacitance of 348 F g-1 as electrodes in
supercapacitors.
Mesoporous NiO crystals with dominantly exposed {110} reactive facets was prepared
by thermal conversion of hexagonal Ni(OH)2 nanoplatelets. When applied as anode
materials in Li-ion batteries, mesoporous NiO crystals exhibited a high reversible
lithium storage capacity of 700 mA h g-1 at 1 C rate in 100 cycles and excellent
cyclability. In particular, the dominantly exposed {110} reactive facets and mesoporous
nanostructure of NiO crystals lead to ultrafast lithium storage, which mimics the high
power delivery of supercapacitors.
Two types of MnO2 polymorphs, α-MnO2, β-MnO2 nanorods, have been synthesized as
cathode materials for Na-ion batteries. Although both can achieve high initial sodium
ion storage capacities (278 mA h g-1 and 298 mA h g-1, respectively), β-MnO2 nanorods
exhibited a better rate capability and cyclability than that of α-MnO2 nanorods
attributable to its more compact tunnel structure and the one-dimensional architecture of
XXXIII
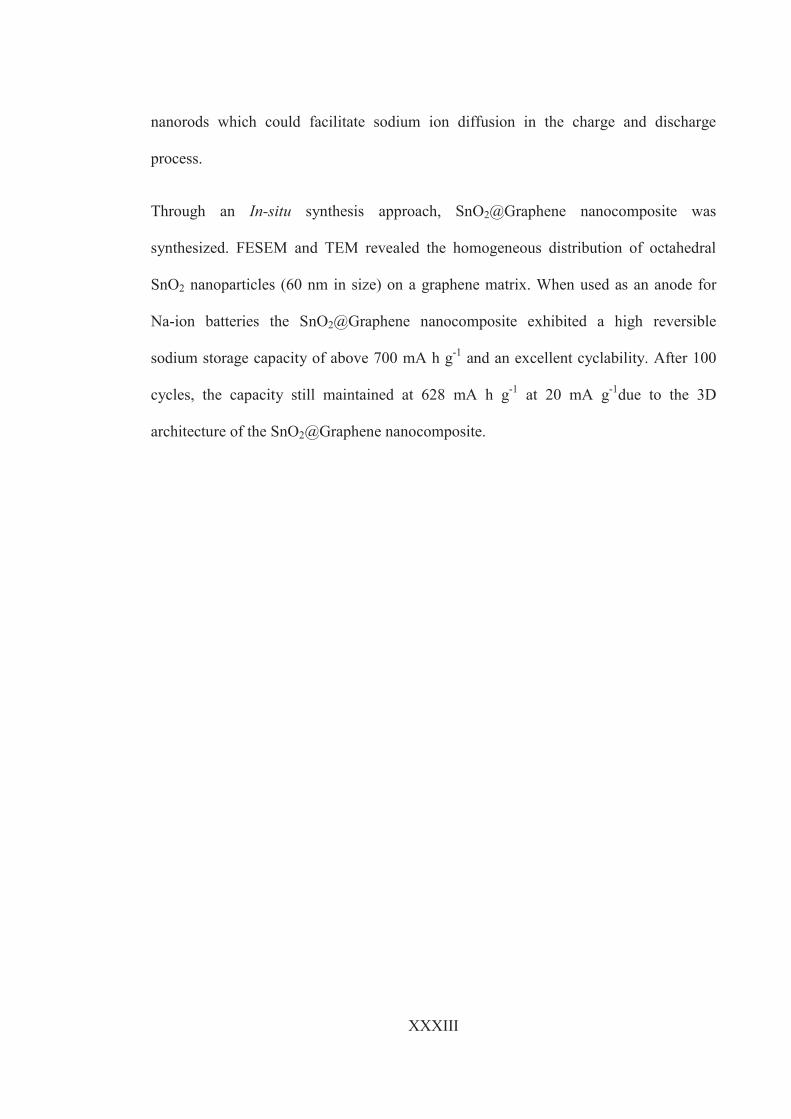
nanorods which could facilitate sodium ion diffusion in the charge and discharge
process.
Through an In-situ synthesis approach, SnO2@Graphene nanocomposite was
synthesized. FESEM and TEM revealed the homogeneous distribution of octahedral
SnO2 nanoparticles (60 nm in size) on a graphene matrix. When used as an anode for
Na-ion batteries the SnO2@Graphene nanocomposite exhibited a high reversible
sodium storage capacity of above 700 mA h g-1 and an excellent cyclability. After 100
cycles, the capacity still maintained at 628 mA h g-1 at 20 mA g-1due to the 3D
architecture of the SnO2@Graphene nanocomposite.