development of new sensors for determination of ...fac.ksu.edu.sa/sites/default/files/fatma...
TRANSCRIPT

Int. J. Electrochem. Sci., 8 (2013) 10044 - 10058
International Journal of
ELECTROCHEMICAL SCIENCE
www.electrochemsci.org
Development of New Sensors for Determination of Escitalopram
Oxalate in Dosage Forms and Biological Fluids
Fatimah M.G.Al-Amri*, Nawal A. Alarfaj and Fatma A.Aly
Department of Chemistry, College of Science, King Saud University, P.O. Box 22452, Riyadh 11495,
Saudi Arabia *E-mail: [email protected]
Received: 29 April 2013 / Accepted: 2 June 2013 / Published: 1 July 2013
A simple, accurate and precise potentiometric method was developed for the determination of
escitalopram oxalate (ESC-OX) in pure form, its pharmaceutical formulations and biological fluids.
Three types of sensors: plastic membrane, coated wire and coated graphite rod were constructed from
the incorporation of escitalopram (ESC) with phosphomolybdic acid (PMA) or ammonium reineckate
(ARK) or phosphotungstic acid (PTA) for the three sensors, respectively. Different parameters
affecting the performance of the sensors were studied as pH, soaking time and the selectively of the
sensors towards several foreign substances. The sensors exhibit linear response with a Nernstian slope
( 58.50 ±0.42, 57.80 ± 0.69 and 57.97 ± 0.52 mV decade -1
at 25 ºC ) over the concentration ranges 1.0
x 10-6
-1.0 x 10⁻²
, 1.0 x 10⁻⁶
-1.0 x 10⁻²
and 1.0 x 10⁻⁷
-1.0 x 10⁻²
mol L-1
, for the three sensors,
respectively. The working pH range of the proposed sensors was 3-7. The influence of possible
interfering species such as common inorganic cations, sugars and amino acids was studied. The
proposed method was validated for linearity, accuracy, intra-day and inter-day precision, robustness
and ruggedness according to ICH guidelines. Statistical student’s t-test and F-test showed no
significant difference between the proposed and reference methods regarding accuracy and precision,
respectively.
Keywords: Escitalopram oxalate; Ion-selective electrodes; Potentiometric determination;
Pharmaceutical formulations; Biological fluids
1. INTRODUCTION
Escitalopram oxalate is chemically known as S-(+)-1-(3-dimethyl-aminopropyl)-1-(4-
fluorophenyl)-1,3-dihyroisobenzofuran-5-carbonitrile oxalate,(Figure 1).It is an antidepressant of the
selective serotonin reuptake inhibitor class, which help to normalize the levels of serotonin in the brain
[1, 2]. The mechanism of antidepressant action of ESC is presumed to be linked to potentiation of
serotonergic activity in the central nervous system resulting from its inhibition of CNS neuronal

Int. J. Electrochem. Sci., Vol. 8, 2013
10045
reuptake of serotonin (5-hydroxytryptophan, 5-HT). In vitro and in vivo studies in animals suggest that
ESC is a highly selective serotonin reuptake inhibitor with minimal effects on norepinephrine and
dopamine neuronal reuptake [3].
Figure 1. Chemical structure of escitalopram oxalate
Several methods have been reported for the determination of (ESC-OX) including high
performance thin layer chromatography (HPTLC) [4,5], high performance liquid chromatography with
ultraviolet detection (HPLC/UV) [6-10], liquid chromatography with mass spectrometry (LC/MS)
[11,12], capillary electrophoresis [13,14], spectrophotometry[15-19] spectrofluorimetry [20, 21] and
chemiluminescsence [22].
The advantages of ion selective electrodes (ISEs) are simple to design, small size sensors, short
measurement time, low cost, adequate precision, high accuracy, low detection limits and wide
analytical ranges. The use of ISEs is increasing day by day in medicinal, pharmaceutical,
environmental, agricultural and industrial fields [23-25]. In the present study three sensors have been
constructed and validated for the determination of (ESC-OX) in pure drug, its pharmaceutical
preparations and biological fluids.
2. EXPERIMENTAL
2.1. Instrumentation
The electrochemical measurements were carried out with HANNA instrument pH-211
microprocessor pH-meter and Metrohm pH-meter Model 744 for measuring pH . Ag/AgCl electrode
was used as an external reference electrode.
The effect of pH on the potential of the electrode(s) was measured using two pH/mV meters.
The combined glass calomel electrode was connected to one instrument and the ESC-electrode(s) with
the double junction Ag/AgCl reference electrode was connected to the second instrument.
2.2. Materials and Reagent
All chemicals used were of analytical reagent grade and distilled water was used throughout.
Pure grade ESC-OX was kindly supplied from Saudi Pharmaceutical Industries and Medical

Int. J. Electrochem. Sci., Vol. 8, 2013
10046
Appliances Corporation (SPIMACO), Al-Qassim Pharmaceutical Plant, Saudi Arabia. The
Pharmaceutical preparation Cipralex® tablets (10 mg ESC/tablet) were manufactured by H. Lundbeck
A/S (Denmark) and were purchased from commercial sources. Tetrahydrofuran (THF) 97.0% and
dioctyl phthalate (DOP) 99.0% were provided by Fluka – Switzerland. Poly vinyl chloride (PVC)
high molecular weight, phosphomolybdic acid (PMA) 99.99% phosphotungstic acid (PTA) 99.99%
and ammonium reineckate (ARK) 95.00% were supplied by Aldrich, Germany. Urine samples were
obtained from healthy volunteers. Serum samples (Multi -Serum Normal, Ranbdox laboratories UK)
were obtained from commercial sources.
2.3. Standard Drug Solutions
A stock solution containing 0.1 mol L-1
of ESC-OX was prepared daily by dissolving 1.035 g
of drug in 25 mL distilled water. Working standard solutions ranging from 1.0 x 10⁻⁶
-1.0 x 10⁻²
, 1.0 x
10-6
-1.0 x10⁻²
and 1.0 x 10⁻⁷
-1.0 x 10⁻²
mol L-1
, for the three sensors, ESC-PM, ESC-RK and ESC-PT,
respectively were prepared from stock solution by appropriate dilution with distilled water.
2.4. Preparation of Escitalopram Ion-pair and Membrane Composition
The ion-pair was prepared by mixing 50 mL of ESC-OX 1.0 x 10⁻²
mol L-1
and 50 mL of 1.0 x
10-2
mol L-1
PMA or ARK or PTA. The resulting precipitates were filtered, washed thoroughly with
distilled water and air dried. The membranes were prepared by dissolving 10 mg of the ion-pair, 190
mg of powdered PVC and 0.35 mL of DOP in 5 mL THF. The solution mixture was poured into a petri
dish (3 cm diameter), covered with a filter paper and the solvent was allowed to evaporate slowly at
room temperature.
2.5. Electrode Construction
2.5.1. Plastic membrane sensor:
A circular membrane was attached to a polyethylene tube (8.0 mm diameter) in electrode
configuration by means of PVC-THF solution. A mixture containing equal volume of 1.0 x 10⁻³
ESC-
OX and 1.0 x 10⁻³
mol L-1
potassium chloride was used as internal solution in which the Ag/AgCl
reference electrode was dipped. The prepared electrode was pre-conditioned after preparation by
soaking for at least 24 h in 1.0 x 10⁻³
mol L-1
ESC-OX and stored in the same solution. All
potentiometric measurements were performed using the following cell assembly:
Ag/AgCl / Internal solution / membrane / test solution // KCl salt bridge // Ag/AgCl.
2.5.2. Coated wire sensor:
Coated wire sensor was fabricated using pure aluminum wire of 4.0 cm length and 0.5 cm
diameter which tightly insulated by polyethylene tube leaving 1.0 cm at one end for the coating and 0.5
cm at the other end for the connection. Prior to coating , the polished aluminum surface was washed

Int. J. Electrochem. Sci., Vol. 8, 2013
10047
with a detergent and water, and then dried with acetone. The wire was rinsed with chloroform and
allowed to dry in air. The wire then coated by quickly dipping it into the coating solution (described
previously under membrane composition) several times, and allowing the film left on the wire to dry
for 5 min. The process was repeated several times until a plastic membrane was formed. The
constructed electrode was preconditioned by soaking for 24 h in 1.0 x 10⁻³
mol L-1
of ESC-OX. All
potentiometric measurements were performed using the following cell assembly:
Al / membrane / test solution // KCl salt bridge // Ag/AgCl.
2.5.3. Coated graphite sensor:
A pure graphite rod of 4.0 cm length and 4.0 mm diameter was insulated by tight polyethylene
tube, leaving 1.0 cm at one end for coating and 0.5 cm at the other end for connection. The polished
sensor surface was coated with the active membrane by dipping the exposed end into the coating
solution (described previously under membrane composition) ten times and allowing the film left on
graphite rod to dry in air for 1 min each time. The process was repeated until 1.0 mm thickness formed
[25]. The prepared electrode was preconditioned by soaking for 24 h in 1.0 x10⁻³
mol L-1
ESC-OX .
All potentiometric measurements were performed using the following cell assembly:
Graphite rod / membrane / test solution // KCl salt bridge // Ag/AgCl.
2.6. Electrodes Calibration
50.0 mL aliquots of ESC-OX standard solutions ranging from 1.0 x 10⁻²
-1.0 x 10⁻⁶
, 1.0 x 10⁻⁶
-
1.0 x10⁻²
and 1.0 x 10⁻⁷
-1.0 x 10⁻²
mol L-1
, were transferred into 100 mL beaker for the three sensors,
ESC-PM, ESC-RK and ESC-PT, respectively. The sensor(s) and Ag/AgCl reference electrode were
immersed in each solution and the potential was measured. The sequence of measurements was carried
out from low concentration to higher one. The sensor(s) was washed with distilled water and dried
with tissue paper between measurements. The measured potential was plotted against the negative
logarithm of drug concentrations. Alternatively, the corresponding regression equation was calculated.
2.7. Standard Addition Method
The fabricated sensor was immersed into sample of 50 mL with unknown concentration (ca.
1.0 x 10⁻⁴
mol L-1
) and the equilibrium potential of E1 was recorded. Then 0.1 mL of 0.1 mol L-1
of
standard drug solution was added into the testing solution and the equilibrium potential of E2 was
recorded. The concentration of the testing sample was calculated from the change of potential ∆E (E2-
E1).
2.8. Electrode Selectivity
Selectivity coefficients K Pot
ESC, j+z
of the sensors towards different cations, sugars and amino
acids were determined by the separate solution method [26] in which the following equation was
applied:
Int. J. Electrochem. Sci., Vol. 8, 2013
10048
Log K Pot
ESC J z+
= (E2 – E1)/ S + log [ESC] – log [J z+
]1/z
Where, E1 is the electrode potential in 1.0 x 10⁻³
mol L-1
ESC-OX solution, E2 is the potential
of the electrode in 1.0 x 10⁻³
mol L-1
solution of the interferent ion J z+
and S is the slope of the
calibration plot in mV.
2.9. Effect of pH
The effect of pH of 1.0 x 10⁻⁴
mol L-1
ESC-OX solution on the sensor(s) potential was
investigated. The variation of potential as a function of pH was followed by the addition of small
volumes 0.1 mol L-1
of hydrochloric acid or sodium hydroxide to adjust the pH of this solution
between 2-9. The potential readings corresponding to different pH values were recorded and plotted
using the proposed sensor(s)
2.10. Determination of ESC-OX in Pharmaceutical Dosage Forms
2.10.1. Determination of ESC-OX in tablets
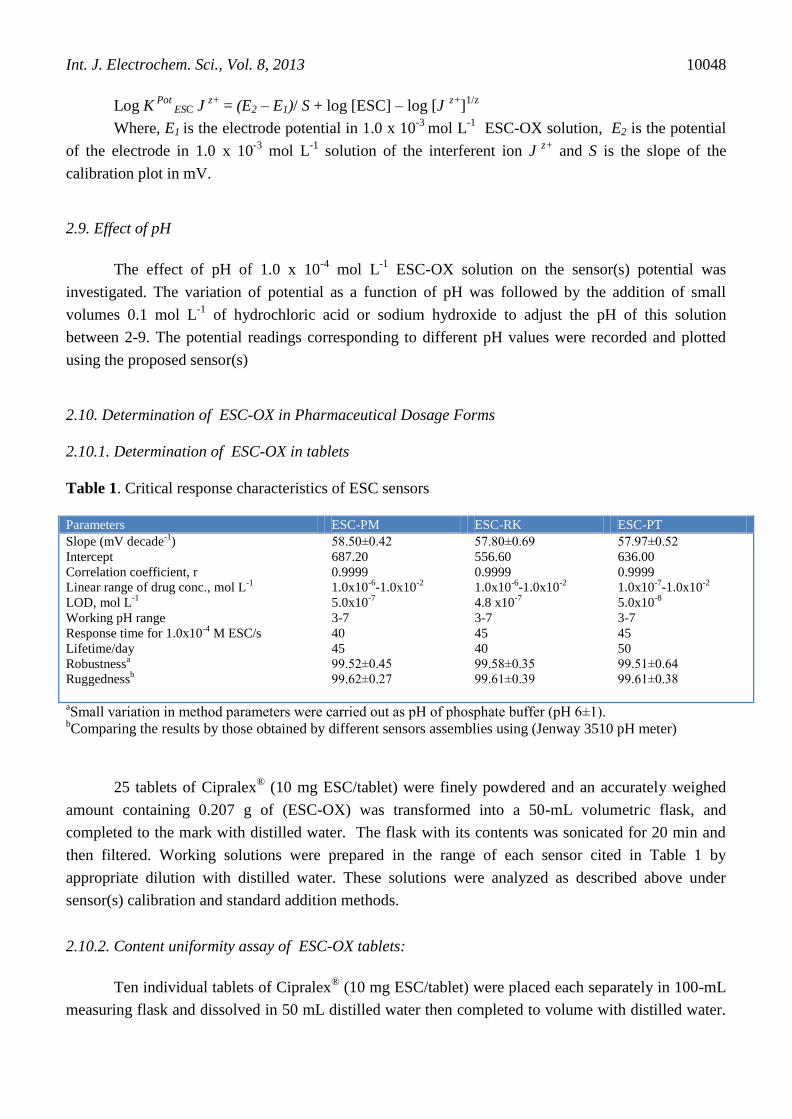
Table 1. Critical response characteristics of ESC sensors
Parameters ESC-PM ESC-RK ESC-PT
Slope (mV decade-1
)
Intercept
Correlation coefficient, r
Linear range of drug conc., mol L-1
LOD, mol L-1
Working pH range
Response time for 1.0x10⁻⁴
M ESC/s
Lifetime/day
Robustnessa
Ruggednessb
58.50±0.42
687.20
0.9999
1.0x10⁻⁶
-1.0x10⁻²
5.0x10⁻⁷
3-7
40
45
99.52±0.45
99.62±0.27
57.80±0.69
556.60
0.9999
1.0x10⁻⁶
-1.0x10⁻²
4.8 x10⁻⁷
3-7
45
40
99.58±0.35
99.61±0.39
57.97±0.52
636.00
0.9999
1.0x10⁻⁷
-1.0x10⁻²
5.0x10⁻⁸
3-7
45
50
99.51±0.64
99.61±0.38
aSmall variation in method parameters were carried out as pH of phosphate buffer (pH 6±1).
bComparing the results by those obtained by different sensors assemblies using (Jenway 3510 pH meter)
25 tablets of Cipralex® (10 mg ESC/tablet) were finely powdered and an accurately weighed
amount containing 0.207 g of (ESC-OX) was transformed into a 50-mL volumetric flask, and
completed to the mark with distilled water. The flask with its contents was sonicated for 20 min and
then filtered. Working solutions were prepared in the range of each sensor cited in Table 1 by
appropriate dilution with distilled water. These solutions were analyzed as described above under
sensor(s) calibration and standard addition methods.
2.10.2. Content uniformity assay of ESC-OX tablets:
Ten individual tablets of Cipralex® (10 mg ESC/tablet) were placed each separately in 100-mL
measuring flask and dissolved in 50 mL distilled water then completed to volume with distilled water.

Int. J. Electrochem. Sci., Vol. 8, 2013
10049
The sensor(s) was directly immersed into 10 mL of each sample for five times and then washed with
distilled water to reach steady potential between the individual measurements. The mean potential was
used to evaluate the content uniformity from the calibration graph or the regression equation.
2.11. Application to Serum and urine
2.11.1. Urine
1.0 mL aliquots of urine were transferred into a seires of 100-mL measuring flasks. Aliquots of
ESC-OX standard aqueous solution were added so that the final concentration is in the range cited in
Table 1. The flasks were mixed well and completed to volume using distilled water. These solutions
were analyzed as described above under electrode calibration and standard addition methods.
2.11.2. Serum
1.0 mL aliquots of serum were transferred into a series of centrifugation tubes. Aliquots of
ESC-OX standard aqueous solution were added so that the final concentration is in the range cited in
Table 1. The tubes were mixed well and 10.0 mL of diethyl ether was added to each tube and
centrifuged for 2 min at 1500 rpm. Then, the deproteinated layer was transferred to a 100-mL
measuring flask and complete to volume using distilled water. These solution were analyzed as
described above under electrode calibration and standard addition methods.
3. RESULTS AND DISCUSSION
3.1. Membrane Composition
The membrane was prepared using 2% ion pair, 35% PVC and 63% DOP for the three sensors.
This membrane composition was reported previously for some sensors used in pharmaceutical analysis
[27-30].
3.2 Nature and Response Characteristics of the Sensors
ESC-OX reacts with PMA, ARK and PTA to form a stable phosphomolybdate (ESC-PM) or
reineckate (ESC-RK) or phosphotungstate (ESC-PT) ion-pair complex which is water insoluble but
readily soluble in an organic solvents such as (THF). The ion-pair complex was prepared and tested as
an active material with DOP as a solvent mediator in a PVC membrane matrix for ESC-OX. The
choice of THF membrane solvent to achieve the required selectivity was based on its electric
permittivity, immiscibility with aqueous phase, high viscosity, low solubility of the matrix in the
membrane and its ability to dissolve the ion-pair complex.

Int. J. Electrochem. Sci., Vol. 8, 2013
10050
Figure 2. Calibration graphs of ESC sensors
The critical response characteristics of ESC-PM plastic membrane sensor, ESC-RK coated
wire sensor and ESC-PT coated graphite sensor were determined and the results are summarized in
Table 1. The sensors exhibits a near-Nernstian response over the concentration range from 1.0 x 10⁻⁶
-
1.0 x 10⁻²
, 1.0 x 10⁻⁶
- 1.0 x 10⁻²
and1.0 x 10-7
- 1.0 x 10⁻²
mol L- 1
ESC-OX for ESC-PM, ESC-RK
and ESC-PT sensors , respectively, with a slope of 58.50±0.42, 57.80±0.69 and 57.97±0.52 mV
decade-1 at 25 C for the previousl
mentioned sensors , respectively as in (Figure 2). The sequence of
measurements was from low to high concentrations. The sensors exhibit a fast dynamic response of
about 40, 45 and 45 s for ESC-PM, ESC-RK and ESC-PT sensors, respectively. The sensors were
used for period of 45, 40 and 50 days for the previously mentioned sensors, respectively, without
significant change in the sensors parameters. During this period, the sensors were stored in 1.0 x 10⁻³
mol L-1
drug solution.
3.3. Effect of Soaking Time and Regeneration of the Electrode
The performance characteristics of ESC sensor(s) was studied as a function of soaking time.
For this purpose the sensor(s) was soaked in 1.0 x 10⁻³
mol L-1
ESC-OX solution and the calibration
graphs were plotted after optimum soaking of time 24 h for ESC-PM, ESC-RK and ESC-PT sensors,
respectively. The slope of the calibration curves was 58.50±0.42, 57.80±0.69 and 57.97±0.52 mV
decade-1, at 25ºC for the three sensors, respectivel . The sensor(s) was continuousl soaked in 1x10
-3
mol L-1
ESC-OX solution for 5, 15, 25, 35, 40, 45 and 50 days. The calibration plot slopes decreased
0
100
200
300
400
500
600
0 2 4 6 8
Ele
ctro
de
po
ten
tial
/m
V
-log conc. of ESC-OX, mol L-1
ESC-PM ESC- RK ESC- PT

Int. J. Electrochem. Sci., Vol. 8, 2013
10051
Figure 3. Calibration graphs of exhausted and regenerated ESC-PM membrane electrode
slightl to 56.90 ± 1.27, 56.30± 1.06 and 55.30 ±1.01mV decade-1
after 35 days for ESC-PM, ESC-RK
and ESC-PT sensors, respectively, and continued to decrease reaching 54.00 ± 0.85 , 53.50±1.27 and
54.40±1.03 mV decade-1
after 45,40 and 50 days for the three sensors, respectively. This reveals that
soaking of the sensor(s) in the drug solution for a long time has a negative effect on the response of the
membrane.
Figure 4. Calibration graphs of exhausted and regenerated ESC-RK coated wire electrode
150
200
250
300
350
400
450
500
0 1 2 3 4 5 6 7
Ele
ctro
de
po
ten
tial
, mV
- log conc. of ESC-OX, mol L-1
Exhausted electrode Regenrated electrode
0
100
200
300
400
500
600
700
0 1 2 3 4 5 6 7
ele
ctro
de
po
ten
tial
/mV
-log conc of ESC-OX, mol L-1
Exhausted electrode Reagenrated electrode

Int. J. Electrochem. Sci., Vol. 8, 2013
10052
Figure 5. Calibration graphs of exhausted and regenerated ESC-PT coated graphite electrode
The same effect also appears after working with the sensors for a long time. The regeneration
of the sensor(s) was tried simply by reformation of the ion-pair on the external gel layer of membrane
[31]. The regeneration of the ESC membrane was successfully achieved by soaking the exhausted
sensor(s) for 24 h in a solution that was 1.0 x 10⁻²
mol L-1
PMA or ARK or PTA, followed by soaking
for 3 h in 1.0 x 10⁻²
mol L-1
ESC-OX solution. Figures 3-5 show the calibration graphs for an
exhausted sensor(s) (slopes 54.00± 0.85, 53.50± 1.27 and 54.40±1.03 mV decade-1
) for ESC-PM,
ESC-RK and ESC-PT sensors respectively, and for the same sensor(s) after regeneration (slopes
55.60±0.49, 54.30 ± 0.81 and 56.20 ± 0.56 mV decade-1
). It was found that the lifespan of the
regenerated sensor(s) is limited to 8 h due to the ease of leaching of the lipophilic salts from the gel
layer at the sensor(s) surface compared with those that are attached homogeneously to the PVC
network through the solvent mediator.
3.4. Effect of pH
The effect of pH of the test ESC-OX solutions (1.0 x 10⁻⁴
mol L-1
) on the sensor(s) potential
was investigated by measuring the variation in the electromotive force with change in pH gradually
from 2-9. Figure 6 showed that within the pH range 3-7 the sensor(s) potential was practically
independent of pH and in this range the sensor(s) can be safely used. Below pH 3, the electrode
potential decreased with the increase of analyte acidity which may be attributed to extraction of H+
ions by membrane. While at pH more than 7, the electrode potential decreased which may due to
increase of OH- concentration [32].
0
100
200
300
400
500
600
700
800
0 2 4 6 8
Ele
ctro
de
po
ten
tial
/mV
- log conc of ESC-OX, mol L-1
Regenrated electrode Exhausted electrode

Int. J. Electrochem. Sci., Vol. 8, 2013
10053
Figure 6. Effect of pH on ESC sensor potential
3.5. Selectivity of the Electrode
Table 2. Selectivity coefficients Kpot
of ESC sensors towards different interferents
K
potESC,J
z+ K
potESC,J
z+ K
potESC,J
z+ Interferent
ESC-PT ESC-RK ESC-PM
1.7x10⁻⁴
2.8x10⁻⁵
2.9x10⁻³
2.0x10⁻⁵
1.3x10⁻⁴
4.6x10⁻⁴
1.7x10⁻³
2.4x10⁻³
1.9x10⁻³
1.1x10⁻³
1.3x10⁻³
6.6x10⁻⁵
3.9x10⁻³
6.2x10⁻³
1.6x10⁻³
3.4x10⁻³
4.1x10⁻³
5.3x10⁻³
7.2x10⁻³
9.2x10⁻³
7.3x10⁻³
9.9x10⁻³
2.1x10⁻⁴
1.5x10⁻⁴
6.1x10⁻⁴
1.9x10⁻⁴
2.5x10⁻⁴
3.5x10⁻⁴
7.4x10⁻⁴
9.0x10⁻⁴
4.9x10⁻⁴
3.7x10⁻⁴
4.4x10⁻⁴
1.8x10⁻⁴
2.9x10⁻³
1.8x10⁻³
1.1x10⁻³
6.5x10⁻⁴
1.8x10⁻³
3.2x10⁻³
2.2x10⁻³
5.2x10⁻³
3.4x10⁻³
7.4x10⁻³
1.9x10⁻⁵
1.3x10⁻⁵
3.5x10⁻⁴
8.4x10⁻⁶
2.6x10⁻⁵
3.2x10⁻⁵
3.4x10⁻⁴
1.6x10⁻⁴
1.9x10⁻⁴
3.7x10⁻⁵
4.2x10⁻⁵
1.6x10⁻⁵
5.8x10⁻⁵
7.3x10⁻⁵
1.0x10⁻⁴
1.2x10⁻⁴
8.8x10⁻⁵
2.0x10⁻⁴
2.6x10⁻⁴
4.6x10⁻⁵
5.9x10⁻⁴
2.1x10⁻⁴
Na+
K+
NH4+
Ni2+
Zn2+
Mg2+
Ca2+
Sn2+
Ba2+
Cu2+
Mn2+
Cd2+
Thymidine
L-histadin
Ornithin
L-glutamine
Glycine
L-Cystine
Thymine
Glucose
Starch
Talc

Int. J. Electrochem. Sci., Vol. 8, 2013
10054
The influence of some inorganic cations, sugars and amino acids on ESC sensor(s) was
investigated. The results obtained (Table 2) reflect a very high selectivity of the investigated sensor for
ESC. The mechanism of selectivity is mainly based on the stereospecificity and electrostatic
environment, and is dependent on how much matching is present between the locations of the
lipophilic sites in the two competing species in the bathing solution side and those present in the
receptor of the ion-pair. The inorganic cations such as (Na+, K
+, NH4
+, Ca
2+, Mg
2+, Cd
2+, Ni
2+, Zn
2+,
Cu2+
, Mn2+
, Sn2+
and Ba2+
did not interfere because of differences in the inorganic particle size,
mobility and permeability. Also as shown in Table 2 the sensor(s) exhibits good tolerance towards
sugars and amino acids.
3.6. Method Validation
The method was validated for linearity, accuracy, intra-day and inter-day precision,
repeatability, robustness and ruggedness accordance with ICH guidelines [33].
Under the optimal experimental conditions, linear relationships exist between the sensor
potential/mV and the negative logarithm of corresponding concentration of the investigated drug over
the concentration range cited in Table 1. Also, the regression data and correlation coefficients (r) are
listed in Table 1.
Table 3. Precision of the proposed method for the determination of ESC-OX in pure form
ESC - PT ESC - RK ESC – PM
Taken
–log conc.
mol L-1
%SE**
0.17
0.15
0.20
%RSD*
0.42
0.37
0.49
Recovery%
99.60±0.42
99.66±0.37
99.45±0.49
%SE**
0.21
0.19
0.19
%RSD*
0.51
0.46
0.47
Recovery%
99.58±0.51
99.63±0.46
99.62±0.47
%SE**
0.11
0.19
0.26
%RSD*
0.27
0.47
0.65
Recovery%
99.77±0.27
99.60±0.47
99.50±0.65
Intraday
Precision
6.0
5.0
4.0
0.16
0.13
0.12
0.39
0.33
0.30
99.52±0.39
99.46±0.33
99.33±0.30
0.14
0.20
0.18
0.34
0.50
0.44
99.57±0.34
99.50±0.50
99.42±0.44
0.22
0.24
0.15
0.55
0.60
0.37
99.58±0.55
99.50±0.60
99.54±0.37
Interday
Precision
6.0
5.0
4.0
%* RSD= (S.D/Mean) 100
**%SE(%Error)= %RSD/√n
The detection limit of the investigated drug was calculated according to IUPAC [34]
recommendation which stated that the detection limit is the concentration at which the measured
potential differs from that predicted by the linear regression by more than 18 mV. The value reported

Int. J. Electrochem. Sci., Vol. 8, 2013
10055
in Table 1; indicates that the proposed potentiometric method is sensitive for detection of very small
concentrations of ESC-OX.
The robustness of the proposed method was carried out b using phosphate buffer pH 6±1 and
the percentage recoveries were 99.52± 0.45, 99.58±0.35 and 99.51±0.64 for ESC-PM, ESC-RK and
ESC-PT sensor(s), respectively. The ruggedness of the proposed method was investigated upon using
another model of pH-meter (Jenway 3510) and the obtained results are shown in (Table 1).
The accuracy of the proposed method was evaluated by the recoveries studies for taken
concentration of ESC-OX reference standards. The % recoveries values ranged from 99.28-99.98,
99.07-100.33 and 99.16-100.00 for ESC-PM, ESC-RK and ESC-PT sensors respectively, indicating
the accuracy of the proposed method.
The precision of the method was calculated in terms of intermediate precision (intra-day and
inter-day). Three different concentrations of ESC-OX were analyzed in six replicates during the same
day (intra-day precision) and for five consecutive days (inter-day precision). The % RSD values of
intra-day and inter-day studies for the repeated determinations were less than 2% indicating good
precision (Table 3).
3.7. Analytical Applications
3.7.1. The sensor response in pharmaceutical formulations
Table 4. Analysis of ESC in pure form and dosage forms by the proposed and reported methods
Reported
method18]
ESC-PT ESC-RK ESC-PM
Statistical
Parameter
Sam
ple
Standard
addition
method
Calibration
method
standard
addition
method
Calibration
method
standard
addition
method
Calibration
Method
99.69±0.42
6
0.18
0.17
0.42
99.73±0.24
6
0.06
0.10
0.24
0.20(2.228)*
2.98(5.05)*
99.62±0.44
6
0.19
0.18
0.44
0.28(2.228)*
1.09(5.05)*
99.76±0.33
6
0.11
0.14
0.33
0.32(2.228)*
1.60(5.05)*
99.75±0.43
6
0.19
0.18
0.43
0.13(2.228)*
1.05(5.05)*
99.60±0.57
6
0.32
0.23
0.57
0.31(2.228)*
1.82(5.05)*
99.59±0.27
6
0.08
0.12
0.28
0.48(2.228)*
2.35(5.05)*
Mean ±S.D
n
Variance
%SE**
%RSD
t-test
F-test
pu
re f
orm
99.57±0.42
6
0.17
0.17
0.42
99.55±0.37
6
0.13
0.15
0.37
0.05(2.228)*
1.17(5.05)*
99.77±0.19
6
0.04
0.08
0.20
0.77(2.228)*
2.17(5.05)*
99.53±0.49
6
0.25
0.20
0.50
0.15(2.228)*
1.43(5.05)*
99.54±0.31
6
0.10
0.13
0.31
0.14(2.228)*
1.78(5.05)*
99.65±0.49
6
0.24
0.20
0.50
0.30(2.228)*
1.39(5.05)*
99.41±0.41
6
0.17
0.16
0.42
0.67(2.228)*
1.02(5.05)*
Mean ±S.D
n
Variance
%SE**
%RSD
t-test
F-test
Cipralex ® Tablets
(10
mg
ES
C/t
able
t)
* The Figures in parentheses are the tabulated t- and F- tests at p = 0.05[35]
**%Error = %RSD/√n

Int. J. Electrochem. Sci., Vol. 8, 2013
10056
It is evident from the above mentioned results that the proposed ESC-PM, ESC-RK and ESC-
PT sensors gave satisfactory results with ESC-OX in its pure form (Table 4). Thus its pharmaceutical
dosage form (Cipralex 10 mg /tablet) was subjected to the analysis for its ESC-OX content by the
proposed potentiometric method. Table 4 shows the results of analysis of ESC-OX in its tablets.
Statistical analysis [35] of the results obtained by the proposed and the comparison methods[18] shows
no significant difference between the two methods as regards to accuracy (t-test) and precision (F-test).
Also, the results in Table 3 indicate that the method is selective for the determination of ESC-OX in
its pharmaceutical preparations without interference from excipients.
3.7.2. The sensor response in biological fluids
Sogaard et al. [36] reported that ESC-OX is relatively fast absorbed after oral administration of
single or multiple doses. The maximum observed plasma or serum concentration (Cmax) attained after 3
to 4 hours and was found to be about 65.0±14.5 nmol/L after a single oral administration of 20 mg
ESC to fasted subjects. The mean half-lives were 27 and 33 hours after single and multiple doses
respectively.
The validity of the proposed method was further tested by analyzing ESC-OX in spiked
biological fluids using the calibration and standard addition methods.
Table 5. Determination of ESC-OX in spiked human serum and urine by the ESC sensors
ESC-PT ESC-RK ESC-PM
Sample standard
addition
method*
Calibration
Method*
standard
addition
method*
Calibration
Method*
standard
addition
method*
Calibration
Method*
99.66±0.31
99.49±0.22
99.58±0.45
99.32±0.31
99.65±0.44
99.18±0.43
Urine
99.62±0.37
99.20±0.26
99.64±0.37
99.13±0.38
99.57±0.45
99.04±0.51 Serum
* Mean ± S.D. of six determinations
The results were listed in Table 5. The potential of the ESC sensors showed no significant
difference of response time between aqueous solution of pure drug and its spiked biological fluids.
A comparison of the proposed method with other reported methods shows them all to be
equally accurate and precise. However, HPLC methods are generally tedious procedures and require
special skills and sophisticated instrumentation. Although the proposed method might be less sensitive
than some methods [7, 20-22], it has a few merits such as simplicity, easy to operate, less expensive

Int. J. Electrochem. Sci., Vol. 8, 2013
10057
and time efficiency. Moreover, the proposed method is more sensitive than some HPLC and
spectrophotometric methods [8-10, 15-19].
4. CONCLUSION
The potentiometric method developed for the determination of ESC-OX using new three
constructed sensors is simple, accurate, easy to operate and inexpensive; making it an excellent tool for
the routine determination of ESC-OX in quality control laboratories. Also, it provides a fast assay of
ESC-OX in its pharmaceutical preparations without interference from excipients.
ACKNOWLEDGEMENTS
This project was supported by King Saud University, Deanship of Scientific Research, College of
Science Research Centre.
References
1. http://en.wikipedia.org/wiki/Escitalopram
2. http://www.searlepak.com/morcet.html 3. http://www.rxlist.com/lexapro-drug.htm
4. M.V.Mahadeo, S.R. Dhaneshwar and M.J.Kulkarni, Euras. J. Anal. Chem. 2 (2007)101.
5. N. Dhavale, S. Gandhi, S. Sabnis and K. Bothara, Chromatographia 67 (2008) 487.
6. S.R. Dhaneshwar, M.V. Mahadeo and M. J. Kulkarni, J. AOAC Int. 92 (2008)138.
7. C. Greiner, C. Hiemke, W. Bader and E. Haen, J. Chromatogr. B. 848 (2007) 391.
8. S.V. Gandhi, N.D. Dhavale, V.Y. Jadhav and S.S. Sabnis, J. AOAC, Int. 91 (2008)33.
9. T. Samanta, S. De , H.B. Samal, D.B. Kumar, D.L. Mohant and K. Bhar, Int. J. Chem. Res. 2
(2011)11.
10. S.B. S ama and A. Suneetha, Int. J. Pharm. Bio. Sci. 2 (2011) 140.
11. S.S. Singh, H. Shah, S. Gupta, M. Jain, K. Sharma, P. Thakkar and R. Shah, J. Chromatogr. B. 811
(2004) 209.
12. U. Gutteck and K.M. Rentsch, Clin. Chem. Lab.Med. 41 (2003) 1571.
13. N. Johannesson and J. Bergquist, J. Pharm. Biomed. Anal. 43 (2007) 1045.
14. B. Sungthong, P. Jac, and G.K. Scriba, J. Pharm. Biomed. Anal. 46 (2008) 959.
15. S. Sharma, H. Rajpurohit, C. Sonwal, A. Bhandari, V.R. Choudhar and T. Jain, J. Yon. Pharm. 2
(2010) 420.
16. T. Vetrichelvan, K. Arul, M. Sumithra and B. Umadevi, Indian J. Pharm. Sci. 72 (2010) 269.
17. S.A. Al-Tamimi, F.A. Al and O.M. Al-Otaibi, Asian J. chem. 24 (2012)5515.
18. G. Bharat, B.G. Chaudhari and H.R. Parmar, Int. J. Pharm. Qual. Assu. 2 (2010)9.
19. S.A. Al-Tamimi, F.A. Al , O.M. Al-Otaibi, J. Indian Chem. Soc. 90 (2013) (in press).
20. S.Victor, M. Alex, D. Vadim, A. Dan, V.Z. Louis and D. Anatol , Clin. Chem. Lab. Med. 45
(2007) 513.
21. E.A. Taha, N.N. Salama and S. Wang, Anal. Chem. Insights, 4 (2009)1.
22. N. A. Alarfaj, F.A. Al and A.A. Al-Qahtan , Luminescence 28 (2013)84.
23. A. M. Al-Mohaimeed, S. A. Al-Tamimi, N. A. Alarfaj and F.A. Al , Int. J. electrochem. Sci. 7
(2012).
24. K. Zarzecka, M. Gugata and I. M stkowska, J. Toxoc. Environm. Health. 73 (2010)1244.

Int. J. Electrochem. Sci., Vol. 8, 2013
10058
25. S.I.M. Zayed, Japan Soci. Anal. Chem. 20 (2004)1043.
26. M. Arvand, M.F. Mousavi, M.A. Zanjanchi and M. Shamsipur, J. Pharm. Biomed Anal. 33
(2003)975.
27. M. S. Elazaz , A. Shalab , M. N. Elbolkin and H.M. Khalil, Chin. Pharm. J. 55 (2003) 491.
28. E. T. Maha, E.M. Magda and A..Shalab , Bull. Pharm. Sci. 29 (2006) 488.
29. H. M. Elqudab , E.Y.Z. Frag, G.G. Mohamed and M.A.E. Mohamed, Anal. Bioanal. Electrochem.
3 (2011) 420.
30. A.M. Badawe , A.E.B. Abd El-Aleem and N.T. Lamie, Intentional J. of Comprehensive Pharmacy
2 (2011) 1.
31. U. Oesh and W. Simon, Anal. Chem. 52 (1980) 692.
32. E. T. Maha, R. Sawsan, E.M. Magda and A.A. Shalaby, Kor. J. chem. 54 (2010) 1.
33. International Conference on Harmonization, ICH Harmonised Tripartite Guideline, Q2 (R1), Validation of Anal tical Procedures: Text and Methodolog , Switzerland, (1995).
34. Information Bull. IUPAC, No. 43, Recommendations for nomencleature of ion-selective
electrodes, (1975).
35. J.C. Miller and J.N. Miller, Statistics for anal tical chemistr , third ed., Ellis Horwood-Prentice
Hall, Chichester, (1993).
36. B. Sogaard, H. Mengel, N. Rao, F. Larsen, J. Clin. Pharmacol. 45 (2005)1400.
© 2013 by ESG (www.electrochemsci.org)