development of natural gas u.s and pipeline capacitydocuments.worldbank.org/curated/en/... ·...
TRANSCRIPT

wips I9
POLICY RESEARCH WORKING PAPER 18 97
Development of Natural Gas Deregulation of the U.Snatural gas industry has
and Pipeline Capacity shown that market forces can
lMXa 1k*e1tT in the Uni d Sta s produce efficient transactions
in industries traditionally
considered natural
Andrej Juris monopolies. Deregulation ofretail markets remains the
most important task, and the
biggest challenge, industry
regulators face,
The World Bank
Private Sector Development Department
Private Participation in Infrastructure Group
March 1998
Pub
lic D
iscl
osur
e A
utho
rized
Pub
lic D
iscl
osur
e A
utho
rized
Pub
lic D
iscl
osur
e A
utho
rized
Pub
lic D
iscl
osur
e A
utho
rized
Pub
lic D
iscl
osur
e A
utho
rized
Pub
lic D
iscl
osur
e A
utho
rized
Pub
lic D
iscl
osur
e A
utho
rized
Pub
lic D
iscl
osur
e A
utho
rized

IPoi,IcY RESEARCH WORKING PAPER 1897
Summary findings
Deregulation of the U.S. natural gas industry has been Introducing open access to interstate pipelines and
under way since the late 1970s. The industry was their unbundling from gas sales has allowed end users to
deregulated to create competitive markets in natural gas participate in the efficiency gains in upstream markets.
and its pipeline transportation, in the expectation that All this has contributed to declining retail prices for all
competition would guide transactions toward a more major consumer categories.
efficient outcome. Deregulation is far from complete, however. Current
Juris provides an overview of the deregulation process regulation of interstate pipeline companies and the
and its effect on the development and functioning of secondary transportation market does not promote
natural gas and gas transportation markets in the United efficient allocation of transportation contracts. Flexible
States. He analyzes the tradinig of pipeline capacity in pricing of transportation contracts should be introduced
primary and secondary markets and the regulation of in both the primary and secondary transportation
pipeline transportation, identifies mechanisms that markets.
pipeline companies use to coordinate bilateral .But deregulation of retail markets remains the most
transactions, and summarizes deregulation's main important task and the biggest challenge facing industry
achievements in the U.S. natural gas industry. regulators. Small-volume end users (such as residential or
Industry achievements in the past 15 years show that co.mmercial customers) are captive to local distriubtion
expectations were not unrealistic. The United States utilities, without access to competitive wholesale
enjoys a highly competitive wholesale natural gas market markets. All end users should be able to choose a natural
and an increasingly competitive interstate transportation gas supplier and receive natural gas at the minimum cost
market. Both markets have benefited from the to society.
deregulation of natural gas production and marketing
and the liberalization of natural gas prices.
This paper - a product of the Private Participation in Infrastructure Group, Private Secto- Development Department -
is part of a larger effort in the department to analyze issues arising from private participation in infrastructure. Copies of
the paper are available free from the World Bank, 1818 H Street NW, Washington, DC 20433. Please contact Sandra Vivas,
room Q7-005, telephone 202-458-2809, fax 202-522-3481, Internet address [email protected]. March 1998. (50
pages)
The Policy Research Working Paper Series disseminates the findings of work in progress to encourage the exchange of ideas aboutdevelopment issues. Anz obiective of the series is to get the findings out quickly, even ifthe presentations are less thanl fully polished. Thepapers carry the names of the authors and should be cited accordingly. The findintgs, interpretations, and conclusions expressed in thispaper are entir-ely those of the authors. They do not necessarily represent the view of the World Bank, its Executive Directors, or thecountries they represent.
Produced by the Policy Research Dissemination Center

Development of Natural Gasand
Pipeline Capacity Marketsin the
United States
Andrej Juris

2
Contents
Deregulation and Structural ChangeRegulatory ChangeStructural Change
Natural Gas MarketNatural Gas Supply and DeliveriesPhysical Gas MarketFinancial Gas Market
Transportation MarketStructure of the Interstate Pipeline Transportation MarketPrimary Transportation MarketSecondary Transportation Market
Optimization of Pipeline Operation in the Deregulated Natural Gas IndustryScheduling and BalancingCentral Dispatch and Flow Control
Conclusion
Notes
References
Tables1. Average Natural Gas Prices and Price Changes, 1988 and 19942. Supply and Disposition of Natural Gas in the United States, 19953. Average Prices and Deliveries of Natural Gas to U.S. Consumers, 19954. Delivery Structure of Natural Gas Contracts at NYMEX, 1993-965. Structure of the Interstate Pipeline Transportation Market, 1994-956. Firm and Interruptible Deliveries of Natural Gas to U.S. Consumers, 19957. Structure of Natural Gas Deliveries to U.S. Consumers, 1995
Boxes1. Transition Costs of Order No. 436: Dismantling Long-Term Contract Rigidity2. Developing a Standardized Short-Term Gas Contract3. Market Center and Hub Services4. The Development of Hubs and Market Centers: The Henry Hub5. NYMEX Division Henry Hub Natural Gas Futures and Options ContractSpecifications
Figures1. Traditional Structure of the U.S. Gas Industry, before 19952. Structure of the U.S. Gas Industry with Open Access to Pipeline Transportation, 1985-92

3
3. Structure of the U.S. Gas Industry after Unbundling of Sales from PipelineTransportation, after 1992
4. Organization of Trading in the Wholesale Gas Market5. Trading in Market Centers and Hubs

4
The deregulation of the natural gas industry in the United States has given free rein tomarket forces in most of the industry. The main goal of deregulation was to liberalizenatural gas trading and supply, the industry segments with the greatest potential tooperate as competitive markets. Another major goal was to improve the regulatoryoversight of pipeline transportation, which is dominated by natural monopolies.
The wholesale natural gas market became the target of radical liberalization. Natural gasprices were liberalized, entry to the market was deregulated, and pipeline transportationwas unbundled from natural gas sales. These measures helped create a competitivewholesale market. In pipeline transportation, economic regulation has gradually movedaway from direct price setting to price flexibility, to allow pipeline companies to adjustmore readily to changing market conditions. Deregulation has greatly benefited theparticipants in the U.S. natural gas industry.
This paper examines the development and functioning of natural gas and gastransportation markets in the United States. It first provides an overview of thederegulation of the U.S. natural gas industry, then looks at market structure, theorganization of trading, and contracting practices in the natural gas market. It analyzes thetrading of pipeline capacity in primary and secondary markets and the regulation ofpipeline transportation. It then identifies mechanisms that pipeline companies use tocoordinate the many bilateral transactions in natural gas and transportation markets inorder to optimize pipeline transportation in the deregulated natural gas industry. Finally itsummarizes the main achievements of deregulation of the U.S. natural gas industry.
Deregulation and Structural Changes
The U.S. natural gas industry has gone through a complete cycle of governmentintervention during the past 60 years. During the first several decades the gas industryenjoyed only limited oversight by the government. Then came the Natural Gas Act of1938, which established a basis for regulating gas prices and the activities of gascompanies. Regulation gradually tightened over the next forty years. Interstatetransactions - those between participants in two different states - came underregulation by the Federal Energy Regulatory Commission (FERC). Intrastate transactionscame under regulation by state public utility commissions.
Heavy regulation produced poor results. Low wellhead prices discouraged exploration forand production of natural gas. Transportation and distribution markets becamemonopolized. The retail prices of natural gas were distorted and did not reflect itseconomic value. All this generated large inefficiencies in all segments of the gas industryand imposed high costs on consumers. A wave of gas shortages in the late 1970sprompted a search for new ways to regulate the gas industry - ways that would allowmore room for decentralized transactions among industry participants.
Deregulation of the U.S. natural gas industry in the past 20 years has focused primarilyon interstate gas transactions. Since the major producing and consuming regions in the

5
United States are separated by several state borders, deregulation of interstate gastransactions had a major impact on the operation and efficiency of the natural gasindustry. The deregulation of such transactions started in 1978, when Congress adoptedthe Natural Gas Policy Act authorizing FERC to liberalize interstate natural gas markets.In 1989 Congress approved legislation liberalizing wellhead gas prices, and in 1992legislation freeing up interstate natural gas transactions. And during the 1980s and 1990sFERC introduced executive orders that gradually established a framework for the actionsof market forces in the natural gas industry.'
Regulatory change
Among the regulatory measures, FERC Orders No. 436 of 1985 and No. 636 of 1992 hadthe greatest impact on how the natural gas industry operates. By Order No. 436, FERCinstituted an open access regime for interstate pipeline transportation. This regimeenabled local distribution utilities and large end users to bypass pipeline companies' gassales and purchase natural gas directly from producers. Although the open access regimewas voluntary for pipeline companies, it was widely accepted because it enabled them toincrease the utilization of pipelines. But large-scale implementation took place only afterFERC resolved the issue of how the costs of the transition to open access were to bedistributed.
Before 1985 pipeline companies concluded long-term take-or-pay supply contracts withgas producers to secure gas supply for distribution utilities and end users. Order No. 436allowed these customers to exit from long-term supply contracts, but left the pipelinecompanies with large take-or-pay obligations to producers. Pipeline companies werehesitant to implement the open access regime until FERC Order No. 500 allowed them topass a share of the transition costs to procurers, distribution utilities, and end users.
Order No. 436 was followed by the Wellhead Decontrol Act of 1989, which deregulatedthe wholesale price of natural gas in all interstate transactions. This legislation freed gasproducers from the burden of regulation and promoted competition in the wholesalenatural gas market.
Order No. 636 introduced the most radical regulatory change in the gas industry since thebeginning of regulation in 1938. The order required pipeline companies to unbundle, orseparate, natural gas sale operations from pipeline transportation activities and set upseparate transportation and trading affiliates. This supported the development of naturalgas marketing, which was deregulated and opened to competition. The deregulated pricesof natural gas attracted many new companies into marketing and promoted fiercecompetition among marketing firms.
' Major legislative and executive measures were the Wellhead Decontrol Act of 1989, the Energy PolicyAct of 1992, and FERC Orders No. 380,436, 500, 636, and 577. For more informnation see Pierce 1988 andDe Vany and Walls 1995, or U.S. Department of Energy 1995a.

6
Order No. 636 also reformed the regulation of interstate pipeline transportation topromote fair rates and minimize regulatory distortion of natural gas prices. And it allowedresale of transportation contracts by shippers. That led to the development of a secondarytransportation market, where shippers can purchase pipeline capacity from other shippersthat have temporarily or permanently spare capacity. The secondary transportationmarket, known as the capacity release market, promotes efficient allocation oftransportation contracts among shippers and high utilization of natural gas pipelines.
Order No. 636 was followed by a series of measures by FERC that were designed topromote competition in the natural gas market and increase flexibility in pipelinetransportation. FERC issued orders and proposals to increase transparency and flexibilityin short-term capacity resale, allow shippers choice in delivery locations on interstatepipeline systems, and promote the standardization of contracts and pipeline systemoperation. FERC works with gas industry representatives in formulating new regulatorymeasures, helping to ensure that the measures adopted broadly benefit industryparticipants. FERC is now focusing on the development of a short-term transportationmarket where short-term capacity and interruptible contracts can be traded amongpipeline companies and shippers. This market will lead to more efficient pricing oftransportation services and enable pipeline companies to sell unsubscribed pipelinecapacity.
Structural change
Deregulation has changed the structure of the gas industry in the United States. Before1985 the industry was vertically separated into production, pipeline transportation, anddistribution (figure 1). But with all transactions tightly regulated and completed underlong-term contracts, the industry was de facto vertically integrated. Distributioncompanies could not choose a pipeline company unless their long-term supply contractexpired. Most marketed production was sold under long-term take-or-pay contractsbetween producers and pipeline companies. So little competition occurred among gasproducers despite the large number concentrated in several large producing areas alongthe Gulf Coast and in West Texas.
Figure 1 Traditional Structure of the U.S. Gas Industry, before 1985
Producer ___ cmaie___ Enusr
Gas transportation - - Gas sales
The introduction of open access to interstate pipeline transportation in 1985 limited theuse of long-term contracts and introduced competition to the wholesale gas market (figure2). Gas marketing emerged as a new segment of the natural gas industry. Local

7
distribution companies and large end users with direct connections to the interstatepipelines started to contract natural gas directly from producers. Many large end usersconstructed new connecting pipelines to bypass local distribution companies and gainaccess to the wholesale market. The unbundling of interstate pipeline transportation in1992 completed the transformation of the wholesale market into a fully competitivemarket (figure 3). Buyers of natural gas benefited, as average wellhead prices dropped by11 percent in real terms between 1988 and 1994.
Figure 2 Structure of the U.S. Gas Industry with Open Access to PipelineTransportation, 1985-92
- Local E- distribution _ _ _ G sae
Fiur 3 Stutr of thpelUSiannuse fe nunln fSlsrmPpln
Trnprain afte 1992s
Produc~~ers___ - >
.W,holesale -- _ - -l markt market M
- - - - - - - - - - - - -- utlie
- Gas transportation Bypass Pipeline - - - Gas sales
Tigure 3 Structure of the U.S. Gas Industry after Unbundling of Sales from PipelineTransportation, after 1992
suchcasoelectsandinustl ctomes, a Producers ~~ companiestrial
r_Marketers
F -- ~~~~~~~ -- v - - ; ---
Gas trasportation Bypass Pipeline - - - Gas Waes
The retail market has also experienced the introduction of open access and unbundling,but progress in deregulation differs from state to state. Typically, only large end users,such as electric utilities and industrial customers, are eligible for open access to interstate

8
pipelines. These customers have benefited a great deal from the deregulated wholesalegas market.2 Between 1988 and 1994 the average real price paid by industrial consumersand electric utilities decreased by 15 percent and 19 percent (table 1). Small end users(commercial and residential users) remain captive to local distribution companies becausetheir annual consumption is below the eligibility threshold for open access.3 These endusers saw a decline of only 3 percent in the real average price they paid for natural gasdeliveries between 1988 and 1994.
Table 1 Average Natural Gas Prices and Price Changes, 1988 and 1994(1994 dollars per thousand cubic feet)Category 1988 1994 Percentage changeWellhead 2.05 1.83 -11City gate 3.54 3.08 -13End use
Residential 6.64 6.41 -3Commercial 5.62 5.43 -3On-system industriala 3.58 3.05 -15Electric utility 2.83 2.28 -19
a. On-system sales are sales of natural gas to the end users by a local distribution utility.Source: U.S. Department of Energy 1995b.
Natural Gas Market
In the now competitive wholesale gas market trading takes place through bilateraldecentralized transactions among producers, marketers, local distribution companies, andlarge end users. Trading has become concentrated in spot markets organized by a numberof market centers in producing regions and consumer areas. These spot markets generateefficient price signals about the market value of natural gas, instantly reacting to actualand expected changes in supply and demand.
Deregulation of the gas industry has facilitated the separation of physical and financialtrading. Gas market participants minimize supply risks by balancing their demand withgas supply contracts in the short and long term. They minimize price risk by takingfinancial positions on their gas supply contract portfolio. As a result, two distinct marketshave developed in the wholesale natural gas market in the United States: a physical gasmarket, where contracts for physical natural gas delivery are traded, and a financial gasmarket, where contracts for price risk management are traded.
2 Electric utilities and industrial customers purchased 73 percent and 76 percent of total gas deliveries inthe wholesale market in 1995. They use local distribution companies primarily as transporters of naturalgas from an upstream gas market to their consumption site.3 Commercial consumers purchased about 23 percent of total consumption in the wholesale market, whileresidential customers purchased almost exclusively from local distribution companies in 1995.
9
Natural gas supply and deliveries
The natural gas market in the United States is the largest in the world, with a supply of24.3 trillion cubic feet in 1995. Almost 77 percent of this supply was produceddomestically in 1995. The rest came from storage withdrawals and imports, each ofwhich accounted for 12 percent. Gas production is concentrated in a large producingregion along the Gulf Coast in Louisiana and Texas; smaller producing regions are inAlaska, the Southwest, and the central United States. Imports from Canada provide animportant share of gas supply in consumer areas in the Northeast, the Midwest, and thePacific Northwest.
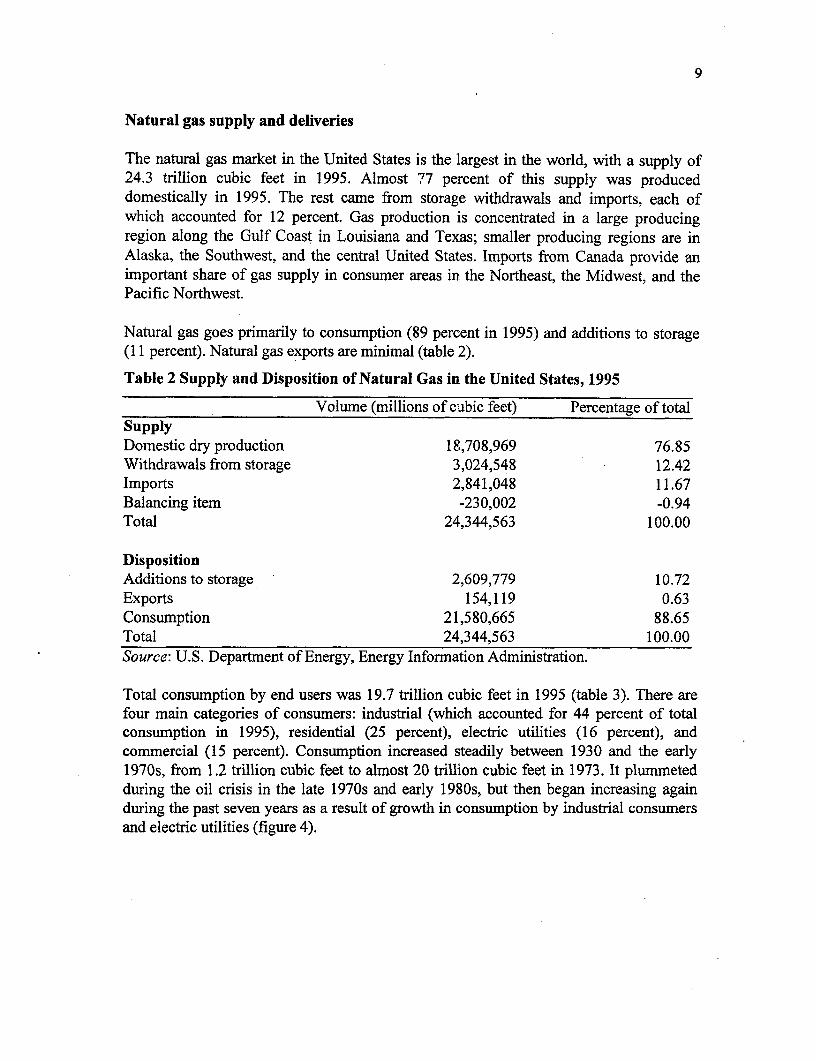
Natural gas goes primarily to consumption (89 percent in 1995) and additions to storage(11 percent). Natural gas exports are minimal (table 2).
Table 2 Supply and Disposition of Natural Gas in the United States, 1995
Volume (millions of cubic feet) Percentage of totalSupplyDomestic dry production 18,708,969 76.85Withdrawals from storage 3,024,548 12.42Imports 2,841,048 11.67Balancing item -230,002 -0.94Total 24,344,563 100.00
DispositionAdditions to storage 2,609,779 10.72Exports 154,119 0.63Consumption 21,580,665 88.65Total 24,344,563 100.00Source: U.S. Department of Energy, Energy Information Administration.
Total consumption by end users was 19.7 trillion cubic feet in 1995 (table 3). There arefour main categories of consumers: industrial (which accounted for 44 percent of totalconsumption in 1995), residential (25 percent), electric utilities (16 percent), andcommercial (15 percent). Consumption increased steadily between 1930 and the early1970s, from 1.2 trillion cubic feet to almost 20 trillion cubic feet in 1973. It plummetedduring the oil crisis in the late 1970s and early 1980s, but then began increasing againduring the past seven years as a result of growth in consumption by industrial consumersand electric utilities (figure 4).

10
Table 3 Average Prices and Deliveries of Natural Gas to U.S. Consumers, 1995
Average price Deliveries Deliveries as aConsumer category (dollars per 1,000 cubic feet) (millions of cubic feet) percentage of totalResidential 6.06 4,850,318 24.7Commercial 5.05 3,031,077 15.4
Industrial 2.71 8,579,585 43.6
Electric utilities 2.02 3,196,507 16.3
Vehicle fuel - 2,674 0.01
Total 3.79 19,660,161 100
- Not available.Source: U.S. Department of Energy, Energy Information Administration.
The average price of natural gas increased dramatically between 1970 and 1984 but hasbeen steadily decreasing since then (figure 5). Price increases before 1984 were caused byincreasing demand for natural gas, price rigidity imposed by regulation, and the impact ofthe oil crisis. Deregulation and increasing competition in the wholesale gas market havepushed wholesale and some retail prices down since 1985.
Large end users have benefited from the introduction of open access and the unbundlingof interstate pipeline transportation. These reforms have enabled them to participate in thecost savings achieved through competition in the wholesale gas market. The nominalaverage prices of natural gas at the wellhead and at large end users' consumption sitesdecreased dramatically between 1984 and 1995. The average wellhead price fell from$2.66 per thousand cubic feet in 1984 to $1.55 in 1995. The average retail price paid byindustrial consumers decreased from $4.22 per thousand cubic feet in 1984 to $2.71 in1995, and that paid by electric utilities from $3.70 to $2.02 (see table 3).
Small end users have also benefited from deregulation of the gas industry, but their gainshave been much smaller, mainly because of their limited choice in supply. Most smallend users remain captive to the local distribution company. State regulation of retailprices has allowed only limited transfer of cost savings from the wholesale market tosmall users.
The average retail price paid by small end users declined between 1984 and 1988 but thenincreased again. Commercial and residential users paid on average $5.55 and $6.12 perone thousand cubic feet in 1984. In 1988 average prices bottomed at $4.63 and $5.47 perone thousand cubic feet. Then they rose again, peaking above the 1984 levels in 1994. In1995 commercial and residential users paid on average $5.05 and $6.06 per one thousandcubic feet.
Retail prices of natural gas vary widely across the United States. Consumers in theNortheast and Southeast tend to face the highest prices, while those in the Midwest,
11
Pacific Northwest, and Southwest enjoy relatively low prices. Regional price differencesreflect differences in the source of natural gas supply, proximity to producing regions,availability of pipeline capacity, and state regulatory regime. The Northeast is relativelyfar from major producing regions and, together with Florida, lacks the pipeline capacityto bring more natural gas from the Gulf of Mexico. Louisiana and Texas are both majornatural gas producing states, while Illinois and California import large quantities of low-priced natural gas from Canada (figure 6).
Physical gas market
The physical wholesale gas market in the United States is very competitive. Both supplyand demand sides of the market involve participants from all segments of the industry.Producers, pipelines, marketers, local distribution companies, and large end users bothbuy and sell positions to minimize the costs and risks of natural gas supply. Transactionsare concluded on a bilateral basis between market participants; many of them involveintermediation by gas marketers. Most natural gas trading takes place in spot marketsorganized by market centers and hubs and facilitated by electronic trading systems.
Physical gas contracts
Natural gas is traded through bilateral gas contracts that specify the conditions ofdelivery. These contracts have many dimensions that are determined by the conditions ofgas supply, the most important being volume, unit price, calorific value, and location,time, and duration of delivery. Gas supply contracts differ a great deal in almost all thesedimensions. But the main differentiation in gas contracts is the duration of supply. Threemain types of gas contract have been developed during deregulation: long term, mediumterm, and short term.4
Long-term contracts A long-term contract covers deliveries and receipts for more than 18months. Such contracts typically specify a fixed quantity of gas to be delivered on amonthly basis. They are used primarily by firms that require reliable and long-termcommitment to natural gas supply, often to support long-term investment in gasproduction or transportation facilities.
The prices of long-term gas tend to be flexible and are often indexed to spot and futuresprices of natural gas. If the futures market does not generate reliable price signals for theduration of a contract, the parties to the contract can agree on variable or fixed reservationfees that recover the seller's costs of making supply available in the long term.Alternatively, the parties can combine physical and financial contracts to create a de facto"contract for differences" in which they effectively set a floor or cap on price movementsduring the life of the contract.
4 The definitions of gas contracts in this section draw on U.S. Department of Energy 1994.

12
Long-term contracts were commonly used in the U.S. natural gas industry before 1984.But traditional contractual arrangements created rigidity that later impeded competition inthe gas market. Producers, interstate pipelines, and local distribution companies werelocked into contractual relationships through take-or-pay or minimum obligation clausesthat forced them to pay fixed amounts regardless of delivery. Order No. 436 eliminatedthis rigidity by transforming long-term gas supply contracts into long-term transportationcontracts between pipeline companies and their downstream customers. This allowedindependent acquisition of natural gas by downstream customers, but left pipelinecompanies with substantial transition costs because of their large uncovered obligationsto producers. Until FERC allowed the distribution of these transition costs amongindustry participants, interstate pipelines were hesitant to implement the open accessregime (box 1).
Box 1 The Transition Costs of Order No. 436: Dismantling Long-Term Contract Rigidity
Before 1984, pipeline companies and natural gas producers concluded long-term take-or-pay contracts that requiredthe pipeline companies to buy the contracted volume of natural gas or pay a fixed amount for untaken volumes. Thepipeline companies in tum transferred these obligations to their downstream customers. Under a minimum paymentobligation clause, pipeline customers paid a fixed charge related to contracted capacity and volume even if they didnot take any delivery. All participants, tied by their long-term contracts, were unable to purchase or sell natural gaselsewhere. This Contract rigidity became a substantial impediment to implementation of the open access regime ininterstate pipeline transportation.
The minimum payment provisions gave pipeline companies little incentive to acquire natural gas from producers atthe minimum cost, because they passed through producer prices directly to their downstream customers. Regulatorydistortions and the oil crisis of the 1970s contributed to a dramatic increase in producer prices in the late 1970s andearly 1980s, leading to numerous complaints by consumers. Order No. 380 eliminated minimum paymentobligations in 1984. Order No. 436 allowed pipeline customers to purchase gas independently and transformedlong-term supply contracts into long-term transportation contracts. Many large customers stopped purchasingnatural gas from pipeline companies, which were suddenly left with large take-or-pay obligations to producers.
The burden of these take-or-pay obligations created substantial transition costs for pipeline companies and tumedthem against the open access regime. They were unwilling to provide open access to their pipeline systems unlessproducers and downstream customers took a fair share of the transition costs. These costs were estimated at $20billion by 1990, compared with a total book value for interstate pipelines of $23.8 billion in 1984 (Pierce 1988). In1987 Order No. 500 resolved this issue by allowing pipeline companies to transfer up to 75 percent of transitioncosts to producers and downstream customers. In the end, producers absorbed about $10 billion of the transitioncosts, local distribution companies $6.5 billion, and interstate pipeline companies $3.7 billion.
Source: Pierce 1988 and U.S. Department of Energy, Energy Information Administration.
Medium- and short-term Contracts As traditional long-term contracting becameimpractical in the deregulated gas market, market participants developed contracts with ashorter duration of gas supply that would give them the flexibility to adjust natural gascontracting to the frequently changing market environment. Contractual flexibility isimportant for least-cost acquisition of natural gas in deregulated gas markets affected bychanges in weather, economic activity, availability of transportation, and the like.

13
Medium- and short-term gas supply contracts have therefore become increasingly popularamong natural gas buyers in the U.S. gas industry.
A medium-term gas contract covers gas delivery for up to 18 months, but the mostcommon medium-term contracts are for a year or less. These contracts usually specify thevolume of monthly or daily gas deliveries, including allowed variation. The price ofnatural gas is typically indexed to spot and futures prices, depending on the location ofdelivery. Buyers also pay reservation and service fees to the supplier for making naturalgas available for delivery and providing variability in the volumes delivered on a daily ormonthly basis.
Short-term gas contracts are frequently traded in natural gas spot markets. A typicalshort-term contract - a spot contract - is for delivery during one calendar month. Thespot contract specifies a fixed price for the natural gas, equal to the prevailing marketprice at the time of contract completion. Delivery is for a fixed volume, with consistentdaily deliveries over the calendar month. Trading of a spot contract can take placeanytime before the delivery month and is terminated about five business days before thefirst day of the delivery month.
Contracts for less than one calendar month are typically used for balancing. Marketparticipants that ship natural gas through the pipeline system are required to maintain amonthly balance between the volumes they inject and withdraw. If shippers withdrawmore natural gas than they inject, they purchase the missing gas in the spot market in theform of a balance contract. Otherwise, they will incur penalties imposed by the pipelinecompanies.
A large volume of gas trading in the spot market leads to a need for standardized gascontracts to lower transaction costs. Interactions among hundreds of participants in thespot market become too complicated if the parties to contracts must develop andformulate all contract dimensions every time they conclude a transaction. Manytransactions are concluded rapidly by telephone or over electronic networks, with thecontracts signed later. If traders cannot trade under commonly accepted standards, theyare hesitant to conclude deals this way. Standardizing contract language, the terms andconditions of transactions, and the use of contracts should reduce the time and cost ofnegotiating and administering contracts.
To promote standardization in the U.S. gas market, industry participants set up the GasIndustry Standard Board, a nonprofit organization. The board cooperates with FERC,state public utility commissions, and other industry associations in developing standardsfor operations in natural gas and transportation markets. Its efforts include thedevelopment of a standardized short-term gas contract (box 2).

14
Box 2 Developing a Standardized Short-Term Gas Contract
Numerous calls from the industry prompted efforts by the Gas Industry Standard Board to develop a standardizedcontract for gas sale and purchase. After a year of drafting and consultation with the industry, the board presented amodel short-term gas purchase and sale contract for comments in 1996. The model contract has three parts:
* The base contract, containing the names of contract parties and the contract provisions (selected from thegeneral terms and conditions section).
* General terms and conditions, containing the list of all available contract provisions.* Transaction confimnation, specifying the price, quantity, delivery points, delivery period, and type of
transaction (firm or interruptible).
The model contract should facilitate transactions in spot markets, particularly on the electronic data interchange.
Source: Gas Industry Standard Board.
Organization of natural gas trading
The organization of natural gas trading has changed dramatically as a result ofderegulation. Traditionally bilateral, transactions now often involve intermediation bynatural gas marketers (figure 7). Marketers aggregate the demand of many end users andsmall local distribution companies and trade natural gas on their behalf, reducing the costof transactions in the natural gas market. The concentration of trading in market centersand hubs has led to the development of natural gas spot markets. And the introduction ofelectronic information systems has promoted electronic trading in these spot markets.
Figure 4 Organization of Trading in the Wholesale Gas Market
I: - - -- - - - - distribution__cmpanies
- - -d -- - - - - - ~E
Intermediation
|IProducwr | dtstnbutionl~~ _ _ - |~~~companies|
Spot market
Ei3- |~~~~~~~~~~~~~~~~~~diutbutionl|
Miarketa , Mark
hb 1 _ isdtributionIEi- ' ~~~ | MlukeXr t ~~~compais~~~~~~~~~~~~~~ EndM G

15
Bilateral Trading In bilateral trading, the traditional form of natural gas trading, buyerspurchase natural gas directly from producers or other natural gas suppliers. Natural gas istraded under long-, medium-, and short-term supply contracts. Depending on theagreement, one of the parties to a contract arranges transportation of natural gas to thedelivery point. Trading is decentralized, with each buyer and seller shopping around forthe best terms.
Bilateral trading benefits market participants because it allows them to complete onlythose transactions that suit their needs. Liquid spot and futures markets give price signalsabout the market value of natural gas, helping market participants make decisions aboutthe optimal structure of their contract portfolio. They can combine long-, medium-, andshort-term contracts in a way that minimizes the acquisition costs for natural gas andmaximizes the reliability of supply.
But the increasing complexity of the gas market reduces the efficiency of bilateraltransactions. Bilateral dealing segregates supply and demand into many portions thatplayers seek to match at the minimum cost. Each market participant must bear thetransaction costs incurred in searching for the least expensive natural gas or in adjustingits contract portfolio to the changing market. But some market participants do not havethe ability and the necessary information to complete transactions at the minimum cost.These participants will be willing to pay a fee for intermediation of transactions that willgive them the desired supply reliability at the minimum cost.
Participants with high consumption and load factors' tend to conclude bilateraltransactions themselves, because natural gas contracting and pricing is relatively simple.Low-volume users lack the resources to complete transactions at the minimum cost andtherefore rely on intermediaries. But if markets are very dynamic, even high-volumeusers may find it less expensive to authorize an intermediary to secure gas supplies thanto do it themselves.
Marketing The demand for intermediation of transactions in the gas market has given riseto natural gas marketing companies, which complete transactions on behalf of othermarket participants. Transactions are still bilateral, but they are completed between amarketer and other parties, such as producers, large end users, or local distributioncompanies. Marketers aggregate supply and demand for natural gas and match theirclients' offers and bids at the least cost. Marketers charge a fee for intermediation, but itmust be low enough so that market participants' total cost of gas supply is lower than thecost of individual gas acquisitions. Otherwise, market participants will not buy marketers'services.
5 Load factor measures the utilization of pipeline capacity by an end user or shipper. It is calculated as theratio of average daily throughput to peak-day throughput or the maximum daily quantity.

16
Aggregation of demand and supply allows marketers to diversify the risk of demand andsupply mismatch. This risk arises when market participants with different demandcharacteristics try to match supply and demand individually. Marketers are able to poolthe risks of contracts in one portfolio that gives them flexibility to adjust purchasing orselling strategies in response to changes in the market. The larger a marketer's portfolio,the better able the marketer is to diversify individual supply and demand risks.
Marketing companies constitute a dynamic segment of the U.S. natural gas industry.Producers, local distribution companies, and large end users have found trading throughmarketing companies beneficial because marketers offer both traditional gas supplyservices and a large variety of hedging instruments that reduce price and supply risks.The first marketing companies emerged in the late 1980s, but their numbers surged afterimplementation of Order No. 636. Producers, pipeline companies, and local distributioncompanies formed marketing subsidiaries that took over natural gas acquisition and salesfrom the parent companies. The share of deliveries arranged by marketers increased from20 percent in 1987 to 49 percent in 1995 (Interstate Natural Gas Pipeline Association ofAmerica 1993 and 1996).
The efficiency of trading intermediated by marketers depends on the fees they charge forservices. The U.S. gas marketing segment is very competitive. Marketing fees andoperations are liberalized, and the segment is open to entry. Marketing firms competefiercely for market share and customers. The increasing complexity of natural gasmarkets has forced marketing companies to expand and diversify in order toaccommodate their clients' diverse needs. In 1995 and 1996 the marketing segmentexperienced a wave of mergers and acquisitions intended to achieve "operatingeconomies of scale, superior databases and the ability to offer superior risk managementproducts" (Energy Online Daily News, February 27, 1996).
The restructuring of gas marketing has increased the market shares of the top competitors.For example, Chevron Corporation and NGC, the second and sixth largest gas marketers,merged in 1996 to create the largest marketing company in the United States, withaverage daily sales of 10 billion cubic feet. Similar mergers took place between otherlarge players, increasing the concentration of sales. While the top 10 marketers arrangedaverage daily sales of about 31 billion cubic feet, or 42 percent of U.S. dailyconsumption, in 1994, the top four marketers accounted for this volume in 1996 (U.S.Department of Energy 1996). This market concentration leaves little room for smallmarketing companies. But small marketers play an important part in local markets, wherethey meet the needs of local customers that are not commercially attractive to majormarketers.
Market Centers and Spot Markets The liberalization of natural gas prices and increasingflexibility in the natural gas market have promoted the development of market centersand hubs. Transactions in the wholesale market have gradually moved from wellheads orconsumption sites to hubs at major interconnections of interstate and intrastate pipelines.Hubs were formed and are typically operated by one or several interstate pipeline

17
companies that own the pipelines interconnecting at the hub. Hubs allow marketparticipants to acquire natural gas from several independent sources and ship it to severaldifferent markets (figure 8). This eliminates the need to contract natural gas and pipelinecapacity all the way from the wellhead to the consumption site. Instead, shippers cancombine supply routes across several hubs to diversify supply risks.
Figure 5 Trading in Market Centers and Hubs
Pipeline Pipelinecompany company
\ / | ~~~~~~~~LocalProducers Xs /distribution
Co y c ycompanies
JVcente rhb _
Pipeie PplnCompn opn
Pipeline capacity transactions - Natural gas transactions
Hubs have become very popular among marketers and other players in the gas market.Hub operators have gradually increased the scope of hub services from physical transferof natural gas to storage, processing, and trading services (box 3). The large variety ofservices has led even more shippers to use hubs for transportation and acquisition ofnatural gas. The recent introduction of electronic trading systems has allowed theseparation of trading from physical infrastructure and led to the development of marketcenters connected to one or several hubs by electronic networks, Electronic trading allowsmarket participants to trade natural gas and pipeline capacity at all interconnected hubsand pipelines (see U.S. Department of Energy 1996).

18
Box 3 Market Center and Hub Services
Market centers and market hubs offer a large variety of services. These are the most commonly used ones:
Wheeling--Essentially a transportation service in which gas is transferred from one interconnected pipeline toanother through a header (hub), by displacement (including exchanges), or by physical transmission over a marketcenter pipeline.Parking-A short-term transaction in which the market center holds the shipper's gas for redelivery at a later date.Often uses storage facilities, but may also use displacement or variations in line pack.Loaning-A short-term advance of gas to a shipper by a market center that is repaid in kind by the shipper a shorttime later. Also referred to as advancing, drafting, reverse parking, and imbalance resolution.Storage-Storage that is longer than parking, such as seasonal storage. Injection and withdrawal operations may beseparately charged.Peaking-Short-term (usually less than a day and perhaps hourly) sales of gas to meet unanticipated increases indemand or shortages of gas experienced by the buyer.Balancing-A short-term interruptible arrangement to cover a temporary imbalance. The service is often providedin conjunction with parking and loaning.Gas sales-Sales of gas that are used mainly to satisfy the customer's anticipated load requirements or salesobligations to others. Gas sales are also listed as a service for any market center that is a transaction point forelectronic gas trading.Title transfer-A service in which changes in ownership of a specific gas package are recorded by the marketcenter. Title may transfer several times for some gas before it leaves the center. The service is merely an accountingor documentation of title transfers that may be done electronically, by hard copy, or both.Electronic trading-Trading systems that either electronically match buyers with sellers or faciihate directnegotiation for legally binding transactions. A market center or other transaction point serves as the location wheregas is transferred from buyer to seller. Customers may connect with the hub electronically to enter gas nominations,examine their account position, and access e-mail and bulletin board services.Adminiistration-Assistance to shippers in the administrative aspects of gas transfers, such as nominations andconfirmations.Compression-Provision of compression as a separate service. If compression is bundled with transportation, it isnot a separate service.Risk management-Services that relate to reducing the risk of price changes to gas buyers and sellers - forexample, exchange of futures for physicals.Hub-to-hub transfers-Arranging simultaneous receipt of a customer's gas into a connection associated with onecenter and an instantaneous delivery at a distant connection associated with another center. A form of "exchange"transaction.
Source: U.S. Department of Energy, Energy Information Administration.
The first hub in the United States, the Henry Hub, was established in May 1988 in Erath,Louisiana (box 4). Since then, more than 50 hubs have been created across the UnitedStates. The largest hubs are the Henry Hub and the Katy Hub, in Texas. There are alsoabout 32 market centers operating in the United States, most located at large hubs inTexas and Louisiana. One of the most important market centers in consuming regions isthe Ellisburg-Leidy Center in Pennsylvania (U.S. Department of Energy 1996).

19
Box 4 The Development of Hubs and Market Centers: The Henry Hub
The Henry Hub is a major natural gas interchange center near Erath, Louisianai, operated by Sabine Pipe LineCompany, a subsidiary of Texaco. Marketers and traders at the Henry Hub have access to large consumer markets inthe Midwest, Northeast, Southeast, and Gulf Coast area through nine interstate and three intrastate interconnectingpipelines.
The Henry Hub became operational in 1988 as the first hub of its kind in North America. The volume transportedthrough the Hub increased from 230 million cubic feet of gas a day in 1989 to 550 in 1995, and Sabine has thecapability to transport more than 1 billion cubic feet of gas a day across the hub. Natural gas trading at the HenryHub began in 1988 and has developed over time into a large and liquid spot market. The Henry Hub became thepricing point for the New York Mercantile Exchange (NYMEX) natural gas futures contracts in April 1990 and theNYMEX options contracts in 1992.
The Henry Hub has attracted major natural gas traders thanks to Sabine's ability to offer shippers the flexibility tochange supply sources and markets through interconnecting pipelines. Sabine's pipeline system is relatively small,with only 189 miles of pipeline, but it can move gas in both directions in response to gas prices and hasinterconnections with 14 interstate and 22 intrastate pipelines. Sabine was the first pipeline operator in the U.S. gasindustry to use operational balance agreements - agreements among the interconnected pipeline companies toresolve monthly imbalances among shippers so that individual shippers do not incur an imbalance penalty. Sabinesigned such an agreement with the Natural Gas Pipeline Company in 1989, and by now has operational balanceagreements with all interconnecting pipelines. These agreements have contributed to the popularity of the Henry Hubamong gas traders and the high satisfaction of shippers with Sabine's services.
Source: Interstate Natural Gas Pipeline Association of America
Spot markets have been organized at almost all major market centers and hubs in theUnited States as well as at major city gates.6 Today there are more than 50 spot marketsin the United States. The most important is at the Henry Hub, where natural gas has beentraded since 1988.
The most important role of spot markets is to generate efficient price signals about themarket value of natural gas. In a competitive spot market prices reflect the short-runmarginal cost of gas at the location of the market - that is, the spot price is equal to thevalue of a marginal unit of gas traded in the spot market at a particular time and thusreflects the market value of gas at that time. In practice, spot prices are derived from theprices of a large number of gas contracts traded in a spot market.
Market participants use spot prices to evaluate their gas contract portfolios. They also usespot prices for pricing natural gas traded under bilateral supply contracts, particularlylong-term supply contracts. Thus the pricing of most natural gas deliveries is linked tospot market prices, and as a result, most participants in the gas market face efficientprices as long as spot markets are competitive and well functioning.
6 City gates are delivery points on interstate pipelines where local distribution companies and large endusers receive interstate gas deliveries. Transportation beyond a city gate takes place on interstate ordistribution pipelines. City gates are located near large consuming areas. In the United States the largestcity gate is in Chicago (U.S. Department of Energy 1995a).

20
Electronic Trading Electronic trading is a new form of natural gas trading in the UnitedStates. Electronic trading systems either electronically match buyers with sellers orfacilitate direct negotiations for gas transactions. In the first case market participants postoffers and bids on the electronic system, which matches them anonymously. Transactionsare completed instantly as the system registers all offers and bids that are matched. In thesecond case electronic systems identify buyers and sellers and facilitate their transactions.Since electronic systems are connected to many market centers and pipeline companies,market participants can trade natural gas and pipeline capacity in several locations atonce. Market participants must purchase access to the electronic system, but they can useregular computer hardware to support transactions in the system.
Electronic trading reduces transaction costs and promotes efficient pricing of natural gas.Electronic systems aggregate demand and supply at one point, matching offers and bids atthe minimum cost to participants and generating systemwide prices that reflect theopportunity costs of natural gas.
The beginnings of electronic trading can be traced to the electronic bulletin boardsestablished by interstate pipeline companies in 1993 to support resale of pipelinecapacity. Standardization of these boards simplified trading of pipeline capacity andshowed the advantages of electronic trading. In late 1994 three commercial electronictrading systems were introduced that allowed market participants to trade natural gas andpipeline capacity across several markets and pipelines. By the end of 1996 electronicsystems had been introduced by almost all major pipeline companies.
Electronic systems are now used for trading natural gas, pipeline capacity, and storageand for communication between pipeline companies and shippers. These systems also arelinked to other commercial networks that supply information and news relevant to the gasindustry. The largest system, Altra Streamline, is linked to eight market centers in theUnited States and Canada and 45 electronic bulletin boards of interstate pipelines. Theaverage daily volume traded in this system ranges from 10 million to 200 million cubicfeet. The second and third largest systems, Channel 4 and Quick Trade, connect four andthree market centers, respectively, and a number of electronic bulletin boards. Majorinterstate pipeline companies operate electronic systems that give access primarily totheir own electronic bulletin boards. Small systems integrate with large ones reflectingthe demand for services that allow trading across all major gas markets in the UnitedStates (U.S. Department of Energy 1996).
A new role for storage
Natural gas storage has played a significant part in ensuring adequate gas supplies sincethe 1930s. Pipeline companies and local distribution companies used storage facilities tomeet seasonal and peak gas demand during heating seasons and to balance pipelineoperations on a daily basis. The traditional role of storage was to ensure high reliability ofgas supply; cost-effectiveness in storage operations was neglected.
21
A new role for gas storage is to promote efficient transactions in the deregulated naturalgas market. Storage operation is being unbundled from pipeline transportation andderegulated, and cost-effectiveness is being emphasized. As the unbundling of pipelinetransportation has improved price discovery at various points on the pipeline system,storage facilities have increasingly been used to arbitrage locational and time differentialsin gas prices. Storage operators take advantage of swings in spot prices by selling naturalgas at high prices and buying at low prices. These transactions benefit market participantsthrough greater availability and more efficient pricing of natural gas in the spot market.
Storage also contributes to more productive use of pipeline capacity. Storage facilities areplaced at market hubs and city gates, where storage operators offer a range of servicessuch as storing, parking, loaning, and balancing natural gas.7 Shippers and pipelinecompanies use these services to balance their shipments and flows of natural gas in theshort, medium, and long term. Storage thus enables pipeline companies to increase loadfactor and reduce seasonal load variations. Intelligent use of storage within a system ofhubs can create significant throughput capacity for the transportation grid at a capital costof 1 to 2 percent as much as the next cheapest alternative.8
The most common types of underground storage in the United States are depletedreservoirs in oil or gas fields, salt caverns, and aquifers. A small amount of gas is alsostored in liquefied natural gas and propane-air storage facilities. At the end of 1995 therewere 403 underground storage facilities in operation in the United States, with totalworking capacity of 3.8 trillion cubic feet and daily deliverability (the amount that can bewithdrawn in a day) of 69.3 million cubic feet of natural gas. Depleted oil or gas fieldstorage accounted for almost 88 percent of working capacity, compared with 10 percentfor aquifers and 2 percent for salt caverns. The share of depleted gas and oil fields indaily deliverability was 86 percent, that of salt caverns 14 percent and that of aquifiers 10percent (U.S. Department of Energy 1995c).
The commercial success of storage in deregulated gas markets depends on highdeliverability of natural gas to the market rather than on total working capacity. Storageoperators need to be able to inject and withdraw natural gas quickly to react to highlyvolatile spot prices. As a result, salt cavern storage facilities have become increasinglypopular among storage operators in the United States. Because there is no resistance in asalt cavern, gas can flow into and out of the cavern readily. The operator of an averagesalt cavern is able to withdraw all its gas in 10 to 11 days and refill it in only 20 days,compared with nearly 60 days to withdraw all gas from traditional depleted gas fieldstorage (U.S. Department of Energy 1995c).
7 Twenty-six of the 39 market centers in the United States and Canada offer storage as a major service(U.S. Department of Energy 1996).s Approximately $0.5 billion invested in a system of hubs with high-deliverability salt storage can displace$40 billion to $80 billion of incremental expansion in the existing pipeline infrastructure (Bickle 1996).

22
Salt cavern storage facilities are steadily gaining market share at the expense oftraditional storage using depleted gas or oil fields. New storage projects completed in1995 added about 47 billion cubic feet of working gas capacity and 1,395 million cubicfeet of daily deliverability to the storage market. Although salt cavern storage facilitiesaccounted for only about 30 percent of the new capacity, they accounted for 65 percent ofthe new daily deliverability.
The location and ownership of salt cavern storage reflect the commercial focus of storageoperators in deregulated gas markets. Most salt cavern storage is in market centers andhubs. For example, 13 of 19 salt cavern facilities in the Southwest are in market centers.Independent operators control 50 percent of salt cavern storage facilities, giving them a12 percent share in daily deliverability, though only an 8 percent share in workingcapacity.
Financial gas market
The opening of the gas industry to competition and the development of natural gas spotmarkets have generated price volatility that was absent in the tightly regulated industry ofthe past. As industry participants started to look for ways to minimize price risk throughfinancial instruments, markets responded by offering financial natural gas contracts usedfor hedging, speculation, and arbitrage.
There is now a well-developed financial natural gas market. Financial intermediaries andnatural gas marketers offer customized financial instruments that transfer risk amongindustry participants. In addition, two organized exchanges offer several standardizednatural gas futures and options contracts used by traders and industry participants tominimize price risk in many gas delivery locations. These contracts have promotedefficiency in the natural gas industry as market participants have taken advantage ofarbitrage opportunities in locational prices and regional natural gas markets have becomemore nationally integrated.
Financial gas contracts
Financial gas contracts are used to manage two types of risk in the natural gas market,price and basis risk. Price risk is generated by the volatile spot market prices of naturalgas. Basis risk is the risk of change in the price differential between locations, timeperiods, and qualities of gas deliveries and between natural gas and other commodities.
Seven major types of financial gas contracts have been developed in the U.S. financialgas market, each using a different technique to manage price and basis risk:9
* Futures contract - a legal agreement between a party that opens a position on thefutures market to buy or sell natural gas and the commodity exchange. The party
9 The definitions of financial gas contracts draw on U.S. Department of Energy 1994 and NYMEX 1996.

23
agrees to accept or deliver, during a specified future month, a certain quantity ofnatural gas (10 billion British thermal units per contract) meeting quality and deliveryconditions described by the exchange. If delivery takes place, it occurs during thedelivery month at a prescribed futures settlement price. Futures contracts are tradedexclusively on regulated exchanges and are settled daily based on their current valuein the marketplace.
* Forward contract - a supply contract between a buyer and seller under which thebuyer is obligated to take delivery and the seller is obligated to provide delivery of afixed amount of natural gas at a predetermined price on a specified future date.Payment in full is due at the time of, or following, delivery. A forward contract differsin this way from a futures contract, under which settlement is made daily, resulting inpartial payments over the life of the contract.
. Swap - custom-tailored, individually negotiated transaction designed to managefinancial risk, usually over for 1 to 12 years. Swaps can be conducted directly by twocounterparties or through a third party such as a bank or brokerage house. The writerof the swap, often a bank or brokerage house, may elect to assume the risk itself or tomanage its market exposure on an exchange. Swap transactions include interest rateswaps, currency swaps, and price swaps for commodities. In a typical commodity orprice swap the parties exchange payments based on changes in the price of acommodity or a market index, effectively fixing the price they pay for thecommodity. Settlements are usually made in cash. Natural gas basis swaps are over-the-counter agreements to exchange the difference - called the basis - between thenatural gas futures price on the New York Mercantile Exchange (NYMEX) and afixed price at a specific location.
Hedge - a position taken in the financial market to offset a position in the physicalmarket. The expectation is that gains and losses from price movements in the twomarkets will consistently offset each other until the position in the financial market isclosed (ideally, this occurs at exactly the same time that the position in the physicalmarket is closed). Thus a hedge is a combination of futures and physical contracts thateffectively fixes the price of natural gas. Long hedges protect the purchase price, andshort hedges the inventory value.
* Options contract - a contract that gives its holder the right, but not the obligation, topurchase or sell the underlying futures contract at a specified price within a specifiedperiod in exchange for a one-time premium payment. The contract also obligates thewriter, who receives the premium, to meet these obligations.
Exchange offutures for physicals (EFP) - a futures contract that has a delivery pointother than that in a specified second futures contract. The price of the EFP may thendeviate from the price of the specified futures contract. An EFP may be concluded atany time before the close of the market for the specified futures contract by mutual
24
agreement of the two parties holding opposite positions on that contract. The mainreasons for trading EFPs are elimination of execution risks, ability to choose acontractual partner, and flexibility in location and supply conditions.
* Alternative delivery procedure - a transaction that takes place after the terminationof trading in a spot month contract, for example, a futures contract. The buyer mayagree with the seller, with whom the buyer has been matched by the exchange, to takedelivery under terms or conditions that differ from the terms and conditions of therelevant standardized contract. The exchange must receive notifications of suchtransactions from the clearing members handling the accounts of the parties to thetransactions.
Financial gas contracts are divided into two categories: standardized andnonstandardized. Standardized contracts, such as natural gas futures and optionscontracts, are offered by and traded in organized exchanges. Nonstandardized contractsare offered by financial intermediaries or natural gas marketers to market participants ona caseby-case basis. Nonstandardized contracts, such as hedges or swaps, tend to varywidely, reflecting the variation in transactions. They developed before standardizedcontracts, as market participants searched for ways to manage price risk in the natural gasspot market.
Four major types of standardized natural gas futures and options contracts are traded inthe United States. NYMEX offers and provides a trading floor for three of them, eachwith a different delivery location. The first futures contract, traded since April 1990, isfor delivery for 1 month to 30 consecutive months, plus the 36th month (though only forthe June and December contracts, because these conclude the long-term contractingperiods), at the Henry Hub. The options contract for delivery at the Henry Hub was addedin April 1992. The Henry Hub futures contract is the most liquid financial gas contract inthe United States. (For the specifications of the NYMEX Henry Hub natural gas futuresand options contracts, see box 5.)
The second futures contract is for delivery in 18 consecutive months at the Permian Basinin West Texas. This futures contract was introduced on May 31, 1996, and the relevantoptions contract was launched seven days later. The third futures contract is for deliveryin Alberta, Canada, and was launched, together with an options contract, in September1996.
The fourth natural gas futures and options contracts were issued in 1995 by the KansasCity Board of Trade (KCBT), which also became a trading spot for these contracts. Thecontracts, called Western Natural Gas Futures and Options, are for delivery for up to 18consecutive months at the Waha-Permian Hub in West Texas.

25
Management ofprice risk
Market participants face substantial price risk in the deregulated natural gas market. Spotprices are volatile, particularly during cold periods. Two spells of extremely lowtemperatures in late January 1994 and February 1996, for example, caused extremechanges in the spot prices of natural gas at the Henry Hub. While the average spot pricein January 1994 was about $2.25 per million British thermal units, it reached $3.75 onFebruary 2, 1994, in the midst of the cold spell. Price changes were even more dramaticin 1995. The average spot price in February 1995 was at a record high of $4.41 permillion British thermal units, and spot prices peaked above $15 just before the coldestweekend, on February 2, 1995.'° The volatility of spot prices increased from the annualaverage of about 40 percent to more than 60 percent in February 1994 and almost 140percent in February 1995 (Natenberg 1996).
Financial gas contracts allow market participants to minimize this price risk in thephysical gas spot market by taking positions in the financial gas market. The range offinancial contracts available enables them to form the positions in cash and financialmarkets that best reflect their desired level of risk aversion. Although market participantsuse financial contracts for hedging, arbitrage, and speculation, the primary use remains tominimize price risk.
'0 Prices at city gates were even more volatile than at the Henry Hub. For example, some industrialcustomers in Chicago paid $45 per million British thermal units to avoid imbalance penalties of more than$60 per million British thermal units (U.S. Department of Energy 1996).

26
. Box 5S YE Diyvision Henry HubNuralGasFutures and Op0tions CnrtSpecifications 0
tRadin mooft~Futures andloonD 1 0a0nt opeoty i ehs tdnc d thr e NYMtsAC£CESS@ elecronic trading sseasv frm qpm. to ".m!, Monday through Thurdy All times are New Yrktms.
F vtures 3cnsee mons commen iththntedmo e on October 3, 199,raigoccurs; o 0tin all month frmovesmber 199 thvuh'il 2000), plus a long-dated cotrc initially liste 36 months out.0O ptions: 12 consecutive months, plus 18,2430, andt 36 moth on a Jne-ecmer cycle.
Fs: Dollarandens per mtilliont British nl unit, fo 3prmillion Britihthermal units.
Fu,iltures and qptions: $0.00 per million Britihthraluiuts $0perodntrat).00iEiii0000
Maximumdaily price fluctuationFutures: $1.50 per million British thermal units ($15,000 pe contract) forthe firsttw months. Initial back month limits of$0.1 5 per mllion iitish thel nt ther�nas settlement price inany back mionth is at the $0.15 limit. nthevnofa$.5prmlinBishhralui oeineither of he, first twocontract monoths, month limits are raised to $0.75 per millionBrits thmal units inall months from the liitplacein the directibon offtie move.Options: No price linits.
Last trdndaFtures: Trading terminates three business days before the first calendar d fthe dlieiro .Options: Trading terninates at the close of business on the businss da im dtyredingtepiration tf theunderlying futures contract.
Exercise of optionsBy a clearing member to the exchange clearinghouse not later than 5:30 p.m. or 45 m s e eunderln I turessettlement price is posted, whichever is later, on any day up to and including the optio iration.
Option strike pricesStrike prices are in increments of $0.05 per million British tera units wit at la 5 ove i 1 o thegat-the-money strike prices, 15 in $0.05 intervals, and eight ab or blow th thet$0.0 incrment in $5 s Iftaddition, in tht three month
Delivery - -
SalUine Pipe Line Co.'s Henry Hubi oiin.Tesle~1eoiil rhId4Aa lb~truh~hbuyer, from- 3te 0ub. The hub fee
Delivery peoriod <
Delivery shalltae place no earlier than the frtclna a fh eieymnheo1* ecmltdn<~e1xntelost calendar day of the delivery mnonth. Alldeirissabemeaanhu1d lrtoQwsover the cot4se hof h delivery mnh ",<,

Alternative delivery periodAn alternative delivery procedure is available to buyers and sellers who have been matched by the exchangesubsequent to the termination of trading-in the spot month contract. If buyer and seller agree to consummate dehlveryunder terms different from those prescribed in the contract specifications, they may proceed on that basis aftersubmitting a notice of their intention to the exchange.
Exchange of futures for, or in connection with, physicals (EFP)The commercial buyer or seller may exchange a futures position for a physical position of equal quantity by submittinga notice to the exchange. EFPs may be used to either initiate or liquidate a futures position.
Quality specifidationsPipeline specifications in effect at time of delivery.
Position limits.12,000 contracts for all months combined, but not to exceed 750 in the delivery month or 7,500 in any one month.
Margin requirementsMargins are required for open futures and short options positions. The margin requirement for an options purchaserwill never exceed the premium paid.
Trading symbolsFutures: NGOptions: ON
Source: NYMEX
Market participants unable to accept price risk because of technology or demandconstraints are willing to pay a premium to reduce the risk to an acceptable level. Thisdemand can be served by a financial gas contract that transfers the risk to the issuer of thecontract in exchange for a payment. Such price risk management is often intermediatedby natural gas marketing companies or financial intermediaries.
Intermediation of price risk management benefits both marketers and their contractualpartners. Marketers have lower risk aversion and better knowledge of markets andhedging strategies than most other participants in the gas market and can thereforeprovide better and less expensive risk hedging. Marketers sell market participants riskmanagement services in the form of financial gas contracts, at a premium that reflects therisk of the transaction. They then combine the risks of individual financial contracts intoone portfolio and minimize the overall risk by taking positions in physical and financialgas markets.
Intense competition among marketers drives premiums down toward the least cost ofhedging risk. The increasing complexity of the gas market and competition among naturalgas marketers have led to consolidation of the marketing segment as a number ofmarketing companies have emerged into several large marketing houses in order toreduce costs, diversify services in natural gas markets, and expand into the developing

28
electric power markets. The critical size of a natural gas marketing firm has increasedfrom 3 billion cubic feet of natural gas per day in 1994 to 5 billion cubic feet in 1995,reflecting the increase in the size of the optimal gas portfolio for a marketing firm(Energy Online Daily News, February 27, 1996).
Management of basis risk
The existence of several standardized contracts with different delivery locations signalsthe presence of basis risk in the natural gas market - the uncertainty that the cash-futuresdifferential will widen or narrow during the time a hedge position is implemented andliquidated." Basis risk depends on three price relationships:
* That between the price of a futures contract and the spot price of gas - cash-futuresbasis.
* That between the spot price at the futures delivery point and the spot price at adifferent location - locational basis.
* That between the spot price at the futures contract delivery point and the spot price ofa similar but not identical commodity at the same location - intercommodity basis.
Strategies to minimize basis risk differ with the type of basis risk involved. Marketparticipants manage cash-futures basis risk using alternative delivery procedures, whichallow them to minimize cash-futures price differentials between the expiration of afutures contract and the start of physical gas delivery. This period is five days forNYMEX natural gas futures and one to three days for KCBT natural gas futures. Spotprices can change significantly during this period, leading to a difference between thevalue of gas acquired through a futures contract and the market value of gas.
Hedging intercommodity basis risk is a complex operation that differs from case to case.If commodities are commercially traded, the ability to minimize this type of basis riskdepends on the efficiency of the commodity markets involved. Because heating oil andnatural gas, for example, are substitutes in residential heating, their relative prices shouldreflect the relative values of heating equivalent as long as the markets are efficient.Market participants can minimize the intercommodity risk between heating oil andnatural gas by taking positions in cash and financial heating oil and gas markets based onrelative price changes. But if qualitative differences in a commodity are not commonlyused in the market - for example, calorific value - hedging tools may not be available.In this case parties to supply contracts must protect themselves by explicitly definingdelivery conditions and penalties in the contracts.
Locational basis risk is managed through exchange of futures for physicals contracts.EFPs allow hedging of locational basis risk for almost any delivery location on thepipeline system in the United States. But the efficiency of hedging by EFPs depends onthe trading volume of EFPs with the same delivery location, which in turn depends on the
" This definition of basis risk is based on NYMEX's (1996).

29
size of the spot gas market at that location. EFPs provide effective hedging of locationalbasis risk only at the most commonly used locations, such as large market hubs or citygates.
The division of the U.S. natural gas market into eastern and western parts has increasedthe locational basis risk of the NYMEX futures contract with delivery at the Henry Hub.This contract helps hedge price risk for gas supplies directed to the eastern United States,but has proved insufficient for hedging price risk for gas supplies going to the westernUnited States, which originate in West Texas. As the locational price differentialsbetween the Henry Hub and West Texas have increased since the introduction of theHenry Hub futures contract, so has the locational basis risk faced by market participants.
Locational basis risk has also increased because of the growing imports of natural gasfrom Canada. Since the price risk in Canada is much different from that in the UnitedStates, price differentials between the Henry Hub and Alberta, Canada, were large andvariable. For this risk too, the Henry Hub futures contract was not an appropriate tool forhedging.
It was in response to the demand for instruments to hedge the locational basis risk in thewestern United States that the Kansas City Board of Trade launched the Western NaturalGas Futures and Options contract in August 1995. The contract's delivery point at theWaha-Permian Hub in West Texas is better linked with the Western than is the HenryHub. The commercial success of this contract shows that shippers to the West viewed thelocational basis risk at the Henry Hub as a serious problem.
The launch by NYMEX in May 1996 of the futures and options contracts with delivery inPernian Basin, West Texas, only 100 miles from the Waha-Permian Hub, createdcompetition between the two futures contracts. The NYMEX futures and optionscontracts with delivery in Alberta, Canada, were launched to serve the needs of customersthat rely on Canadian natural gas imports.
Trading in the financial gas market
The financial contract market is a dynamic segment of the U.S. natural gas industry. Afterthe start of futures trading in 1990, the volume of traded natural gas futures contractsincreased from 0.42 trillion cubic feet in 1991 to 80 trillion cubic feet in 1995, or fourtimes more than the end use consumption of natural gas in that year. The turnover infutures trading was $125 billion in 1994, about 60 percent more than the turnover inphysical gas sales in that year (U.S. Department of Energy 1994). Most trading is done bymarketers (which held 34 percent of the open interest on natural gas futures in the firstquarter of 1996), producers (25 percent), and financial institutions (20 percent) (NYMEX1996a). Their shares in previous years were similar. Marketers were also responsible for60 percent of the number of futures traded on NYMEX in 1993 (U.S. Department ofEnergy 1994).

30
The financial gas market is gradually reaching maturity, especially in standardizedcontracts as indicated by the small share of futures contracts resulting in physical delivery(table 4). On average, only 0.26 percent of natural gas futures contracts traded onNYMEX were held until expiration in 1995, compared with 0.14 percent of crude oilfutures contracts (the most mature contract traded on NYMEX), 0.18 percent of heatingoil futures contracts, and 3.4 percent of propane futures contracts. The low level ofphysical delivery indicates that market participants use futures contracts as an instrumentfor price risk management - their primary purpose - not for physical gas delivery.
Table 4 Delivery Structure of Natural Gas Contracts at NYMEX, 1993-96(millions of British thermal units)
Deliveries as aDeliveries of Futures percentage of
Year futures trading volume Deliveries of EFPs trading volume1993 10,417 3,775,517 79,725 0.281994 15,923 6,223,401 147,039 0.261995 20,025 7,621,742 209,323 0.261996 13,223 4,556,290 142,371 0.29
Source: NYMEX.
Most of the final deliveries of financial gas contracts at NYMEX took place under EFPs,whose delivery rate is about 10 times that for futures. While futures contracts are used forhedging and speculation at only three locations (the Henry Hub, West Texas, andAlberta), EFPs can be used for delivery at any location. Thus EFPs can hedge the risk ofchanging price differentials between a standard delivery location and any location in thenationwide pipeline system and are naturally used more often than standard futurescontracts.
The natural gas market has become more efficient with the increasing use of futurescontracts. De Vany and Walls (1995) analyzed cointegration between spot and futuresprices between June 1990 and June 1994 and found evidence that prices in the futuresmarket accurately reflected the future spot prices of gas at the Henry Hub and sevenmajor spot markets. They also found that the price differentials between locationsreflected the costs of transportation. They concluded that the futures prices of a month-ahead contract revealed the closing futures price, and that spot prices in the Henry Hubare an unbiased predictor of the future spot price.
Transportation Market
A natural gas transportation market is a marketplace where pipeline capacity andtransportation services are traded. The interstate pipeline transportation market is themost competitive transportation market in the United States because of the unbundling of

31
this industry segment."2 The supply side of the market consists of interstate pipelinecompanies, and the demand side of shippers that purchase pipeline capacity andtransportation from the pipeline companies. Shippers are usually marketers, localdistribution companies, producers, or large end users. Transactions take place throughtransportation contracts that define the conditions of transportation and delivery of naturalgas.
There are two main transportation markets in the United States: a primary market and asecondary market. In the primary market pipeline companies sell transportation contractsto marketers, local distribution companies, or end users. Typical services are firm, no-notice, and interruptible transportation. In the secondary market pipeline companies andholders of transportation contracts resell unused capacity in the form of firm orinterruptible transportation. The U.S. interstate transportation market is regulated byFERC.
The unbundling of interstate pipeline transportation and regulatory changes in 1992 havepromoted more transparent and fair pricing of transportation services. Interstate pipelinecompanies began competing to attract shipments in major markets by reducingtransportation prices. Shippers have benefited directly through lower transportation costs,and end users indirectly through lower retail prices for natural gas. Shippers paid onaverage 16 percent less for interstate pipeline transportation in 1994 than in 1988, whilethe volume of transported natural gas increased by 15 percent during 1988-94(transportation costs are measured as the average cost of transmission services fromwellhead to the local distributor). The transportation and distribution markup decreasedby 20 percent and 42 percent in real terms for industrial end users and electric utilities,while it remained constant for commercial and residential end users (U.S. Department ofEnergy, 1995a).
Structure of the interstate pipeline transportation market
The interstate pipeline transportation market is dominated by primary transportationservices, which were used for 69 percent of gas deliveries in 1995 (table 5). Secondarytransportation services accounted for the remaining 31 percent. The share of secondarytransportation services has been steadily increasing since the secondary market wascreated in 1993.
2 Intrastate pipeline transportation and distribution are the other two segments of the transportation marketin the United States. This section focuses primarily on the interstate pipeline transportation market, whichhas experienced the most radical regulatory change in the past 12 years. The regulatory regime in the othertwo segments varies from state to state.

32
Table 5 Structure of the Interstate Pipeline Transportation Market, 1994-95(percent)
1994 1995Primary transportation 71 69
Share arranged by local distribution companies - 63Share arranged by marketersa - 37
Secondary transportation 29 31Firm 13 17Interruptible 16 14Share arranged by local distribution companies 26 24Share arranged by marketersa 74 76
All transportation 100 100Share arranged by local distribution companies - 51Share arranged by marketersa 49
- Not availablea Includes end users.Source: Interstate Natural Gas Pipeline Association of America.
The most active players in the primary market are local distribution companies, whicharranged 63 percent of primary deliveries in 1995; marketers and end users arranged theremaining 37 percent. The ownership of transportation contracts has a similar structure:local distribution companies held about 66 percent of interstate pipeline capacity in 1995,marketers 14 percent, end users 8 percent, other pipelines 7 percent, and producers 3percent.
Transactions in the secondary transportation market are dominated by marketers, whicharranged transportation for 76 percent of secondary deliveries in 1995. Local distributioncompanies' share was only 24 percent and is steadily decreasing. Their share in theoverall transportation market is 51 percent, and marketers' share is 49 percent.
The open access regime and unbundling of interstate pipeline transportation havetransformed the way in which end users receive their gas deliveries. Before 1985 theyreceived almost all natural gas deliveries through sales from local distribution utilities ora nearby pipeline company. Today they purchase only 52 percent of gas deliveriesdirectly from pipeline or local distribution companies. They purchase the remaining 48percent in the wholesale market and pay fees to pipeline and local distribution companiesfor transporting these deliveries to consumption sites.
More than 74 percent of deliveries to end users were transported under firm transportationcontracts in 1995, and the remaining 26 percent under interruptible contracts.

33
Because deregulation of interstate pipeline transportation has not given all end uisersequal access to transportation and the wholesale gas market, the structure of deliveriesdiffers among types of end users. Electric utilities and industrial customers, which gainedthe most under open access and unbundling, purchased on average more than 70 percentof their 1995 natural gas deliveries in the wholesale market and bought transportationservices from pipeline or local distribution companies. In addition, industrial customersreceived 9.5 percent of their deliveries directly from interstate pipeline companies in1995 (U.S. Department of Energy 1996). Electric utilities and industrial customers bothtook about 60 percent of their deliveries under firm transportation contracts, and 40percent under interruptible contracts (table 6). Firm transportation contracts offer thesecurity of highly reliable delivery of base load natural gas, while interruptible contractsoffer the flexibility to acquire additional gas deliveries in the event of a sudden increasein demand. Industrial consumers and electric utilities purchase firm and interruptibletransportation services in different amounts to build a contract portfolio that gives themthe minimum acceptable level of supply reliability at the minimum cost.
Table 6 Firm and Interruptible Deliveries of Natural Gas to U.S. Consumers, 1995(millions of cubic feet)
Firm InterruptibleConsumer category Volume Percentage of total Volume Percentage of total TotalResidential 4,846,360 34 3,958 0 4,850,318
(99.2) (0.08)Commercial 2,650,412 18 380,665 8 3,031,077
(87.4) (12.6)Industrial 5,140,048 36 3,439,537 69 8,579,585
(59.9) (40.1)Electric Utilities 1,758,945 12 1,147,860 23 2,906,805
(60.5) (39.5)Total 14,398,214 100 4,972,245 100 19,370,459
(74.3) (25.7)
Note: Figures in parentheses show the percentage breakdown between firm andinterruptible deliveries for that category of consumers.Source: U.S. Department of Energy 1995b.
By contrast to electric utilities and industrial customers, commercial and residentialcustomers have only limited access to the transportation and upstream gas markets.Commercial end users took on average 23 percent of their gas deliveries as atransportation service in 1995 and purchased the rest primarily from local distributioncompanies (table 7). They took 87 percent of deliveries under firm transportationcontracts. Residential customers took almost all their gas deliveries from localdistribution companies as firm sales services.

34
Table 7 Structure of Natural Gas Deliveries to U.S. Consumers, 1995(millions of cubic feet)
Residential Commercial Industrial Electric utilities All categoriesPercentage Percentage Percentage Percentage Percentage
Type of delivery Volume of total Volume of total Volume of total Volume of total Volume ofttotalFirm transportationSales 4,846,360 99.9 2,125,008 70 1,294,546 15 431,014 15 8,696,928 45Transportation 0 0 525,404 17 3,845,501 45 1,327,931 46 5,698,836 29Total , 4,846,360 99.9 2,650,412 87 5,140,047 60 1,758,945 61 14,395,764 74
InterruptibletransportationSales 3,958 0.1 199,930 7 767,687 9 365,507 13 1,337,082 7Transportation 0 0 180j735 6 2,671,850 31 782,353 27 3,634,938 19Total 3,958 0.1 380,665 13 3,439,537 40 1,147,860 39 4,972,020 26
All transportationSales 4,850,318 100 2,324,938 77 2,032,233 24 796,521 27 10,034,010 52Transportation 0 0 706,139 23 6.517,351 76 2,110,284 73 9,333,774 48Total 4,850,318 100 3,031,077 100 8,579,584 1oo 2,906,805 100 19,367,784 0oo
Source: U.S. Department of Energy, Energy Information Administration.
Primary transportation market
The primary transportation market facilitates the initial distribution of transportationcontracts. Pipeline companies sell transportation contracts to shippers for prices that areregulated by FERC. Transportation contracts differ primarily in the reliability, timing,and location of natural gas delivery. Shippers purchase transportation contracts incombinations that allow them to achieve the desired service reliability at the minimumcost and to take advantage of time and locational price differentials in the natural gasmarket.
FERC determines transportation charges using the straight fixed variable rate-makingmetnod. Although this method does not yield efficient prices for pipeline transportation,it ensures full cost recovery and provides fair and transparent pricing signals. Butincreasing competition among interstate pipeline companies has prompted a move towardmarket-based pricing of transportation services.
Transportation contracts
Deregulation of the U.S. natural gas industry has led to the development of transportationcontracts that differ in many dimensions. The most important and frequently usedcontract dimensions are reliability of transportation service, time and duration ofshipment, location of points of injection and withdrawal, pipeline pressure, and chargesfor pipeline capacity and transportation services.
The contracts most commonly used in the U.S. natural gas industry are of four types(U.S. Department of Energy 1994):

35
* Firm transportation contract - contract that gives its holder the right to pipelinecapacity and transportation of natural gas during the entire duration of the contract,regardless of the season. A firm transportation contract specifies the maximum dailyquantity of gas that can be transported through the pipeline, the points of injection andwithdrawal, and the charges for reserved capacity and transportation services. Theholder of a firm contract may use all or part of the reserved capacity, depending on itsneeds, but if it exceeds the maximum daily quantity, it will incur a penalty.
* No-notice firm transportation contract - contract that gives its holder the right topipeline capacity and transportation of natural gas under the conditions specified inthe contract. The main difference between regular and no-notice firm contracts is thatthe holder of a no-notice contract is not required to maintain a daily balance betweennominated and delivered natural gas (for more information on nominating andbalancing natural gas, see the section below on the optimization of pipelineoperation).
* Limited firm transportation contract - a contract that provides for limited firmservice, which is subject to interruption for a specified amount of time each month,for example, up to 10 days a month. This contract is designed to offer less expensivefirm service to customers that can tolerate greater risk of delivery interruption and isoften used by customers with fuel-switching capability.
* Interruptible transportation contract - a contract that gives its holder the right totransport an agreed on volume of natural gas within a certain period. The exact timingof transportation is determined by the pipeline company according to the availabilityof capacity.
Transportation service reliability These contracts differ primarily in the reliability oftransportation services. Firm and no-notice transportation services are the most reliablebecause shippers' reserved capacity is available to them at all times. (Firm shipments maybe interrupted only in extraordinary supply situations caused by forces beyond thepipeline company's control.) Limited firm and interruptible transportation services areless reliable because shippers do not know in advance exactly when an interruption willoccur.
Shippers place a premium on firm transportation contracts because such contracts allowthem to take advantage of locational price differentials any time they arise. The premiuma shipper is willing to pay depends on the probability of congestion and the size of pricedifferentials between two spot markets. If local spot prices of natural gas are high becauseof congestion in the pipeline system, a shipper with a firm transportation contract can buylower-priced natural gas in a neighboring spot market and sell it in the congested localmarket. The shipper's ability to reduce its own cost of natural gas or earn extra profit

36
through locational price arbitrage is reflected in the -price of firm transportation services,which tends to be higher than the price of interruptible services.
Shippers seldom need just one level of reliability in transportation services. Theytypically combine firm and interruptible transportation contracts in a contract portfoliothat gives them the minimum acceptable service reliability at the minimum cost. Theminimum acceptable service reliability for a shipper depends on many factors, such as itspattern of natural gas consumption, its ability to substitute natural gas for other fuels, andthe structure of its gas contract portfolio. Since shippers have different characteristics,they form different transportation contract portfolios.
Timing of service The timing of transportation services is an important dimension oftransportation contracts because shippers must coordinate transportation with natural gassupply. The time structure of transportation contracts has been changing with increasingderegulation of the natural gas market. While traditional long-term supply contracts werematched with long-term transportation contracts, deregulation of gas markets and theincreasing use of short-term gas contracts have generated demand for short-termtransportation contracts.
Participants in the deregulated gas market seek the flexibility to adjust transportationcontracting to natural gas acquisition in order to minimize the total cost of natural gas.They look for short-term transportation contracts that will enable them to take advantageof swings in spot prices of natural gas or to react to unexpected shifts in natural gassupply and demand. The demand for such contracts has been partially satisfied by theintroduction of the capacity resale program, but the only satisfactory remedy is a well-functioning transportation market.
Location of intake and offlake points Shippers' ability to choose the location of naturalgas delivery is crucial to the efficient functioning of natural gas markets. Shippersrespond to locational differences in the spot prices of natural gas by shipping gas to thecongested market. If they can use any intake or offtake point on a pipeline where theyhave reserved capacity, they can eliminate locational price differences along the entirepipeline, resulting in an efficient market.
Deregulation of the U.S. gas markets introduced significant flexibility in deliverylocations. Order No. 636 required pipeline companies to offer firm and interruptibleshippers a choice in intake and offtake points, based on the priority of locations and thetype of transportation service. It also allowed shippers with available reserved capacity todivide this capacity into segments that can be resold separately in the capacity resalemarket. Both measures have contributed to increasing integration of regional natural gasmarkets in the United States.

37
Regulation of the primary transportation market
Interstate pipeline companies are regulated by FERC, which determines rates forinterstate pipeline transportation. FERC also establishes rules for the operation ofinterstate pipeline companies with the aim of promoting the efficient functioning of theinterstate pipeline segment and the wholesale natural gas market.
FERC determines tariffs for firm and interruptible transportation services using thestraight fixed variable rate-making method, a cost-based price mechanism that uses theaverage accounting cost pricing concept.'3 Charges for firm services are divided into ademand charge, which recovers most of the fixed costs of transportation, and a usagecharge, which recovers variable (or operational) costs. The demand charge is related tothe maximum daily capacity reserved by users, but the greater the reserved capacity, thelower the unit charge. Charges for interruptible services range between maximum andminimum charges. The maximum interruptible charge recovers variable costs and aportion of fixed costs, while the minimum interruptible charge recovers variable costsonly.
Fixed costs are allocated between firm and interruptible services on the basis of the ratioof firm to interruptible service loads in the pipeline. The firm load is equal to the totalcapacity reserved by firm users. The interruptible load is estimated from the expectedannual interruptible throughput.
Transportation charges are typically mileage-based, that is, they reflect the averageaccounting costs of capacity and throughput over a unit of distance. This is the notionalpath approach to determining charges. Other approaches include zone rates, which setcharges equal within a particular geographic area, and postal stamp rates which set flattransportation charges without regard to distance.
Transportation charges also reflect the level of dLemand uncertainty. Firm serviceguarantees almost complete reliability, so the charges for such service do not takedemand uncertainty into account. For interruptible service, pipelines can providediscounts based on the reliability level, within a range defined by the maximum andminimum interruptible charges.
Transportation charges on newly constructed pipelines are also regulated by FERC. Ituses two pricing principles: roll-in rates and incremental rates. If a pipeline company canprove that capacity expansion benefits most of its existing customers, it can "roll in" aportion of the costs of new capacity to all pipeline customers as long as the price increase
13 The straight fixed variable rate-making method replaced the modified fixed variable rate-makingmethod, which allowed the recovery of certain fixed costs, including a return on equity and related taxes,through a volumetric charge. The change in method in 1992 led to an increase in the unit cost of naturalgas for low-load-factor customers and a decline in unit cost for high-load-factor customers. For moredetails, see U.S. Department of Energy 1995a.

38
is no more than 5 percenit. If these conditions are not satisfied, the company must useincremental rates that assign the costs of a capacity expansion to the users of the newpipeline (U.S. Department of Energy 1995a).
An evaluation of the straight fixed variable rate-making method The main benefit of thecurrent regulation of transportation charges is that it ensures full recovery of pipelinecompanies' costs. Other benefits are the transparency and fairness of transportation rates.Pipeline companies regularly report their costs and revenues to FERC, which candetermine rates through a relatively simple calculation. All parties involved intransportation can check the results and the methodology. And because all transportationrates are determined using the same methodology, shippers can compare pipelinecompanies' rates and select the lowest-priced service.
But the economic efficiency of the current price regulation is compromised by FERC'sgoal of ensuring cost recovery and preventing the exercise of market power exercise bythe pipeline companies. The main source of inefficiency is the arbitrary allocation offixed costs under the average accounting cost pricing concept. The straight fixed variablerate-making method neglects several factors that are important for efficient pricing oftransportation: the price and reliability elasticity of demand for transportation services,the marginal cost of capacity and throughput, and demand and supply uncertainty.Because shippers do not pay the actual costs incurred in transporting their shipments,they may make suboptimal decisions about purchasing transportation and natural gascontracts, distorting the allocation of resources in the natural gas industry.
The rate-making method does not give pipeline companies flexibility to charge ratesbased on demand. With shippers increasingly using short-term firm transportationcontracts purchased in the secondary market, the inability to charge demand-based ratesthreatens full cost recovery. Many low-load-factor shippers find it too expensive topurchase firm transportation contracts at prices determined on the basis of a 1 00 percentload factor. So they purchase firm contracts for relatively small volumes from pipelinecompanies and rely on interruptible transportation and the secondary capacity market foradditional transportation services needed.
Shippers also are reluctant to enter into long-term transportation contracts because theydo not know their market value. Instead, they prefer to purchase short-termn transportationcontracts, whose market value is revealed in the secondary transportation market. But,short-term contracting for transportation services creates high revenue uncertainty forpipeline companies.'4
1 Shippers' unwillingness to sign long-term transportation contracts has created serious problems forinterstate pipeline companies in the United States. Long-term contracts for about 50 percent of availablepipeline capacity will expire by 2002. Although experts expect that about 75 percent of that capacity willbe recontracted, pipeline companies will not be able to sell long-term contracts in regions or pipelinecorridors with excess capacity. This will expose them to substantial revenue risk unless regulation givesthem the flexibility to use price discrimination (McDonnald 1996).

39
New regulatory measures adopted by FERC FERC has recognized the problems faced bypipeline companies and shippers in the primary transportation market and adopted severalmeasures that expose the interstate pipeline segment to market forces. One of themeasures allows pipeline companies to offer discount rate plans, such as seasonal,volumetric, or multipart rates, to low-load shippers.'5 These plans help improve thesituation, but they neglect the main source of the problems - the arbitrary allocation offixed costs under the straight fixed variable rate-making method.
The most important measure has been the establishment of three alternative mechanismsfor rate determination (FERC 1996a and 1996b). These mechanisms give pipelinecompanies the flexibility to customize their rate structures if they can demonstrate thatthey do not have market power.
* Market-based rates. This mechanism allows pipeline companies to charge market-based rates if they do not have market power (the ability to maintain a 10 percentprice increase without losing market share) and if they have a Herfindahl-Hirschmanindex of less than 1,800 (the Herfindahl-Hirschman index measures marketconcentration for the purposes of an antitrust analysis). Market-based rates are appliedcase by case.
* Incentive rates. This mechanism establishes performance criteria that give pipelinecompanies an incentive to charge optimal rates even if they have market power. Ratesare not cost-based, and no price caps are applied. The efficiency gains are shared byconsumers and pipeline companies. The adoption of incentive rates is voluntary.
* Negotiated rates with recourse to a default rate. Negotiated rates are determinedthrough mutual agreement between a pipeline company and shippers, while recourserates are based on cost of service. Shippers have access to both rates. Pipelinecompanies are required to allocate capacity to recourse shippers during constraintperiods, but these shippers will not be solely responsible for the cost of unsubscribedcapacity.
The response of the pipeline companies to the proposed rate-making mechanisms hasbeen favorable. Most of the pipelines favor the mechanism of negotiated rates withrecourse because it gives them both the certainty of cost recovery under recourse ratesand price flexibility under negotiated rates. By October 1, 1996, 13 pipeline companieshad filed for approval to use this mechanism. Most of these filings have been approved byFERC (U.S. Department of Energy 1996).
" Seasonal rate-making allows pipeline companies to set capacity reservation charges for peak and off-peak seasons. Volumetric rate-making results in a one-part tariff based on the volume of gas delivered.This rate is used mainly by small-volume, low-load-factor customers. Finally, pipelines can use a two-partrate that consists of capacity reservation and usage charges, but allocates fixed costs between the twocomponents (U.S. Department of Energy 1994).

40
Secondary transportation market
A secondary transportation market is a marketplace where holders of transportationcontracts can resell temporarily or permanently unused capacity to other shippers. Thefirst secondary transportation market in the United States, known as the capacity releaseprogram, was created by Order No. 636 in 1993. Under this program shippers canpurchase transportation contracts from other shippers through a bilateral transaction or anauction. Another secondary transportation market is the gray market, in which shippersuse spare capacity to ship natural gas to congested markets.
Capacity release program
The capacity release program established rules for trading firn capacity contracts ownedby shippers. Holders of firm transportation or storage contracts can resell them to otherparties through a pre-arranged deal or an open bid (U.S. Department of Energy 1995a).
The current holder of a firm capacity contract (the releasing shipper) makes a prearrangeddeal with the interested party (the replacement shipper) if the capacity release price isequal to the maximum firm rate of the pipeline or if the duration of the contract does notexceed one calendar month. Prearranged deals are concluded bilaterally, through mutualagreement on the conditions of the released capacity contract. Once a prearranged deal isconcluded, the details are posted on the pipeline's electronic bulletin board, including therate charged, the type of charge, the amount of capacity, and the duration of the release(U.S. Department of Energy 199a).
If neither of the conditions above are met, the releasing shipper posts the releasedcapacity along with corresponding conditions in advance on the pipeline's electronicbulletin board. Shippers bid for the contract in an auction, and the highest bidder isawarded the contract. The winning bid price thus becomes the replacement shipper'sdemand charge. If the bid price is less than the demand charge stated in the contractbetween the releasing shipper and the pipeline, the releasing shipper must pay thedifference. If the bid price exceeds the releasing shipper's demand charge, the releasingshipper keeps the difference. The replacement shipper then negotiates the conditions oftransportation services with the pipeline (Herbert 1996b and FERC 1992). Details of thecapacity release contract are posted on the electronic bulletin board.
The prices of transportation contracts traded in the capacity release market are regulatedby FERC, using the price cap method. The price of released capacity cannot exceed themaximum firm transportation rate of the pipeline company that owns the pipeline systemin which the capacity was released.
Activity under the capacity release program The capacity release program has growndramatically since its start in November 1993. More than 3.2 trillion cubic feet ofpipeline capacity was released in the 12 months ending March 31, 1995, and about 5.8

41
trillion cubic feet, or 59 percent more, was released in the next 12 months. This capacityrepresented about 15 percent of the total end use consumption of natural gas in 1994 and30 percent in 1995. More capacity is released in the nonheating season than in the heatingseason. In the 1995 nonheating season 3.3 trillion cubic feet of capacity was released, andin the 1995-96 heating season about 2.4 trillion cubic feet of capacity was released.
The prices for capacity have been well below the price cap, but they are graduallyincreasing. The average rate for released capacity was discounted 65 percent from themaximum transportation rate during the 1995-96 heating season and 83 percent duringthe 1995 nonheating season. These rates reflect a substantial increase from the 82 percentdiscount in the 1994-95 heating season and the 92 percent discount in the 1994nonheating season. On average, released capacity seems to be an inexpensive substitutefor primary transportation contracts.
An evaluation of the capacity release program The capacity release program ispotentially an effective tool for promoting efficient allocation of pipeline capacity amongshippers. Since shippers are allowed to trade unused capacity among themselves, nounused capacity should be left after the market clears. Shippers that value capacity themost buy it from shippers that value it little because they do not intend to use it. Shipperssell capacity for a price that reflects its opportunity cost and makes both buyer and sellerbetter off. The allocation of capacity among shippers on the basis of their willingness topay should lead to efficient allocation of resources and greater utilization of pipelines.
One of the most important conditions for the efficient allocation of capacity, however, ismarket pricing. Since capacity release is increasingly used for resale of short-termcapacity," the price of released capacity should follow the short-run marginal cost ofcapacity, falling in off-peak periods and rising in peak periods to reflect changes in theopportunity cost.
But the price cap imposed by FERC, which prevents the market price of released capacityfrom exceeding the maximum firm rate, leads to distorted prices and thus inefficientallocation of capacity. Shippers unable to obtain market value for their unused capacitywill be unwilling to sell it through the capacity release program. IThe distorted prices forthe transactions that do take place give buying shippers inefficient signals about themarket value of released capacity and attract more than the efficient level of demand.
The price cap allows efficient pricing of released capacity only in off-peak periods, whenpipeline systems are not congested. In these periods the opportunity cost of capacity iswell below the price cap, and shippers pay a price determined by the market. Since the
16 About 90 percent of capacity released since the start of the program on November 1, 1993, becameavailable to shippers within two weeks from the date of contract award. And more than 70 percent ofreleased capacity in the 1995-96 heating season was under contracts for terms of 31 days or less (U.S.Department of Energy 1996).

42
capacity resale market is relatively competitive," particularly on major transportationroutes, capacity prices in off-peak periods are relatively efficient and promote efficientallocation.
The relatively low average price of released capacity has made the price cap nonbindingon average. But because the price of released capacity cannot exceed the price cap andbecause prices are low in off-peak periods, the average price necessarily is less than theprice cap. The explanation may also be that there is an abundance of pipeline capacity orthat capacity resale in peak periods takes place outside the capacity release program. Theexistence of the gray market suggests that the second is true.
Another problem, particularly in the resale of short-term firm contracts, is the hightransaction costs of capacity resale. Shippers require flexibility in contracting in order tobe able to react quickly to changes in the market. The auctioning of capacity, whichrequires posting and bidding, does not provide the required flexibility. Shippers must gothrough several (sometimes incompatible) electronic bulletin boards to acquireinformation about available capacity and complete transactions with other shippers.These problems have led shippers to resell firm contracts mainly through bilateralprearranged deals. Under Order No. 577, prearranged capacity release deals with a termof up to one calendar month are exempt from the advance posting and biddingrequirements.
FERC has also taken other measures to address problems in the capacity release program.It has pushed the industry to standardize electronic bulletin boards and capacity releaseprocedures to reduce the transaction costs of capacity resale. In 1996 it issued Order No.587 requiring all pipeline companies to establish procedures to speed the process ofcapacity release. And most recently, it proposed removing price caps on released capacityif the releasing shippers can demonstrate that they do not exercise market power. Thisproposal is being studied by the industry.
Gray market
The gray market represents a market solution to the distortive regulation of capacityrelease prices. The market facilitates the trading of pipeline capacity bundled with naturalgas and sold in congested markets. Shippers with firm capacity rights can earn the marketvalue for their temporarily or permanently available capacity by using it to ship naturalgas to congested markets. Since the price of natural gas is not regulated, shippers cancharge the price that maximizes their profits.
The evolution of the gray market can be traced to the period before Order No. 636, whichallowed the resale of transportation contracts. Local distribution companies, the mostfrequent holders of firm capacity, used their temporarily available capacity to ship natural
17 On average, shippers can potentially obtain capacity from 70 holders of firm contracts on a givenpipeline (De Vany and Walls 1993).
43
gas to city gates on behalf of third parties, charging them regulated prices, under "buy-sell" contracts. Order No. 636 prohibited new buy-sell contracting but did not abolishexisting contracts, even after deregulation of natural gas prices. This allowed localdistribution companies to continue shipping natural gas to city gates on behalf of thirdparties and, more important, selling it for unregulated prices (Marston 1994).
Despite the attractiveness of unregulated market pricing, the gray market is neither asubstitute for capacity release nor an efficient market for pipeline capacity. Gray marketprices barely reflect the system marginal costs of natural gas and pipeline capacitybecause trading is thin compared with activity in the overall natural gas market.Transaction costs are relatively high, because there is a lack of information aboutavailable capacity, market prices, and the like. Buyers also face the monopoly power ofsellers that control bottleneck capacity. So the gray market is beneficial because it allowstransactions that otherwise would not occur, but it suffers from high transaction costs andmonopoly power.
FERC will have to address these problems in order to optimize secondary trading andallocation of pipeline capacity. Its recent measures to simplify the capacity releaseprogram and allow market pricing of released capacity in competitive markets willcertainly attract some gray market players to the capacity release program. But the graymarket will probably continue to exist until regulated prices for released capacity becomenonbinding.

44
Optimization of Pipeline Operation in the Unbundled Natural Gas Industry
Transactions in a deregulated natural gas industry must be coordinated to achievesimultaneous clearing of natural gas and transportation markets at the minimum totalcost. Market participants in the U.S. natural gas industry match the available supply ofnatural gas and transportation contracts with their demand through decentralized bilateraltransactions. Each market participant minimizes its own costs of natural gas andtransportation. But the total costs of natural gas to end users may not be minimized iftransportation is inefficient because of suboptimal operation of pipelines.
An interstate pipeline company in the United States faces demand for transportationservices that consists of the demand of many individual shippers. The utilization of itspipeline capacity varies because of the frequently changing volume of individualshipments. To maximize the utilization of pipelines and minimize the total cost oftransportation, a pipeline company uses its available capacity for interruptible services.As a result, a typical pipeline is used by several shippers at once. Since the load for oneshipper is dependent on the loads of others, an action by one shipper can imposesubstantial costs on the others and on the entire pipeline system. To minimize the totalcost of pipeline transportation, all shippers must therefore obey a set of common rulesthat coordinate shipments in the pipeline system.
Optimal pipeline operation is achieved through scheduling, balancing, central dispatch,and emergency control of gas flows in the pipeline system. Scheduling and balancing aremeans to coordinate natural gas supply with transportation services. A pipeline companycarries out these activities by acquiring information about the volumes of gas and thepipeline capacity demanded by shippers, then determining the flow of shipments throughthe pipeline system that minimizes transportation costs and satisfies shippers' demands.Central dispatch and emergency control maintain system balance and guide gas flowsthrough the pipeline system in real time.
Scheduling and balancing
Scheduling is the process of determining of the optimal flow schedule - the order anddirection of gas flows in the pipeline system that minimize the total cost of transportation.Balancing is the process of maintaining and restoring the balance of the pipeline system(system balance) and individual shipments (shipper's balance).
Pipeline companies determine the optimal flow schedule based on information aboutdemand for transportation services. Scheduling and balancing can be broken down intothe following stages:
* Shippers "nominate" daily volumes of natural gas to be delivered, received, or storedby the pipeline company on the upcoming gas day (a period of 24 hours that is used inpipeline transportation). Nominations must be submitted in writing or electronically
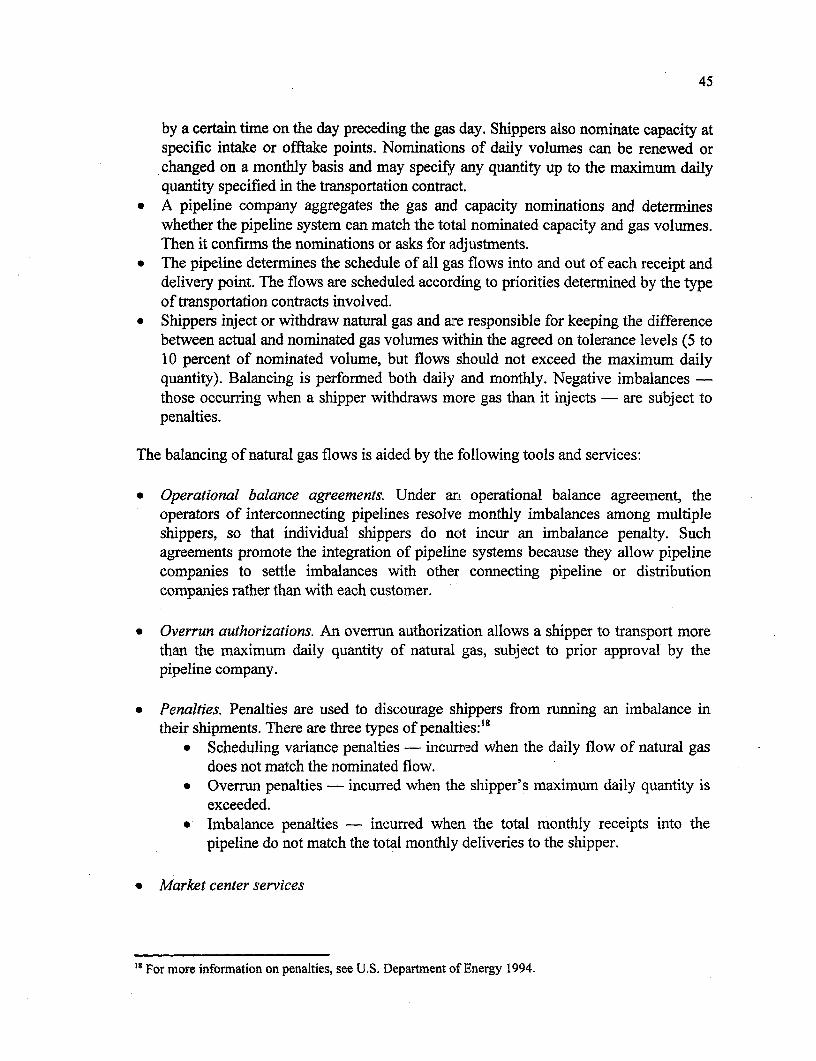
45
by a certain time on the day preceding the gas day. Shippers also nominate capacity atspecific intake or offtake points. Nominations of daily volumes can be renewed orchanged on a monthly basis and may specify any quantity up to the maximum dailyquantity specified in the transportation contract.
* A pipeline company aggregates the gas and capacity nominations and determineswhether the pipeline system can match the total nominated capacity and gas volumes.Then it confirms the nominations or asks for adjustments.
* The pipeline deterrnines the schedule of all gas flows into and out of each receipt anddelivery point. The flows are scheduled according to priorities determined by the typeof transportation contracts involved.
* Shippers inject or withdraw natural gas and are responsible for keeping the differencebetween actual and nominated gas volumes within the agreed on tolerance levels (5 to10 percent of nominated volume, but flows should not exceed the maximum dailyquantity). Balancing is performed both daily and monthly. Negative imbalances -
those occurring when a shipper withdraws more gas than it injects - are subject topenalties.
The balancing of natural gas flows is aided by the following tools and services:
* Operational balance agreements. Under an operational balance agreement, theoperators of interconnecting pipelines resolve monthly imbalances among multipleshippers, so that individual shippers do not incur an imbalance penalty. Suchagreements promote the integration of pipeline systems because they allow pipelinecompanies to settle imbalances with other connecting pipeline or distributioncompanies rather than with each customer.
* Overrun authorizations. An overrun authorization allows a shipper to transport morethan the maximum daily quantity of natural gas, subject to prior approval by thepipeline company.
* Penalties. Penalties are used to discourage shippers from running an imbalance intheir shipments. There are three types of penalties:"8
* Scheduling variance penalties - incurred when the daily flow of natural gasdoes not match the nominated flow.
* Overrun penalties - incurred when the shipper's maximum daily quantity isexceeded.
* Imbalance penalties - incurred when the total monthly receipts into thepipeline do not match the total monthly deliveries to the shipper.
* Market center services
IS For more information on penalties, see U.S. Department of Energy 1994.

46
* No-notice service. Under no-notice service, a shipper may exceed its dailynomination without incurring scheduling penalties, but it must not exceed themaximum daily quantity.
* Lending and parking services. Lending is a short-term storage service todeliver natural gas to a shipper when it needs more than its nominated volume.Parking is short-term storage for a shipper when it needs less than itsnominated volume.
* Wheeling service. Wheeling gives customers the ability to change a deliverypoint by arranging delivery to an alternative location.
Gas flow control in real time
Pipeline companies must have the ability to control and direct flows of natural gasthrough the pipeline system in real time in order to maintain system balance in the eventof an unexpected disruption of gas flows. There are three major tools for controlling anddirecting natural gas flows:
* Central dispatch. Central dispatch directs flows of natural gas through the pipelinesystem according to a predetermined flow schedule and an emergency plan. Centraldispatch is performed by a pipeline's gas control unit, which has electronic devices tomonitor and control the direction of flows and the volume and pressure in the pipelinesystem and interconnected storage facilities.
* Operational flow orders. These are emergency orders issued by pipeline companiesthat require shippers to inject or withdraw natural gas at a specific point to ensurecontinued flow of natural gas through the system. Operational flow orders are usedonly in emergencies, and shippers must be notified several hours before such an orderis implemented.
* Curtailments. Under curtailments, pipeline companies may cut off transportation orstorage service to shippers in the event of a major supply or capacity disruption.Curtailments are used primarily in the most severe emergencies. A priority order forcurtailments is determined by a pipeline company and approved by FERC. Firmtransportation is the last service disconnected.
Conclusion
Deregulation of the U.S. natural gas industry has shown that market forces can result inefficient transactions in industry segments traditionally considered natural monopolies.The main goal of deregulation was to create competitive markets in natural gas andpipeline transportation, in the expectation that competition would guide individualtransactions toward the socially optimal outcome.

47
The achievements of the U.S. gas industry in the past 15 years confirm the overalldirection of deregulation. The United States enjoys a highly competitive wholesalenatural gas market and an increasingly competitive interstate transportation market. Bothmarkets have benefited from deregulation of natural gas production and marketing andliberalization of natural gas prices. And the introduction of open access to interstatepipelines and their unbundling from gas sales have allowed end users to participate in theefficiency gains in upstream markets. All this has contributed to declining retail prices forall major consumer categories.
But deregulation is far from complete. The current regulation of interstate pipelinecompanies and the secondary transportation market does not promote efficient allocationof transportation contracts. Flexible pricing of transportation contracts should beintroduced in both the primary and the secondary transportation market. But deregulationof retail markets remains the most important task and the biggest challenge for industryregulators. Small-volume end users, such as residential or commercial customers, arecaptive to local distribution utilities and cannot access competitive wholesale markets.All end users should be able to choose a natural gas supplier and receive natural gas at theminimum cost to society.

48
References
Bickle, L. 1996. "Hubs and the Coming Transportation Bubble." Pipeline & Gas Journal(April).
De Vany, A. S., anid W. D. Walls. 1993. "Pipeline Access and Market Integration in theNatural Gas Industry: Evidence from Cointegration Tests. " The Energy Journal 14 (4): 1-19.
1994. "Natural Gas Industry Transformation, Competitive Institutions and theRole of Regulation." Energy Policy 22 (9): 755-63.
. 1995. The Emerging New Order in Natural Gas: Market vs. Regulation.Westport, Conn.: Quorum Books.
Federal Energy Regulatory Commission. 1984. Order No. 380: Elimination of VariableCosts from Certain Natural Gas Pipeline Minimum Commodity Bill Provision.Washington, DC.
. 1985. Order No. 436: Regulation of Natural Gas Pipelines after PartialWellhead Decontrol. Washington, DC.
1987. Order No. 500: Regulation of Natural Gas Pipelines after PartialWellhead Decontrol. Washington, DC.
= 1992. Order No. 636: Pipeline Service Obligations and Revisions to RegulationsGoverning Self-Implementing Transportation under Part 284 of the Commission'sRegulation. Washington, DC.
. 1996a. Alternatives to Traditional Cost-of-Service Ratemaking for Natural GasPipelines. Docket No. RM95-6. January 31.
. 1996b. Regulation of Negotiated Transportation Services for Natural GasPipelines. Docket No. RM96-7. January 31.
Herbert, John H. 1996a. "Gas Price Behavior: Gauging Links between Hubs andMarkets." Public Utilities Fortnightly, April 1, pp. 27-30.
. 1996b. "Rights to Transportation Services: The U.S. Experience." Gas Matters(EconoMatters Ltd., London) (March).
. 1996b. "Spot and Futures Markets: Will Britain Follow the U.S.?" Gas Matters(EconoMatters Ltd., London) (January).

49
Hunt, Sally, and Graham Shuttleworth. 1996. Competition and Choice in Electricity.England: John Wiley & Sons.
International Energy Agency. 1994. Natural Gas Transportation: Organization andRegulation Paris: OECD/EIA.
Interstate Natural Gas Pipeline Association of America. 1993. Gas Carriage through theFirst Haylof 1993. Washington, DC. December.
. 1996. Gas Transportation through 1995. Washington, DC. September.
Kansas City Board of Trade. 1995. The Regional Evolution in the Natural Gas Industry:Setting the Stage for the Kansas City Board of Trade Western Natural Gas FuturesContract. Kansas City, Mo.
King, Martin, and Milan Cuc. 1996. "Price Convergence in North American Natural GasSpot Markets." The Energy Journal 17 ( 2): 17-38.
Lander, Greg M. 1996. "Just in Time: EDI for Gas Nominations." Public UtilitiesFortnightly, February 1, pp. 20-23.
Marston, Philip M. 1994. "The Rumble of Bundles: A Review of Experience Under theCapacity Release Experiment." Hadson Corporation, Washington, DC.
McDonnald, Rebecca A. 1996. "Stranded Costs for Interstate Pipelines." Public UtilityFortnightly, April 1, pp. 23-26.
Michaels, Robert J., and Arthur S. De Vany. 1996. "Market-Based Rates for InterstateGas Pipelines: The Relevant Market and the Real Market." Energy Law Journal 16: 299-346.
Myerson, Allen R. 1996. "Tenneco to Sell Gas Unit in $4 Billion Deal." The New YorkTimes, June 20.
Natenberg, S. 1996. "Understanding Volatility Is the Key to Options Trading." Energy inthe News (NYMEX) (summer):21-24
NYMEX (New York Mercantile Exchange). 1995. The 1994-1995 Annual Report. NewYork.
1996a. Energy Risk Management Course. Study materials from the NYMEXEnergy Week. New York.
. 1996b. Henry Hub and Permian Basin Natural Gas Futures and OptionsContract Specifications. New York.

50
1996. "Glossary of Terms." http://www.nymex.com
Pierce, Richard J., Jr. 1988. "Reconstituting the Natural Gas Industry from Wellhead toBurnertip." Energy Law Journal 9(1): 1-57.
U.S. Department of Energy, Energy Information Administration. 1994. Natural Gas1994: Issues and Trends. DOE/EIA-0560(94). Washington, DC.
.1995a. Energy Policy Act Transportation Study: Interim Report on Natural GasFlows and Rates. DOE/EIA-0602(95). Washington, DC.
1995b. Natural Gas 1995: Issues and Trends. DOE/EIA-0560(95). Washington,DC.
. 995c. The Value of Underground Storage in Today's Natural Gas Industrvy.DOE/EIA-0591(95). Washington, DC.
. 1996. Natural Gas 1996: Issues and Trends. DOE/EIA-0560(96). Washington,DC.
Walls, David W. 1995. "An Econometric Analysis of the Market for Natural GasFutures." The Energy Journal 16(1): 71-83.
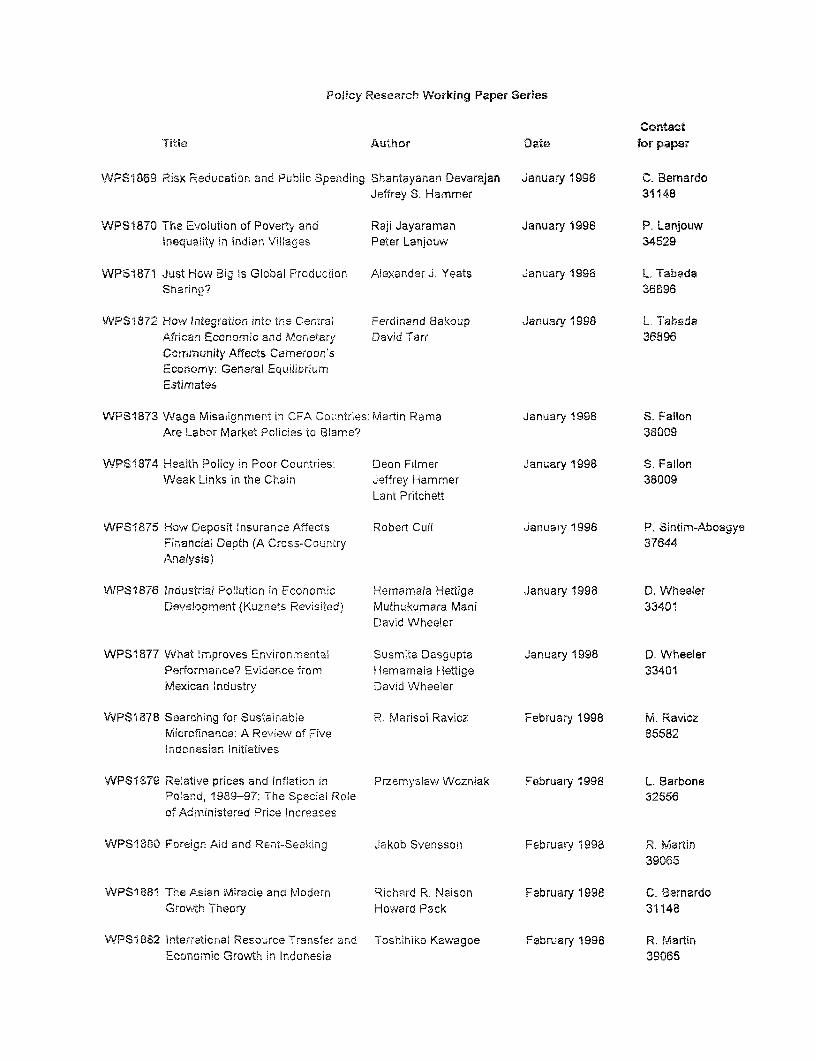
Policy Research Working Paper Series
ContactTitla Author Date for paper
WPS1869 Risk Reducation and Public Spending Shantayanan Devarajan January 1998 C. BernardoJeffrey S. Hammer 31148
WPS1870 The Evolution of Poverty and Raji Jayaraman January 1998 P. LanjouwInequality in indian V.llaces Peter Lanjouw 34529
WPS1871 Just How Big Is Global Production Alexander J. Yeats January 1998 L. TabadaSharino? 36896
WPS1S72 How integration into the Cencral Ferdinand Bakoup January 1998 L. TabadaAfrican Economic and Monetary David Tarr 36896Community Affects Carneroon'sEco nomny: General EquilibriumEstimates
WPSI 873 Wage Misalignment in CFA Countries: Martin Rama January 1998 S. FallonAre Labor Market Policies to Blame? 38009
WPS1874 Health Policy in Poor Countries: Deon Filmer January 1998 S. FallonWeak Lilnks in the Chain Jeffrey Hammer 38009
Lant Pritchett
WPS1875 How Deposit Insurance Affects Robert Cull January 1998 P. Sintim-AboagyeFinancial Depth (A Cross-Country 37644Analysis)
WPS1876 Industrial Pollution in Economic Hemamala Hettige January 1998 D. WheelerDevelopment (Kuznets Revisited) Muthukumara Mani 33401
David Wheeler
WPS1877 What Improves Environmental Susmita Dasgupta January 1998 D. WheelerPerformance? Evidence from Hemamala Hettige 33401Mexican Industry David Wheeler
WPS1878 Searchina for Sustainable R. Marisol Ravicz February 1998 M. RaviczMicrofinance: A Review of Five 85582Indonesian initiatives
WPS1879 Relative prices and Inflation in Przemyslaw Wozniak February 1998 L. BarbonePoland, 1989-97: The Special Role 32556of Administered Price Increases
WPS1880 Foreign Aid and Rent-Seeiking Jakob Svensson February 1998 R. Martin39065
WPSI881 The Asian Miracle and iodern Richard R. Nelson February 1998 C. BernardoGrowth Theory Howard Pack 31148
W 'P81882 interretional Resource Transfer and Toshihiko Ka vagoe February 1998 R. MartinEconomic Growth in Indonesia 39065

Policy Research Working Paper Series
ContactTitle Author Date for paper
WPS1883 Intersectoral Resource Allocation and Fumihide Takeuchi February 1998 K. LabrieIts Impact on Economic Development Takehiko Hagino 31001in the Philippines
WPS1884 Fiscal Aspects of Evolving David E. Wildasin February 1998 C. BernardoFederations: Issues for Policy and 31148Research
WPS1885 Aid, Taxation, and Development: Christopher S. Adam February 1998 K. LabrieAnalytical Perspectives on Aid Stephen A. O'Connell 31001Effectiveness in Sub-Saharan Africa
WPS1 886 Country Funds and Asymmetric Jeffrey A. Frankel February 1998 R. MartinInformation Sergio L. Schmukler 39065
WPS1887 The Structure of Derivatives George Tsetsekos February 1998 P. KokilaExchanges: Lessons from Developed Panos Varangis 33716and Emerging Markets
WPS1888 What Do Doctors Want? Developing Kenneth M. Chomitz March 1998 T. CharvetIncentives for Doctors to Serve in Gunawan Setiadi 87431Indonesia's Rural and Remote Areas Azrul Azwar
Nusye IsmailWidiyarti
WPS1889 Development Strategy Reconsidered: Toru Yanagihara March 1998 K. LabrieMexico, 1960-94 Yoshiaki Hisamatsu 31001
WPS1890 Market Development in the United Andrej Juris March 1998 S. VivasKingdom's Natural Gas Industry 82809
WPS1891 The Housing Market in the Russian Alla K. Guzanova March 1998 S. GraigFederation: Privatization and Its 33160Implications for Market Development
WPS1892 The Role of Non-Bank Financial Dimitri Vittas March 1998 P. Sintim-AboagyaIntermediaries (with Particular 38526Reference to Egypt)
WPS1893 Regulatory Controversies of Private Dimitri Vittas March 1998 P. Sintim-AboagyePension Funds 38526
WPS1894 Applying a Simple Measure of Good Jeff Huther March 1998 S. ValleGovernance to the Debate on Fiscal 84493Decentralization
WPS1895 The Emergence of Markets in the Andrej Juris March 1998 S. ViyasNatural Gas Industry 82809
WPS1896 Congestion Pricing and Network Thomas-Olivier Nasser March 1998 S. VivasExpansion 82809