development of models and meta …eprint.iitd.ac.in/bitstream/2074/7302/1/th-5225.pdfii development...
TRANSCRIPT

ii
DEVELOPMENT OF MODELS AND META-HEURISTICS
FOR STOCHASTIC DYNAMIC FACILITY LAYOUT
by
AKASH TAYAL
Department of Management Studies
Submitted in fulfilment of the requirements for the degree of Doctor of Philosophy
to the
INDIAN INSTITUTE OF TECHNOLOGY DELHI
NEW DELHI-110016, INDIA
MAY, 2017

© Indian Institute of Technology Delhi (IITD), New Delhi, 2017

i
DEPARTMENT OF MANAGEMENT STUDIES
INDIAN INSTITUTE OF TECHNOLOGY DELHI
MAY, 2017
CERTIFICATE
This is to certify that the thesis entitled “Development of Models and Meta-Heuristics
for Stochastic Dynamic Facility Layout” being submitted by Akash Tayal to the Indian
Institute of Technology Delhi for the award of the degree of Doctor of Philosophy is a
bonafide record of original research work carried out by him. He has worked under my
supervision and has fulfilled the requirements for the submission of the thesis, which has
reached the requisite standard.
The results contained in this thesis have not been submitted, in part or full, to any other
University or Institute for the award of any degree or diploma.
(Dr. S. P. Singh)
Associate Professor
Department of Management Studies
Indian Institute of Technology Delhi
New Delhi-110016
INDIA
Date:

ii
ACKNOWLEDGEMENTS
I am immensely grateful to my supervisor Dr. S. P. Singh for his guidance, unwavering
support and encouragement. This thesis could not have attained its present form, both in
content and presentation, without his active interest, direction and guidance. His personal
care has been the source of great inspiration. He has devoted his valuable time and took
personal care in motivating me wherever I was disheartened.
I take this opportunity to thank the members of my Student Research Committee,
Prof. Sushil (Chairman), Dr. J. Madaan (Internal expert), and Dr. A. Majumdar (External
expert) for their valuable comments and suggestions on my research. I am thankful to all
the faculty members of the Department of Management Studies for their support. I am also
thankful to my colleagues Ravi Kumar, Kuldeep Lamba, and Harpreet Kaur, for their
encouragement during the research work.
I specially thank my wife Reenee for her support, patience and loving participation
in accomplishing this task. I am also thankful to all the well-wishers for their direct and
indirect support in accomplishing the research work. I also express my gratitude to my
parents, father-in-law, and mother-in-law who remain a continuous source of inspiration for
me.
(Akash Tayal)

iii
ABSTRACT
A facility can be a workstation in a manufacturing system or a department in an
organization, which is used to produce goods or provide services. The classical Facility
Layout Problem (FLP) is a well explored and studied combinatorial optimization problem
(COP). In FLP, the key objective is to efficiently arrange „N‟ indivisible facilities to „M‟
locations such that the distance of material travel is minimized. Reduced material
movement lowers work-in-process levels and throughput times, less product damage,
simplified material control and scheduling, and less overall congestion. Hence, while
minimizing material handling cost (through minimizing material movement), other
objectives are achieved simultaneously. In practical scenarios, facility layout design is
dependent on demand which could be static, deterministic or random, and time planning
horizon which could be single period or multiple periods. Thus, it can be classified as
static, dynamic and stochastic. Considering uncertainty in the product demands in single
period and multi-period leads to two stochastic FLPs called Stochastic Static Facility
Layout Problem and Stochastic Dynamic Facility Layout Problem (SDFLP), respectively.
This research focuses on Equal Area SDFLP. SDFLP is known to be NP-hard, which is
modelled as QAP. Thus, it poses challenges when solved using exact algorithms and
heuristic techniques.
The objective of SDFLP is to find an optimum layout for each time period so as to
minimize the total material handling and rearrangement costs. In this research, three well-
known meta-heuristics, namely, Simulated Annealing (SA), Chaotic SA (CSA) and Firefly
Algorithm (FA) were evaluated to solve SDFLP and the best cooling schedule and chaotic
map were identified. Then, a new hybrid meta-heuristic „Hybrid FA/CSA‟ was designed for

iv
solving SDFLP. It was benchmark with the results available in the literature and it showed
that Hybrid FA/CSA outperformed the other meta-heuristics.
Further, the research proposes two models of Multi-Objective Stochastic Dynamic
Facility Layout Problem (MO-SDFLP), referred as MO-SDFLP Type I and MO-SDFLP
Type II, as and their solution methodology. To solve the MO-SDFLP Type I model, a new
integrated technique of SA, Data Envelopment Analysis (DEA) and Technique for Order
Preference by Similarity to Ideal Solution (TOPSIS) was developed. Beside formulating
MO-SDFLP the aim of the research was to deal with the practical situations - economic,
social, environmental aspects of the manufacturing unit. Keeping in light of this
Sustainable MO-SDFLP (Type II) was proposed. It was solved using a new technique of
combining meta-heuristic, Multi Attribute Decision Making (MADM) and integrated
ranking, considering the expert‟s opinion and at the same time reducing the subjectivity and
bias of the expert.
The research then, explores the applicability of Big Data Analytics in the domain of
facility layout. The 3 V‟s of Big Data are mapped to FLP, then using Factor Reduction and
MADM techniques a MO-SDFLP model was formulated, which was solved using hybrid
meta-heuristic.
Finally, the application of the proposed SDFLP model to design layout for real
industry was studied. A Shirt manufacturing unit was taken, where product demand for
each season is uncertain. The data used was collected from various reports available in the
industry and some of the data that was not readily available was gathered after discussion
with the management. After analysis, the case was modeled as SDFLP and solved using
hybrid meta-heuristic. Finally, the results and suggestions for improving the plants layout
were shared with the management.
v
सार
एक सुविधा एक विननभााण प्रणारी भें एक कामा कें द्र मा एक संगठन भें एक विबाग हो सकता है, जो भार का उत्ऩादन कयने मा सेिाए ंप्रदान कयने के लरए उऩमोग ककमा जाता है। शास्त्रीम सुविधा रेआउट सभस्त्मा (एपएरऩी) एक अच्छी तयह से ऩता रगामा औय संमोजन ककमा गमा संमोजन
संमोजन अनुकूरन सभस्त्मा (सीओऩी) है। एपएरऩी भें, भुख्म उदे्दश्म 'एभ' स्त्थानों ऩय कुशरताऩूिाक
'एन' अविबाज्म सुविधाओं की व्मिस्त्था कयना है, जैसे बौनतक मारा की दयूी को कभ ककमा जाता है। कभ हुई साभग्री आंदोरन कामा-इन-प्रोसेस स्त्तय औय थ्रऩूुट फाय, कभ उत्ऩाद ऺनत, सयरीकृत साभग्री ननमंरण औय शडे्मूलरगं औय कभ सभग्र बीड़ को कभ कयता है। इसलरए, साभग्री से ननऩटने की रागत को कभ कयते सभम (साभग्री आंदोरन को कभ कयके), अन्म उदे्दश्मों को एक साथ हालसर
ककमा जाता है व्मािहारयक ऩरयस्स्त्थनतमों भें, सुविधा रेआउट डडजाइन भांग ऩय ननबाय है जो स्स्त्थय,
ननमतात्भक मा मादृस्च्छक हो सकता है, औय सभम ननमोजन क्षऺनतज हो सकता है जो एकर अिधध
मा कई अिधध हो सकता है। इस प्रकाय, इसे स्स्त्थय, गनतशीर औय स्त्टोकेस्स्त्टक के रूऩ भें िगीकृत
ककमा जा सकता है एकर अिधध औय फहु-अिधध भें उत्ऩाद की भांगों भें अननस्श्ितता को देखते हुए
क्रभश् स्त्टोककस्स्त्टक स्त्टेटटक सुविधा रेआउट सभस्त्मा औय स्त्टोिस्स्त्टक डामनेलभक सुविधा रेआउट
सभस्त्मा (एसडीएपएरऩी) नाभक दो स्त्टोकेस्स्त्टक एपएरऩी होते हैं। मह शोध सभान ऺेर SDFLP
ऩय कें टद्रत है एसडीएपएरऩी को एनऩी-हाडा कहा जाता है, स्जस ेक्मूएऩी के रूऩ भें तैमाय ककमा गमा है। इस प्रकाय, मह िनुौनतमों का साभना कयता है जफ सटीक एल्गोरयदभ औय अनुभानी तकनीकों का उऩमोग कयके हर ककमा जाता है।
एसडीएपएरऩी का उदे्दश्म प्रत्मेक सभम अिधध के लरए इष्टतभ रेआउट ढंूढना है ताकक कुर साभग्री प्रफंधन औय ऩुनव्मािस्त्था रागत को कभ ककमा जा सके। इस शोध भें, तीन प्रलसद्ध भेटा-ह्मुरयस्स्त्टक्स, अथाात,् लसभुरेट एनेलरगं (एसए), अयाजक एसए (सीएसए) औय पामय फ्राई
एल्गोरयथभ (एपए) का भूल्मांकन एसडीएपएरऩी को हर कयने के लरए ककमा गमा था औय सफसे अच्छा शीतरन कामाक्रभ औय अयाजक नक्शा की ऩहिान की गई थी। इसके फाद, एसडीएपएरऩी को सुरझाने के लरए एक नमा हाइब्रिड भेटा-हीरयस्स्त्टक 'हाइब्रिड एपए / सीएसए' तैमाय ककमा गमा

vi
था। साटहत्म भें उऩरब्ध ऩरयणाभों के साथ मह फेंिभाका था औय मह दशााता है कक हाइब्रिड एपए /
सीएसए ने अन्म भेटा-ह्मूरयस्स्त्टक्स को फेहतय ककमा
इसके अरािा, शोध भें भल्टी-ऑब्जेस्क्टि स्त्टेिस्स्त्टक डामनेलभक पेिेलरि रेिेज प्रॉब्रभ (एभओ-
एसडीएपएरऩी) के दो भॉडरों का प्रस्त्ताि है, स्जसे एभओ-एसडीएपएरऩी टाइऩ आई औय एभओ-
एसडीएपएरऩी टाइऩ II, औय उनके सभाधान ऩद्धनत के रूऩ भें संदलबात ककमा गमा है। एभओ-
एसडीएपएरऩी टाइऩ आई भॉडर को हर कयने के लरए, एसए, डटेा एनोप्राभेंट एनालरलसस (डीईए)
की एक नई एकीकृत तकनीक औय आदशा सभाधान (टॉऩीस) के लरए सभानता द्िाया क्रभ ियीमता के लरए तकनीक विकलसत की गई थी। अनुसंधान के उदे्दश्म एभओ-एसडीएपएरऩी तैमाय कयने के
अरािा व्मािहारयक ऩरयस्स्त्थनतमों से ननऩटना था - विननभााण इकाई के आधथाक, साभास्जक,
ऩमााियण ऩहरुओं। इस सस्त्टेनेफर एभओ-एसडीएपएरऩी (टाइऩ II) के प्रकाश भें यखा गमा था। विशषेऻों की याम ऩय वििाय कयते हुए औय विशषेऻ की आत्भीमता औय ऩूिााग्रह को कभ कयने के
साथ-साथ भेटा-उत्ऩरयिती, भल्टी आटटटरयटी डडलससन भेककंग (एभएडीएभ) औय एकीकृत यैंककंग
के संमोजन की एक नई तकनीक का उऩमोग कयके हर ककमा गमा।
तफ शोध, सुविधा रेआउट के डोभेन भें ब्रफग डटेा एनालरटटक्स की प्रमोज्मता की खोज कयता है। ब्रफग
डटेा के 3 िी के FLP को भैऩ ककए जाते हैं, कपय पैक्टय कटौती औय एभएडीएभ तकनीकों का उऩमोग
कयके एक एभओ-एसडीएपएरऩी भॉडर तैमाय ककमा गमा था, स्जसे संकय भेटा-अनुभानी
अतं भें, प्रस्त्तावित एसडीएपएरऩी भॉडर के आिेदन को िास्त्तविक उद्मोग के लरए रेआउट
डडजाइन कयने का अध्ममन ककमा गमा। शटा भैन्मुपैक्िरयगं मूननट लरमा गमा था, जहां प्रत्मेक
सीजन के लरए उत्ऩाद की भांग अननस्श्ित होती है। उऩमोग ककए गए डटेा को उद्मोग भें उऩरब्ध
विलबन्न रयऩोटों से एकर ककमा गमा था औय प्रफंधन के साथ ििाा के फाद आसानी से उऩरब्ध नहीं होने िारे कुछ आंकड़ ेएकर हुए थे। विश्रेषण के फाद, भाभरा एसडीएपएरऩी के रूऩ भें तैमाय ककमा गमा था औय हाइब्रिड भेटा- अतं भें, विननभााण इकाइमों के रेआउट भें सुधाय के लरए ऩरयणाभ औय
सुझाि प्रफंधन के साथ साझा ककए गए थे।
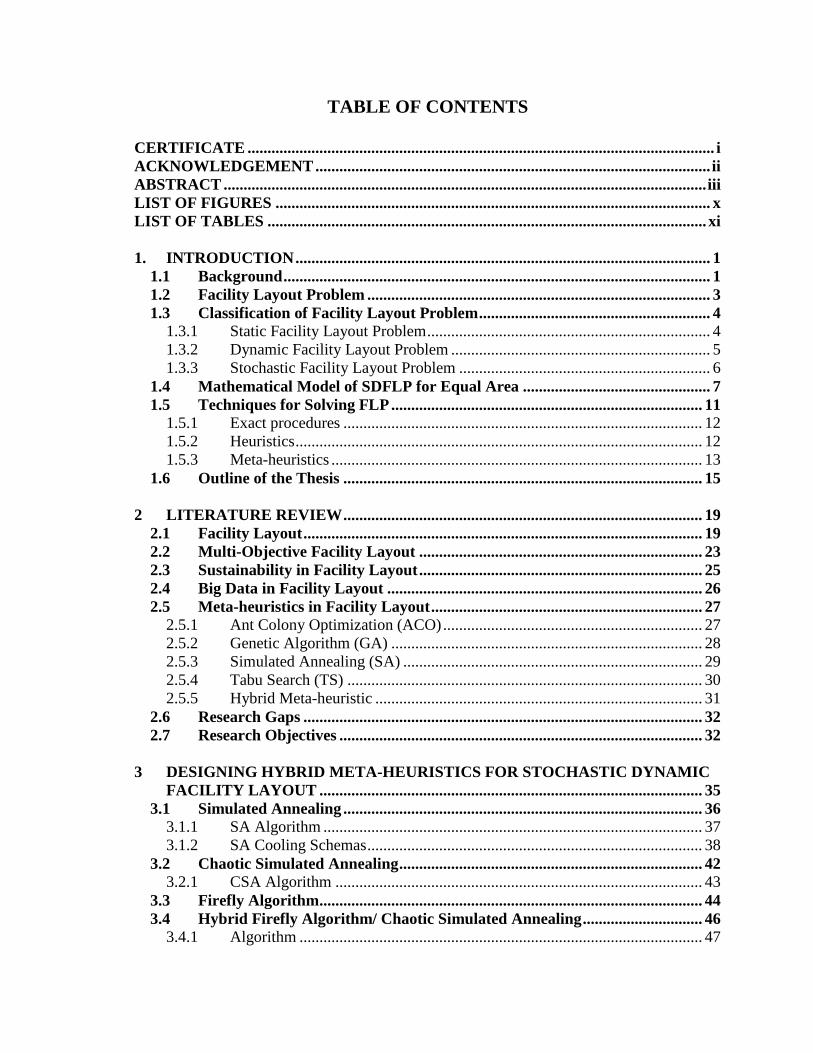
TABLE OF CONTENTS
CERTIFICATE ..................................................................................................................... i ACKNOWLEDGEMENT ................................................................................................... ii ABSTRACT ......................................................................................................................... iii LIST OF FIGURES ............................................................................................................. x LIST OF TABLES .............................................................................................................. xi
1. INTRODUCTION ........................................................................................................ 1 1.1 Background ........................................................................................................... 1 1.2 Facility Layout Problem ...................................................................................... 3 1.3 Classification of Facility Layout Problem .......................................................... 4
1.3.1 Static Facility Layout Problem ....................................................................... 4 1.3.2 Dynamic Facility Layout Problem ................................................................. 5 1.3.3 Stochastic Facility Layout Problem ............................................................... 6
1.4 Mathematical Model of SDFLP for Equal Area ............................................... 7 1.5 Techniques for Solving FLP .............................................................................. 11
1.5.1 Exact procedures .......................................................................................... 12 1.5.2 Heuristics ...................................................................................................... 12 1.5.3 Meta-heuristics ............................................................................................. 13
1.6 Outline of the Thesis .......................................................................................... 15
2 LITERATURE REVIEW .......................................................................................... 19 2.1 Facility Layout .................................................................................................... 19 2.2 Multi-Objective Facility Layout ....................................................................... 23 2.3 Sustainability in Facility Layout ....................................................................... 25 2.4 Big Data in Facility Layout ............................................................................... 26 2.5 Meta-heuristics in Facility Layout .................................................................... 27
2.5.1 Ant Colony Optimization (ACO) ................................................................. 27 2.5.2 Genetic Algorithm (GA) .............................................................................. 28 2.5.3 Simulated Annealing (SA) ........................................................................... 29 2.5.4 Tabu Search (TS) ......................................................................................... 30 2.5.5 Hybrid Meta-heuristic .................................................................................. 31
2.6 Research Gaps .................................................................................................... 32 2.7 Research Objectives ........................................................................................... 32
3 DESIGNING HYBRID META-HEURISTICS FOR STOCHASTIC DYNAMIC
FACILITY LAYOUT ................................................................................................ 35 3.1 Simulated Annealing .......................................................................................... 36
3.1.1 SA Algorithm ............................................................................................... 37 3.1.2 SA Cooling Schemas .................................................................................... 38
3.2 Chaotic Simulated Annealing ............................................................................ 42 3.2.1 CSA Algorithm ............................................................................................ 43
3.3 Firefly Algorithm ................................................................................................ 44 3.4 Hybrid Firefly Algorithm/ Chaotic Simulated Annealing .............................. 46
3.4.1 Algorithm ..................................................................................................... 47

3.5 Illustrative Example ........................................................................................... 49 3.6 Computational Results ....................................................................................... 49
3.6.1 SDFLP Solved using SA .............................................................................. 50 3.6.2 SDFLP Solved using CSA ............................................................................ 53 3.6.3 SDFLP Solved using Hybrid FA/CSA ......................................................... 57
3.7 Conclusion ........................................................................................................... 60
4 MULTI-OBJECTIVE STOCHASTIC DYNAMIC FACILITY LAYOUT .......... 61 4.1 MO-SDFLP Type I ............................................................................................. 62 4.2 Mathematical Formulation of MO-SDFLP Type I.......................................... 63 4.3 Solving MO-SDFLP Type I ............................................................................... 66
4.3.1 Step 1: Generating pool of layouts ............................................................... 68 4.3.2 Step 2: DEA to identify efficient layouts ..................................................... 68 4.3.3 Step 3: TOPSIS for Ranking Efficient Layouts ............................................ 69
4.4 Illustrative Example and Results ...................................................................... 72 4.5 Conclusion ........................................................................................................... 77
5 SUSTAINABLE MULTI-OBJECTIVE STOCHASTIC DYNAMIC FACILITY
LAYOUT ..................................................................................................................... 79 5.1 MO-SDFLP Type II ............................................................................................ 80 5.2 Sustainable MO-SDFLP Formulation .............................................................. 81 5.3 Solving MO-SDFLP Type II (Sustainable MO-SDFLP) ................................. 85
5.3.1 Step 1: Generating a Pool of Layouts ........................................................... 86 5.3.2 Step 2: DEA to Identify Efficient Layouts ................................................... 87 5.3.3 Step 3: Weights for Sustainability Criteria ................................................... 87 5.3.4 Step 4: Ranking of Layouts using MADM techniques ................................. 88 5.3.5 Step 5: Consensus Ranking of Layouts ........................................................ 89
5.4 Illustrative Example and Results ...................................................................... 91 5.5 Conclusion ......................................................................................................... 101
6 BIG DATA ANALYTICS AND FACILITY LAYOUT PROBLEM .................. 102 6.1 Big Data ............................................................................................................. 103 6.2 Big Data Analysis for FLP ............................................................................... 103 6.3 Big Data Analytics and Meta-heuristic framework for FLP ........................ 105
6.3.1 Step 1: Identifying FLP criteria and mapping to 3 V‟s of Big Data ........... 107 6.3.2 Step 2: Survey Based Data Collection for Criteria Ranking ...................... 109 6.3.3 Step 3: Dimension Reduction using Factor Analysis ................................. 109 6.3.4 Step 4: Reduced Set of Criteria .................................................................. 111 6.3.5 Step 5: Development of Mathematical Model for each Criteria ................ 114 6.3.6 Step 6: Aggregate Objective Function: MO-SDFLP Type I .................... 119 6.3.7 Step 7: Weights Computation using MADM Techniques .......................... 119 6.3.8 Step 8: Hybrid FA/CSA .............................................................................. 120
6.4 Illustrative Example and Results .................................................................... 120 6.5 Conclusion ......................................................................................................... 122
7 CASE STUDY ........................................................................................................... 123

7.1 Case Study of Shirt Manufacturing Unit ....................................................... 124 7.2 Case Study Result ............................................................................................. 128 7.3 Conclusion ......................................................................................................... 130
8 DISCUSSION AND CONCLUSION ...................................................................... 131 8.1 Summary of Research ...................................................................................... 131 8.2 Major Contribution .......................................................................................... 132 8.3 Recommendations and Future Research ....................................................... 133
REFERENCES ................................................................................................................. 135
APPENDICES .................................................................................................................. 156 APPENDIX A.1 ............................................................................................................ 156 APPENDIX A.2 ............................................................................................................ 158 APPENDIX A.3 ............................................................................................................ 165 APPENDIX A.4 ............................................................................................................ 167 APPENDIX A.5 ............................................................................................................ 169
PUBLICATIONS FROM THE THESIS ....................................................................... 189
PROFILE OF AUTHOR ................................................................................................. 191
x
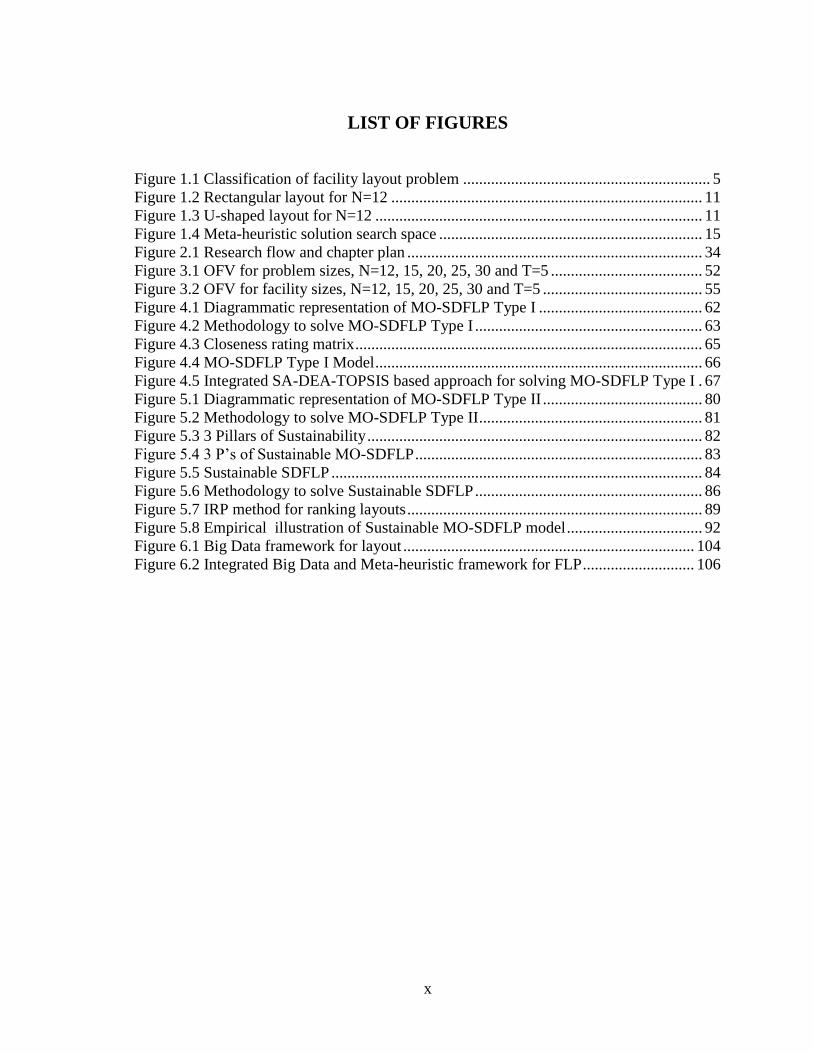
LIST OF FIGURES
Figure 1.1 Classification of facility layout problem .............................................................. 5 Figure 1.2 Rectangular layout for N=12 .............................................................................. 11 Figure 1.3 U-shaped layout for N=12 .................................................................................. 11 Figure 1.4 Meta-heuristic solution search space .................................................................. 15 Figure 2.1 Research flow and chapter plan .......................................................................... 34 Figure 3.1 OFV for problem sizes, N=12, 15, 20, 25, 30 and T=5 ...................................... 52 Figure 3.2 OFV for facility sizes, N=12, 15, 20, 25, 30 and T=5 ........................................ 55 Figure 4.1 Diagrammatic representation of MO-SDFLP Type I ......................................... 62 Figure 4.2 Methodology to solve MO-SDFLP Type I ......................................................... 63 Figure 4.3 Closeness rating matrix ....................................................................................... 65 Figure 4.4 MO-SDFLP Type I Model .................................................................................. 66 Figure 4.5 Integrated SA-DEA-TOPSIS based approach for solving MO-SDFLP Type I . 67 Figure 5.1 Diagrammatic representation of MO-SDFLP Type II ........................................ 80 Figure 5.2 Methodology to solve MO-SDFLP Type II ........................................................ 81 Figure 5.3 3 Pillars of Sustainability .................................................................................... 82 Figure 5.4 3 P‟s of Sustainable MO-SDFLP ........................................................................ 83 Figure 5.5 Sustainable SDFLP ............................................................................................. 84 Figure 5.6 Methodology to solve Sustainable SDFLP ......................................................... 86 Figure 5.7 IRP method for ranking layouts .......................................................................... 89 Figure 5.8 Empirical illustration of Sustainable MO-SDFLP model .................................. 92 Figure 6.1 Big Data framework for layout ......................................................................... 104 Figure 6.2 Integrated Big Data and Meta-heuristic framework for FLP ............................ 106

xi
LIST OF TABLES
Table 3.1 Notations for cooling schedule ............................................................................. 39 Table 3.2 Chaotic maps ........................................................................................................ 43 Table 3.3 Parameters for simulated annealing, N=12 .......................................................... 50 Table 3.4 Parameters for MSA1 and MSA2 ........................................................................ 50 Table 3.5 OFV and CPU time for nine SA cooling schedule .............................................. 51 Table 3.6 Exponential cooling schedule solution with Zp = 0.75 for N=12 and T=5 .......... 52 Table 3.7 Exponential cooling schedule solution with Zp = 0.85 for N=12 and T=5 .......... 52 Table 3.8 Exponential cooling schedule solution with Zp = 0.95 for N=12 and T=5 ......... 53 Table 3.9 Parameters for Chaotic Simulated Annealing, N=12 ........................................... 54 Table 3.10 OFV and CPU time for seven CSA chaotic maps .............................................. 54 Table 3.11 Solution with Zp = 0.75 for N=12 and T=5 (Logistic map) ............................... 55 Table 3.12 Solution with Zp = 0.85 for N=12 and T=5 (Logistic map) ............................... 55 Table 3.13 Solution with Zp = 0.95 for N=12 and T=5 (Logistic map) ............................... 56 Table 3.14 Solution with Zp = 0.75 for N=12 and T=5 (Sine map) ..................................... 56 Table 3.15 Solution with Zp = 0.85 for N=12 and T=5 (Sine map) ..................................... 56 Table 3.16 Solution with Zp = 0.95 for N=12 and T=5 (Sine map) ..................................... 56 Table 3.17 Parameters for hybrid FA/CSA, N=12 ............................................................... 57 Table 3.18 The OFV (10 trials), N=12, T=5 at varying Zp .................................................. 57 Table 3.19 Solution with Zp = 0.75 for N=12 and T=5 (Logistic map) ............................... 58 Table 3.20 Solution with Zp = 0.85 for N=12 and T=5 (Logistic map) ............................... 58 Table 3.21 Solution with Zp = 0.95 for N=12 and T=5 (Logistic map) ............................... 58 Table 3.22 Solution with Zp = 0.75 for N=12 and T=5 (Sine map) ..................................... 58 Table 3.23 Solution with Zp = 0.85 for N=12 and T=5 (Sine map) ..................................... 59 Table 3.24 Solution with Zp = 0.95 for N=12 and T=5 (Sine map) ..................................... 59 Table 3.25 The objective function value (10 trials), N=12, T=5 at varying Zp.................... 59 Table 4.1 Notations of DEA ................................................................................................. 69 Table 4.2 OFV for Zp = 0.65 and Efficiency Scores (DEA) ................................................ 73 Table 4.3 OFV for Zp = 0.70 and Efficiency Scores (DEA) ................................................ 74 Table 4.4 OFV for Zp = 0.75 and Efficiency Scores (DEA) ................................................ 74 Table 4.5 OFV for Zp = 0.80 and Efficiency Scores (DEA) ................................................ 74 Table 4.6 OFV for Zp = 0.85 and Efficiency Scores (DEA) ................................................ 75 Table 4.7 OFV for Zp = 0.90 and Efficiency Scores (DEA) ................................................ 75 Table 4.8 OFV for Zp = 0.95 and Efficiency Scores (DEA) ................................................ 75 Table 4.9 TOPSIS ranking for weights, WZp = 0.1, WFD = 0.4 and WCF = 0.4 .................... 76 Table 5.1 Pool of layouts ...................................................................................................... 93 Table 5.2 Efficiency of layouts using DEA ......................................................................... 94 Table 5.3 Decision matrix for criteria using AHP ............................................................... 95 Table 5.4 Weights of the 6 criteria obtained from AHP ...................................................... 95 Table 5.5 Ranking using TOPSIS (Euclidian) ..................................................................... 97 Table 5.6 Ranking using TOPSIS (Manhattan) ................................................................... 97 Table 5.7 Ranking using AHP .............................................................................................. 98 Table 5.8 Dominating interaction ......................................................................................... 98

xii
Table 5.9 Ranking using IRP ................................................................................................ 99 Table 5.10 Consensus Ranking ............................................................................................ 99 Table 5.11 Ranked Layouts using BAK ............................................................................. 100 Table 5.12 Ranked Layouts using ILP ............................................................................... 100 Table 6.1 FLP criteria for the survey .................................................................................. 109 Table 6.2 KMO and Barlett‟s test results ........................................................................... 111 Table 6.3 Factor extraction and rotation ............................................................................. 113 Table 6.4 Extracted factors ................................................................................................. 114 Table 6.5 Factor classification and its explanation ............................................................. 114 Table 6.6 List of Notations used to model MO-SDFLP. .................................................... 116 Table 6.7 Decision matrix using AHP ................................................................................ 119 Table 6.8 Identifying weights using AHP .......................................................................... 120 Table 6.9 Statistical evaluation of Aggregate OFV for N=12 and T=5 (10 trials) ........... 120 Table 6.10 Solution with Zp = 0.75 for N=12 and T=5 ...................................................... 121 Table 6.11 Solution with Zp = 0.85 for N=12 and T=5 ...................................................... 121 Table 6.12 Solution with Zp = 0.95 for N=12 and T=5 ...................................................... 121 Table 7.1 Machine number and their names ....................................................................... 125 Table 7.2 Men‟s T-Shirt production process ...................................................................... 125 Table 7.3 Men‟s Formal Shirt Without Embroidery production process ........................... 126 Table 7.4 Men‟s Formal Shirt With Embroidery production process ................................ 126 Table 7.5 Products .............................................................................................................. 128 Table 7.6 Initial Solution .................................................................................................... 129 Table 7.7 Solution with Zp = 0.75 for N=20 and T=4 ........................................................ 129
Table A.1.1 Input Data ....................................................................................................... 156
Table A.1.2 Distance between machine locations .............................................................. 156
Table A.1.3 Shifting cost for machines .............................................................................. 157
Table A.1.4 Input data for part demand for periods 1-5 ..................................................... 157
Table A.1.5 Initial Solution for facility size, N=12 and T=5 ............................................. 157
Table A.2.1 Input Data ....................................................................................................... 158
Table A.2.2 Shifting cost of all 30 machines..................................................................... 158
Table A.2.3 Distance between machine locations, N=15 ................................................... 159
Table A.2.4 Distance between machine locations, N=20 ................................................... 160
Table A.2.5 Distance between machine locations, N=25 ................................................... 161
Table A.2.6 Distance between machine locations, N=30 ................................................... 162
Table A.2.7 Initial solution for N=15, T=5 ........................................................................ 162
Table A.2.8 Initial solution for N=20, T=5 ........................................................................ 163
Table A.2.9 Initial solution for N=25, T=5 ........................................................................ 163
Table A.2.10 Initial solution for N=30, T=5 ...................................................................... 163
Table A.2.11 Input data for part demand for periods 1-5 ................................................... 164
Table A.3.1 Adjacency matrix for N=12 ............................................................................ 165
Table A.3.2 Separation matrix for N=12 ............................................................................ 165 Table A.3.3 Hazardous movement matrix for N=12 .......................................................... 166 Table A.3.4 Material movement matrix for N=12 .............................................................. 166
Table A.4.1 Product demand for the 4 seasons .................................................................. 167
Table A.4.2 Product flow.................................................................................................... 168
Table A.4.3 Product requirement........................................................................................ 168