development of markets and employment in the energy system
TRANSCRIPT

Development of markets and employment in the energy system transformation in Germany
Marlene O’Sullivan, Energy Systems Analysis, German Aerospace Centre (DLR)
> DFBEW > O'Sullivan • Market development Germany > 25.03.2020DLR.de • Chart 1
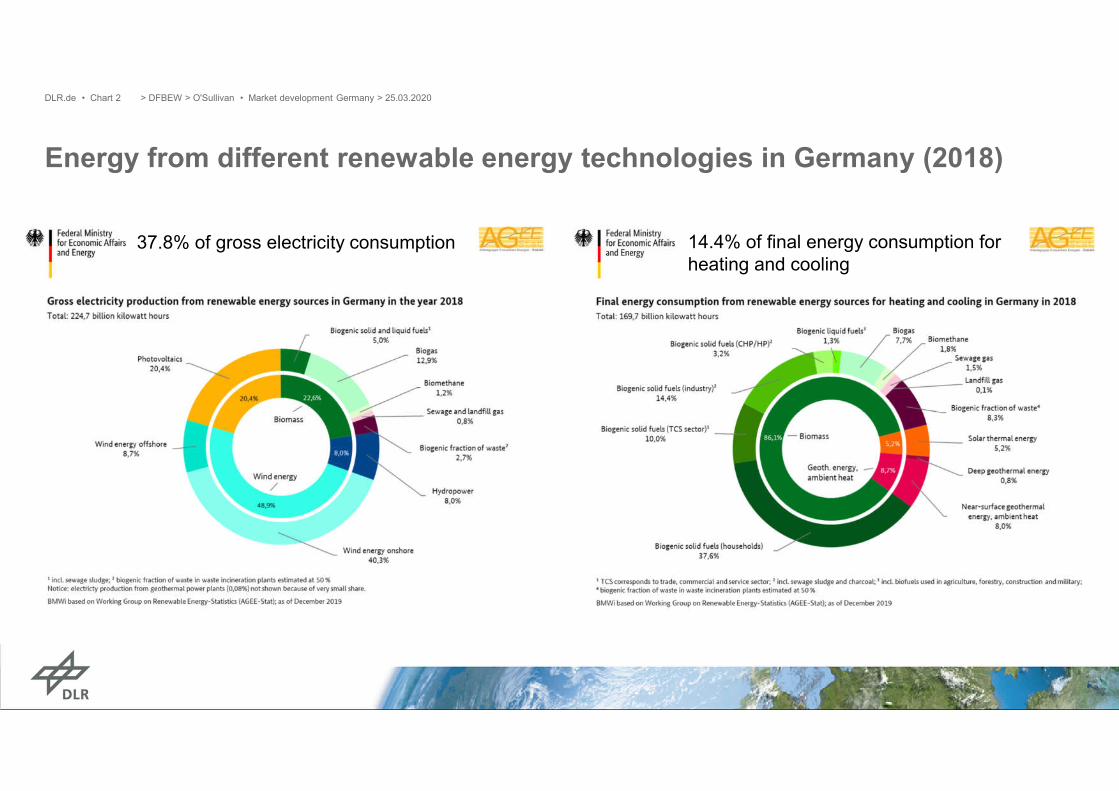
Energy from different renewable energy technologies in Germany (2018)
> DFBEW > O'Sullivan • Market development Germany > 25.03.2020DLR.de • Chart 2
37.8% of gross electricity consumption 14.4% of final energy consumption for heating and cooling

Investment in renewable energy technologies (RES) in Germany
• EUR 270 billion was invested in RES-technologies in Germany in the period between 2000 and 2017
• 70% went into PV (36%) and wind energy technologies (34%) that strongly influenced the development of overall investments
• Reduction of PV investment in 2011/2012 due to decline in specific investment costs, 2013 saw a sharp reduction in installations.
• 81% of the investments in RES-technologies between 2000 and 2017 were in electricity generation technologies
• 19% of the investment could be allocated to technologies exclusively used for heating
> DFBEW > O'Sullivan • Market development Germany > 25.03.2020DLR.de • Chart 3
Source: ZSW

Methodological approach
• Input-Output (IO) modelling approach
• Allows for the consideration of the activities directly related to the RES investments as well as the activities indirectly triggered in the upstream production stages
• Additional IO-vectors for the production & installation of 11 RES technologies were derived from three company surveys (2004, 2007, 2012).
• IO-vectors for operation & maintenance (O&M) of 11 RES technologies were created.
• Provision of biomass and biofuels: sectoral structure of demand as well as the foreign trade of 14 biogenic fuel fractions
> DFBEW > O'Sullivan • Market development Germany > 25.03.2020DLR.de • Chart 4

Domestic demand and gross output of renewable energy technologies in Germany
• Domestic demand amounted to just under EUR 321 billion for the years 2000 to 2017.
• The largest share of domestic demand with about EUR 136 billion (43%) was provided by the wind sector, followed by the PV-sector with EUR 83 billion (26%).
• Exports were able to offset the decline in investments in 2011, whereas from 2012 onwards a consolidation took place, which affected the PV and biogas sectors in particular.
• Gross output which is determined via the IO-framework was almost twice as high as domestic demand over the whole time period under consideration.
> DFBEW > O'Sullivan • Market development Germany > 25.03.2020DLR.de • Chart 5

Foreign trade balance of renewable energy technologies in Germany
• A closer look at foreign trade shows that in the period under review there were more exports than direct imports of RES-systems on the German market
• However, figures only include imports of end products, whereas on the export side, intermediate products were also included. Imports of intermediate products are included within the IO-framework.
• In the PV sector, the trade balance from 2000 to 2012 was consistently negative which was partly due to the fact that Germany did not have sufficient production capacity to meet domestic demand.
• In terms of exports, the onshore wind energy sector has been very strong.
> DFBEW > O'Sullivan • Market development Germany > 25.03.2020DLR.de • Chart 6

Employment from renewable energy technologies in Germany
• The main employment driver so far has been the investment in new RES-installations.
• Operation and maintenance (O&M) as well as the provision of biogenic fuels are gaining importance and employed just about half of the people in the RES-industry in Germany in 2017.
• Fluctuations in the development of the overall RES-employment are almost exclusively attributable to investments.
• O&M as well as the provision of biomass and biogenic fuels have had a stabilizing effect on the employment in the RES-sector.
> DFBEW > O'Sullivan • Market development Germany > 25.03.2020DLR.de • Chart 7

Regional distribution 2016
• RES employment can be found in all federal states in Germany.
• The importance of RES employment in each federal state has to be seen in relation to the overall employment. Taking this aspect into account there is a strong concentration in the north and east of Germany.
• In 2016, wind energy is the most important pillar in almost all federal states, followed by bioenergy.
> DFBEW > O'Sullivan • Market development Germany > 25.03.2020DLR.de • Chart 8
32 71050 650
9 680
56 460
14 870
45 590
10 270
24 850
17 630
10 450
15 140
18 640
2 310
19 010
5 690
=
4 550
EE-Beschäftigung je
1 000 Beschäftigteinsgesamt (2016)
338 500
Geo-thermie
Biomasse(inkl.
Bereit-stellung)
Solar-energie
Windkraft
Wasser-kraft
Bruttobeschäftigunginsgesamt
<= 7,5 (6)
7,6–13,7 (4)
>= 13,8 (6)
Source: Ulrich & Lehr (2018): Erneuerbar beschäftigt in den Bundesländern

Employment from the activities of the energy economy in Germany
> DFBEW > O'Sullivan • Market development Germany > 25.03.2020DLR.de • Chart 9

Thank you very much for your attention!
Contact: [email protected]
Report: https://www.diw.de/documents/publikationen/73/diw_01.c.617032.de/diwkompakt_2019-135.pdf
Study commissioned by the BMWi
> DFBEW > O'Sullivan • Market development Germany > 25.03.2020DLR.de • Chart 10