development of k- means based svm regression (ksvmr...
TRANSCRIPT

International Journal on Electrical Engineering and Informatics ‐ Volume 6, Number 2, June 2014
Development of K- Means Based SVM Regression (KSVMR) Technique
for Boiler Flue Gas Estimation
Ramakalyan Ayyagari1, Anantharaman Sivakumar2, and Krithivasan Kannan3
1National Institute of Technology, Professor, Department of Instrumentation and Control, Thiruchirappalli, India 2Research Scholar, SASTRA University, Thanjavur, and Manager,
Reliance Industries Limited, India 3Professor,Department of Mathematics, SASTRA University, Thanjavur, India
Abstract: This paper presents development of a Support Vector Machine (SVM) regression, driven by a Radial Basis Function kernel for obtaining the composition of boiler flue gas mixtures. The frequency components of various gas mixtures were first processed by Floyd K – Means algorithm and the data with class labels were utilized to build a multi-class SVM regression model for discrimination of the flue gas constituents and subsequent composition finding. The Meta parameters (C, ε and kernel) are optimized using grid search technique to obtain appropriate support vectors to train the network. After ascertaining the performance of proposed technique through volatile organic component (VOC) data acquired from quartz crystal microbalance (QCM) type sensors used by earlier researchers, detailed studies have been carried out to study the discriminating and estimation capability of the proposed technique for real time flue gas data acquired from two different analyzers namely ORSATR and KANE. Exhaustive studies clearly indicate the exceptional performance of the proposed SVM model in classifying and estimating the flue gas components in machine (Analyzer) independent manner. Keywords: Flue gas mixture, SVM, Grid Technique Prediction error, Feature selection.
1. Introduction The analysis of a gas mixture to find the components concentration from the sensor data gained more and more attention and has become a recent trend of current research due to its industrial importance. In boiler flue gas analysis, control of excess air not only improves the boiler efficiency but also leads to air pollution control. The industrial importance of developing sensors for detection of various gas concentrations in the gas mixtures has attracted a large number of researchers to enter into this domain. Related Experimental works include fundamental study on multi-mode quartz crystal gas sensors (for CO2) [1], WO3thin film deposition on QCR [2], and detection of Hydrogen in ambient air using a coated piezoelectric crystal [3], to name a few. For the past one-decade developing gas recognition systems from its unique properties using pattern recognition algorithms such as individual and principal component analysis, neural networks, and fuzzy logic has been the active area of research. Most of the software designs that process the digital data collected from the sensor responses serve as online indicators for the decision to be taken well in advance in order to have effective functioning of machines in an industry leading to optimum resource utility. Moreover exploratory data analysis focusing industrial safety application [4, 5] has been carried out not only for the design of gas sensors but also for implementing computer assisted control strategies. The vital components of pattern recognition problems using state transform model include feature extraction techniques, classification algorithms, clustering algorithms to name a few. Since issues pertaining to ‘curse of dimensionality’ differ from classifier to classifier, designing an appropriate preprocessing technique as a classifier which augers well with the SVM is also an important aspect of building a computational model. .
Received: December 20th, 2013. Accepted: May 17th, 2014
359

Machine learning provides cost effective and practical approaches to construct pattern classifier for a wide variety of pattern recognition applications. Though machine learning algorithms offer broad coverage ranging from Bio-informatics applications which includes diagnosis of ovarian [6], brain cancer [9] lung cancer [10], to gas sensor applications such as olfactory signal recognition [11] Fast gas identification using hot-plate gas sensor [12], there is still an awareness of the need for robust classification which provides good stability for classifying multiple types of data acquired from multiple sensors. Also, one of the fundamental problems in knowledge management raised by the so called ‘stability – plasticity dilemma [13] as learning new patterns without forgetting the old ones needs to be addressed by the classifier. Furthermore, stacked generalization emerged out of parallel classifiers for decision based fusion requires further training for combining classifiers which in turn cause the design of adaptive classifiers with respect to input data. Feature extraction / selection algorithms such as arithmetic residue techniques [14] provide good classifiers yet they require a PNN at the classifying stage itself. Similarly though Probabilistic Neural Networks [15-19] based on the Bayesian strategy for decision-making and non-parametric estimations of conditional probability density functions are useful for automatic pattern recognition problems, the major disadvantage of PNN is its requirement of one neuron for each training pattern leading to low training speed ratio of PNN over other Back propagation Neural net (BPN). Also the PNN’s ability to generalize to classify unknown patterns is almost same as that of BPN. Composition finding in a boiler flue gas mixture requires a good estimator supported by good classifier, which requires periodical data observed from the sensor. Once the sensor outputs sizeable data, they need to be processed in such a way that after classification task is performed into five classes, the virtual analyzer should quantify each component in the mixture with a reasonable level of accuracy. In this work, a computational model has been developed by integrating Floyds K-Means with SVM technique for estimating the mass concentration of individual component of Boiler flue gas. Initially, the digital data acquired from the sensor responses have been processed in order to have appropriate scaling of each attribute to a common range. K- Means algorithm has been invoked for obtaining number of clusters with cluster labels. A support vector machine with Radial Basis Function Kernel has been implemented for classification. In the second phase, the support vectors, generated in the higher dimensional space of the SVM have been used for regression to estimate the composition of flue gas.. This technique is validated first with the soil data [20] and then with volatile organic compounds data [22]. The quantitative discriminating capability of proposed technique has been analyzed first with data acquired from KANE analyzer and then from ORSAT analyzer. 2. Boiler Fluegas Analysis – Concept and Background A. Concept Boiler flue gas analysis is one such problem where control of excess air is maintained through hardware analyzers and subsequent study. Typically the boiler consists of furnace, steam generation/ separation and heat recovery schemes. Flue gas generated by burning fuels such as furnace oil, air etc in proper proportions in the furnace is used for generating steams in boiler tubes. Since energy efficiency of a boiler depends on the amount of useful energy spent in generating steam, it becomes necessary to eliminate all unproductive energy losses. This can be actually achieved by controlling the excess air used for combustion. Proper control of excess oxygen leads to 2-5% of energy savings and lowering excess oxygen by .5% will increase the boiler efficiency by 0.25% Presently external hardware analyzers are used to control the excess air in boilers by measuring O2 content of the flue gas. Further it is mandatory to maintain the emission levels of other gases namely Sulphur oxides (SO2) , Nitrogen oxides (NOX) at stack. The technical specifications of gas analyzer are furnished in [14].
Ramakalyan Ayyagari, et al.
360

The principle of sensors or analyzers is mainly based on the fundamental oscillation frequency changes ∆ƒ that depends upon absorption of molecules from gas phases. This frequency change is the result of change in oscillating mass ∆m [23]: ∆ƒ = Cff0
2∆m/A, where A is the area of the sensitive layer,Cfis the mass sensitivity of the quartz crystal, f0 is the fundamental resonance of the crystal and ∆m is the change in mass. B. Data Acquisition Two analyzers have been used to carry out the flue gas study. First one as an offline case the portable ORSAT type analyzer and the other one KANE make online data acquisition analyzer system. Nitrogen (N2), Carbon di oxide (CO2), Oxygen (O2), Nitrogen Oxides (NO2), Sulphur oxides (SO2), Carbon monoxide (CO) are the consistent gases of the flue gas mixed at certain ratios though they vary from place to place according to national ambient quality standards [14]. Typical absorbent reagents used in the successive steps of absorption analysis have been carried out based on ASTM standards [14]. For second one KANE, manufacturer’s guidelines have been adhered with respect to calibration. 3. Machine Learning Algorithms for Classification Task Machine learning provides the best and computationally attractive practical approaches for the design of pattern classifiers to a wide range of pattern recognition problems. Machine learning algorithms have been applied successfully to many bioinformatics applications such as diagnosis of ovarian [6], leukemia [7], lymphoma [8] for data classification and prediction tasks according to nature of problem. In spite of this success, the need for still robust classifiers, which exhibit performance stability for multiple types of data, is increasing in the context of estimation problems. Some classifiers exhibit better classification results for one type of data but fail to perform as well for other dataset. Several statistical measures which can be used to achieve multiple classifiers such as sum, product, minimum, maximum, median and strategies such as majority voting [24, 25, 26, 27, 28], that do not require training have been reported to literature. Combining a classifier with an appropriate feature extraction technique to form an ensemble provide complete set of input vectors to GRNN for estimating the composition. In these lines, AR based feature selection techniques auger well with SVM to form an ensemble preprocessing technique, but for its inadequate clusters to be taken up for estimating individual gas concentrations. But it has been shown by adapting a set of separate smoothing parameter (for every dimension involved) that the estimation accuracy of GRNN can greatly be improved [29], due to its effective local approximation in the sense of estimating probability distribution functions [30]. A. Support Vector Machine Given a training set wwww) )= F(x ,y( XT k
lbpk ,.........,, = 321×Ω⊂ ,
automated classification addresses the gas problem of finding an approximation F)
of an unknown function F defined from an input space Ω onto an unordered set of classes twwww ,.........,, 321 . Among the broad variety of techniques available in the literature to learn classification problems, SVM is a state of art learning machine based on the structural risk minimization induction principle [31] & has achieved superior performance in a wide range of applications [32]. Traditional neural network approaches are suffering out of the difficulties such as generalization, producing models that can over fit the all. Consequently optimization algorithms are used for parameter selection and statistical measures are used for best model selection. But SVM’s are gaining popularity due to many attractive features with promising empirical performance. Its formulation embodies the structural Risk Minimization (SRM) principle (Which minimizes an upper bound on the expected risk) which has observed to be superior to traditional Empirical Risk Minimization (ERM) principle (which minimizes the error on the training all) by conventional neural networks.
Development of K- Means Based SVM Regression (KSVMR) Technique
361

B. SVM principle
Figure 1A) C=5
Figure 1B) C=10
Figure 1C) C=15
Figure 1D) C=20
Figure 1E) C=25
Figure 1F) C=30
Ramakalyan Ayyagari, et al.
362

Support vector machines are techniques based on regularization schemes developed from hyper plane classifier under linear separable case, which perform well in many classification problems. SVM converts the Euclidean input vector space to higher dimensional space [14] and acts as binary classifier with separating hyper plane in higher dimensional space satisfying
0, =+ bxw (1)
For the all set (xi ,yi), xiε Rd
, yi € 1,-1, i = 1,2,3,….N, and ‘d’ being dimension of the input space where the parameters w and bare constrained by
1,min =+ bxw (2)
Since the classifying margin for standard SVM is proved to be )/2( w , maximizing the
classifying margin is equivalent to minimizing 2w . Hence the optimization problem of maximizing the classifying margin reduces to the quadratic programming problem:
n. ... ... ,, 1,))((iy
)/()(
21
221
=>+
=
ibixTwtoSubjected
wwJ
Minimise
φ
(3) For linearly non separable cases, no such hyper plane exists which can satisfy every training sample. Hence the optimization idea is generalized by introducing the concept called “soft margin”. Hence the optimization problem becomes
n. ... ,...2,1 ,-1))((y
)2/1()(
ii
1
2
=>+
+= ∑=
ibxwtoSubjected
CwwJ
Minimise
iT
n
ii
ζφ
ζ
(4) Where iζ are the slack variables handling the non-separable data (inputs), i labels the n
training cases, φ the kernel function used to transfer the data from input space to feature space and C , being the capacity constant becomes the tuning parameter (user specified to avoid over fitting) to balance the margin and training error. Usually to solve (3) and (4) Lagrangian multipliers are used and convert them to quadratic programming problems. Figure 1 shows SVM classification of boiler flue gas data into five classes, their decision boundaries and support vectors for various values of tuning parameters of C. B.1. Model selection When the training vectors xi are mapped into a higher dimensional space by the non-linear mapping φ (xi), SVM fits a linear separating hyper plane with the maximal margin in this higher dimensional space, with the penalty parameter of the error term 0>C . This non-linear mapping is implicitly defined by the kernel function )(x )(x >= x,(x<, jijiφ . Among
Development of K- Means Based SVM Regression (KSVMR) Technique
363

four basis kernel functions (linear, polynomial, radial basis function, sigmoid), RBF is the reasonable choice for our problem. Unlike the linear kernel, it can handle the case when the relation between class label and attributes are non-linear. Besides the number of hyper planes in RBF is fewer than that of linear kernel and hence the complexity of the model selection becomes fine. Furthermore RBF kernel has fewer numerical difficulties. In our problem the RBF kernel ( )( )22
ij /x- x-exp =xj)(xi, σφ is chosen while writing MATLAB code. The below function decides the class label of y.
(x)+bf(x)= wto (5) B.2. One against all approach
2a. Class I against other classes
2b. Class II against other classes
Ramakalyan Ayyagari, et al.
364
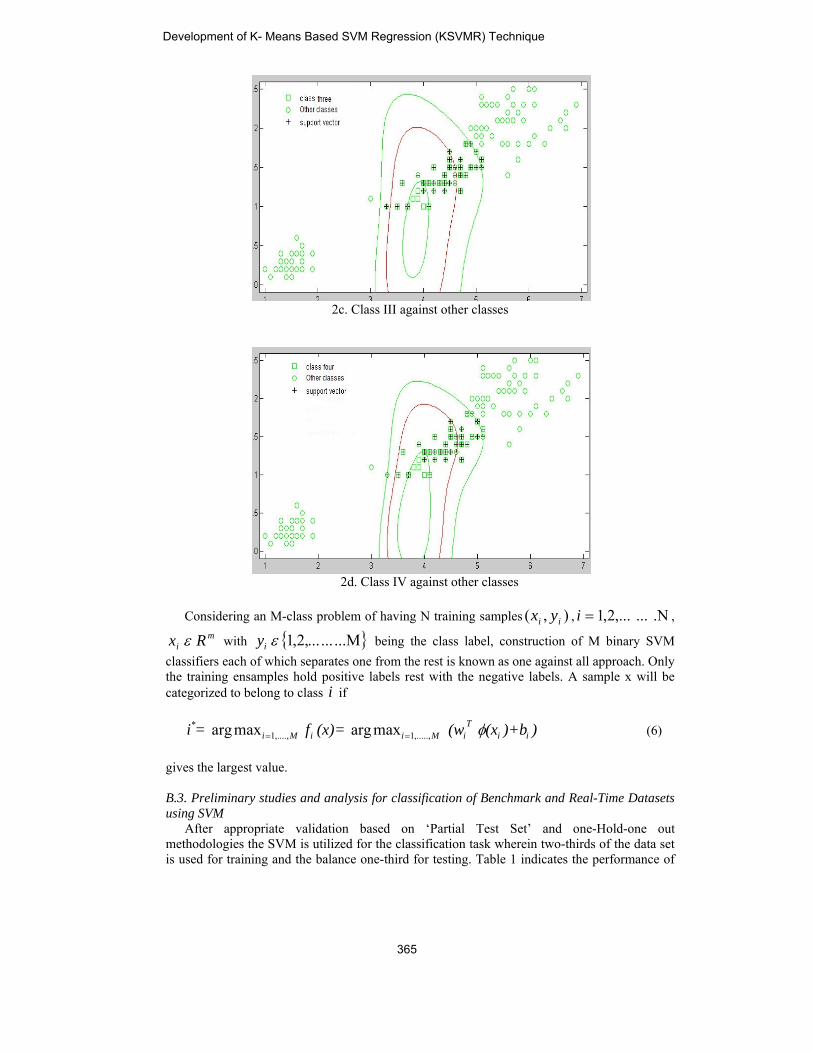
2c. Class III against other classes
2d. Class IV against other classes
Considering an M-class problem of having N training samples ),( ii yx , .N ... ,...2,1=i ,
mi Rx ε with ...M ... ...,2,1 εiy being the class label, construction of M binary SVM
classifiers each of which separates one from the rest is known as one against all approach. Only the training ensamples hold positive labels rest with the negative labels. A sample x will be categorized to belong to class i if
))+b(x (w(x)= f= i ii
TiMiiMi φ,.....,1,....,1
* maxarg maxarg == (6) gives the largest value. B.3. Preliminary studies and analysis for classification of Benchmark and Real-Time Datasets using SVM After appropriate validation based on ‘Partial Test Set’ and one-Hold-one out methodologies the SVM is utilized for the classification task wherein two-thirds of the data set is used for training and the balance one-third for testing. Table 1 indicates the performance of
Development of K- Means Based SVM Regression (KSVMR) Technique
365

SVM (in terms of number of classes, number of support vectors, number of attributes, and classification in percentage) for various benchmark and real time data base. Though the purpose of the paper is to design a hybrid technique (integrating-K-Means and SVM ), to verify the performance of the classification capability of SVM for real time and benchmark database, a generic program segment, which is explained in 3.2.4, has been developed utilizing MATLAB and three different data sets have been processed for various values of C &γ . Number of support vectors so generated, kernel function used and classification errors are furnished in Table1.To increase the efficiency of the generic programme, one generic SVM has been designed for various values of C and γ so as to obtain the maximum number of support vectors which in turn have been take up to training phase. The confusion matrix depicting the classification capacity of SVM for the Boiler flue gas data is furnished in Table 1.
Table 1. Validation of proposed technique with different bench mark data sets
Data Set No. of Classes
No. of Support Vectors
No. of Attributes
Kernel function
Classification error (%)
Iris plant data base 3 14 4 RBF 2 Bioinformatics [10 ] 8 49 14 Polynomial 7 Vehicle[28] 4 97 18 linear 6 CPT data for soil classification [20,21] 4 11 4 linear 2
QCM sensor data [35 ] 3 69 5 RBF 3 VOC database[33] 24 53 16 RBF 3 Boiler Flue Gas 4 21 5 RBF 2
B.4. Essential steps of the KSVMR algorithm 1. Transformation of data to the necessary format of SVM code 2. Scaling of data and finding cluster labels with cluster means using K-Means algorithm: 2.1. Randomly choose K classes ( value of K ) 2.2. Select first K of Xi - feature vector as initial models for the clusters. 2.3. Assigning each remaining Xi to nearest cluster to form K classes ( ie, Assign Xi to cluster cj( according to highest ordinate) with nearest prototype Wj⇒ Wj⇒ Xi - Wj*≤ Xi - Wj, for all j = 1,2,…..k. 2.4. For each cluster cj , update Wjto be the centroid of samples currently incj⇒ :
Wj = ∑ ( Xi /c j ) xi∈c j 2.5. Computing error : k ∈ = ∑ ∑ | xi -Wjx |2
j=1 xi ∈c j
2.6. If ∈ does not change, Cluster membership no longer changes – STOP Else, repeat (2.3-2.5)
3. Kernel function operates: ) exp(),( 2yxyxK −−= γ 4. Optimizing C and γ using grid search technique. 5. Use C and γ to train the data set. 6. Testing the efficiency of KSVMR.
Ramakalyan Ayyagari, et al.
366

Flow Chart for KSVMR – Training and Testing:
Testing Phase – KSVMR
Training Phase – KSVMR
B.5. Flue gas components classification and generation of support vectors The proposed SVM has been applied to multi class data sets obtained from analyzers to design a classifier which can distinguish one component of 1 2 5( , ,..., )f f fΔ Δ Δ from the other set and 5 features from the experimental data set were used. A scaling scheme was used for every vector by restricting all entries to be between 0 and 1 by calculating the score (x-Mean)/(Standard deviation), where x is the feature score in data set. For the 150 data set containing 5 classes of 30 each, where each class refers to frequency of one of the 5 gas components, RBF kernel is able to show 99% of instances correctly classified. The regularization parameter γ and standardization parameter σ of the RBF function have been chosen on trial and error basis. The optimum values of C and γ are usually achieved by trial and error basis for data sets of smaller dimension. The normalized form (of 5 dimensions) of BFG input data have been converted to 21 support vectors as shown in Table 1. The separating hyper planes for boiler flue gas database are depicted in the figure 2. The
Development of K- Means Based SVM Regression (KSVMR) Technique
367

corresponding confusion matrix, which shows the classification capability of BFG database using ‘One –against all’ approach, has also been furnished in Table 2
Table 2. Confusion Matrix:
4. Implementation of KSVMR System From the previous studies it is evident that estimation accuracy of KSVM regression are dependent on meta parameters, C, ε and Kernel parameters. The quality of the estimation is determined by the loss function called ε -intensive loss function proposed by Vapnik:
≤= w) x,f(-y if 0 ),(,( wxfyL ε ε
= ε−− ),( wxfy otherwise (10) The empirical risk being,
∑=
=n
1i 1)(
nwRemp )),(,( wxfyL iiε (11)
For measuring the deviation of training samples outside ε - intensive zone, we introduce (non-negative) slack variables Existing software implementation of KSVM regression performs linear regression by mapping the input vectors in the high dimensional feature space using ε intensive loss, but at
the same time reducing the model complexity by minimizing the 2w . On one hand the
parameter C determines the tradeoff between model complexity and ε -tolerance for optimization, on the other hand selection of a kernel function parameter is application and distribution dependent of the input training datasets. Thus it may be inferred that C and ε affects the model complexity in a divergent manner. Hence, to optimize these parameters to obtain targeted output with a justifiable and reasonable level of accuracy, KSVM-regression model has been proposed. Results, Observations and Analysis When the QCM sensor data [35] containing three gases Acetone, Ethanol and Trichloroethylene were processed with 5 attributes 1 2 5( , ,..., )f f fΔ Δ Δ through SVM, 69 support vectors were generated with 3% classification error. The optimum values of meta parameters C and γ have been got by grid search method. In this system, 5 inputs, frequency changes of the sensors and 3 outputs, individual concentrations of the introduced gases have
Ramakalyan Ayyagari, et al.
368

been used. The predictions of KSVM hybrid have been compared with ANN predictions for optimum kernel parameters and the optimum results, corresponding prediction errors are shown in Table3. As explained in section 3.2.5, after ascertaining the efficiency of KSVM in classifying Boiler flue gas data expressed as a 5 tuple extracted from afore said analyzers, this technique has been tested with BFG data also for various values of conflicting Meta parameters involved in both kSVM and it is observed from various experiments that this algorithm is convergent and provide consistent results. The predictions of Gas components of the BFG data by this technique that have been compared with a cross section of experimental data where the highest prediction errors are observed are displayed in the Table 4. Though percentage of prediction errors in NOx, are observed to be slightly above than that of the other gases due to their mass concentrations being extremely low, when compared to other gases, they are in the acceptable limits and this may be due to the presence of moistures. Further the precision accuracy has been maintained only up to third place of decimal. In all other experiments even when the data size exceeded 125, all the prediction errors in each of the Gas components has been observed to be below 5%. These results ascertain the efficiency of the proposed technique. Table 3. Performance comparison of ANN and KSVM regression for composition finding
of Gas mixtures: Data and table adapted from [34] with permission
Gases in a mixture(ppm) ANN Predictions (ppm)
ANN Predictions Error (%)
KSVM Predictions
(ppm)
KSVM-Prediction Error (%)
Acetone Ethanol TCE Gas1 Gas 2 Gas1 Gas2 Gas1 Gas 2 Gas1 Gas 2 - 500 550 590.16 562.22 12.4 7.3 525.6 570 5.1 3.63
500 1000 - 604.8 1037.15 20.1 3.7 525 1030 5 3 500 - 1000 598.60 1021.9 19.7 2.2 528 1027 5.6 2.7
- 500 2200 552.72 2219.8 10.5 0.9 530.2 2220 6.04 0.909 500 2500 - 518.26 2555.73 3.6 2.2 510 2530 2 1.2 500 - 2500 580.06 2623.80 16.0 4.9 530.8 2523 6.16 0.92
- 2000 550 2306.32 596.26 15.3 8.4 2021.6 567 1.08 3.09 2000 1000 - 2676.28 1307.98 33.8 30.8 2018.7 1021 0.94 2.1 2000 - 1000 2245.40 1009.16 12.3 0.9 2017.9 1027 0.89 2.7
- 2000 2200 2269.60 2213.80 13.5 0.6 2011.1 2228 0.55 1.27 2000 2500 - 2410.42 2655.66 20.5 6.2 2012.9 2523 0.65 0.92 2000 - 2500 2173.0 2519.40 8.6 0.8 2016.3 2520 0.81 0.8
- denotes the data for the gas under consideration is not taken up for acquisition and analysis for the specific case considered
Table 4. Predictions of Boiler flue gas components by SVMR hybrid Gases in a mixture(ppm) Prediction(ppm) Prediction Error(%)
O2 NOx Sox CO CO2 O2 NOx Sox CO CO2 O2 NOx Sox CO CO2
3.8 0.004 0.16 0.15 21.886 4.0 0.0045 0.167 0.158 22.1 5.2 12.5 4.375 5.33 0.97
2.4 0.003 0.15 0.16 23.287 2.6 0.0035 0.155 0.157 23.4 8.3 16.6 3.3 4.33 1.23
4.4 0.005 0.16 0.15 21.285 4.6 0.0055 0.164 0.154 21.4 4.5 10 2.5 2.6 0.54
3.6 0.003 0.15 0.15 22.097 3.8 0.0034 0.154 0.155 22.2 5.5 13.3 2.6 3.3 0.46
0 0.004 0.17 0.17 23.656 2.2 0.0046 0.178 0.178 23.9 10 15 4.7 4.7 1.03 3.4 0.003 0.16 0.16 24.277 3.6 0.0033 0.166 0.166 24.5 5.8 10 3.7 3.75 0.91 3.2 0.004 0.15 0.12 24.526 3.5 0.0044 0.155 0.127 24.8 9.3 10 3.3 5.8 1.17
4.8 0.005 0.16 0.15 20.885 5.1 0.0053 0.167 0.154 21.1 6.2 6 4.3 2.6 1.00
4.8 0.004 0.15 0.18 20.666 5.2 0.0045 0.154 0.186 20.9 8.3 12.5 2.6 3.33 1.11
Development of K- Means Based SVM Regression (KSVMR) Technique
369

10 fold cross validation technique has been adopted by dividing the training data set (70%) in to 10 equal parts and the results are observed to be consistent with the error lying well within the limits as predicted in table 4. 5. Conclusion KSVM regression has been designed as a hybrid technique to process the data obtained from gas sensors to perform both classification and estimation and it has been found that this hybrid works very well adjusting itself to various divergent issues such as “Stability – Plasticity dilemma”, Curse of dimensionality, Conflicting Meta parameters during hybridization and it has been found that SVM regression augurs well K-Means for any application problem that needs both the classification and estimation processes. This hybrid has been tested with two data sets obtained from two different applications and observed to possess the following salient features: Excellent gas components classification performances have been obtained by KSVM structures. Besides, SVM, though hybridized with K-Means, has provided consistent support vectors of small sizes keeping computational complexity under control. This structure has provided good estimation of gas components in both the applications, taken up for study. During the implementation of this hybrid it was not necessary for optimization of Meta parameters and hence this hybrid is flexible for adaptation. Despite the severe non linearity in the observed data due to complex absorption of gas components by different sensor - coating materials involved in this study and impurities of gases, this technique does not suffer out of over fitting problems which are common with several combinatorial structures in literature. Due to low computational complexity achieved by this hybrid, it can be considered for online operations and hardware implementations. However, this technique needs to be tested with very large data base of Boiler flue gas attributes. In this study, variation of data with respect to time has not been considered. When time parameters are also considered, issues will still be divergent for which a dynamic model needs to be designed. For addressing the stochastic variation of data, a Hidden Markov Model with a minimum distance classifier is found to be suitable, which is now ongoing. 6. Acknowledgement The authors of this paper wish to acknowledge and thank the Professors A.Ozmen, FeyzullahTemurtaz, Ali gulbag and RobiPolikar for their timely support and motivation by providing their data and sharing their knowledge. We thank the reviewers of our paper, whose comments helped us to improve the quality of this research paper. 7. Reference [1] S.Goka et al, “Fundamental study on Multi-mode Quartz crystal gas sensors”, IEEE
UltrasonicsSymposium, pp.489-492, 1999. [2] Stefan IvanovBoyadjiev et al, “WO3 thin film deposition on Quartz Crystal
Resonators for application in gas sensors”, Electronics Symposium 2007, pp. 121-124. [3] Toshifumi HOSOYA, et al, “Detection of hydrogen in ambient air using a coated
piezoelectric crystal”, Chemistry Letters, pp. 385-388,1984. [4] M.Vezzoli, et al “Exploratory data analysis for industrial safety application” Sensors
and Actuators. B Chemical, 131, pp. 100-109,2008. [5] Chia-Wen Kuo, et al “Cryptand/metal ion coated piezoelectric quartz crystal sensors
with artificial back propagation neural network analysis for nitrogen dioxide andcarbon monoxide”, Sensors and Actuators B, 106, pp 468-476,2005.
[6] E.Byvatov and G.Schneider, “Support Vector Machine applications in Bio-informatics”, Applied Bio informatics, Vol.2, pp. 67-77,2003.
Ramakalyan Ayyagari, et al.
370

[7] T.R.Golub,D.K.Slonim et al, “Lander, Molecular classification of cancer:class discovery and class prediction by gene expression monitoring”, Science, 286(5439), pp. 531-537,1999.
[8] M.A.Shipp,K.N.Ross et al, “Diffuse large B-cell lymphoma outcome prediction by gene expression profiling and supervised machine learning”, Nat Med,8(1), pp. 68-74,2002.
[9] S.L.Pomereroy et al, “Prediction of central nervous system embryonal tumor outcome based on gene expression”, Nature, 415(24), pp. 431-442, 2002.
[10] A. Bhattacharjee, et al, “Classification of human lung carcinomas by mRNAexpression profiling reveals distinct adeno carcinoma subclasses”, Proc.Natl.Acad.Sci.USA 98, pp. 13790-13795, 2001.
[11] Distante. C., Ancona N., Siciliano P, “Support vector machines for olfactory signals recognition”, Sensors and Actuators B, 88, pp.30-39, 2003.
[12] Liobet E, Brefmes J et al, “Wavelet Transform and Fuzzy ARTMAP Based patternRecognition for Fast Gas Identification Using a Micro–Hotplate Gas Sensor”, Sensors and Actuators B, Vol. 83, pp. 238-244, 370.
[13] Richard O.Duda et al, “Pattern Classification”, John Wiley and Sons, p.559, 2nd Ed., 2002.
[14] A. Sivakumar, K.Kannan, “A novel feature selection techniques for number classification problem using PNN”, Sensors and Actuators B: Chemical, 139,Issue 2,pp. 280-286,2009.
[15] D.F.Specht, ‘Probabilistic Neural Networks for classification, Mapping or Associative Memory ’, Proceedings, IEEE International conference on Neural Networks, 1, pp. 525- 532,June 1988.
[16] D.F.Specht, “Probabilistic Neural Networks”, Neural Networks,Vol. 3, pp.109-118,1990. [17] D.F.Specht, “Generation of polynomial discriminant functions for pattern recognition”,
IEEE Trans on Elec. Computers, Volume EC – 16, 1992, pp 308-319. [18] D.F.Specht and P.D. Shapiro, “Training speed Comparison of Probabilistic Neural
Networks with Back-probagation Networks”, Proceedings of the Int.Neural Network conference Vol.1, pp 440-443, Paris, France, July 1990.
[19] D.F.Specht, “A general regression neural network” IEEE Trans. Neural Network,2(6) 568 – 576 , 1991.
[20] Pradeep.U. Kurupetal, “Prediction of soil Composition from CPT data Using General Regression Neural Network” Journal of computing in civil Engineering, ASCE, 281- 289,2006.
[21] Tumay,M.T and Kebede.A(2003) PClass-CPT program, Version 3.0, Louisiana State University.,(http://www.coe.1su.edu/cpt/)
[22] Ali Gulbagetal, “Qualitative discrimination of the binary gas mixture using combinational structure of the probabilistic and multiplayer neural networks”, Sensors and Actuators B. Chemical 131, pp. 196-204, 2008.
[23] H.W.King, Piezoelectric sorption detector, Anal. Chem, 36 (1964), pp. 1735-1739. [24] FaiahurstMc, Raliman A.F.R, “Generalized approach to the recognition of structurally
similar handwritten characters using multiple expert classifiers”, IEEE Proc. Vision, Image signal Process, 144(1), pp.15-22, 1997.
[25] Breiman L, “Bagging predictions – Machine Learn”, 24, pp. 123-140. [26] DietterichT,Bakiri G, “Solving multiclass learning problems via error correctingoutput
codes” Journal of Artificial Intelligence , pp 263-286,1995. [27] Ho,T.K.Hull et al, “Decision combination in multiple classifier systems” IEEE Pattern
Anal.Machine Intelligence” 16(1), pp 66-75,1994. [28] Jordan M.I,Jacobs R.A,”Hierarchial mixture of experts and EM algorithm” Neural
Comput. 6, pp181-214,1994. [29] F. Specht et al, “Experience with Adaptive Probabilistic Neural Networks and Adaptive
General Regression Neural Networks”, IEEE Conference ,0-7803-1901-X/94,1203 – 1208, 1994
Development of K- Means Based SVM Regression (KSVMR) Technique
371

[30] M.NnetwMan
[31] V.N[32] C/L/
DepScie
[33] Robselecsyste
[34] T.MNetw
[35] A.OQCM450-
Associate2004. DudevelopmUniversityLaboratorpublishedconferencUniversityinvitationMathemaAutomaticountry alooking inparticularsignifican
Diagnosis
N. Islam et alwork” IAHS pnagement” pp.2
N.Vapnik, “Stat/Blake and C.Jartment
ence.http://wwwiPolikarPh.D, ction and increms”, Iowa sta
Masters and W.work”, IEEE In
Ozmen., et al, “M sensor array-454,200.
RaInsTirvadynofie(G
e Professor at turing 2007-201ment of Smart
y of Leicesteries (a CSIR, d numerous resces.He has aly, USA, Yan
n.He is a seniotics (SIAM, Uc Control and t the Internationto computatior interest are nt papers in inte
AnPh.BacBhaSys199Mainte
s of Power App
l, “Forecastingublication(no.2285-290, 2001tistical LearninJ.Merz, UCI r
of w.ics.uci.edu/~
Thesis, “Algremental learn
ate University AH.Land Jr., “Anternational SM“Finding the cy and an artific
amakalyan Astrumentation ruchirappalli, rious capacitie
ynamic non-coonlinear systemeld of Control
Govt. Of Indiathe Institute of11 he worked t Unmanned Aer, UK, Indian
Govt. of Indsearch articlesso visited the
ntai Universityor member of IUSA). He is Dynamic Opti
onal Federationonal problems the NP-hard ernational conf
nantharaman SD degree in Schelor’s degrearadhidasan Ustem from Re96.He was wianager-Installaterest include paratus.
g of river flow272) of the Sy
ng Theory”, Johepository of m
Informa~mlearn/MLRegorithms for ning with appAmes, Iowa,20A New TraininMC Conferenccomposition ofcial neural net
Ayyagari is &Control Enga premier ins
es. He holds a ooperative gamms.He has abo
Systems and a) Young Scif Mathematicaon the British
Air Vehicles n Institute of dia Laboratorys in prestigiouse Electrical E
y in China, anIEEE and mem
also the fouimization Socien of Automaticthat arise out oproblems andferences and jo
Sivakumar is SASTRA Univee in Electri
University, Indiegional Enginith Madras Fetion and MainArtificial Ne
w data with ymposium on
hn Wiley and Smachine learnination epository.html
enhancing pplications to g000. ng Method fore Proceedingsf gas mixtures twork”, Sensor
currently wgineering Natiotitution of thePhD from IIT
mes and robuut 20 years ofEngineering.Hientist award
al Sciences, Chh Council fun(UAVs) in cScience Ban
y) Bangalore, s peer-reviewe
Engineering Dnd Politecnico
mber of Societunder and curety (ACDOS) oc Control (IFACof algebra and
d randomized ournals.
presently pursversity, Thanjaical and Eleia in 1994 andneering Collegertilizers Limintenance. His ural Network
a general reg“Integrated W
Sons 1998. ng data bases
and
pattern separabgas sensing e
r General Regr,pp.1990-1995by a phthaloc
rs and Actuato
with the donal Institute oe Govt. of IndT Delhi where ust control fof research exp
He was a recipduring 2002,
hennai (India) nded UKIERI lose collabora
ngalore, Nationand IIT Bom
ed journals andDepartment of o di Milano ity for Industriarrently generaof India whichC). He is deeplgraphs in conalgorithms. H
suing his reseaavur, India. Hctronics Engid Master’s dege, Trichirappited, India for
specific areak, Control En
gression neuralWater Resource
at Californaia,Computer
bility, featurelectronic nose
ression Neural5,1997. cyanine-coatedors B, 115, pp
epartment ofof Technologydia, serving inhe worked on
or a class ofperience in thepient of DST’s, and visitingduring 2001 –project on the
ation with thenal Aerospacembay. He hasd international
Texas A&Min Italy, uponal and Appliedl secretary of
h represents thely interested in
ntrol theory. OfHe has several
arch leading toe obtained hisineering fromgree in Power
palli, India inr 13 years asas of researchngineering and
l e
, r
e e
l
d .
f y n n f e s g – e e e s l
M n d f e n f l
o s
m r n s h d
Ramakalyan Ayyagari, et al.
372

Krithivasan Kannan is a Professor in Department of Mathematics, SASTRA University, Thanjavur, India. He obtained his Bachelor and Master degree in Mathematics from University of Madras, India in 1980 and 1982 respectively. He also received his Bachelor and Master degrees of Education in Madurai Kamaraj University, India in 1984 and 1986 respectively. He obtained his M.Phil degree from Regional Engineering College, Thiruchirappalli, India in 1988. He was conferred Ph.D in Mathematics in the area of Computational
Fluid Dynamics by Alagappa University, Karaikudi, India in 2000. He has been in Academia for the past 30 years. His specific areas of research interest include Combinatorial Optimization, Machine Learning and Hypergraph based Image Processing in which he has published a variety of research articles in prestigious peer-reviewed journals. He is a member of international Mathematics Olympiad advisory board of AMITY University, New Delhi.
Development of K- Means Based SVM Regression (KSVMR) Technique
373